Ancient eruptions of η Carinae: A tale written in proper ... · Ancient eruptions of η Carinae: A...
14
arXiv:1609.00362v1 [astro-ph.SR] 1 Sep 2016 MNRAS 000, 1–14 (2016) Preprint 2 September 2016 Compiled using MNRAS L A T E X style file v3.0 Ancient eruptions of η Carinae: A tale written in proper motions Megan M. Kiminki, 1 ⋆ Megan Reiter 2 and Nathan Smith 1 1 Steward Observatory, University of Arizona, 933 N. Cherry Avenue, Tucson, AZ 85721, USA 2 Department of Astronomy, University of Michigan, 311 West Hall, 1085 S. University Avenue, Ann Arbor, MI 48109, USA Accepted 2016 August 9. Received 2016 August 8; in original form 2016 June 6. ABSTRACT We analyze eight epochs of Hubble Space Telescope Hα+[N ii] imaging of η Carinae’s outer ejecta. Proper motions of nearly 800 knots reveal that the detected ejecta are divided into three apparent age groups, dating to around 1250 A.D., to around 1550 A.D., and to during or shortly before the Great Eruption of the 1840s. Ejecta from these groups reside in different locations and provide a firm constraint that η Car experienced multiple major eruptions prior to the 19 th century. The 1250 and 1550 events did not share the same axisymmetry as the Homunculus; the 1250 event was particularly asymmetric, even one-sided. In addition, the ejecta in the S ridge, which have been associated with the Great Eruption, appear to predate the ejection of the Homunculus by several decades. We detect essentially ballistic expansion across multiple epochs. We find no evidence for large-scale deceleration of the observed knots that could power the soft X-ray shell by plowing into surrounding material, suggesting that the observed X-rays arise instead from fast, rarefied ejecta from the 1840s overtaking the older dense knots. Early deceleration and subsequent coasting cannot explain the origin of the older outer ejecta—significant episodic mass loss prior to the 19 th century is required. The timescale and geometry of the past eruptions provide important constraints for any theoret- ical physical mechanisms driving η Car’s behavior. Non-repeating mechanisms such as the merger of a close binary in a triple system would require additional complexities to explain the observations. Key words: circumstellar matter – stars: individual: η Carinae – stars: mass-loss 1 INTRODUCTION One of the most remarkable stars in our galaxy, η Carinae has been puzzling astronomers for over 150 years. In the mid- nineteenth century, it became increasingly variable, then peaked temporarily as the second brightest star in the sky (Innes 1903; Davidson & Humphreys 1997; Frew 2004; Smith & Frew 2011) before slowly fading over more than a decade. During this Great Eruption, η Car ejected an estimated 10–15 M ⊙ into the well- known bipolar Homunculus nebula (Smith et al. 2003). A second, Lesser Eruption followed in 1890 (Innes 1903; Humphreys et al. 1999; Frew 2004), but only ejected ∼ 0.1M ⊙ (Ishibashi et al. 2003; Smith 2005). η Car belongs to a class of stars known as luminous blue vari- ables (LBVs, Humphreys & Davidson 1994), very massive, unsta- ble, post-main-sequence stars characterized by luminous mass-loss events. Even among LBVs, η Car is unusual and its parameters are extreme. In its current quiescent state, η Car is substantially more luminous than most other known LBVs (e.g., van Genderen 2001; Smith & Tombleson 2015). It is one of only two Galactic LBVs that has been observed in a giant eruption. The other is P Cygni, whose largest eruption involved significantly less energy and mass loss, ⋆ E-mail: [email protected] similar to η Car’s Lesser Eruption (Smith & Hartigan 2006). More- over, η Car has a massive binary companion in an eccentric 5.5-year orbit (Damineli 1996; Damineli et al. 1997, 2000; Corcoran et al. 2001; Whitelock et al. 2004), and is located in the rich cluster Trumpler 16, home to dozens of O-type stars (Smith 2006a). In contrast, most LBVs are relatively isolated and lack O-type neigh- bors (Smith & Tombleson 2015). The mechanism of η Car’s Great Eruption—which re- leased roughly 10 50 ergs of kinetic energy (Smith et al. 2003; Smith 2008)—remains a mystery. Many theories treat it as part of single-star evolution, invoking super-Eddington radiation-driven winds (Davidson 1971; Maeder 1983; de Jager 1984; Lamers & Fitzpatrick 1988; Stothers & Chin 1993; Glatzel & Kiriakidis 1993; Glatzel 1994; Humphreys & Davidson 1994; Shaviv 2000; Owocki et al. 2004). However, the source of the increased bolometric luminosity in these scenarios is unclear. Alternatively, the eccentric orbit of η Car’s companion has been taken to imply that the Great Eruption was influenced by periastron interactions between the two binary components. Based on nineteenth-century observers’ estimates of the primary star’s color and brightness, its radius must have been much larger than at present, large enough that its companion would significantly interact or even physically collide (Iben 1999; Smith 2011). A speculative idea is that the collision mixed fresh nuclear fuel c 2016 The Authors
Transcript of Ancient eruptions of η Carinae: A tale written in proper ... · Ancient eruptions of η Carinae: A...
arX
iv:1
609.
0036
2v1
[ast
ro-p
h.S
R]
1 S
ep 2
016
MNRAS 000, 1–14 (2016) Preprint 2 September 2016 Compiled using MNRAS LATEX style file v3.0
Ancient eruptions of η Carinae: A tale written in proper motions
Megan M. Kiminki,1⋆ Megan Reiter2 and Nathan Smith11Steward Observatory, University of Arizona, 933 N. Cherry Avenue, Tucson, AZ 85721, USA2Department of Astronomy, University of Michigan, 311 West Hall, 1085 S. University Avenue, Ann Arbor, MI 48109, USA
Accepted 2016 August 9. Received 2016 August 8; in original form 2016 June 6.
ABSTRACTWe analyze eight epochs ofHubble Space Telescope Hα+[N ii] imaging ofη Carinae’s outerejecta. Proper motions of nearly 800 knots reveal that the detected ejecta are divided intothree apparent age groups, dating to around 1250 A.D., to around 1550 A.D., and to duringor shortly before the Great Eruption of the 1840s. Ejecta from these groups reside in differentlocations and provide a firm constraint thatη Car experienced multiple major eruptions priorto the 19th century. The 1250 and 1550 events did not share the same axisymmetry as theHomunculus; the 1250 event was particularly asymmetric, even one-sided. In addition, theejecta in the S ridge, which have been associated with the Great Eruption, appear to predatethe ejection of the Homunculus by several decades. We detectessentially ballistic expansionacross multiple epochs. We find no evidence for large-scale deceleration of the observed knotsthat could power the soft X-ray shell by plowing into surrounding material, suggesting thatthe observed X-rays arise instead from fast, rarefied ejectafrom the 1840s overtaking theolder dense knots. Early deceleration and subsequent coasting cannot explain the origin of theolder outer ejecta—significant episodic mass loss prior to the 19th century is required. Thetimescale and geometry of the past eruptions provide important constraints for any theoret-ical physical mechanisms drivingη Car’s behavior. Non-repeating mechanisms such as themerger of a close binary in a triple system would require additional complexities to explainthe observations.
Key words: circumstellar matter – stars: individual:η Carinae – stars: mass-loss
1 INTRODUCTION
One of the most remarkable stars in our galaxy,η Carinaehas been puzzling astronomers for over 150 years. In the mid-nineteenth century, it became increasingly variable, thenpeakedtemporarily as the second brightest star in the sky (Innes 1903;Davidson & Humphreys 1997; Frew 2004; Smith & Frew 2011)before slowly fading over more than a decade. During this GreatEruption, η Car ejected an estimated 10–15 M⊙ into the well-known bipolar Homunculus nebula (Smith et al. 2003). A second,Lesser Eruption followed in 1890 (Innes 1903; Humphreys et al.1999; Frew 2004), but only ejected∼ 0.1 M⊙ (Ishibashi et al. 2003;Smith 2005).η Car belongs to a class of stars known as luminous blue vari-
ables (LBVs,Humphreys & Davidson 1994), very massive, unsta-ble, post-main-sequence stars characterized by luminous mass-lossevents. Even among LBVs,η Car is unusual and its parameters areextreme. In its current quiescent state,η Car is substantially moreluminous than most other known LBVs (e.g.,van Genderen 2001;Smith & Tombleson 2015). It is one of only two Galactic LBVs thathas been observed in a giant eruption. The other is P Cygni, whoselargest eruption involved significantly less energy and mass loss,
⋆ E-mail: [email protected]
similar toη Car’s Lesser Eruption (Smith & Hartigan 2006). More-over,ηCar has a massive binary companion in an eccentric 5.5-yearorbit (Damineli 1996; Damineli et al. 1997, 2000; Corcoran et al.2001; Whitelock et al. 2004), and is located in the rich clusterTrumpler 16, home to dozens of O-type stars (Smith 2006a). Incontrast, most LBVs are relatively isolated and lack O-typeneigh-bors (Smith & Tombleson 2015).
The mechanism ofη Car’s Great Eruption—which re-leased roughly 1050 ergs of kinetic energy (Smith et al. 2003;Smith 2008)—remains a mystery. Many theories treat itas part of single-star evolution, invoking super-Eddingtonradiation-driven winds (Davidson 1971; Maeder 1983; de Jager1984; Lamers & Fitzpatrick 1988; Stothers & Chin 1993;Glatzel & Kiriakidis 1993; Glatzel 1994; Humphreys & Davidson1994; Shaviv 2000; Owocki et al. 2004). However, the sourceof the increased bolometric luminosity in these scenarios isunclear. Alternatively, the eccentric orbit ofη Car’s companionhas been taken to imply that the Great Eruption was influencedbyperiastron interactions between the two binary components. Basedon nineteenth-century observers’ estimates of the primarystar’scolor and brightness, its radius must have been much larger thanat present, large enough that its companion would significantlyinteract or even physically collide (Iben 1999; Smith 2011). Aspeculative idea is that the collision mixed fresh nuclear fuel
c© 2016 The Authors
2 M. M. Kiminki et al.
to greater depths, causing a sudden burst of increased nuclearburning (Smith 2011). It has also been proposed that periastrontidal interactions spun up the primary to unstable rates, leading to aburst of mass loss (Cassinelli 1999), or that the Great Eruption wasfueled by accretion from the primary onto its companion (Soker2007; Kashi & Soker 2010). Still other theories postulate a hier-archical triple system, in which the close inner pair eithermerged(Gallagher 1989; Iben 1999; Morris & Podsiadlowski 2009;Podsiadlowski 2010; Portegies Zwart & van den Heuvel 2016)or underwent a dynamical exchange with the outer companion(Livio & Pringle 1998).
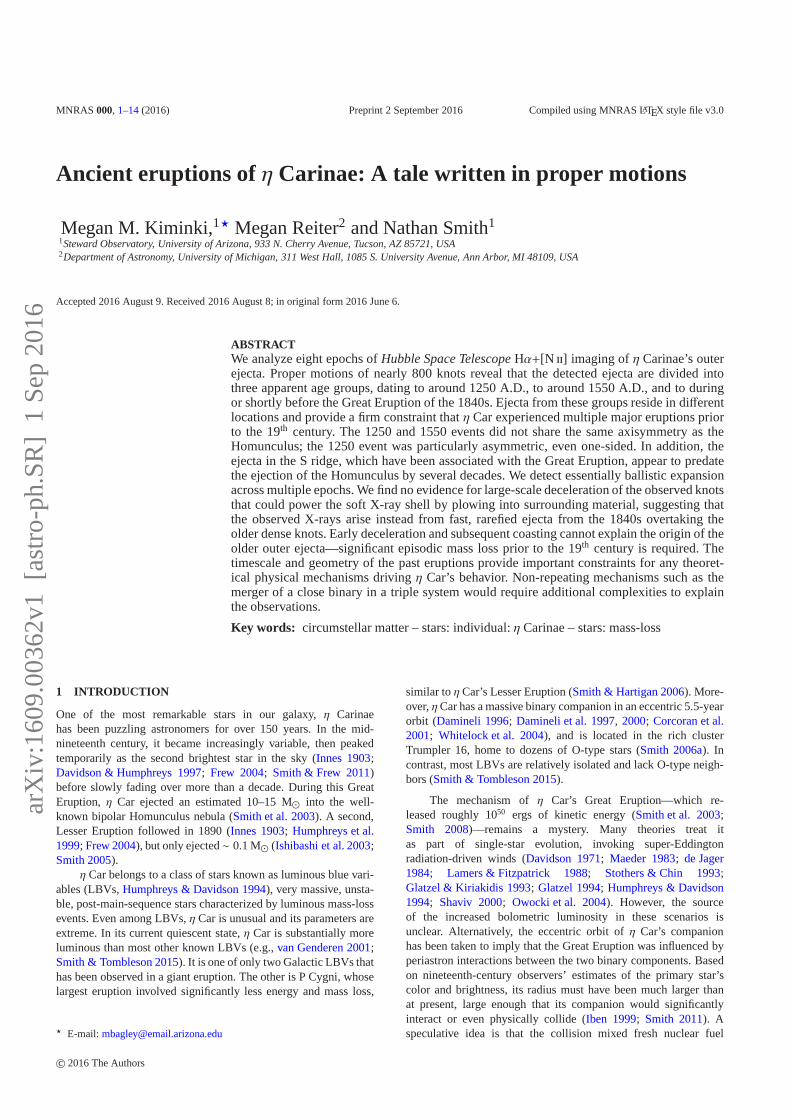
Models of the driving cause of the Great Eruption mustalso incorporate the outer ejecta, a collection of irregular con-densations found out to nearly half a parsec outside the Ho-munculus (Thackeray 1950; Walborn 1976; Meaburn et al. 1996;Smith & Morse 2004; Weis 2012). These outer ejecta (Figure1)are highly nitrogen-rich, suggesting a substantial degreeof CNOprocessing (Davidson et al. 1986; Smith & Morse 2004). Theycontain a minimum mass of 2–4 M⊙ (Weis 2012), with dustobservations suggesting a much larger total mass (Gomez et al.2010). The various models for the Great Eruption produce dif-ferent explanations for the outer ejecta. The merger model ofPortegies Zwart & van den Heuvel(2016), for instance, predictsthat the outer ejecta were formed after the formation of the Ho-munculus.
The proper motions of the outer ejecta provide concreteconstraints onη Car’s mass-loss history. The bright S conden-sation and the “jet”-shaped N bow (see Figure1) have mo-tions consistent with having been ejected during the Great Erup-tion (Walborn et al. 1978; Ebbets et al. 1993; Currie et al. 1996;Morse et al. 2001). Some results have suggested, however, that theextended S ridge is up to one hundred years older (Walborn et al.1978; Morse et al. 2001). The age of the E condensations is evenless clear:Walborn et al.(1978) found transverse velocities of300–400 km s−1, indicating ejection dates in the mid-1400s, butWalborn & Blanco(1988) determined ten years later that the samefeatures had slowed dramatically, suggesting they were from theGreat Eruption after all. While the motions of the outer condensa-tions have hinted at prior mass-loss events, a single ejection datearound the time of the Great Eruption could not be ruled out.
In this paper, we measure the proper motions ofη Car’s outerejecta to unprecedented accuracy, using 16 different baselines over21 years ofHubble Space Telescope (HST) data. The depth andresolution of theHST images allow us to re-evaluate the origins ofthe N, E, and S features, and, for the first time, measure motionsof the fainter NNE, NW, and SE condensations. We find no evi-dence of widespread deceleration, and show that while some of theouter ejecta come from the Great Eruption (or the lead-up to it),many features require at least one prior mass-loss event centuriesearlier. Our data, image registration, and approach to measuringproper motions are described in Section2; the results are presentedin Section3. We discuss the implications of our results on modelsof η Car in Section4 and conclude with a summary in Section5.
2 OBSERVATIONS AND ANALYSIS
2.1 HST ACS
We obtained new Hα+[N ii] images ofη Car and the surroundingTr 16 cluster on 2014 Aug 4, using the Wide Field Channel (WFC)of the Advanced Camera for Surveys (ACS) onHST (program ID
Figure 1. HST WFPC2 image ofη Car in the F658N filter, which cap-tures intrinsic and scattered [Nii] λ6584 emission along with redshifted Hαemission (Morse 1999; Morse et al. 2001). Prominent features are labeledaccording to the convention ofWalborn(1976) andWeis(2012).
13390; see Table1). These observations were designed to repli-cate our observations of 2005 Jul 18 (Smith et al. 2010) as closelyas possible, in pointing and position angle, in order to minimizeposition-dependent uncertainties when measuring proper motions.The Homunculus and central star are heavily saturated in these ex-posures, which were each 500–520 s long. In both epochs, obser-vations were made as a series of 205× 400 arcsec2 “footprints,”each consisting of three pairs ofCR-SPLIT dithers in a linear off-set pattern designed to fill in the ACS chip gaps.η Car and its outerejecta were observed in a single footprint; the rest make up amosiacof Tr 16 and neighboring Tr 14 (seeSmith et al. 2010). All datawere processed by the standardHST ACS pipeline, which doesbias subtraction and flat-fielding and corrects for charge transferefficiency (CTE) to produce an image with the designation “flc.”The pipeline also produces a “drc” image that has been addition-ally corrected for geometric distortion and dither-combined via As-troDrizzle.
We transformed both epochs of ACS data to a com-mon distortion-free reference frame via a modified ver-sion of the method used inAnderson et al. (2008a,b),Anderson & van der Marel(2010), and Sohn et al. (2012, seealsoReiter et al. 2015a,b). An initial reference frame, aligned withthey axis pointing north and with a pixel scale of 50 mas pixel−1,was constructed using the astrometric solutions in the headers ofthedrc images to match stars that appear in overlapping images.However, the resampling performed by AstroDrizzle makesthe drc images unsuitable for direct high-accuracy positionalmeasurements. Instead, we performed point spread function(PSF) fitting on the the undrizzledflc images using the programimg2xym_WFC.09x10 (Anderson & King 2006), which uses alibrary of spatially dependent effective PSFs. We then appliedthe geometric distortion corrections ofAnderson(2006) to themeasured stellar positions.
MNRAS 000, 1–14 (2016)
Ancient eruptions of η Car 3
Table 1. HST data log.
Instrument Camera Date Filter Exp. Time (s) Program ID
WFPC2 WF3 1993 Dec 31 F658N 2× 200 5188WFPC2 WF3 1997 Jul 11 F658N 2× 200 7253WFPC2 WF3 1999 Jun 12 F658N 2× 200 8178WFPC2 WF3 2001 Jun 4 F658N 2× 200 9226WFPC2 WF3 2003 Aug 8 F658N 2× 100 9775WFPC2 WF3 2008 Sept 6 F658N 2× 100 11500
ACS WFC 2005 Jul 18 F658Na 2 × 500 10241ACS WFC 2014 Aug 4 F658Na 2 × 520 13390
aNote that the bandpass of the ACS 658N filter is different from that of the WFPC2 filter of the same name (see discussion in Section2.2).
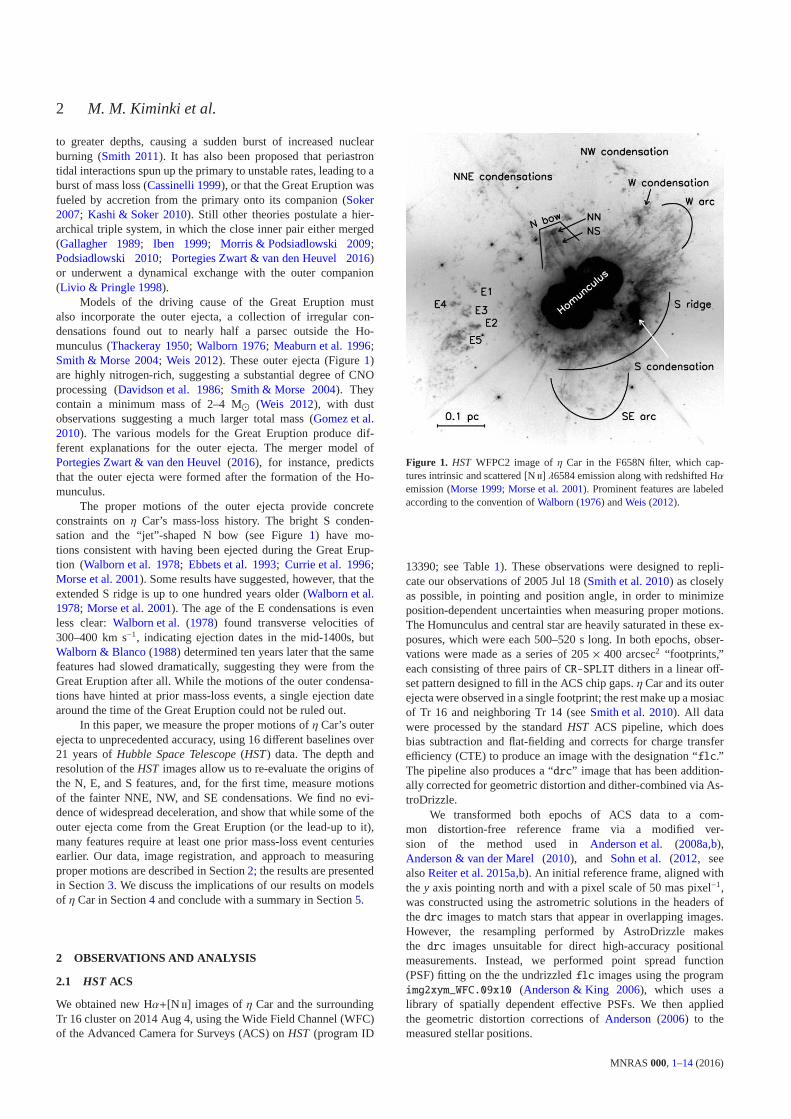
Figure 2. (a) Difference images showing the outward motion ofη Car’s ejecta over the 9-year baseline between ACS images. Dark patches are where thevarious condensations were in 2005; bright patches are places into which that material had moved by 2014. The central image is the same one shown in Figure1 and is included to orient the reader. (b) Same as (a) but for the 7-year baseline between the WFPC2 1993 and 2001 images. TheW and NW condensationsare not shown in the ACS (left) and WFPC2 (right) panels, respectively, because they are contaminated by bleeding from the saturated Homunculus in therelevant epochs. Animated GIFs showing the motion of each feature across all 8 epochs are available in the online supplementary material.
Next, we iteratively mapped the stellar positions from theflcimages to the reference frame by:
(i) identifying the high signal-to-noise stars (typicallyseveralhundred per image) in common between eachflc image and thereference frame;
(ii) computing the six-dimensional linear transformationfromthe distortion-corrected positions of theflc images to the referenceframe; and
(iii) replacing each existing reference-frame stellar positionwith the average of that star’s transformed, distortion-correctedflcpositions.
After three iterations, the internal accuracy of the reference framewas< 0.02 pixels (1 mas, or 1.2 km s−1 over this 9-year baseline atthe distance ofη Car) across a single footprint.
Using the final linear transformations determined by this pro-
cess, we resampled theflc images from each epoch into thereference frame using the algorithm described inAnderson et al.(2008a), scaling each image to a total exposure time of 500 s. Theend result was a single stacked image at each epoch for each ob-served footprint. With both epochs of data on the same referenceframe, the positions of ejecta features in the stacked images couldbe directly compared. Figure2 presents difference images (stackedimage from 2014 minus stacked image from 2005) for named re-gions of interest inη Car’s outer ejecta. In these images, materialhas moved from the dark patches into the corresponding bright ar-eas. It is immediately qualitatively apparent that some features havegreater transverse velocities than others; the N bow, for instance,is rapidly overtaking the small feature to its immediate northwest.Notably, there are no pronounced changes in condensation mor-phology or brightness from 2005 to 2014.
The proper motions of well-defined knots in the ejecta around
MNRAS 000, 1–14 (2016)
4 M. M. Kiminki et al.
Table 2. Baselines used for proper motion measurements.
Baseline Instrument ∆t # Features Medianσ(years) (km s−1)
1993–1997 WFPC2 3.524068 694 8.51993–1999 WFPC2 5.443602 704 7.01993–2001 WFPC2 7.422813 712 5.41993–2003 WFPC2 9.599420 714 4.81993–2008 WFPC2 14.680967 698 3.91997–1999 WFPC2 1.919534 703 14.31997–2001 WFPC2 3.898745 742 7.71997–2003 WFPC2 6.075352 713 6.31997–2008 WFPC2 11.156898 686 4.61999–2001 WFPC2 1.979211 716 12.11999–2003 WFPC2 4.155818 684 8.01999–2008 WFPC2 9.237365 679 4.62001–2003 WFPC2 2.176607 633 13.02001–2008 WFPC2 7.258153 666 5.52003–2008 WFPC2 5.081546 648 7.6
2005–2014 ACS 9.046256 620 2.7
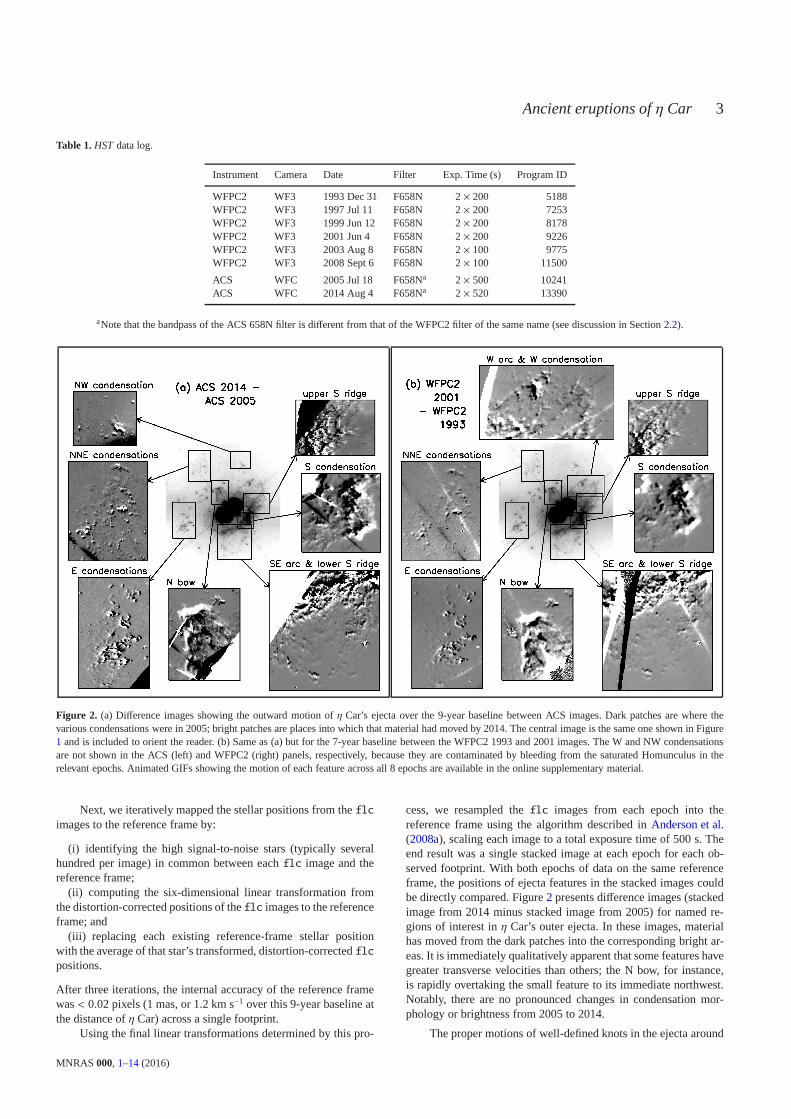
η Car were measured in the stacked images. “Well-defined” fea-tures are those that are (1) not contaminated by or confused withthe saturated Homunculus or diffraction spikes in either epoch and(2) sufficiently isolated for a defined knot or feature to be identified.A total of 620 such features were identified in the ACS images.To measure the proper motion of each, we subtracted a median-filtered image (filtered using a kernal size of 12 pixels) in order tosuppress the local diffuse Hα background. We then extracted theknot using a box size optimized for that feature; Figure3 illustratesthe boxes used for the features in and around the E condensations.We used our implementation of the modified cross-correlationtechnique developed byCurrie et al.(1996), Hartigan et al.(2001),andMorse et al.(2001, see alsoReiter & Smith 2014; Reiter et al.2015a,b) to determine the difference in position between the twoepochs. In brief, the box containing the feature of interestwas com-pared to the second image and an array was generated containingthe total of the square of the difference between two images for eachshift. The minimum of this array corresponds to the shift that bestmatches the two images. Angular displacements were converted tokm s−1 assuming a distance of 2.3 kpc (Smith 2006b). To estimatethe uncertainty on the offset, we repeated the procedure using avariety of box sizes. The median proper motion uncertainty for fea-tures measured in the ACS images is 2.7 km s−1.
2.2 HST WFPC2
To supplement our proper motion measurements from the 2005–2014 ACS baseline, we searched theHST archive for additionaldeep images ofη Car taken with an F658N filter. Six epochs ofobservations from the Wide-Field Planetary Camera 2 (WFPC2)met our requirements: the images had to be deep enough for theouter ejecta to be visible, andη Car had to be centered on one ofthe Wide Field chips (the field of view of the Planetary Camerachip is too small). The dates and program IDs for these data aregiven in Table1. We retrieved the longest exposures available ateach epoch: a pair of 200-s exposures from each of 1993, 1997,1999, and 2001, and a pair of 100-s exposures from each of 2003and 2008.η Car itself and much of the Homunculus are saturatedin these images, although the bleeding is much less extensive thanin the ACS images, which have both longer exposure times and
Figure 3. Close-up of the region around the E condensations in the 2005ACS F658N image, showing the boxes used to measure proper motions viamodified cross-correlation. The saturated strip in the lower right is bleedingfrom the saturated Homunculus.
a wider filter bandpass (see below). All of the data had been re-processed by the final version of theHST WFPC2 pipeline, whichproduces images designated “c0m” that have been bias-subtracted,dark-corrected, and flat-fielded.
Note that there are important differences between the WFPC2F658N filter and the ACS filter of the same name. The former cov-ers a narrow wavelength range (FWHM 38 Å) roughly centeredon [N ii]λ6584, capturing emission from that line with Dopplershifts from approximately -615 to+1130 km s−1. The latter isbroader (FWHM 72 Å), capturing [Nii] emission with radial ve-locities up to±1600 km s−1 as well as significant Hα emission.Although most of the same ejecta features seen in the ACS imagesare identifiable in the WFPC2 images, there is no way to guaran-tee that the knot shapes are unaffected by the differences in filterbandpass. Consequently, we do not measure proper motions di-rectly between WFPC2 and ACS images. We use only WFPC2–WFPC2 and ACS–ACS baselines. In addition, the fastest knownejecta are Doppler-shifted out of one or both filters and are notdetected. The WFPC2 F658N filter would not, for instance, pickup the -875 km s−1 blueshifted emission just outside the southeastlobe of the Homunculus (Currie et al. 2002), even if the Homuncu-lus were not saturated in our images. Both filters miss the -3200 km
MNRAS 000, 1–14 (2016)

Ancient eruptions of η Car 5
s−1 blueshifted ejecta detected further out bySmith(2008). Our im-ages thus exclude the fastest-moving material from the Great Erup-tion and therefore do not exclude the possibility of additional recentmass-loss episodes. We note, however, that since few of the ejectaseen in the ACS images drop out in the WFPC2 images (and thosethat do are relatively faint and not detected in the shortestexpo-sures), few to none of the dense knots measured in our images haveradial velocities of±1000–1500 km s−1.
We took the same approach to aligning and stacking theWFPC2 data as we did with the ACS images. We used a modi-fied version of theimg2xym program (Anderson & King 2006) tomeasure stellar positions in thec0m images, employing a library ofspatially dependent effective WFPC2 PSFs fromAnderson & King(2000). The measured positions were then corrected for the 34th-row anomaly (Anderson & King 1999) and for geometric distor-tion (Anderson & King 2000). We identified 6–10 isolated, low-proper-motion stars in common between each WFPC2 image andthe ACS-based reference frame, and used those stars to derive a six-parameter linear transformation between each distortion-correctedWFPC2 frame and the reference frame. Unlike with the ACS data,we did not iterate on the process: we took the ACS-based referenceframe as final. The internal accuracy of the alignment and stack-ing procedure is< 0.06 reference-frame pixels (3 mas) for the firstfour epochs. The shorter, lower signal-to-noise 2003 and 2008 ex-posures had greater positional uncertainties of up to 0.2 referenceframe pixels (10 mas).
Using the calculated transformations, the WFPC2c0m imageswere resampled and stacked into a single image at each epoch,aligned with the ACS-based reference frame. Thec0m images,which have a plate scale of 99.6 mas pixel−1, were oversampledduring stacking so that the output image matched the 50-mas pix-els of the ACS images. An example of the results is shown in theright panel of Figure2, which shows difference images for the ma-jor named regions ofη Car’s outer ejecta for the 1993–2001 base-line. Although the resolution is somewhat lower compared totheACS images, much detail is still apparent. Animated GIFs of eachregion, made from all eight epochs of aligned data, are available inthe online supplementary material.
The proper motions of the features identified in the ACSimages were measured in the WFPC2 images, using the modi-fied cross-correlation technique described in Section2.1, for everypossible baseline among the six epochs (a total of 15 baselines).Some features were contaminated by diffraction spikes or satura-tion bleeds in some epochs; proper motions for these features weremeasured using only the epochs in which they were not contam-inated. The baselines, number of features measured, and medianproper motion uncertainties for each baseline are given in Table2. The median proper motion uncertainties range from 3.9 to 14.3km s−1, and the magnitude of the uncertainty is highly negativelycorrelated with the length of the baseline (i.e., shorter baselinesproduce greater uncertainties). In the areas blocked by saturationbleeding in the ACS images, we used the 1993–2001 baseline (thelongest baseline with 200-s exposures) to identify additional fea-tures which were then measured across the other WFPC2 baselineswhere possible. A small number of features in a gap that was satu-rated in 2001 are identified in the 1993–2003 baseline instead, thenmeasured across other baselines where possible. In total, we mea-sure the proper motions of 792 individual features in the ejecta ofη Car. Each feature is measured in 1–16 baselines (including the2005–2014 ACS baseline); on average, a feature is measured in 14baselines.
2.3 Position of the central source
Owing to the heavy saturation of the Homunculus, we were un-able to measure the position ofη Car itself in any of our stackedimages. Instead, we measure the centroid of the central starin anF631N WFPC2 Planetary Camera image fromMorse et al.(1998).The centroid positions of five surrounding stars in this image wereused to derive a linear transformation to our reference frame. Weestimate that this transformation is accurate to∼ 0.2 reference-frame pixels. Added in quadrature with the±0.5-pixel uncertaintiesin absolute knot positions, this means that the overall uncertainty ina knot’s distance fromη Car is∼0.55 pixels (27 mas, or 60 A.U.at the distance ofη Car). For a knot moving at 300 km s−1, thistranslates to an uncertainty in its age of±0.9 years.
3 RESULTS
3.1 HST proper motions over two decades
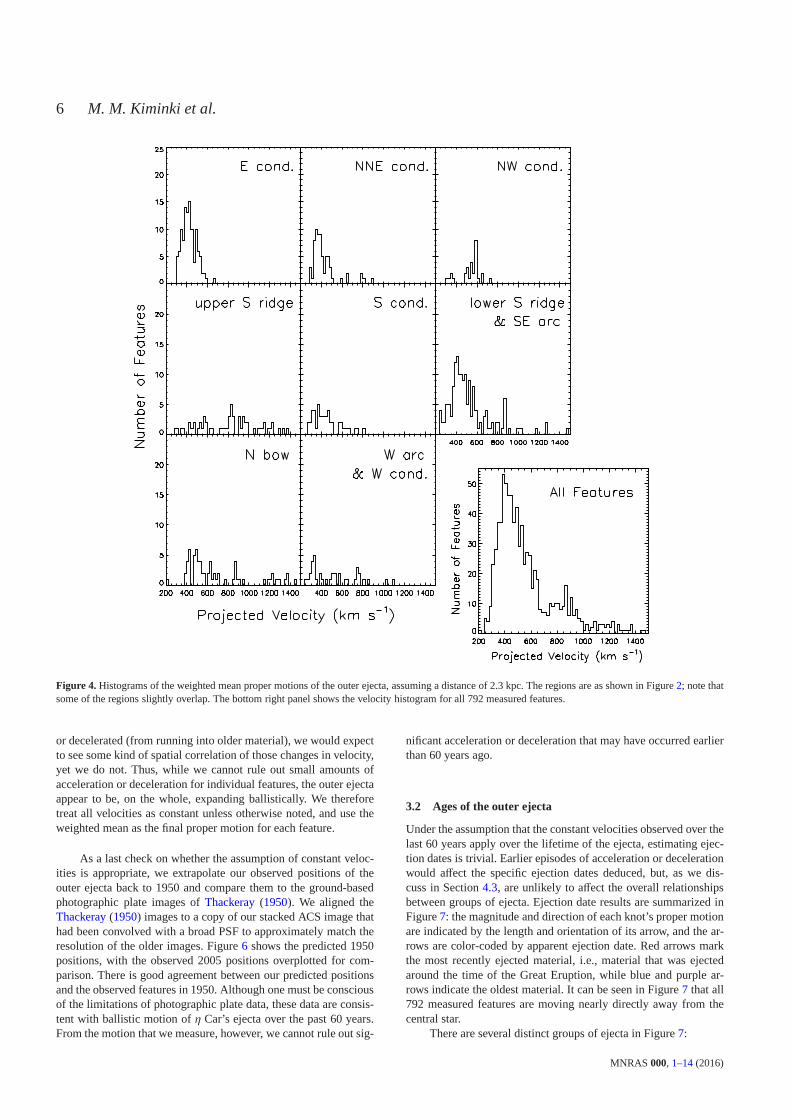
Figure 4 presents our results in aggregate: a histogram of theweighted mean proper motions of all measured features, along withproper motion histograms for the ejecta in each of the regions high-lighted in Figure2. The transverse velocities ofη Car’s outer ejectarange from 219 km s−1 to 1462 km s−1, with a broad peak at 300–600 km s−1 and a secondary peak at 750–900 km s−1. The high-est proper motions are found in the N bow, the S ridge, and theparts of the W arc that overlap with the upper S ridge. The pres-ence and location of speeds upward of 1000 km s−1 agrees withpast observations of the S ridge and N bow (Walborn et al. 1978;Walborn & Blanco 1988; Ebbets et al. 1993; Morse et al. 2001).The mix of speeds seen in the lower S ridge is also consistent withthe results ofMorse et al.(2001).
Our results for the E condensations (no high-proper-motionfeatures; mean proper motion∼ 400 km s−1) agree solidly withthe results ofWalborn et al.(1978), who used photographic plateimages from 1950 to 1975. However, the observed motion in ourHST images disagrees strongly with the deceleration hypothe-sis of Walborn & Blanco(1988), who added data from 1985 andfound that the E condensations had dramatically slowed over10years. TheWalborn & Blanco(1988) deceleration hypothesis pre-dicts that the E features would have reached zero velocity bytheend of the twentieth century, a hypothesis that our data definitivelyexclude.
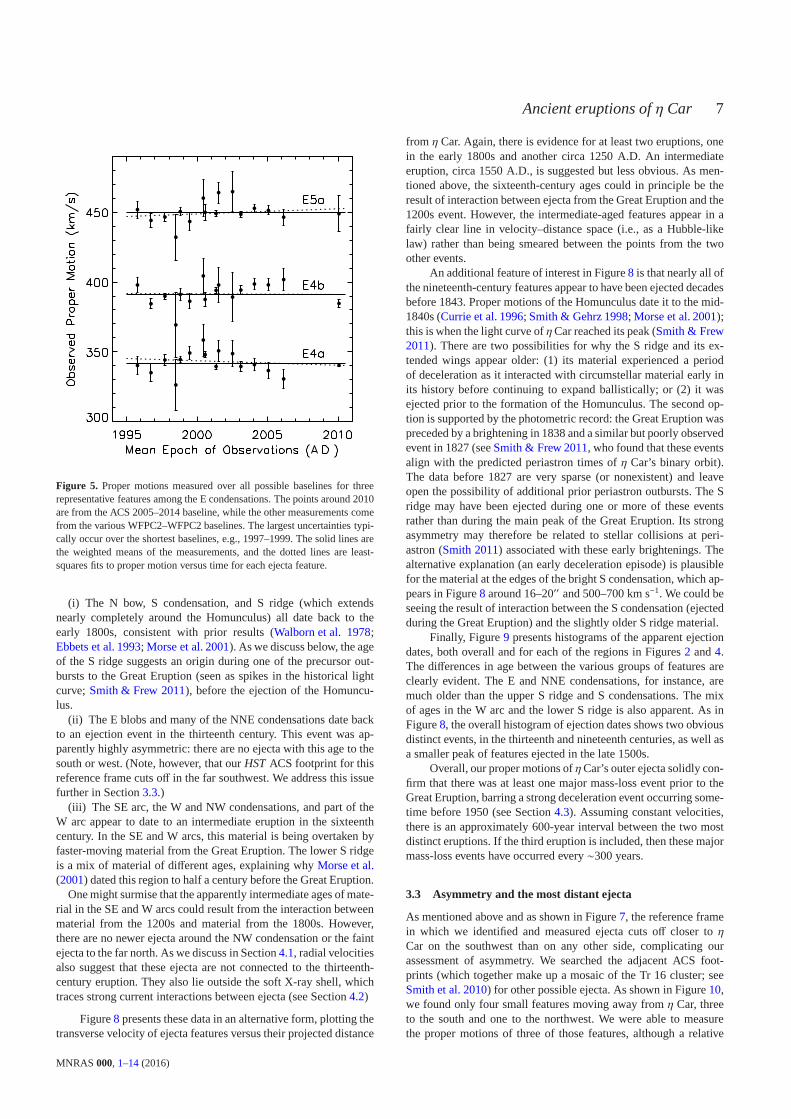
With a total of 16 different baselines from two instruments,we can approach the question of acceleration/deceleration with un-precedented detail. Figure5 plots the measured proper motionsover time for three features representative of the E condensationsand of the ejecta overall. The weighted mean transverse velocity ofeach feature is overplotted, along with a least-squares fit to the data.Although there is some variation among the proper motions, thereare no overall trends with time. In aχ2 test, the measured motionsfor all three features shown in Figure5 are consistent with havingbeen drawn from a distribution with constant transverse velocity.
This level of variance and (lack of) acceleration is foundacross all our data. Out of the 792 features for which proper mo-tions were measured, only 50 (6%) have data that are inconsistentat the p < 0.05 level with being drawn from a constant velocitydistribution. These 50 features occupy no special region ofphysi-cal space or velocity space. The slopes of the least-squaresfits tovelocity versus time for these 50 features also fall inside the rangeof slopes found for the rest of the ejecta. If material were being sig-nificantly accelerated (from being hit by younger, faster material)
MNRAS 000, 1–14 (2016)
6 M. M. Kiminki et al.
Figure 4. Histograms of the weighted mean proper motions of the outer ejecta, assuming a distance of 2.3 kpc. The regions are as shown in Figure2; note thatsome of the regions slightly overlap. The bottom right panelshows the velocity histogram for all 792 measured features.
or decelerated (from running into older material), we wouldexpectto see some kind of spatial correlation of those changes in velocity,yet we do not. Thus, while we cannot rule out small amounts ofacceleration or deceleration for individual features, theouter ejectaappear to be, on the whole, expanding ballistically. We thereforetreat all velocities as constant unless otherwise noted, and use theweighted mean as the final proper motion for each feature.
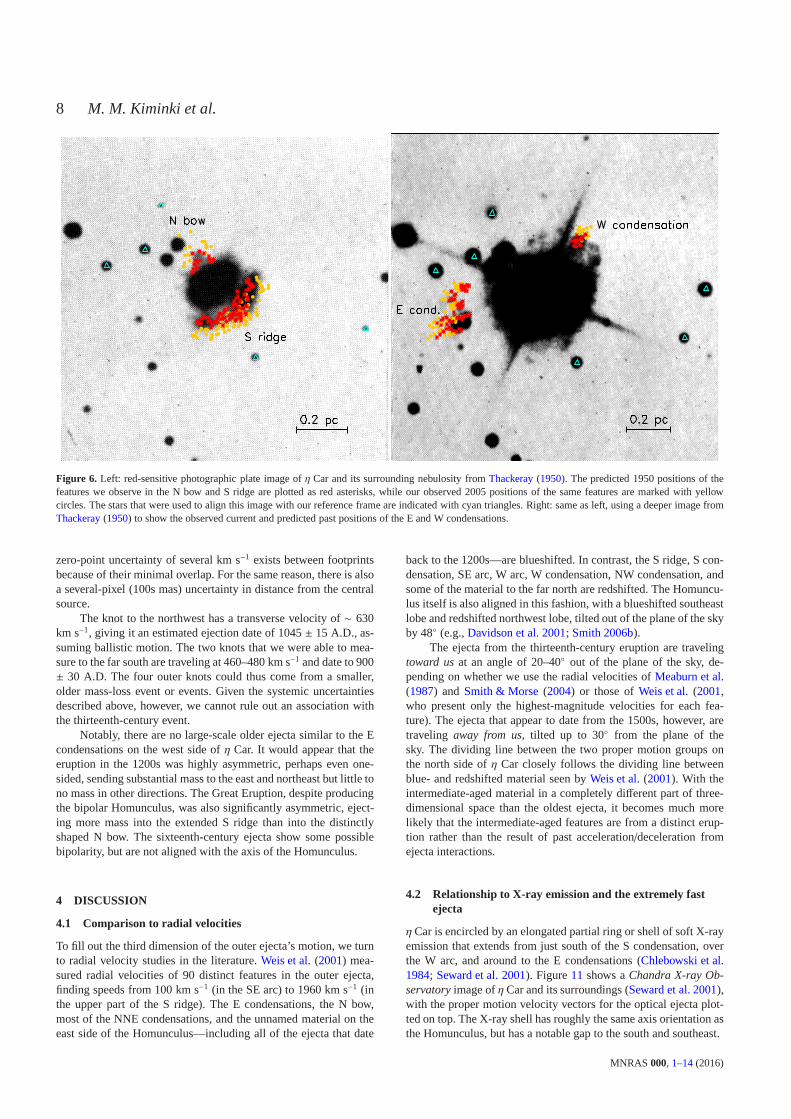
As a last check on whether the assumption of constant veloc-ities is appropriate, we extrapolate our observed positions of theouter ejecta back to 1950 and compare them to the ground-basedphotographic plate images ofThackeray(1950). We aligned theThackeray(1950) images to a copy of our stacked ACS image thathad been convolved with a broad PSF to approximately match theresolution of the older images. Figure6 shows the predicted 1950positions, with the observed 2005 positions overplotted for com-parison. There is good agreement between our predicted positionsand the observed features in 1950. Although one must be consciousof the limitations of photographic plate data, these data are consis-tent with ballistic motion ofη Car’s ejecta over the past 60 years.From the motion that we measure, however, we cannot rule out sig-
nificant acceleration or deceleration that may have occurred earlierthan 60 years ago.
3.2 Ages of the outer ejecta
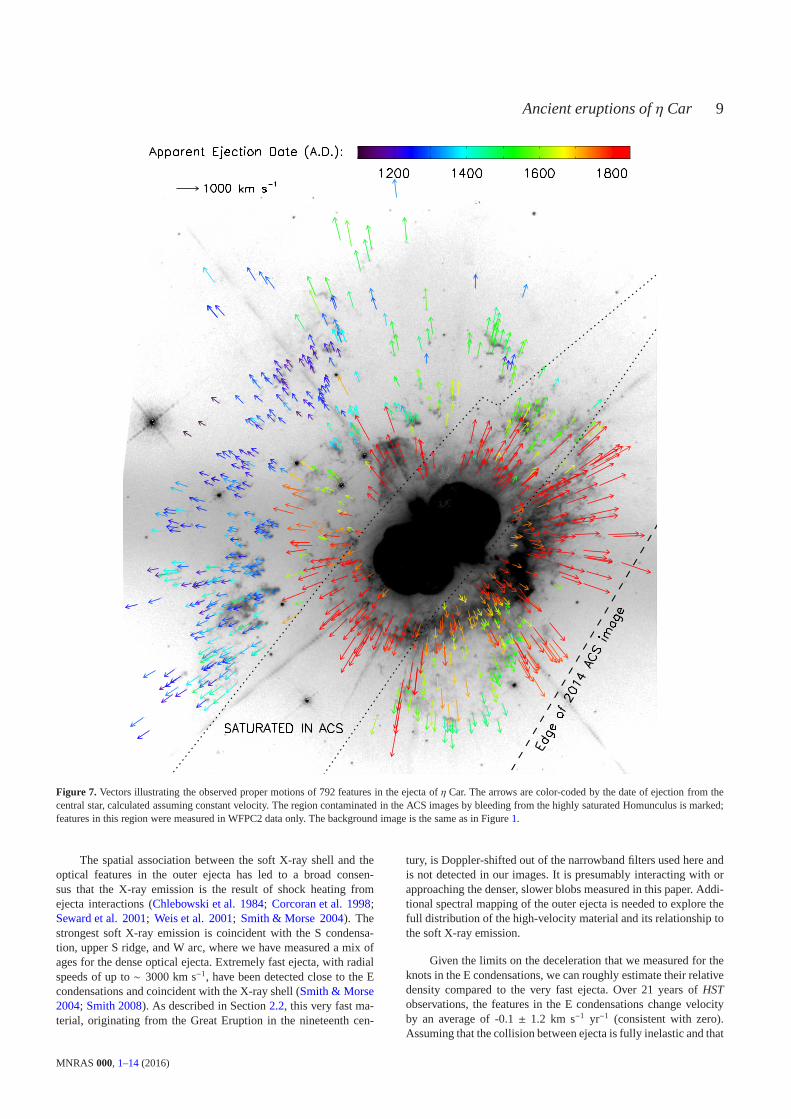
Under the assumption that the constant velocities observedover thelast 60 years apply over the lifetime of the ejecta, estimating ejec-tion dates is trivial. Earlier episodes of acceleration or decelerationwould affect the specific ejection dates deduced, but, as we dis-cuss in Section4.3, are unlikely to affect the overall relationshipsbetween groups of ejecta. Ejection date results are summarized inFigure7: the magnitude and direction of each knot’s proper motionare indicated by the length and orientation of its arrow, andthe ar-rows are color-coded by apparent ejection date. Red arrows markthe most recently ejected material, i.e., material that wasejectedaround the time of the Great Eruption, while blue and purple ar-rows indicate the oldest material. It can be seen in Figure7 that all792 measured features are moving nearly directly away from thecentral star.
There are several distinct groups of ejecta in Figure7:
MNRAS 000, 1–14 (2016)
Ancient eruptions of η Car 7
Figure 5. Proper motions measured over all possible baselines for threerepresentative features among the E condensations. The points around 2010are from the ACS 2005–2014 baseline, while the other measurements comefrom the various WFPC2–WFPC2 baselines. The largest uncertainties typi-cally occur over the shortest baselines, e.g., 1997–1999. The solid lines arethe weighted means of the measurements, and the dotted linesare least-squares fits to proper motion versus time for each ejecta feature.
(i) The N bow, S condensation, and S ridge (which extendsnearly completely around the Homunculus) all date back to theearly 1800s, consistent with prior results (Walborn et al. 1978;Ebbets et al. 1993; Morse et al. 2001). As we discuss below, the ageof the S ridge suggests an origin during one of the precursor out-bursts to the Great Eruption (seen as spikes in the historical lightcurve;Smith & Frew 2011), before the ejection of the Homuncu-lus.
(ii) The E blobs and many of the NNE condensations date backto an ejection event in the thirteenth century. This event was ap-parently highly asymmetric: there are no ejecta with this age to thesouth or west. (Note, however, that ourHST ACS footprint for thisreference frame cuts off in the far southwest. We address this issuefurther in Section3.3.)
(iii) The SE arc, the W and NW condensations, and part of theW arc appear to date to an intermediate eruption in the sixteenthcentury. In the SE and W arcs, this material is being overtaken byfaster-moving material from the Great Eruption. The lower Sridgeis a mix of material of different ages, explaining whyMorse et al.(2001) dated this region to half a century before the Great Eruption.
One might surmise that the apparently intermediate ages of mate-rial in the SE and W arcs could result from the interaction betweenmaterial from the 1200s and material from the 1800s. However,there are no newer ejecta around the NW condensation or the faintejecta to the far north. As we discuss in Section4.1, radial velocitiesalso suggest that these ejecta are not connected to the thirteenth-century eruption. They also lie outside the soft X-ray shell, whichtraces strong current interactions between ejecta (see Section 4.2)
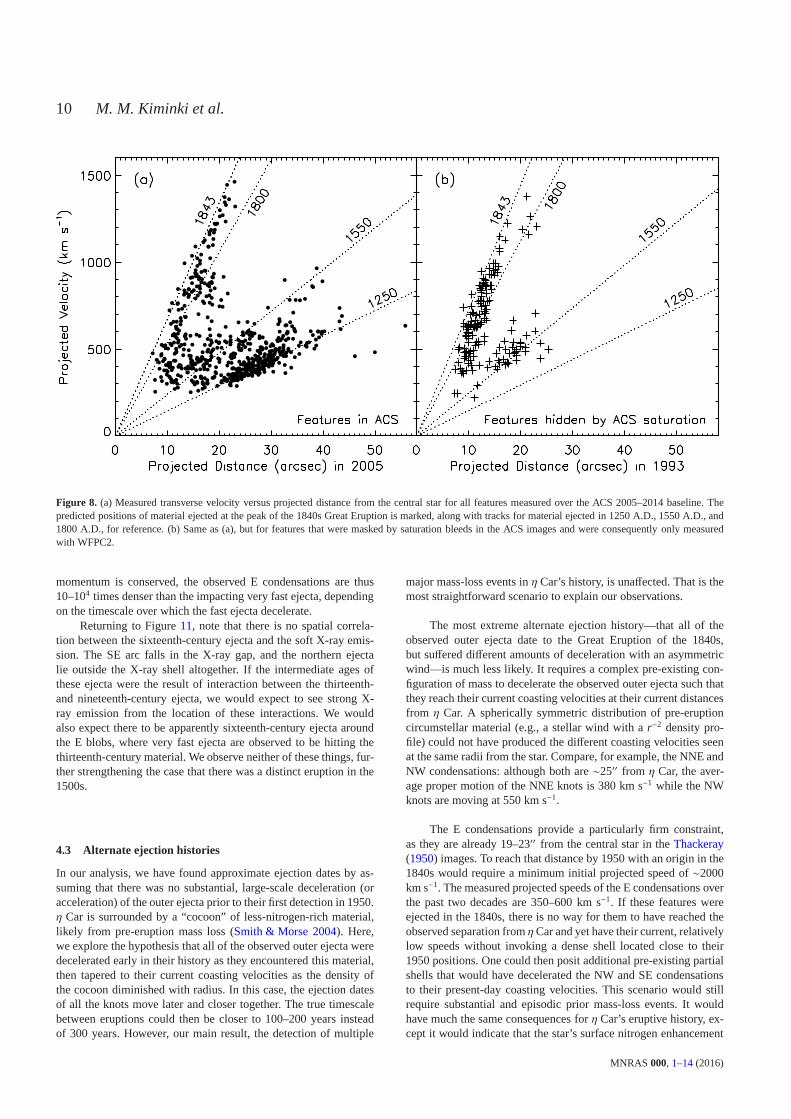
Figure8 presents these data in an alternative form, plotting thetransverse velocity of ejecta features versus their projected distance
from η Car. Again, there is evidence for at least two eruptions, onein the early 1800s and another circa 1250 A.D. An intermediateeruption, circa 1550 A.D., is suggested but less obvious. Asmen-tioned above, the sixteenth-century ages could in principle be theresult of interaction between ejecta from the Great Eruption and the1200s event. However, the intermediate-aged features appear in afairly clear line in velocity–distance space (i.e., as a Hubble-likelaw) rather than being smeared between the points from the twoother events.
An additional feature of interest in Figure8 is that nearly all ofthe nineteenth-century features appear to have been ejected decadesbefore 1843. Proper motions of the Homunculus date it to the mid-1840s (Currie et al. 1996; Smith & Gehrz 1998; Morse et al. 2001);this is when the light curve ofηCar reached its peak (Smith & Frew2011). There are two possibilities for why the S ridge and its ex-tended wings appear older: (1) its material experienced a periodof deceleration as it interacted with circumstellar material early inits history before continuing to expand ballistically; or (2) it wasejected prior to the formation of the Homunculus. The secondop-tion is supported by the photometric record: the Great Eruption waspreceded by a brightening in 1838 and a similar but poorly observedevent in 1827 (seeSmith & Frew 2011, who found that these eventsalign with the predicted periastron times ofη Car’s binary orbit).The data before 1827 are very sparse (or nonexistent) and leaveopen the possibility of additional prior periastron outbursts. The Sridge may have been ejected during one or more of these eventsrather than during the main peak of the Great Eruption. Its strongasymmetry may therefore be related to stellar collisions atperi-astron (Smith 2011) associated with these early brightenings. Thealternative explanation (an early deceleration episode) is plausiblefor the material at the edges of the bright S condensation, which ap-pears in Figure8 around 16–20′′ and 500–700 km s−1. We could beseeing the result of interaction between the S condensation(ejectedduring the Great Eruption) and the slightly older S ridge material.
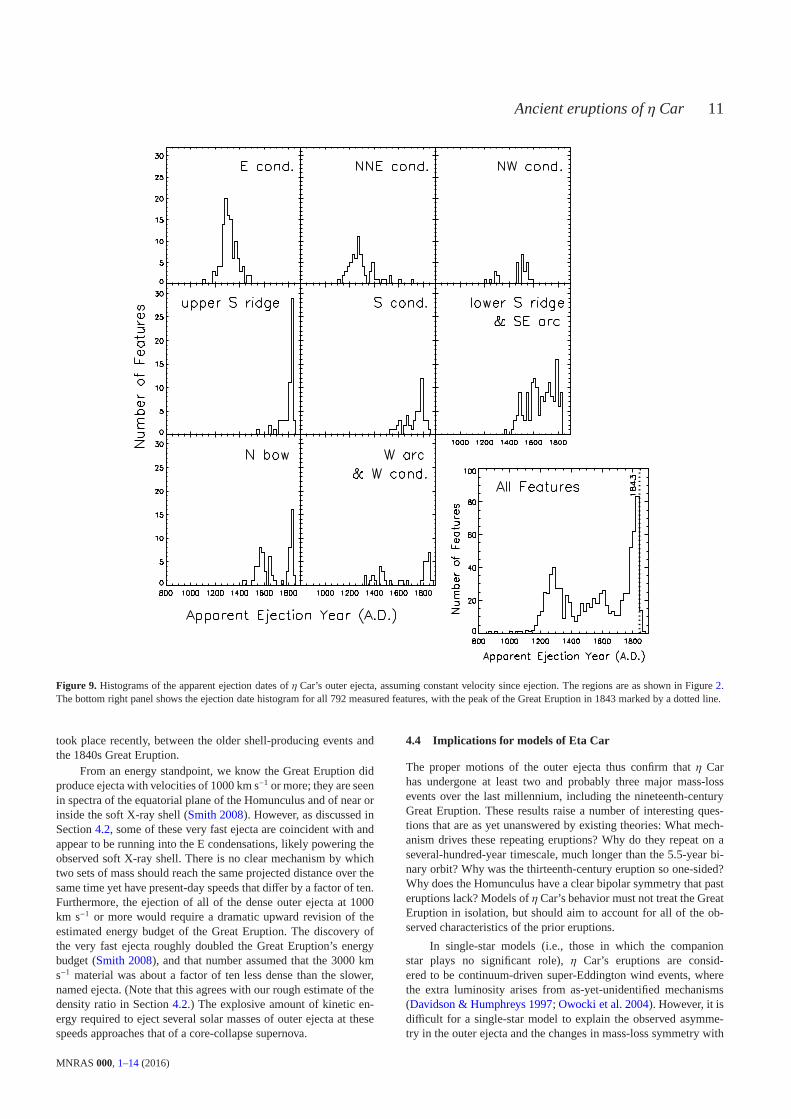
Finally, Figure9 presents histograms of the apparent ejectiondates, both overall and for each of the regions in Figures2 and4.The differences in age between the various groups of features areclearly evident. The E and NNE condensations, for instance,aremuch older than the upper S ridge and S condensations. The mixof ages in the W arc and the lower S ridge is also apparent. As inFigure8, the overall histogram of ejection dates shows two obviousdistinct events, in the thirteenth and nineteenth centuries, as well asa smaller peak of features ejected in the late 1500s.
Overall, our proper motions ofηCar’s outer ejecta solidly con-firm that there was at least one major mass-loss event prior totheGreat Eruption, barring a strong deceleration event occurring some-time before 1950 (see Section4.3). Assuming constant velocities,there is an approximately 600-year interval between the twomostdistinct eruptions. If the third eruption is included, thenthese majormass-loss events have occurred every∼300 years.
3.3 Asymmetry and the most distant ejecta
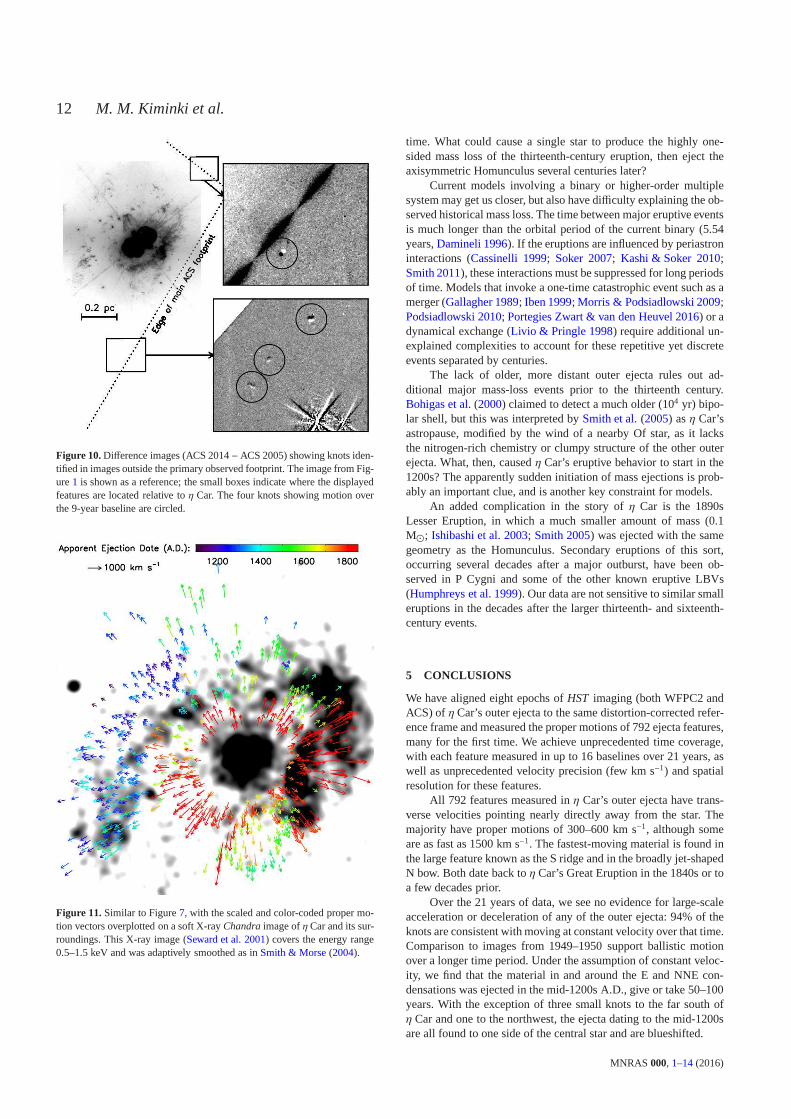
As mentioned above and as shown in Figure7, the reference framein which we identified and measured ejecta cuts off closer toηCar on the southwest than on any other side, complicating ourassessment of asymmetry. We searched the adjacent ACS foot-prints (which together make up a mosaic of the Tr 16 cluster; seeSmith et al. 2010) for other possible ejecta. As shown in Figure10,we found only four small features moving away fromη Car, threeto the south and one to the northwest. We were able to measurethe proper motions of three of those features, although a relative
MNRAS 000, 1–14 (2016)
8 M. M. Kiminki et al.
Figure 6. Left: red-sensitive photographic plate image ofη Car and its surrounding nebulosity fromThackeray(1950). The predicted 1950 positions of thefeatures we observe in the N bow and S ridge are plotted as red asterisks, while our observed 2005 positions of the same features are marked with yellowcircles. The stars that were used to align this image with ourreference frame are indicated with cyan triangles. Right: same as left, using a deeper image fromThackeray(1950) to show the observed current and predicted past positions of the E and W condensations.
zero-point uncertainty of several km s−1 exists between footprintsbecause of their minimal overlap. For the same reason, thereis alsoa several-pixel (100s mas) uncertainty in distance from thecentralsource.
The knot to the northwest has a transverse velocity of∼ 630km s−1, giving it an estimated ejection date of 1045± 15 A.D., as-suming ballistic motion. The two knots that we were able to mea-sure to the far south are traveling at 460–480 km s−1 and date to 900± 30 A.D. The four outer knots could thus come from a smaller,older mass-loss event or events. Given the systemic uncertaintiesdescribed above, however, we cannot rule out an associationwiththe thirteenth-century event.
Notably, there are no large-scale older ejecta similar to the Econdensations on the west side ofη Car. It would appear that theeruption in the 1200s was highly asymmetric, perhaps even one-sided, sending substantial mass to the east and northeast but little tono mass in other directions. The Great Eruption, despite producingthe bipolar Homunculus, was also significantly asymmetric,eject-ing more mass into the extended S ridge than into the distinctlyshaped N bow. The sixteenth-century ejecta show some possiblebipolarity, but are not aligned with the axis of the Homunculus.
4 DISCUSSION
4.1 Comparison to radial velocities
To fill out the third dimension of the outer ejecta’s motion, we turnto radial velocity studies in the literature.Weis et al.(2001) mea-sured radial velocities of 90 distinct features in the outerejecta,finding speeds from 100 km s−1 (in the SE arc) to 1960 km s−1 (inthe upper part of the S ridge). The E condensations, the N bow,most of the NNE condensations, and the unnamed material on theeast side of the Homunculus—including all of the ejecta thatdate
back to the 1200s—are blueshifted. In contrast, the S ridge,S con-densation, SE arc, W arc, W condensation, NW condensation, andsome of the material to the far north are redshifted. The Homuncu-lus itself is also aligned in this fashion, with a blueshifted southeastlobe and redshifted northwest lobe, tilted out of the plane of the skyby 48◦ (e.g.,Davidson et al. 2001; Smith 2006b).
The ejecta from the thirteenth-century eruption are travelingtoward us at an angle of 20–40◦ out of the plane of the sky, de-pending on whether we use the radial velocities ofMeaburn et al.(1987) and Smith & Morse(2004) or those ofWeis et al.(2001,who present only the highest-magnitude velocities for eachfea-ture). The ejecta that appear to date from the 1500s, however, aretraveling away from us, tilted up to 30◦ from the plane of thesky. The dividing line between the two proper motion groups onthe north side ofη Car closely follows the dividing line betweenblue- and redshifted material seen byWeis et al.(2001). With theintermediate-aged material in a completely different part of three-dimensional space than the oldest ejecta, it becomes much morelikely that the intermediate-aged features are from a distinct erup-tion rather than the result of past acceleration/deceleration fromejecta interactions.
4.2 Relationship to X-ray emission and the extremely fastejecta
η Car is encircled by an elongated partial ring or shell of softX-rayemission that extends from just south of the S condensation,overthe W arc, and around to the E condensations (Chlebowski et al.1984; Seward et al. 2001). Figure11 shows aChandra X-ray Ob-servatory image ofη Car and its surroundings (Seward et al. 2001),with the proper motion velocity vectors for the optical ejecta plot-ted on top. The X-ray shell has roughly the same axis orientation asthe Homunculus, but has a notable gap to the south and southeast.
MNRAS 000, 1–14 (2016)
Ancient eruptions of η Car 9
Figure 7. Vectors illustrating the observed proper motions of 792 features in the ejecta ofη Car. The arrows are color-coded by the date of ejection from thecentral star, calculated assuming constant velocity. The region contaminated in the ACS images by bleeding from the highly saturated Homunculus is marked;features in this region were measured in WFPC2 data only. Thebackground image is the same as in Figure1.
The spatial association between the soft X-ray shell and theoptical features in the outer ejecta has led to a broad consen-sus that the X-ray emission is the result of shock heating fromejecta interactions (Chlebowski et al. 1984; Corcoran et al. 1998;Seward et al. 2001; Weis et al. 2001; Smith & Morse 2004). Thestrongest soft X-ray emission is coincident with the S condensa-tion, upper S ridge, and W arc, where we have measured a mix ofages for the dense optical ejecta. Extremely fast ejecta, with radialspeeds of up to∼ 3000 km s−1, have been detected close to the Econdensations and coincident with the X-ray shell (Smith & Morse2004; Smith 2008). As described in Section2.2, this very fast ma-terial, originating from the Great Eruption in the nineteenth cen-
tury, is Doppler-shifted out of the narrowband filters used here andis not detected in our images. It is presumably interacting with orapproaching the denser, slower blobs measured in this paper. Addi-tional spectral mapping of the outer ejecta is needed to explore thefull distribution of the high-velocity material and its relationship tothe soft X-ray emission.
Given the limits on the deceleration that we measured for theknots in the E condensations, we can roughly estimate their relativedensity compared to the very fast ejecta. Over 21 years ofHSTobservations, the features in the E condensations change velocityby an average of -0.1± 1.2 km s−1 yr−1 (consistent with zero).Assuming that the collision between ejecta is fully inelastic and that
MNRAS 000, 1–14 (2016)
10 M. M. Kiminki et al.
Figure 8. (a) Measured transverse velocity versus projected distance from the central star for all features measured over the ACS2005–2014 baseline. Thepredicted positions of material ejected at the peak of the 1840s Great Eruption is marked, along with tracks for materialejected in 1250 A.D., 1550 A.D., and1800 A.D., for reference. (b) Same as (a), but for features that were masked by saturation bleeds in the ACS images and wereconsequently only measuredwith WFPC2.
momentum is conserved, the observed E condensations are thus10–104 times denser than the impacting very fast ejecta, dependingon the timescale over which the fast ejecta decelerate.
Returning to Figure11, note that there is no spatial correla-tion between the sixteenth-century ejecta and the soft X-ray emis-sion. The SE arc falls in the X-ray gap, and the northern ejectalie outside the X-ray shell altogether. If the intermediateages ofthese ejecta were the result of interaction between the thirteenth-and nineteenth-century ejecta, we would expect to see strong X-ray emission from the location of these interactions. We wouldalso expect there to be apparently sixteenth-century ejecta aroundthe E blobs, where very fast ejecta are observed to be hittingthethirteenth-century material. We observe neither of these things, fur-ther strengthening the case that there was a distinct eruption in the1500s.
4.3 Alternate ejection histories
In our analysis, we have found approximate ejection dates byas-suming that there was no substantial, large-scale deceleration (oracceleration) of the outer ejecta prior to their first detection in 1950.η Car is surrounded by a “cocoon” of less-nitrogen-rich material,likely from pre-eruption mass loss (Smith & Morse 2004). Here,we explore the hypothesis that all of the observed outer ejecta weredecelerated early in their history as they encountered thismaterial,then tapered to their current coasting velocities as the density ofthe cocoon diminished with radius. In this case, the ejection datesof all the knots move later and closer together. The true timescalebetween eruptions could then be closer to 100–200 years insteadof 300 years. However, our main result, the detection of multiple
major mass-loss events inη Car’s history, is unaffected. That is themost straightforward scenario to explain our observations.
The most extreme alternate ejection history—that all of theobserved outer ejecta date to the Great Eruption of the 1840s,but suffered different amounts of deceleration with an asymmetricwind—is much less likely. It requires a complex pre-existing con-figuration of mass to decelerate the observed outer ejecta such thatthey reach their current coasting velocities at their current distancesfrom η Car. A spherically symmetric distribution of pre-eruptioncircumstellar material (e.g., a stellar wind with ar−2 density pro-file) could not have produced the different coasting velocities seenat the same radii from the star. Compare, for example, the NNEandNW condensations: although both are∼25′′ from η Car, the aver-age proper motion of the NNE knots is 380 km s−1 while the NWknots are moving at 550 km s−1.
The E condensations provide a particularly firm constraint,as they are already 19–23′′ from the central star in theThackeray(1950) images. To reach that distance by 1950 with an origin in the1840s would require a minimum initial projected speed of∼2000km s−1. The measured projected speeds of the E condensations overthe past two decades are 350–600 km s−1. If these features wereejected in the 1840s, there is no way for them to have reached theobserved separation fromηCar and yet have their current, relativelylow speeds without invoking a dense shell located close to their1950 positions. One could then posit additional pre-existing partialshells that would have decelerated the NW and SE condensationsto their present-day coasting velocities. This scenario would stillrequire substantial and episodic prior mass-loss events. It wouldhave much the same consequences forη Car’s eruptive history, ex-cept it would indicate that the star’s surface nitrogen enhancement
MNRAS 000, 1–14 (2016)
Ancient eruptions of η Car 11
Figure 9. Histograms of the apparent ejection dates ofη Car’s outer ejecta, assuming constant velocity since ejection. The regions are as shown in Figure2.The bottom right panel shows the ejection date histogram forall 792 measured features, with the peak of the Great Eruption in 1843 marked by a dotted line.
took place recently, between the older shell-producing events andthe 1840s Great Eruption.
From an energy standpoint, we know the Great Eruption didproduce ejecta with velocities of 1000 km s−1 or more; they are seenin spectra of the equatorial plane of the Homunculus and of near orinside the soft X-ray shell (Smith 2008). However, as discussed inSection4.2, some of these very fast ejecta are coincident with andappear to be running into the E condensations, likely powering theobserved soft X-ray shell. There is no clear mechanism by whichtwo sets of mass should reach the same projected distance over thesame time yet have present-day speeds that differ by a factor of ten.Furthermore, the ejection of all of the dense outer ejecta at1000km s−1 or more would require a dramatic upward revision of theestimated energy budget of the Great Eruption. The discovery ofthe very fast ejecta roughly doubled the Great Eruption’s energybudget (Smith 2008), and that number assumed that the 3000 kms−1 material was about a factor of ten less dense than the slower,named ejecta. (Note that this agrees with our rough estimateof thedensity ratio in Section4.2.) The explosive amount of kinetic en-ergy required to eject several solar masses of outer ejecta at thesespeeds approaches that of a core-collapse supernova.
4.4 Implications for models of Eta Car
The proper motions of the outer ejecta thus confirm thatη Carhas undergone at least two and probably three major mass-lossevents over the last millennium, including the nineteenth-centuryGreat Eruption. These results raise a number of interestingques-tions that are as yet unanswered by existing theories: What mech-anism drives these repeating eruptions? Why do they repeat on aseveral-hundred-year timescale, much longer than the 5.5-year bi-nary orbit? Why was the thirteenth-century eruption so one-sided?Why does the Homunculus have a clear bipolar symmetry that pasteruptions lack? Models ofη Car’s behavior must not treat the GreatEruption in isolation, but should aim to account for all of the ob-served characteristics of the prior eruptions.
In single-star models (i.e., those in which the companionstar plays no significant role),η Car’s eruptions are consid-ered to be continuum-driven super-Eddington wind events, wherethe extra luminosity arises from as-yet-unidentified mechanisms(Davidson & Humphreys 1997; Owocki et al. 2004). However, it isdifficult for a single-star model to explain the observed asymme-try in the outer ejecta and the changes in mass-loss symmetrywith
MNRAS 000, 1–14 (2016)
12 M. M. Kiminki et al.
Figure 10. Difference images (ACS 2014−ACS 2005) showing knots iden-tified in images outside the primary observed footprint. Theimage from Fig-ure1 is shown as a reference; the small boxes indicate where the displayedfeatures are located relative toη Car. The four knots showing motion overthe 9-year baseline are circled.
Figure 11. Similar to Figure7, with the scaled and color-coded proper mo-tion vectors overplotted on a soft X-rayChandra image ofη Car and its sur-roundings. This X-ray image (Seward et al. 2001) covers the energy range0.5–1.5 keV and was adaptively smoothed as inSmith & Morse(2004).
time. What could cause a single star to produce the highly one-sided mass loss of the thirteenth-century eruption, then eject theaxisymmetric Homunculus several centuries later?
Current models involving a binary or higher-order multiplesystem may get us closer, but also have difficulty explaining the ob-served historical mass loss. The time between major eruptive eventsis much longer than the orbital period of the current binary (5.54years,Damineli 1996). If the eruptions are influenced by periastroninteractions (Cassinelli 1999; Soker 2007; Kashi & Soker 2010;Smith 2011), these interactions must be suppressed for long periodsof time. Models that invoke a one-time catastrophic event such as amerger (Gallagher 1989; Iben 1999; Morris & Podsiadlowski 2009;Podsiadlowski 2010; Portegies Zwart & van den Heuvel 2016) or adynamical exchange (Livio & Pringle 1998) require additional un-explained complexities to account for these repetitive yetdiscreteevents separated by centuries.
The lack of older, more distant outer ejecta rules out ad-ditional major mass-loss events prior to the thirteenth century.Bohigas et al.(2000) claimed to detect a much older (104 yr) bipo-lar shell, but this was interpreted bySmith et al.(2005) asη Car’sastropause, modified by the wind of a nearby Of star, as it lacksthe nitrogen-rich chemistry or clumpy structure of the other outerejecta. What, then, causedη Car’s eruptive behavior to start in the1200s? The apparently sudden initiation of mass ejections is prob-ably an important clue, and is another key constraint for models.
An added complication in the story ofη Car is the 1890sLesser Eruption, in which a much smaller amount of mass (0.1M⊙; Ishibashi et al. 2003; Smith 2005) was ejected with the samegeometry as the Homunculus. Secondary eruptions of this sort,occurring several decades after a major outburst, have beenob-served in P Cygni and some of the other known eruptive LBVs(Humphreys et al. 1999). Our data are not sensitive to similar smalleruptions in the decades after the larger thirteenth- and sixteenth-century events.
5 CONCLUSIONS
We have aligned eight epochs ofHST imaging (both WFPC2 andACS) ofη Car’s outer ejecta to the same distortion-corrected refer-ence frame and measured the proper motions of 792 ejecta features,many for the first time. We achieve unprecedented time coverage,with each feature measured in up to 16 baselines over 21 years, aswell as unprecedented velocity precision (few km s−1) and spatialresolution for these features.
All 792 features measured inη Car’s outer ejecta have trans-verse velocities pointing nearly directly away from the star. Themajority have proper motions of 300–600 km s−1, although someare as fast as 1500 km s−1. The fastest-moving material is found inthe large feature known as the S ridge and in the broadly jet-shapedN bow. Both date back toη Car’s Great Eruption in the 1840s or toa few decades prior.
Over the 21 years of data, we see no evidence for large-scaleacceleration or deceleration of any of the outer ejecta: 94%of theknots are consistent with moving at constant velocity over that time.Comparison to images from 1949–1950 support ballistic motionover a longer time period. Under the assumption of constant veloc-ity, we find that the material in and around the E and NNE con-densations was ejected in the mid-1200s A.D., give or take 50–100years. With the exception of three small knots to the far south ofη Car and one to the northwest, the ejecta dating to the mid-1200sare all found to one side of the central star and are blueshifted.
MNRAS 000, 1–14 (2016)
Ancient eruptions of η Car 13
We also see evidence of a third, intermediate eruption that oc-curred in the sixteenth century. Ejecta dating to the mid-1500s arefound in the SE arc, the W condensation, and in and around the NWcondensation. From proper motions alone, we cannot rule outthatthis intermediate date peak is the result of newer ejecta from theGreat Eruption hitting the older material from the 1200s. However,the radial velocities of these features place them in a different partof three-dimensional space from the thirteenth-century ejecta. Thelack of X-ray emission over the SE arc and the features to the farnorth also indicates a lack of strong interaction between ejecta atthose spots.
In summary, we have shown with distance-independent mea-surements thatη Car erupted at least once, likely twice, before itsGreat Eruption in the 1800s. Models for this still-enigmatic starmust therefore explain the recurrence of these major mass-lossevents, along with their several-hundred-year timescale and theirvarious asymmetries.
ACKNOWLEDGEMENTS
The authors would like to thank Jay Anderson for providing uswith his suite of PSF-fitting and image alignment software, andfor his valuable instruction, guidance, and technical support. Wealso thank the anonymous referee for constructive commentsthatimproved the paper. Support for this work was provided by NASAgrant GO-13390 from the Space Telescope Science Institute,whichis operated by the Association of Universities for Researchin As-tronomy, Inc. under NASA contract NAS 5-26555. This work isbased on observations made with the NASA/ESA Hubble SpaceTelescope, obtained from the Data Archive at the Space TelescopeScience Institute.
REFERENCES
Anderson J., 2006, in Koekemoer A. M., Goudfrooij P., Dressel L. L., eds,The 2005 HST Calibration Workshop: Hubble After the Transition toTwo-Gyro Mode. p. 11
Anderson J., King I. R., 1999,PASP, 111, 1095Anderson J., King I. R., 2000,PASP, 112, 1360Anderson J., King I. R., 2006, Technical report, PSFs, Photometry, and As-
tronomy for the ACS/WFC. Space Telescope Science InstituteAnderson J., van der Marel R. P., 2010,ApJ, 710, 1032Anderson J., et al., 2008a,AJ, 135, 2055Anderson J., et al., 2008b,AJ, 135, 2114Bohigas J., Tapia M., Ruiz M. T., Roth M., 2000,MNRAS, 312, 295Cassinelli J. P., 1999, in Morse J. A., Humphreys R. M., Damineli A., eds,
Astronomical Society of the Pacific Conference Series Vol. 179, EtaCarinae at The Millennium. p. 358
Chlebowski T., Seward F. D., Swank J., Szymkowiak A., 1984,ApJ,281, 665
Corcoran M. F., et al., 1998,ApJ, 494, 381Corcoran M. F., Ishibashi K., Swank J. H., Petre R., 2001,ApJ, 547, 1034Currie D. G., et al., 1996,AJ, 112, 1115Currie D. G., Dorland B. N., Kaufer A., 2002,A&A , 389, L65Damineli A., 1996,ApJ, 460, L49Damineli A., Conti P. S., Lopes D. F., 1997,New Astron., 2, 107Damineli A., Kaufer A., Wolf B., Stahl O., Lopes D. F., de Araújo F. X.,
2000,ApJ, 528, L101Davidson K., 1971,MNRAS, 154, 415Davidson K., Humphreys R. M., 1997,ARA&A , 35, 1Davidson K., Dufour R. J., Walborn N. R., Gull T. R., 1986,ApJ, 305, 867Davidson K., Smith N., Gull T. R., Ishibashi K., Hillier D. J., 2001,AJ,
121, 1569
Ebbets D., Malumuth E., Davidson K., White R., Walborn N., 1993, inCassinelli J. P., Churchwell E. B., eds, Astronomical Society of thePacific Conference Series Vol. 35, Massive Stars: Their Lives in theInterstellar Medium. p. 263
Frew D. J., 2004, Journal of Astronomical Data,10, 6Gallagher J. S., 1989, in Davidson K., Moffat A. F. J., Lamers H. J. G. L. M.,
eds, Astrophysics and Space Science Library Vol. 157, IAU Colloq.113: Physics of Luminous Blue Variables. pp 185–192
Glatzel W., 1994,MNRAS, 271Glatzel W., Kiriakidis M., 1993,MNRAS, 263, 375Gomez H. L., Vlahakis C., Stretch C. M., Dunne L., Eales S. A.,Beelen A.,
Gomez E. L., Edmunds M. G., 2010,MNRAS, 401, L48Hartigan P., Morse J. A., Reipurth B., Heathcote S., Bally J., 2001,ApJ,
559, L157Humphreys R. M., Davidson K., 1994,PASP, 106, 1025Humphreys R. M., Davidson K., Smith N., 1999,PASP, 111, 1124Iben Jr. I., 1999, in Morse J. A., Humphreys R. M., Damineli A., eds, Astro-
nomical Society of the Pacific Conference Series Vol. 179, Eta Carinaeat The Millennium. p. 367
Innes R. T. A., 1903, Annals of the Cape Observatory, 9, 75BIshibashi K., et al., 2003,AJ, 125, 3222Kashi A., Soker N., 2010,ApJ, 723, 602Lamers H. J. G. L. M., Fitzpatrick E. L., 1988,ApJ, 324, 279Livio M., Pringle J. E., 1998,MNRAS, 295, L59Maeder A., 1983, A&A,120, 113Meaburn J., Wolstencroft R. D., Walsh J. R., 1987, A&A,181, 333Meaburn J., Boumis P., Walsh J. R., Steffen W., Holloway A. J., Williams
R. J. R., Bryce M., 1996,MNRAS, 282, 1313Morris T., Podsiadlowski P., 2009,MNRAS, 399, 515Morse J. A., 1999, in Morse J. A., Humphreys R. M., Damineli A., eds,
Astronomical Society of the Pacific Conference Series Vol. 179, EtaCarinae at The Millennium. p. 13
Morse J. A., Davidson K., Bally J., Ebbets D., Balick B., Frank A., 1998,AJ, 116, 2443
Morse J. A., Kellogg J. R., Bally J., Davidson K., Balick B., Ebbets D.,2001,ApJ, 548, L207
Owocki S. P., Gayley K. G., Shaviv N. J., 2004,ApJ, 616, 525Podsiadlowski P., 2010,New Astron. Rev., 54, 39Portegies Zwart S. F., van den Heuvel E. P. J., 2016,MNRAS, 456, 3401Reiter M., Smith N., 2014,MNRAS, 445, 3939Reiter M., Smith N., Kiminki M. M., Bally J., Anderson J., 2015a,MNRAS,
448, 3429Reiter M., Smith N., Kiminki M. M., Bally J., 2015b,MNRAS, 450, 564Seward F. D., Butt Y. M., Karovska M., Prestwich A., SchlegelE. M., Cor-
coran M., 2001,ApJ, 553, 832Shaviv N. J., 2000,ApJ, 532, L137Smith N., 2005,MNRAS, 357, 1330Smith N., 2006a,MNRAS, 367, 763Smith N., 2006b,ApJ, 644, 1151Smith N., 2008,Nature, 455, 201Smith N., 2011,MNRAS, 415, 2020Smith N., Frew D. J., 2011,MNRAS, 415, 2009Smith N., Gehrz R. D., 1998,AJ, 116, 823Smith N., Hartigan P., 2006,ApJ, 638, 1045Smith N., Morse J. A., 2004,ApJ, 605, 854Smith N., Tombleson R., 2015,MNRAS, 447, 598Smith N., Gehrz R. D., Hinz P. M., Hoffmann W. F., Hora J. L., Mamajek
E. E., Meyer M. R., 2003,AJ, 125, 1458Smith N., Morse J. A., Bally J., 2005,AJ, 130, 1778Smith N., Bally J., Walborn N. R., 2010,MNRAS, 405, 1153Sohn S. T., Anderson J., van der Marel R. P., 2012,ApJ, 753, 7Soker N., 2007,ApJ, 661, 490Stothers R. B., Chin C.-W., 1993,ApJ, 408, L85Thackeray A. D., 1950, MNRAS,110, 524Walborn N. R., 1976,ApJ, 204, L17Walborn N. R., Blanco B. M., 1988,PASP, 100, 797Walborn N. R., Blanco B. M., Thackeray A. D., 1978,ApJ, 219, 498
MNRAS 000, 1–14 (2016)
14 M. M. Kiminki et al.
Weis K., 2012, in Davidson K., Humphreys R. M., eds, Astrophysics andSpace Science Library Vol. 384, Astrophysics and Space Science Li-brary. p. 171,doi:10.1007/978-1-4614-2275-4_8
Weis K., Duschl W. J., Bomans D. J., 2001,A&A , 367, 566Whitelock P. A., Feast M. W., Marang F., Breedt E., 2004,MNRAS,
352, 447de Jager C., 1984, A&A,138, 246van Genderen A. M., 2001,A&A , 366, 508
This paper has been typeset from a TEX/LATEX file prepared by the author.
MNRAS 000, 1–14 (2016)