Analysis of Thermal Deformations of an Arched Theatre...
13
TS 1F – Deformation Measurement Andreas Eichhorn, Johannes Fabiankowitsch, Michaela Haberler-Weber, Alexander Reiterer Analysis of Thermal Deformations of an Arched Theatre Ceiling FIG Working Week 2007 Hong Kong, China, May 13-17, 2007 1/13 Analysis of Thermal Deformations of an Arched Theatre Ceiling Andreas EICHHORN, Johannes FABIANKOWITSCH, Michaela HABERLER-WEBER and Alexander REITERER, Austria Key words: Arched theatre ceiling, monitoring, thermal deformations, non-parametric defor- mation models SUMMARY The listed „Etablissement Ronacher“ was constructed in 1871 and is one of the most famous theatres in Vienna. In the course of an extensive renovation the old wooden truss was replaced by a modern steel construction. In expectance of significant deformations of the auditorium ceiling with a priori unknown statics our institute was authorised by the construction management to install a monitoring system. Major goals are the real-time detection of vertical displacements with min. 2-3/10 mm up to 25 mm and the realisation of an automated alarm process in case of exceeding tolerance boundaries. Special challenges are the required high accuracy and reliability of the sensor system which has to work auto- nomously for nearly one year in a permanent construction environment. The first part of the paper contains a short description of the construction process, the monitoring system with a TCA1800 as central sensor and the strategy for alerting. The second part contains the investigation of the measured time-series with a length of nearly 8 months and a sampling rate of Δt = 10 minutes. Special focus is set on the analysis of the thermal effects (thermal bend of the arched ceiling) which could be significantly detected up to 1/10 mm. To derive the causal relationship between temperature changes and deformation quantities different non-parametric methods are applied: spectral analysis, weight functions, neural networks and Neuro-Fuzzy methods. The different calculations (especially for deformation predictions) are compared and evaluated. In this context one interesting point is the required memory of system input parameters. The resulting thermal deformation model(s) provides a significant improvement for under- standing and prediction of this complex structure.
Transcript of Analysis of Thermal Deformations of an Arched Theatre...
TS 1F – Deformation Measurement Andreas Eichhorn, Johannes Fabiankowitsch, Michaela Haberler-Weber, Alexander Reiterer Analysis of Thermal Deformations of an Arched Theatre Ceiling FIG Working Week 2007 Hong Kong, China, May 13-17, 2007
1/13
Analysis of Thermal Deformations of an Arched Theatre Ceiling
Andreas EICHHORN, Johannes FABIANKOWITSCH, Michaela HABERLER-WEBER and Alexander REITERER, Austria
Key words: Arched theatre ceiling, monitoring, thermal deformations, non-parametric defor-mation models SUMMARY The listed „Etablissement Ronacher“ was constructed in 1871 and is one of the most famous theatres in Vienna. In the course of an extensive renovation the old wooden truss was replaced by a modern steel construction. In expectance of significant deformations of the auditorium ceiling with a priori unknown statics our institute was authorised by the construction management to install a monitoring system. Major goals are the real-time detection of vertical displacements with min. 2-3/10 mm up to 25 mm and the realisation of an automated alarm process in case of exceeding tolerance boundaries. Special challenges are the required high accuracy and reliability of the sensor system which has to work auto-nomously for nearly one year in a permanent construction environment. The first part of the paper contains a short description of the construction process, the monitoring system with a TCA1800 as central sensor and the strategy for alerting. The second part contains the investigation of the measured time-series with a length of nearly 8 months and a sampling rate of Δt = 10 minutes. Special focus is set on the analysis of the thermal effects (thermal bend of the arched ceiling) which could be significantly detected up to 1/10 mm. To derive the causal relationship between temperature changes and deformation quantities different non-parametric methods are applied: spectral analysis, weight functions, neural networks and Neuro-Fuzzy methods. The different calculations (especially for deformation predictions) are compared and evaluated. In this context one interesting point is the required memory of system input parameters. The resulting thermal deformation model(s) provides a significant improvement for under-standing and prediction of this complex structure.
TS 1F – Deformation Measurement Andreas Eichhorn, Johannes Fabiankowitsch, Michaela Haberler-Weber, Alexander Reiterer Analysis of Thermal Deformations of an Arched Theatre Ceiling FIG Working Week 2007 Hong Kong, China, May 13-17, 2007
2/13
Analysis of Thermal Deformations of an Arched Theatre Ceiling
Andreas EICHHORN, Johannes FABIANKOWITSCH, Michaela HABERLER-WEBER and Alexander REITERER, Austria
1. THE OBJECT The Viennese theatre “Etablissement Ronacher” was founded in 1871 and initially used as extension to the existing “Burgtheater”. After a desastrous burning Anton Ronacher pur-chased the building in 1884 and initiated a reconstruction as vaudeville. Since 1987 the listed theatre is integrated in the “Vereinigte Bühnen Wien” cooperation and serves for the presen-tation of musicals. Increasing numbers of spectators and the necessity for modernisation of the infrastructure require a complete rehabilitation which started in 2006 and will be approximately finished in spring 2008 (RONACHER 2006). Important tasks are e.g. − improvement of space and visibility conditions in the auditorium, − extension of the orchestra pit, and − establishment of new rooms for practising and a cafeteria on the top of the building
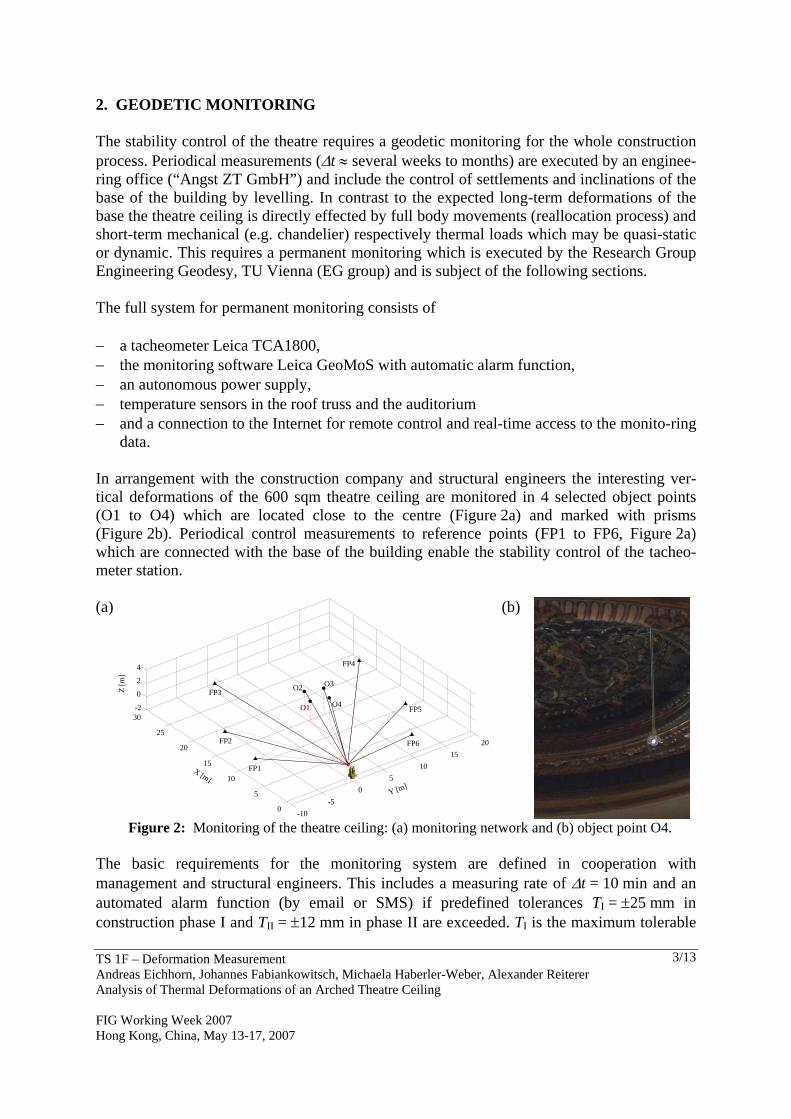
(Figure 1a). The third task requires a massive reconstruction of the existing theatre ceiling (Figure 1b). The old ceiling must be reallocated from the old roof truss in a new steel construction with tension rods. Planning is executed by “Architekten Domenig & Wallner ZT GmbH” and “Architektur Consult ZT GmbH”. The general management for the construction process is performed by “Lorenz Consult GmbH”. (a)
(b)
Figure 1: Rehabilitation of the “Etablissement Ronacher” (1a: RONACHER 2006). The whole construction process is divided into two phases. The first step contains the reallo-cation of the theatre ceiling and unhinging respectively reconnecting a chandelier with a weight of 1.5 tons (“construction phase I”). The second step contains all remaining activities for roof finishing (“construction phase II”).
TS 1F – Deformation Measurement Andreas Eichhorn, Johannes Fabiankowitsch, Michaela Haberler-Weber, Alexander Reiterer Analysis of Thermal Deformations of an Arched Theatre Ceiling FIG Working Week 2007 Hong Kong, China, May 13-17, 2007
3/13
2. GEODETIC MONITORING The stability control of the theatre requires a geodetic monitoring for the whole construction process. Periodical measurements (Δt ≈ several weeks to months) are executed by an enginee-ring office (“Angst ZT GmbH”) and include the control of settlements and inclinations of the base of the building by levelling. In contrast to the expected long-term deformations of the base the theatre ceiling is directly effected by full body movements (reallocation process) and short-term mechanical (e.g. chandelier) respectively thermal loads which may be quasi-static or dynamic. This requires a permanent monitoring which is executed by the Research Group Engineering Geodesy, TU Vienna (EG group) and is subject of the following sections. The full system for permanent monitoring consists of − a tacheometer Leica TCA1800, − the monitoring software Leica GeoMoS with automatic alarm function, − an autonomous power supply, − temperature sensors in the roof truss and the auditorium − and a connection to the Internet for remote control and real-time access to the monito-ring
data. In arrangement with the construction company and structural engineers the interesting ver-tical deformations of the 600 sqm theatre ceiling are monitored in 4 selected object points (O1 to O4) which are located close to the centre (Figure 2a) and marked with prisms (Figure 2b). Periodical control measurements to reference points (FP1 to FP6, Figure 2a) which are connected with the base of the building enable the stability control of the tacheo-meter station. (a)
-10-5
05
1015
20
0
5
10
15
20
25
30-2
0
2
4
Y [m]
X [m]
Z [m
]
FP1
FP2
FP3
FP4
FP5
FP6
O1
O2 O3
O4
(b)
Figure 2: Monitoring of the theatre ceiling: (a) monitoring network and (b) object point O4.
The basic requirements for the monitoring system are defined in cooperation with management and structural engineers. This includes a measuring rate of Δt = 10 min and an automated alarm function (by email or SMS) if predefined tolerances TI = ±25 mm in construction phase I and TII = ±12 mm in phase II are exceeded. TI is the maximum tolerable
TS 1F – Deformation Measurement Andreas Eichhorn, Johannes Fabiankowitsch, Michaela Haberler-Weber, Alexander Reiterer Analysis of Thermal Deformations of an Arched Theatre Ceiling FIG Working Week 2007 Hong Kong, China, May 13-17, 2007
4/13
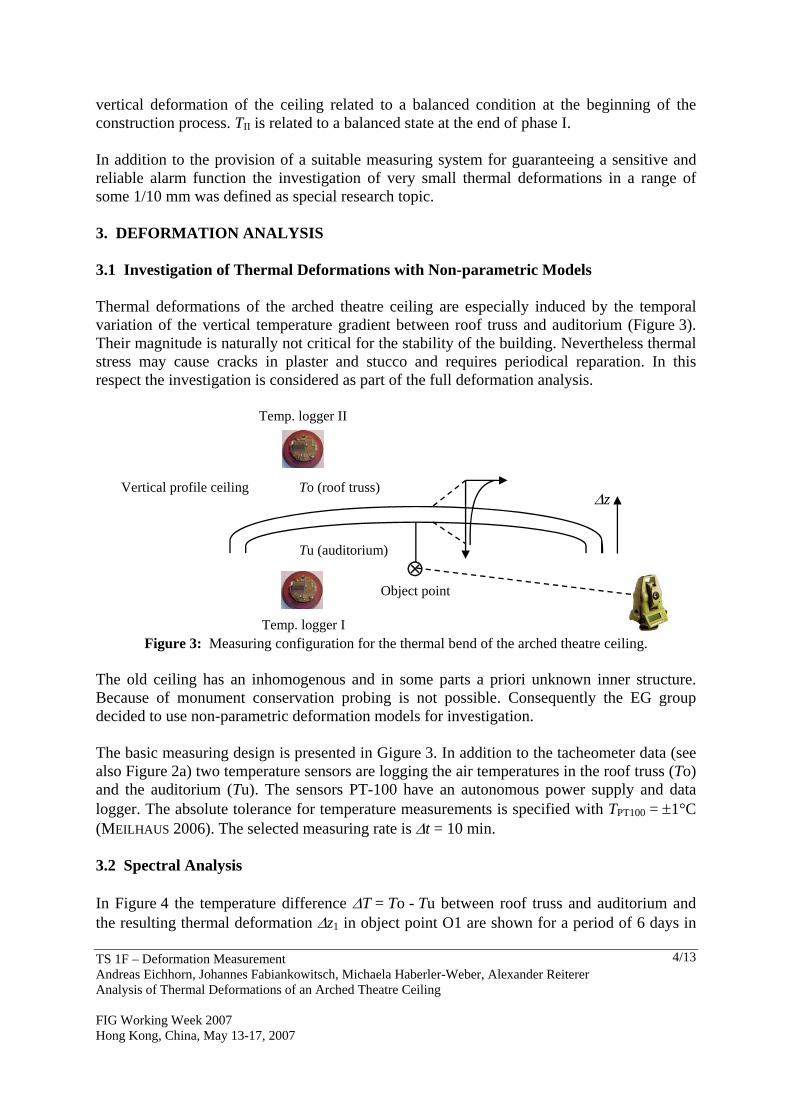
vertical deformation of the ceiling related to a balanced condition at the beginning of the construction process. TII is related to a balanced state at the end of phase I. In addition to the provision of a suitable measuring system for guaranteeing a sensitive and reliable alarm function the investigation of very small thermal deformations in a range of some 1/10 mm was defined as special research topic. 3. DEFORMATION ANALYSIS 3.1 Investigation of Thermal Deformations with Non-parametric Models Thermal deformations of the arched theatre ceiling are especially induced by the temporal variation of the vertical temperature gradient between roof truss and auditorium (Figure 3). Their magnitude is naturally not critical for the stability of the building. Nevertheless thermal stress may cause cracks in plaster and stucco and requires periodical reparation. In this respect the investigation is considered as part of the full deformation analysis.
Vertical profile ceilingΔz
To (roof truss)
Tu (auditorium)⊗
Object point
Temp. logger I
Temp. logger II
Figure 3: Measuring configuration for the thermal bend of the arched theatre ceiling.
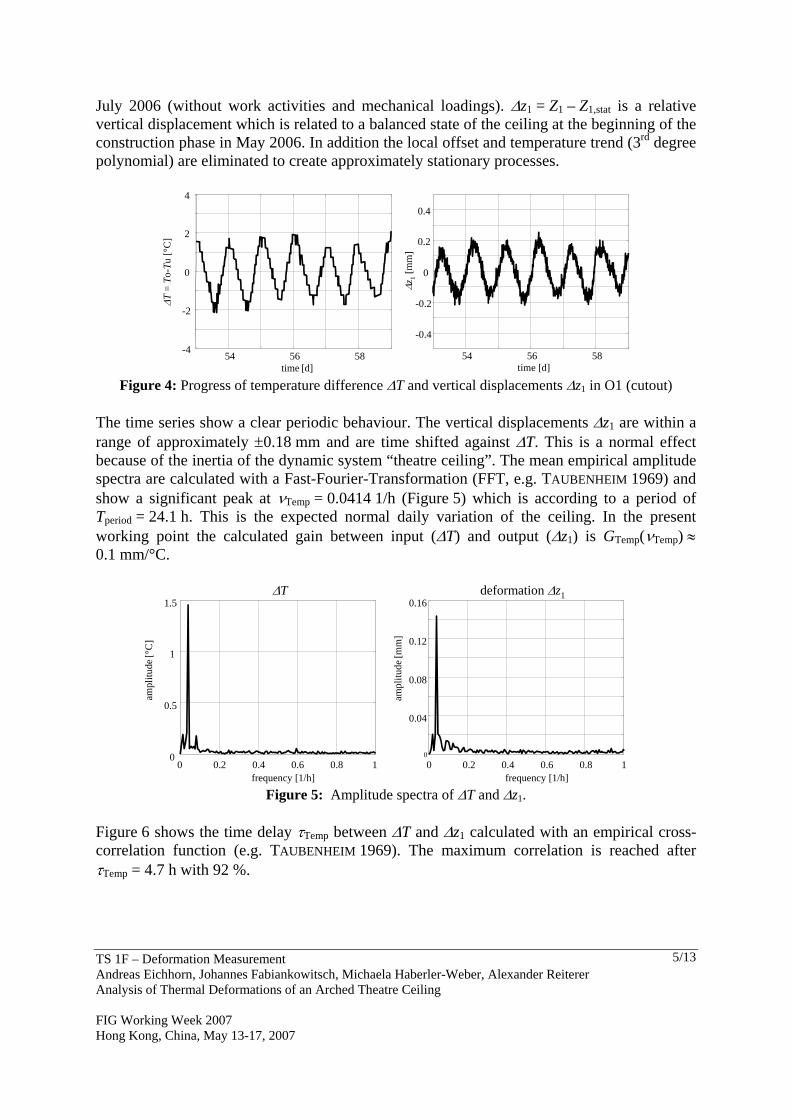
The old ceiling has an inhomogenous and in some parts a priori unknown inner structure. Because of monument conservation probing is not possible. Consequently the EG group decided to use non-parametric deformation models for investigation. The basic measuring design is presented in Gigure 3. In addition to the tacheometer data (see also Figure 2a) two temperature sensors are logging the air temperatures in the roof truss (To) and the auditorium (Tu). The sensors PT-100 have an autonomous power supply and data logger. The absolute tolerance for temperature measurements is specified with TPT100 = ±1°C (MEILHAUS 2006). The selected measuring rate is Δt = 10 min. 3.2 Spectral Analysis In Figure 4 the temperature difference ΔT = To - Tu between roof truss and auditorium and the resulting thermal deformation Δz1 in object point O1 are shown for a period of 6 days in
TS 1F – Deformation Measurement Andreas Eichhorn, Johannes Fabiankowitsch, Michaela Haberler-Weber, Alexander Reiterer Analysis of Thermal Deformations of an Arched Theatre Ceiling FIG Working Week 2007 Hong Kong, China, May 13-17, 2007
5/13
July 2006 (without work activities and mechanical loadings). Δz1 = Z1 – Z1,stat is a relative vertical displacement which is related to a balanced state of the ceiling at the beginning of the construction phase in May 2006. In addition the local offset and temperature trend (3rd degree polynomial) are eliminated to create approximately stationary processes.
54 56 58-4
-2
0
2
4
time [d]
ΔT=
To-T
u [°
C]
54 56 58
-0.4
-0.2
0
0.2
0.4
time [d]
Δz1
[mm
]
Figure 4: Progress of temperature difference ΔT and vertical displacements Δz1 in O1 (cutout)
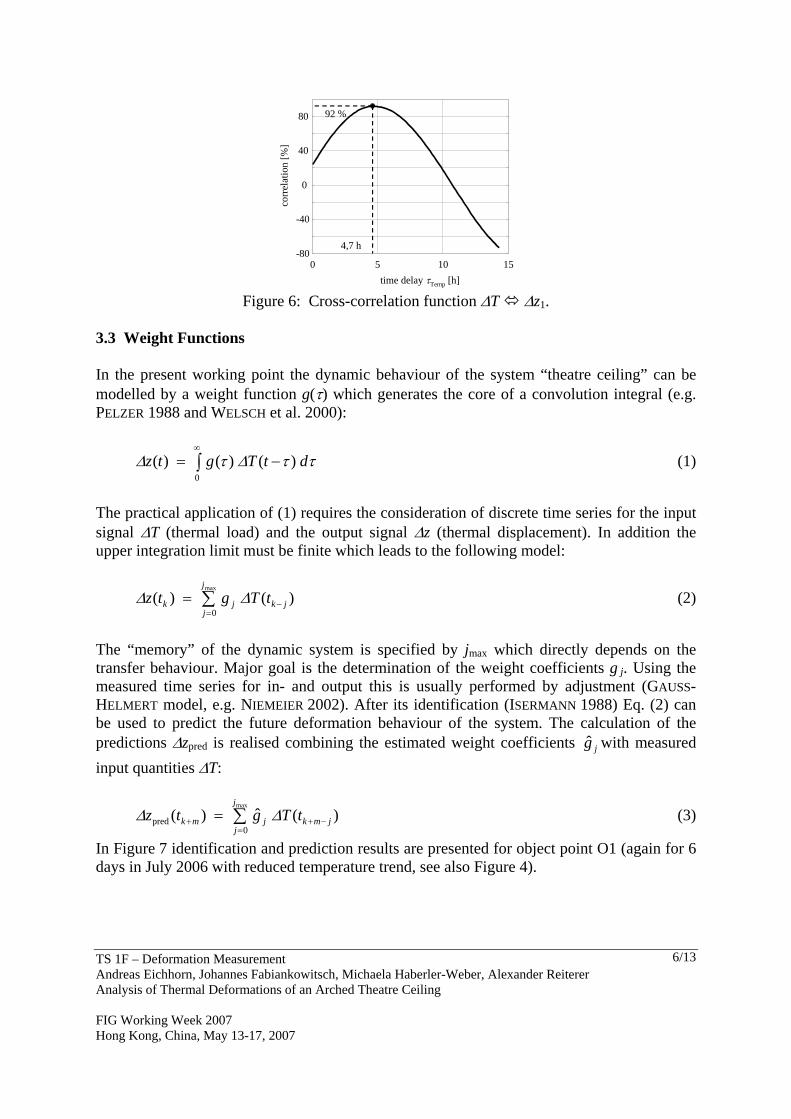
The time series show a clear periodic behaviour. The vertical displacements Δz1 are within a range of approximately ±0.18 mm and are time shifted against ΔT. This is a normal effect because of the inertia of the dynamic system “theatre ceiling”. The mean empirical amplitude spectra are calculated with a Fast-Fourier-Transformation (FFT, e.g. TAUBENHEIM 1969) and show a significant peak at νTemp = 0.0414 1/h (Figure 5) which is according to a period of Tperiod = 24.1 h. This is the expected normal daily variation of the ceiling. In the present working point the calculated gain between input (ΔT) and output (Δz1) is GTemp(νTemp) ≈ 0.1 mm/°C.
0 0.2 0.4 0.6 0.8 10
0.5
1
1.5
frequency [1/h]
ampl
itude
[°C
]
0 0.2 0.4 0.6 0.8 10
0.04
0.08
0.12
0.16
frequency [1/h]
ampl
itude
[mm
]
ΔT deformation Δz1
Figure 5: Amplitude spectra of ΔT and Δz1.
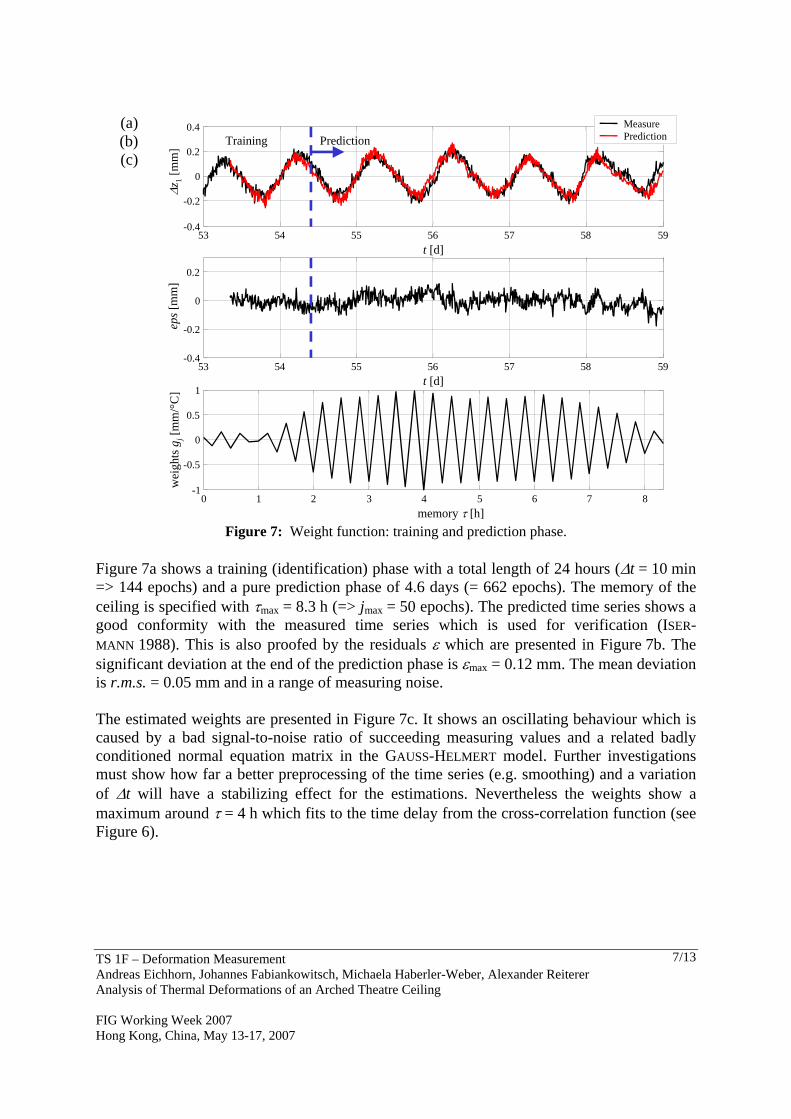
Figure 6 shows the time delay τTemp between ΔT and Δz1 calculated with an empirical cross-correlation function (e.g. TAUBENHEIM 1969). The maximum correlation is reached after τTemp = 4.7 h with 92 %.
TS 1F – Deformation Measurement Andreas Eichhorn, Johannes Fabiankowitsch, Michaela Haberler-Weber, Alexander Reiterer Analysis of Thermal Deformations of an Arched Theatre Ceiling FIG Working Week 2007 Hong Kong, China, May 13-17, 2007
6/13
0 5 10 15-80
-40
0
40
80
time delay τTemp [h]co
rrel
atio
n [%
]
4,7 h
92 %
Figure 6: Cross-correlation function ΔT Δz1.
3.3 Weight Functions In the present working point the dynamic behaviour of the system “theatre ceiling” can be modelled by a weight function g(τ) which generates the core of a convolution integral (e.g. PELZER 1988 and WELSCH et al. 2000):
∫∞
−=0
)()()( ττΔτΔ dtTgtz (1)
The practical application of (1) requires the consideration of discrete time series for the input signal ΔT (thermal load) and the output signal Δz (thermal displacement). In addition the upper integration limit must be finite which leads to the following model:
)()(max
0jk
j
jjk tTgtz −
=∑= ΔΔ (2)
The “memory” of the dynamic system is specified by jmax which directly depends on the transfer behaviour. Major goal is the determination of the weight coefficients g j. Using the measured time series for in- and output this is usually performed by adjustment (GAUSS-HELMERT model, e.g. NIEMEIER 2002). After its identification (ISERMANN 1988) Eq. (2) can be used to predict the future deformation behaviour of the system. The calculation of the predictions Δzpred is realised combining the estimated weight coefficients jg with measured input quantities ΔT:
)(ˆ)(max
0pred jmk
j
jjmk tTgtz −+
=+ ∑= ΔΔ (3)
In Figure 7 identification and prediction results are presented for object point O1 (again for 6 days in July 2006 with reduced temperature trend, see also Figure 4).
TS 1F – Deformation Measurement Andreas Eichhorn, Johannes Fabiankowitsch, Michaela Haberler-Weber, Alexander Reiterer Analysis of Thermal Deformations of an Arched Theatre Ceiling FIG Working Week 2007 Hong Kong, China, May 13-17, 2007
7/13
(a) (b) (c)
53 54 55 56 57 58 59-0.4
-0.2
0
0.2
0.4
t [d]
Δz1
[mm
]
MeasurePrediction
53 54 55 56 57 58 59-0.4
-0.2
0
0.2
t [d]
eps[
mm
]
0 1 2 3 4 5 6 7 8-1
-0.5
0
0.5
1
memory τ [h]
wei
ghts
g j[m
m/°
C]
Training Prediction
Figure 7: Weight function: training and prediction phase.
Figure 7a shows a training (identification) phase with a total length of 24 hours (Δt = 10 min => 144 epochs) and a pure prediction phase of 4.6 days (= 662 epochs). The memory of the ceiling is specified with τmax = 8.3 h (=> jmax = 50 epochs). The predicted time series shows a good conformity with the measured time series which is used for verification (ISER-MANN 1988). This is also proofed by the residuals ε which are presented in Figure 7b. The significant deviation at the end of the prediction phase is εmax = 0.12 mm. The mean deviation is r.m.s. = 0.05 mm and in a range of measuring noise. The estimated weights are presented in Figure 7c. It shows an oscillating behaviour which is caused by a bad signal-to-noise ratio of succeeding measuring values and a related badly conditioned normal equation matrix in the GAUSS-HELMERT model. Further investigations must show how far a better preprocessing of the time series (e.g. smoothing) and a variation of Δt will have a stabilizing effect for the estimations. Nevertheless the weights show a maximum around τ = 4 h which fits to the time delay from the cross-correlation function (see Figure 6).
TS 1F – Deformation Measurement Andreas Eichhorn, Johannes Fabiankowitsch, Michaela Haberler-Weber, Alexander Reiterer Analysis of Thermal Deformations of an Arched Theatre Ceiling FIG Working Week 2007 Hong Kong, China, May 13-17, 2007
8/13
3.4 Neural Networks 3.4.1 Basics Artificial neural networks (ANN) are based on a different approach of problem solving in comparison with conventional computer software. Conventional software uses an algorithmic approach – the program follows a set of instructions in order to solve the problem. A condition to implement a problem as an algorithmic approach is that the specific problem solving steps are known. The disadvantage of such program systems is that the problem solving capability is restricted to problems that we already understand, from which we know how to solve them and to problems for which we can formulate a solving algorithm. ANN process information in a similar way the human brain does. The network consists of a set of highly interconnected processing elements, the so-called neurons. ANN cannot be programmed to solve a specific problem – they learn by examples. The disadvantage of such an approach is that the network finds out how to solve the problem by itself, therefore the user receives no declaration how the problem was solved. Furthermore neural networks operations can be unpredictable. The most basic components of artificial neural networks are modeled after the structure of the human brain. Therefore artificial neural networks have a strong similarity to the (biological) brain and most of the terminology is borrowed from neuroscience. ANN are a simple clustering of artificial neurons. These networks are subdivided into layers, which are then connected among each other. Basically, all artificial neural networks have a similar structure and consist of three types of layers: (1) input layer represents the first interface to the real world (to receive the inputs); (2) output layer represents the second interface to the real world (to provide the network’s outputs); (3) hidden layer represents the rest of the network (to transform the information from the input layer to the output layer). The single artificial neurons are connected (normally unidirectional) via a network of paths. Each neuron receives inputs from many other neurons, but produces a single output, which is communicated to other neurons. There exist different types of connections between neurons (fully connected, partially connected and others) – we use a fully connected feed forward network, by which each neuron on the first layer is connected to every neuron on the second layer. The neurons on the first layer send their output to the neurons on the second layer, but they do not receive any input back form the neurons on the second layer. More detail about artificial neural networks and their application can be found in ZELL (1994) and BISHOP (1995)1. 1 It is notable that all experiments have been done with SNNS (Stuttgart Neural Network Simulator). SNNS is a software simulator for neural networks developed at the Institute for Parallel and Distributed High Performance Systems (IPVR) at the University of Stuttgart.
TS 1F – Deformation Measurement Andreas Eichhorn, Johannes Fabiankowitsch, Michaela Haberler-Weber, Alexander Reiterer Analysis of Thermal Deformations of an Arched Theatre Ceiling FIG Working Week 2007 Hong Kong, China, May 13-17, 2007
9/13
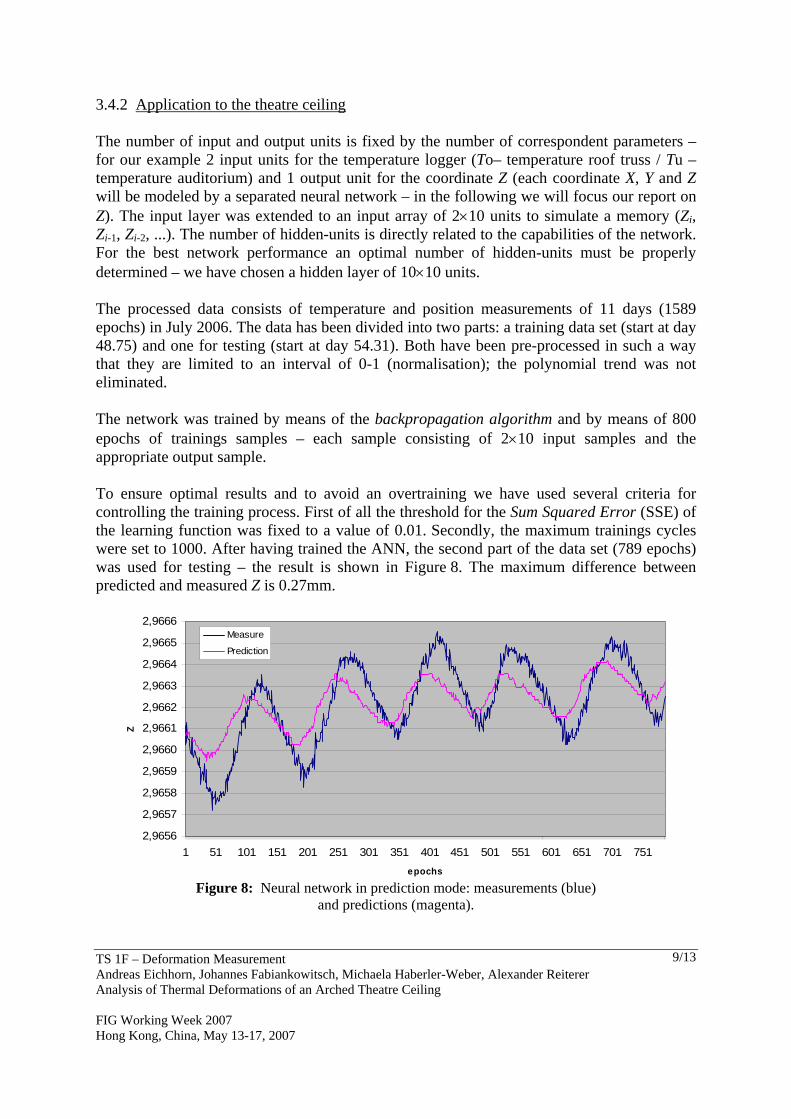
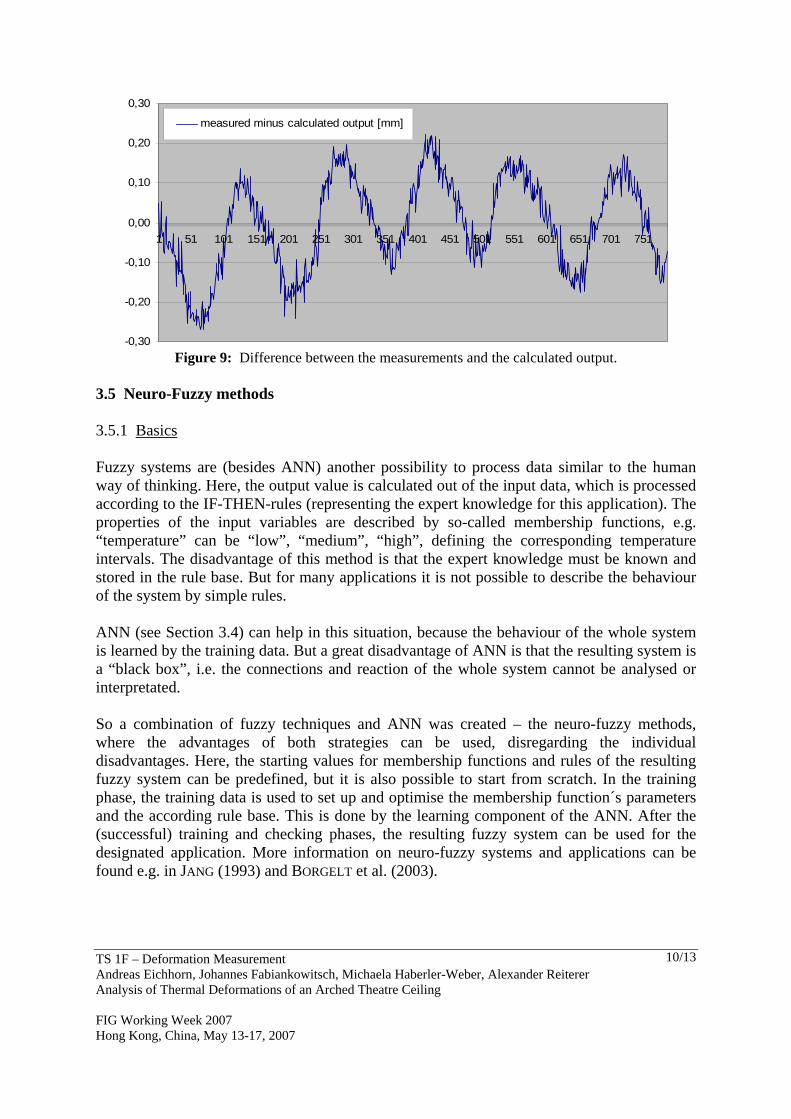
3.4.2 Application to the theatre ceiling The number of input and output units is fixed by the number of correspondent parameters – for our example 2 input units for the temperature logger (To– temperature roof truss / Tu – temperature auditorium) and 1 output unit for the coordinate Z (each coordinate X, Y and Z will be modeled by a separated neural network – in the following we will focus our report on Z). The input layer was extended to an input array of 2×10 units to simulate a memory (Zi, Zi-1, Zi-2, ...). The number of hidden-units is directly related to the capabilities of the network. For the best network performance an optimal number of hidden-units must be properly determined – we have chosen a hidden layer of 10×10 units. The processed data consists of temperature and position measurements of 11 days (1589 epochs) in July 2006. The data has been divided into two parts: a training data set (start at day 48.75) and one for testing (start at day 54.31). Both have been pre-processed in such a way that they are limited to an interval of 0-1 (normalisation); the polynomial trend was not eliminated. The network was trained by means of the backpropagation algorithm and by means of 800 epochs of trainings samples – each sample consisting of 2×10 input samples and the appropriate output sample. To ensure optimal results and to avoid an overtraining we have used several criteria for controlling the training process. First of all the threshold for the Sum Squared Error (SSE) of the learning function was fixed to a value of 0.01. Secondly, the maximum trainings cycles were set to 1000. After having trained the ANN, the second part of the data set (789 epochs) was used for testing – the result is shown in Figure 8. The maximum difference between predicted and measured Z is 0.27mm.
2,9656
2,9657
2,9658
2,9659
2,9660
2,9661
2,9662
2,9663
2,9664
2,9665
2,9666
1 51 101 151 201 251 301 351 401 451 501 551 601 651 701 751epochs
Z
Measure
Prediction
Figure 8: Neural network in prediction mode: measurements (blue)
and predictions (magenta).
TS 1F – Deformation Measurement Andreas Eichhorn, Johannes Fabiankowitsch, Michaela Haberler-Weber, Alexander Reiterer Analysis of Thermal Deformations of an Arched Theatre Ceiling FIG Working Week 2007 Hong Kong, China, May 13-17, 2007
10/13
-0,30
-0,20
-0,10
0,00
0,10
0,20
0,30
1 51 101 151 201 251 301 351 401 451 501 551 601 651 701 751
measured minus calculated output [mm]
Figure 9: Difference between the measurements and the calculated output.
3.5 Neuro-Fuzzy methods 3.5.1 Basics Fuzzy systems are (besides ANN) another possibility to process data similar to the human way of thinking. Here, the output value is calculated out of the input data, which is processed according to the IF-THEN-rules (representing the expert knowledge for this application). The properties of the input variables are described by so-called membership functions, e.g. “temperature” can be “low”, “medium”, “high”, defining the corresponding temperature intervals. The disadvantage of this method is that the expert knowledge must be known and stored in the rule base. But for many applications it is not possible to describe the behaviour of the system by simple rules. ANN (see Section 3.4) can help in this situation, because the behaviour of the whole system is learned by the training data. But a great disadvantage of ANN is that the resulting system is a “black box”, i.e. the connections and reaction of the whole system cannot be analysed or interpretated. So a combination of fuzzy techniques and ANN was created – the neuro-fuzzy methods, where the advantages of both strategies can be used, disregarding the individual disadvantages. Here, the starting values for membership functions and rules of the resulting fuzzy system can be predefined, but it is also possible to start from scratch. In the training phase, the training data is used to set up and optimise the membership function´s parameters and the according rule base. This is done by the learning component of the ANN. After the (successful) training and checking phases, the resulting fuzzy system can be used for the designated application. More information on neuro-fuzzy systems and applications can be found e.g. in JANG (1993) and BORGELT et al. (2003).
TS 1F – Deformation Measurement Andreas Eichhorn, Johannes Fabiankowitsch, Michaela Haberler-Weber, Alexander Reiterer Analysis of Thermal Deformations of an Arched Theatre Ceiling FIG Working Week 2007 Hong Kong, China, May 13-17, 2007
11/13
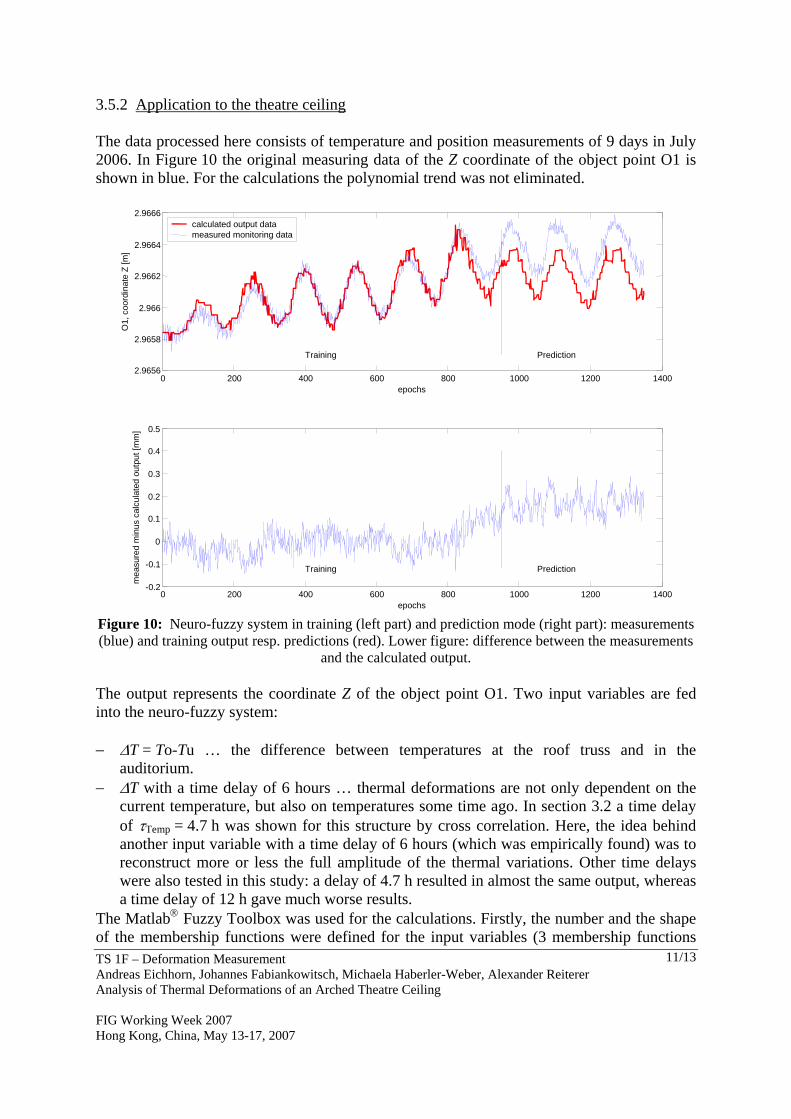
3.5.2 Application to the theatre ceiling The data processed here consists of temperature and position measurements of 9 days in July 2006. In Figure 10 the original measuring data of the Z coordinate of the object point O1 is shown in blue. For the calculations the polynomial trend was not eliminated.
0 200 400 600 800 1000 1200 14002.9656
2.9658
2.966
2.9662
2.9664
2.9666
epochs
O1,
coor
dina
teZ
[m]
Training Prediction
calculated output datameasured monitoring data
0 200 400 600 800 1000 1200 1400-0.2
-0.1
0
0.1
0.2
0.3
0.4
0.5
epochs
mea
sure
dm
inus
calc
ulat
ed o
utpu
t[m
m]
Training Prediction
Figure 10: Neuro-fuzzy system in training (left part) and prediction mode (right part): measurements (blue) and training output resp. predictions (red). Lower figure: difference between the measurements
and the calculated output. The output represents the coordinate Z of the object point O1. Two input variables are fed into the neuro-fuzzy system: − ΔT = To-Tu … the difference between temperatures at the roof truss and in the
auditorium. − ΔT with a time delay of 6 hours … thermal deformations are not only dependent on the
current temperature, but also on temperatures some time ago. In section 3.2 a time delay of τTemp = 4.7 h was shown for this structure by cross correlation. Here, the idea behind another input variable with a time delay of 6 hours (which was empirically found) was to reconstruct more or less the full amplitude of the thermal variations. Other time delays were also tested in this study: a delay of 4.7 h resulted in almost the same output, whereas a time delay of 12 h gave much worse results.
The Matlab® Fuzzy Toolbox was used for the calculations. Firstly, the number and the shape of the membership functions were defined for the input variables (3 membership functions
TS 1F – Deformation Measurement Andreas Eichhorn, Johannes Fabiankowitsch, Michaela Haberler-Weber, Alexander Reiterer Analysis of Thermal Deformations of an Arched Theatre Ceiling FIG Working Week 2007 Hong Kong, China, May 13-17, 2007
12/13
each, of type “Gaussian bell function”). The shape and the other parameters of these membership functions were optimised by the neuro-fuzzy network within the training phase by a hybrid algorithm, which is a combination of least-squares method and the backpropagation gradient descent method. For the training, 950 pairs of input and output data with a time interval of 10 minutes were used. After the training phase, checking data was processed in the resulting fuzzy system to get an idea of the quality of the system. In Figure 10 the measured and the calculated output is shown (in blue resp. in red) for the training data (“Training” in the left part) and the checking data (“Prediction” in the right part). The lower figure shows the difference between the measured and the calculated values; the maximum difference is 0.28 mm within the prediction phase. Analysing the predicted data it can be seen that the phase and the amplitude of the thermal variations can be predicted very well; a problem occurs at the end of the training data where there is a stronger increase of Z compared to the other periods before. This results in a vertical shift of about 0.2 mm of the predicted output compared to the measured data. This effect has to be investigated in more detail in future. 4. CONCLUSIONS Modelling of thermal displacements works well for the stationary part of the deformation signals (Z resp. Δz). The residuals are within the range of the noise of the measuring quantities. For this special case (harmonic oscillations) no recommendation for the optimal model can be made. As shown in Figures 8 and 10 the temperature trend produces systematic effects in the residuals. With the existing temperature data (restricted to a short interval in July) it is not possible to improve the models (e.g. varying length of training data) and to fully explain the behaviour of the system. At the moment additional temperature and displacement data is collected for further investigations. REFERENCES BISHOP, C.M. (1995), Neural Networks for Pattern Recognition, 1st Ed., Oxford University Press BORGELT, C., F. KLAWONN, R. KRUSE and D. NAUCK (2003), Neuro-Fuzzy-Systeme, 3rd ed., Vieweg Verlag ISERMANN, R. (1988), Identifikation dynamischer Systeme, Band 1, Springer-Verlag, Berlin Heidelberg New York London Paris Tokyo JANG, J. (1993), ANFIS: Adaptive-Network-Based Fuzzy Inference System, IEEE Trans-actions on systems, man, and cybernetics, Vol. 23, No. 3, pp. 665-685 MEILHAUS (2006), http://meilhaus.de/pdf/mezd.pdf, last access 02/07 NIEMEIER, W. (2002): Ausgleichungsrechnung, Walter de Gruyter, Berlin / New York PELZER, H. (1988), Ingenieurvermessung: Deformationsmessungen, Massenberechnungen. Wittwer, Stuttgart

TS 1F – Deformation Measurement Andreas Eichhorn, Johannes Fabiankowitsch, Michaela Haberler-Weber, Alexander Reiterer Analysis of Thermal Deformations of an Arched Theatre Ceiling FIG Working Week 2007 Hong Kong, China, May 13-17, 2007
13/13
RONACHER (2006), http://www.ronacher-funktionssanierung.at/, last access 02/07 TAUBENHEIM, J. (1969), Statistische Auswertung geophysikalischer und meteorologischer Daten, Akademische Verlagsgesellschaft Geest & Portig K.-G., Leipzig WELSCH, W., O. HEUNECKE and H. KUHLMANN (2000), Auswertung geodätischer Überwa-chungsmessungen. Handbuch der Ingenieurgeodäsie, Wichmann, Heidelberg ZELL, A. (1994), Simulation Neuronaler Netze, 1st Ed., Addison-Wesley BIOGRAPHICAL NOTES Dr. Andreas Eichhorn Since 2003: University Assistant at Institute for Geodesy & Geophysics, Engineering Geo-desy, Vienna University of Technology, Austria 1996-2002: Research assistant at IAGB, University of Stuttgart, Germany 1990-1996: Studies in geodesy, University of Karlsruhe, Germany Dr. Johannes Fabiankowitsch Since 1996: University Assistant at the Institute of Geodesy and Geophysics, Research group Engineering Geodesy, Vienna University of Technology From 1990-1996: Private Industry From 1980-1990: University Assistant at the Institute of Geodesy and Land Surveying, Research group Geodesy, Vienna University of Technology 1973-1980: Studies in geodesy, Vienna University of Technology, Austria Dr. Michaela Haberler-Weber Since 2000: University Assistant at the Institute of Geodesy and Geophysics, Research group Engineering Geodesy, Vienna University of Technology 1995-2000: Studies in geodesy, Vienna University of Technology, Austria Dr. Alexander Reiterer Since 2004: University Assistant at Institute for Geodesy & Geophysics, Engineering Geo-desy, Vienna University of Technology, Austria 2001-2004: Research Member, Department of Applied & Engineering Geodesy, Vienna University of Technology, Austria. 1994-2001: Studies in geodesy, Vienna University of Technology, Austria. CONTACT Dr. Andreas Eichhorn Institute for Geodesy and Geophysics, Engineering Geodesy, Vienna University of Techno-logy Gusshausstr. 27-29 1040 Vienna AUSTRIA Tel. +43-1-58801-12842 Fax + 43-1-58801-12894 Email: [email protected] Web site: http://info.tuwien.ac.at/ingeo/


![arXiv:1610.08430v2 [math.RA] 30 Oct 2019 · 2019-10-31 · arXiv:1610.08430v2 [math.RA] 30 Oct 2019 SINGULARITY CATEGORIES OF DEFORMATIONS OF KLEINIAN SINGULARITIES SIMON CRAWFORD](https://static.fdocument.org/doc/165x107/5e7aa4dd43e4844480775b73/arxiv161008430v2-mathra-30-oct-2019-2019-10-31-arxiv161008430v2-mathra.jpg)