An MRI-based classification scheme to predict … MRI-based classification scheme to predict passive...
7
An MRI-based classification scheme to predict passive access of 5 to 50 nm large nanoparticles to tumors. Anastassia Karageorgis 1 , 2§, Sandrine Dufort 1, 2, 3§ , Lucie Sancey 1,2 §# , Maxime Henry 1, 2 , Samuli Hirsjärvi 4 , Catherine Passirani 4 , Jean-Pierre Benoit 4 , Julien Gravier 5, 6Δ , Isabelle Texier 5, 6 , Olivier Montigon 2, 7 , Mériem Benmerad 1, 2 , Valérie Siroux 1, 2 , Emmanuel L. Barbier 2, 7 , Jean-Luc Coll 1, 2 * Supplementary Figure 1: Examples of images obtained with the different MRI sequences for each tumor model. Anatomical view (T2-weighted); Apparent Diffusion Coefficient (ADC) map; Vessel Size Index (VSI); Blood Volume fraction (BVf).
Transcript of An MRI-based classification scheme to predict … MRI-based classification scheme to predict passive...
An MRI-based classification scheme to predict passive access of 5 to 50 nm large nanoparticles to tumors. Anastassia Karageorgis1, 2§, Sandrine Dufort1, 2, 3§, Lucie Sancey1,2 §#, Maxime Henry1, 2,
Samuli Hirsjärvi4, Catherine Passirani4, Jean-Pierre Benoit4, Julien Gravier5, 6Δ, Isabelle
Texier5, 6, Olivier Montigon2, 7, Mériem Benmerad1, 2, Valérie Siroux1, 2, Emmanuel L.
Barbier2, 7, Jean-Luc Coll1, 2 *
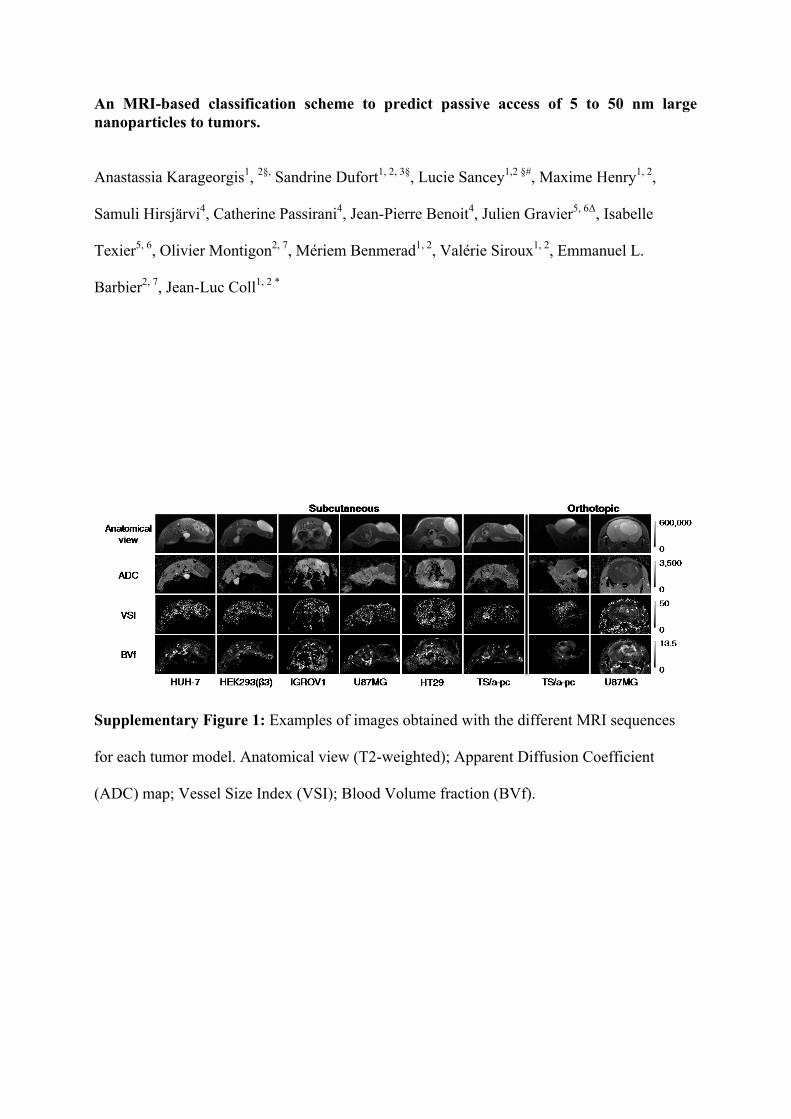
Supplementary Figure 1: Examples of images obtained with the different MRI sequences
for each tumor model. Anatomical view (T2-weighted); Apparent Diffusion Coefficient
(ADC) map; Vessel Size Index (VSI); Blood Volume fraction (BVf).
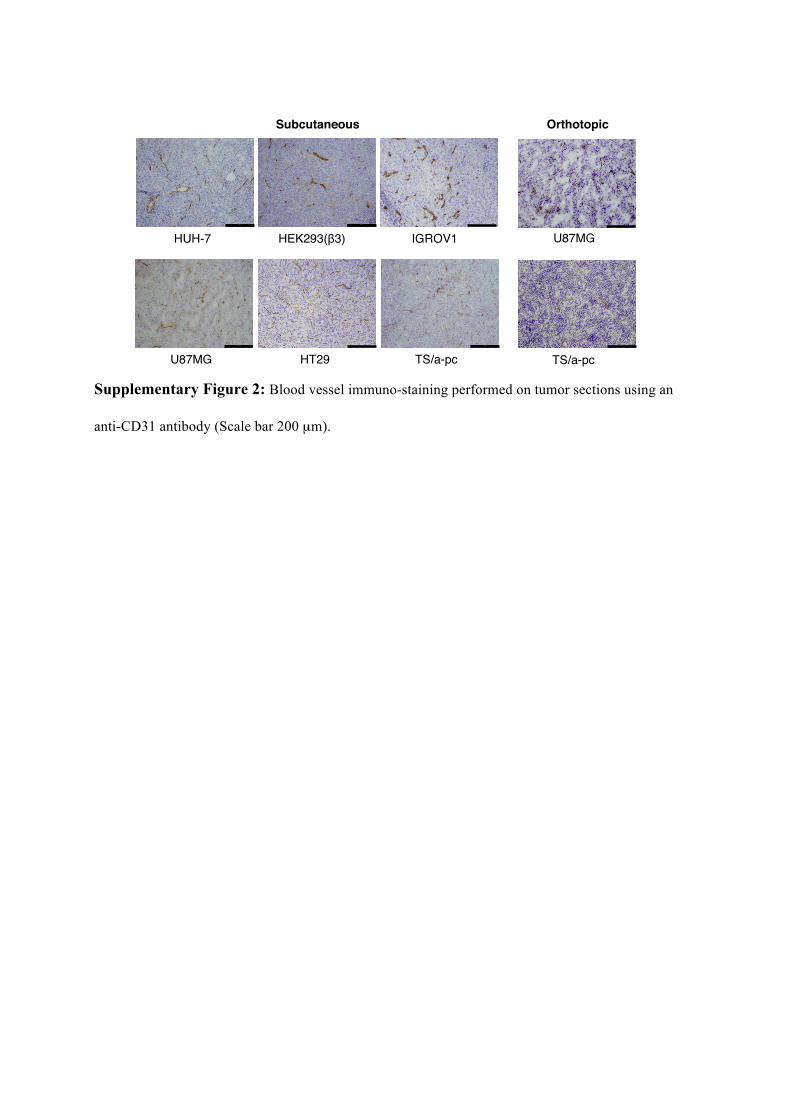
Supplementary Figure 2: Blood vessel immuno-staining performed on tumor sections using an
anti-CD31 antibody (Scale bar 200 µm).
Subcutaneous Orthotopic
HUH-7 HEK293(β3) IGROV1 U87MG HT29 TS/A-pc TS/A-pc U87MGMRI vessel diameter 13.24 ± 1.14 13.12 ± 2.23 15.07 ± 1.85 12.84 ± 1.19 14.25 ± 1.54 12.72 ± 1.17 16.34 ± 1.63 13.19 ± 1.63
IHC vessel diameter 14.53 ± 0.27 11.71 ± 1.60 15.08 ± 1.98 10.40 ± 1.18 11.52 ± 0.86 8.93 ± 0.75 16.43 ± 3.87 9.96 ± 0.7
number of vessels 17.1 ± 6.6 17.9 ± 6.4 18.4 ± 6.4 31.4 ± 6.4 34.5 ± 8.6 40.3 ± 17.2 14.41 ± 6.92 46.56 ± 12.7
A
B
HUH-7
TS/a-pcU87MG HT29
HEK293(β3) IGROV1
Subcutaneous Orthotopic
TS/a-pc
U87MG
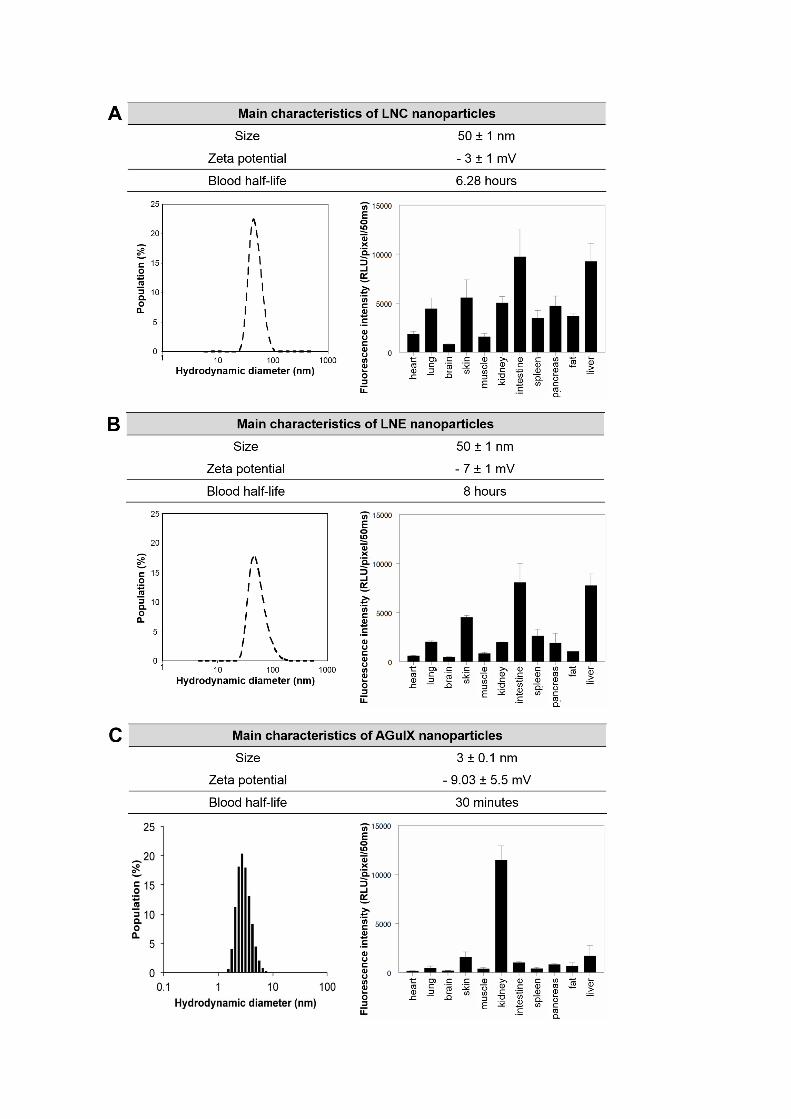
Supplementary Figure 3:
Characterization of the different nanoparticles’ properties. In addition to the average size and
hydrodynamic diameter, the electric charge is presented. Using fluorescence imaging after
systemic tail vein administration, the blood half-life and tissue accumulation were measured
in the mice’s organs 24 hours after LNCs, LNEs or USRPs intravenous injections (10 nmol of
dye).
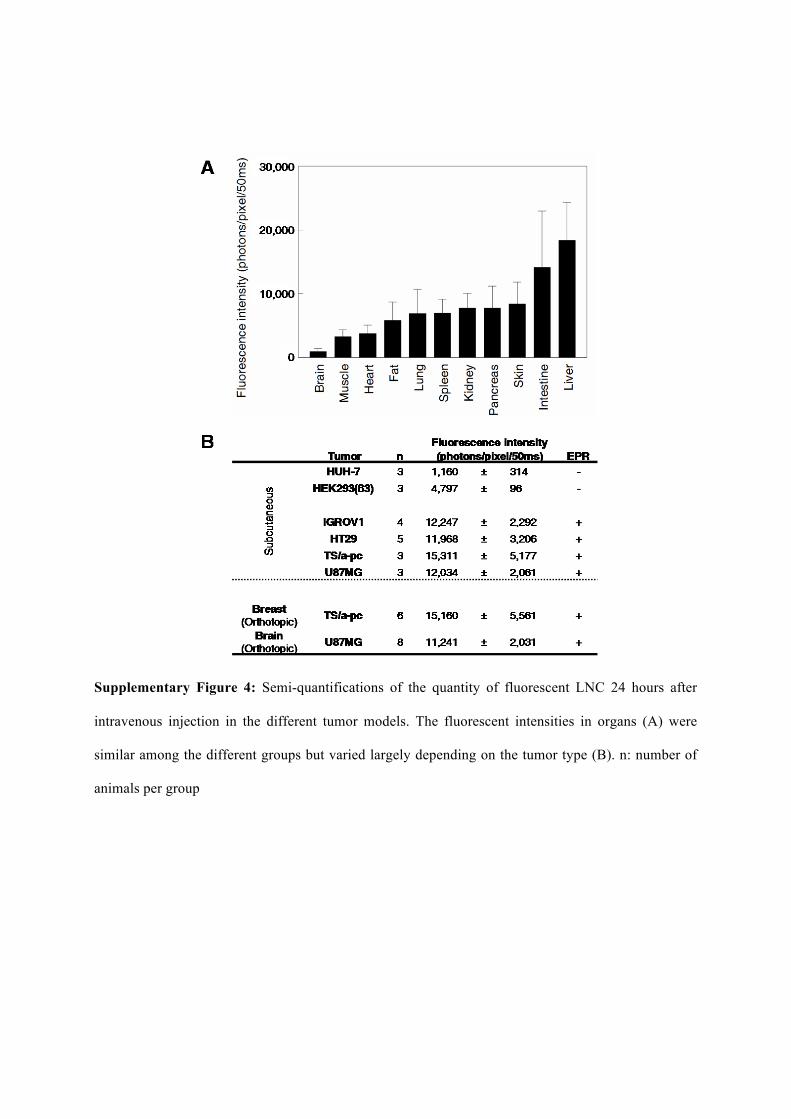
Supplementary Figure 4: Semi-quantifications of the quantity of fluorescent LNC 24 hours after
intravenous injection in the different tumor models. The fluorescent intensities in organs (A) were
similar among the different groups but varied largely depending on the tumor type (B). n: number of
animals per group
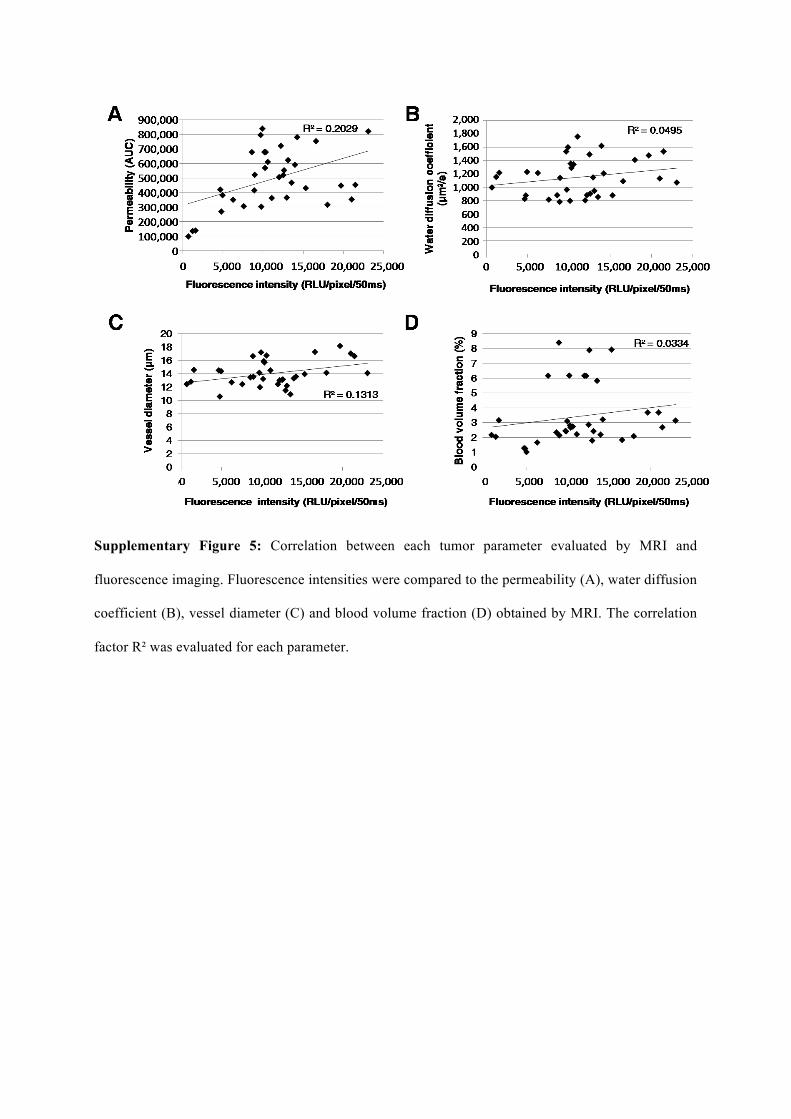
Supplementary Figure 5: Correlation between each tumor parameter evaluated by MRI and
fluorescence imaging. Fluorescence intensities were compared to the permeability (A), water diffusion
coefficient (B), vessel diameter (C) and blood volume fraction (D) obtained by MRI. The correlation
factor R² was evaluated for each parameter.
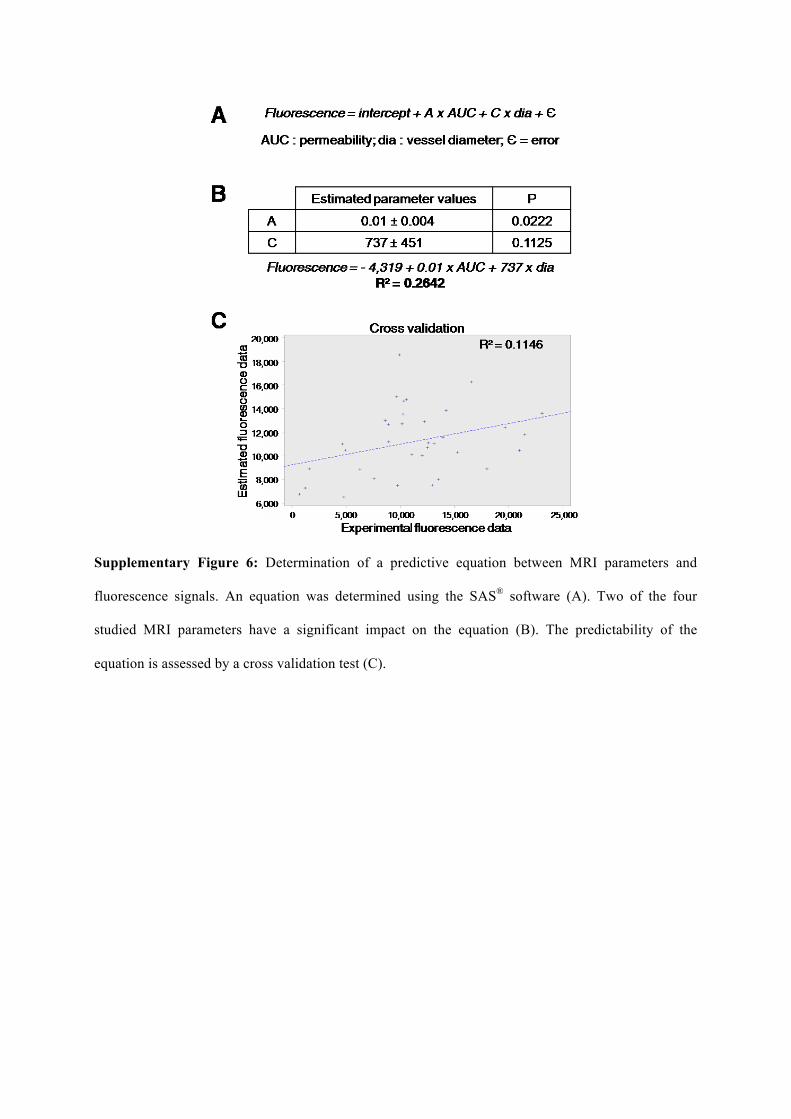
Supplementary Figure 6: Determination of a predictive equation between MRI parameters and
fluorescence signals. An equation was determined using the SAS® software (A). Two of the four
studied MRI parameters have a significant impact on the equation (B). The predictability of the
equation is assessed by a cross validation test (C).