Drafttube modellingfor predictionof pressure fluctuations ...
An Isosymmetric High-Pressure Phase Transition in α‑Glycylglycine:A Combined Experimental and Theoretical StudySamantha M. Clarke,*,† Brad A. Steele,*,† Matthew P. Kroonblawd,† Dongzhou Zhang,‡
I-Feng W. Kuo,† and Elissaios Stavrou†
†Physical and Life Sciences Directorate, Lawrence Livermore National Laboratory, P.O. Box 808, Livermore, California 94550,United States‡Partnership for Extreme Crystallography, University of Hawaii at Manoa, Argonne, Illinois 60439, United States
*S Supporting Information
ABSTRACT: We investigated the effects of hydrostaticpressure on α-glycylglycine (α-digly) using a combinedexperimental and theoretical approach. The results of powderX-ray diffraction show a change in compressibility of the axesabove 6.7 GPa, but also indicate that the structure remains inthe same monoclinic space group, suggesting an isosymmetricphase transition. A noticeable change in the Raman spectrabetween 6 and 7.5 GPa further supports the observed phasetransition. First-principles-based calculations combined withthe crystal structure prediction code USPEX predict a numberof possible polymorphs at high pressure. An orthorhombicstructure with a bent peptide backbone is the lowest enthalpypolymorph above 6.4 GPa; however, it is not consistent withexperimental observations. A second monoclinic structure isosymmetric to α-digly, α′-digly, is predicted to become more stableabove 11.4 GPa. The partial atomic charges in α′-digly differ from α-digly, and the molecule is bent, possibly indicating differentreactivity of α′-digly. The similarity in the lattice parameters predicted from calculations and the axial changes observedexperimentally support that the α′-digly phase is likely observed at high pressure. A possible explanation for the isosymmetricphase transition is discussed in terms of relaxing strained hydrogen bonding interactions. Such combined experimental andmodeling efforts provide atomic-level insight into how pressure-driven conformational changes alter hydrogen-bondingnetworks in complicated molecular crystals.
■ INTRODUCTION
Pressure is one of the fundamental physical variables that canaffect stability, induce phase transitions, and/or promoteoligomerization of biologically relevant molecules such asamino acids. Understanding the high-pressure behavior ofamino acids is of practical importance for applications in thepharmaceutical and food industries1 and is also fundamental toa number of theories on the origins of life. There is mountingevidence that moderate pressures in the kPa and MPa regimes,such as at hydrothermal vents, play a key role in promoting theoligomerization of amino acids.2−6 Substantially higher GParange pressures reached in impacting cometary ices couldplausibly lead to the synthesis7,8 and oligomerization9−11 ofamino acids and to the formation of complex polyaromaticmolecules.12 These hypotheses have sparked a number ofefforts to understand the role of pressure on the equations ofstate (EOS) and crystal structures of simple aminoacids.10,11,13−21 However, developing a detailed understandingof pressure as a thermodynamic driver for the formation oflarger biological precursors requires similar information for theproducts of amino acid oligomerization reactions, with the
simplest case being dipeptides formed through condensationreactions.Glycine (C2H5NO2) is the simplest amino acid and has been
studied at pressure extensively due to its importance as amodel system in many origins of life scenarios.16,17,20,22,23 Theproduct of the condensation reaction between two glycinemonomers is water and the simplest polypeptide, glycylglycine(herein termed digly), which contains just one achiral peptidebond.24,25 In comparison, digly has been studied much lessextensively at high pressures. At ambient conditions, it exhibitsrich polymorphism and exists in three forms designated α, β,and γ.26,27 The low yielding β- and γ-polymorphs haveattracted little attention since their first report in 1931. The α-polymorph, which is the most stable form at ambient pressure,crystallizes in the monoclinic space group P21/c. Similar toother zwitterionic dipeptides, the digly molecule crystallizes ina layered structure held together by hydrogen bonds (H-bonds). A single crystal neutron diffraction study by Kvick et
Received: July 31, 2019Revised: November 11, 2019Published: December 3, 2019
Article
pubs.acs.org/JPCBCite This: J. Phys. Chem. B 2020, 124, 1−10
© 2019 American Chemical Society 1 DOI: 10.1021/acs.jpcb.9b07313J. Phys. Chem. B 2020, 124, 1−10
Dow
nloa
ded
via
AR
GO
NN
E N
AT
L L
AB
OR
AT
OR
Y o
n M
arch
16,
202
0 at
19:
22:0
3 (U
TC
).Se
e ht
tps:
//pub
s.ac
s.or
g/sh
arin
ggui
delin
es f
or o
ptio
ns o
n ho
w to
legi
timat
ely
shar
e pu
blis
hed
artic
les.
al. in 1977 obtained precise information about the coordinatesof the hydrogen atoms in α-digly.28 Later work probed theRaman spectra of this molecule near standard conditions.29
Recently, Moggach et al. investigated the structure of α-diglyunder pressure and found the crystal structure to remain stableup to 4.7 GPa.20 They noted that their crystal specimen beganto “break up” above 5.4 GPa, which they attributed to apossible phase transition.Further investigation of the proposed phase transition in
digly and its high-pressure EOS is warranted for at least tworeasons. First, the high-pressure EOS is necessary forthermochemical modeling of oligomerization reactions andphase transitions in high-pressure origin of life scenarios.30
Second, molecules that exhibit multiple competing hydrogen-bonding (H-bonding) interactions such as digly are known toundergo a wide variety of transformations under pressure.1
Identifying and understanding these changes in H-bonding isimportant as it controls the packing of amino acids andproteins, allowing multiple phases and conformations withdifferent stabilities, solubilities, and physical properties.31
Insights gained from quantifying these changes in relativelysimple molecules such as digly could yield a more generalizedphysicochemical understanding that may be applicable to othersystems.High-pressure powder X-ray diffraction (PXRD) in a
diamond anvil cell (DAC) has become a common techniquefor studying the behavior of materials under extreme pressureconditions. It is straightforward to extract reliable unit cellparameters and observe compressibility changes that mayindicate structural phase transitions. Vibrational spectroscopytechniques, such as Raman, are also extremely useful forcharacterizing pressure-induced changes in materials. However,organic molecules often crystallize in low-symmetry forms,which makes it difficult to discern the exact nature of subtleconformational rearrangements or H-bonding changes at highpressures from these techniques. When high-pressure single-crystal or neutron diffraction experiments are impractical ortheir results inconclusive, computational chemistry offers avaluable route to predict crystal structures and help resolveexperimental uncertainties. Crystal structure prediction codessuch as USPEX combined with first-principles densityfunctional theory (DFT) calculations are particularly usefulfor determining enthalpic drivers for phase transitions whilesimultaneously yielding lattice parameters and atomic posi-tions.Here we present a combined experimental and theoretical
investigation of α-digly up to 14.5 GPa. Through synchrotronangle dispersive PXRD, we identify a change in thecompressibility of the unit cell axes above ∼6.7 GPa. Whilea discontinuity in the P−V curve is not observed, above thispressure there is a clear change in slope relative to DFTpredictions, which might indicate a change in compressibility.As there is no change in symmetry at the transition pressure,we hypothesize an isosymmetric phase transition occurs. Adistinct change in the high-frequency Raman spectra between 6and 7.5 GPa corroborates a change in bonding in this pressurerange. To investigate the stability of other potential high-pressure polymorphs, we perform a structure search using theevolutionary structural search algorithm USPEX, whichidentifies a stable high-pressure monoclinic structure, α′-digly. The structure of α′-digly differs from that of α-digly onlyby a slight conformational change involving a rotation of theterminal amine group and a change in the H-bonding network.
Quantum-based EOS calculations on both structures show thatα′-digly should exhibit a significantly longer c-axis compared toα-digly, which is in qualitative agreement with theexperimentally observed axial change in compressibility. Wehypothesize that α′-digly is indeed the phase we observeexperimentally.
■ METHODSExperiments. High-purity glycylglycine (Sigma-Aldrich,
>99.9% purity) was used for all experiments in this study.The polymorphic purity of the as-received samples wasconfirmed by PXRD at ambient conditions. The as-receivedpolycrystalline powder was ground to a fine powder in air usingan agate mortar and pestle prior to high-pressure PXRDexperiments. Rhenium gaskets, preindented to 40−45 μm thickby using 300 μm culets, were used to radially confine thesamples. Initial sample chamber diameters were ∼175 μm. Thesample and pressure sensors (gold and ruby) were loaded intoa DAC, which was high-pressure gas loaded with neon as ahydrostatic pressure transmitting medium (PTM).32 ForRaman experiments, argon was used as PTM. The samplechamber pressure was determined from the known ambienttemperature EOS of gold33 or ruby luminescence,34 and theerror in reported pressure is based on the variation of pressurewithin the cell.X-ray diffraction experiments were performed at beamlines
13-ID-D and 13-BM-C, GeoSoilEnviroCARS at the AdvancedPhoton Source, Argonne National Laboratory. At 13-ID-D, weused an incident wavelength of 0.2952 Å and an X-raydiameter of ∼2−4 μm, and powder diffraction images wereobtained on a Pilatus 1M CdTe detector. Additional details onthe XRD experimental setup are given in Prakapenka et al.35 At13-BM-C, we used an incident wavelength of 0.434 Å, an X-rayvertical × horizontal focus spot size of 20 μm × 15 μm, andcollected powder diffraction images on a MAR165 chargecoupled device (CCD) detector (Rayonix).36 All experimentaldiffraction data were integrated by using DIOPTAS to yieldscattering intensity vs 2θ patterns.37 Analysis of the X-raydiffraction patterns via Rietveld refinement was performed byusing GSAS II.38 Positional parameters were fixed due to thehigh background from the DAC and preferred orientationeffects of the crystallites. Crystal structure visualization wasperformed by using DIAMOND.39 The weighted EOS wasdetermined by using the program EosFit7c.40
Raman measurements were performed using the 514.5 nmline of an Ar ion laser for excitation in the backscatteringgeometry. The laser probe diameter was ∼2 μm. Ramanspectra were collected with a spectral resolution of 2 cm−1
using a single-stage grating spectrograph equipped with a liquidnitrogen cooled CCD array detector. Ultralow-frequencybandwidth solid-state notch filters allowed us to measureRaman spectra to within 10 cm−1 of the Rayleigh line.
Computations. Digly was investigated by using densityfunctional theory (DFT)41,42 as implemented in the Vienna Abinitio Simulation Package43 (VASP) using projector-aug-mented wave (PAW) pseudopotentials.44,45 The Perdew−Burke−Ernzerhof (PBE)46 generalized gradient approximationfunctional was used44,45 with the Grimme D2 empiricalcorrection (PBED2) to account for van der Waals forces thatare poorly described by DFT.47−49 PBE with van der Waalsempirical correction has previously been shown to yield fairlygood results compared to experiment for the EOS andvibrational properties of other CHNO molecular crystals.50,51
The Journal of Physical Chemistry B Article
DOI: 10.1021/acs.jpcb.9b07313J. Phys. Chem. B 2020, 124, 1−10
2
Because of the inadequate description of electron correlationand other effects, the PBE functional also typically over-estimates the length of covalent bonds and underestimates thelength of hydrogen bonds.52−54 An assessment on the accuracyof the PBE functional on H-bonded systems such as water hasbeen performed elsewhere.53−58
Optimized lattice parameters, atomic configurations, andhydrostatic pressure were obtained as a function of volumetriccompression ratio V/V0 at T = 0 K. The equilibrium volume V0was calculated at ambient pressure, and the volume wasreduced sequentially in increments of 0.02V0. The wavefunction was calculated with an 800 eV plane-wave energycutoff and k-point density of 0.05 Å−1 for the smallest volumestudied. The self-consistent field accuracy threshold was set to1 × 10−7 eV, and optimizations of the ionic degrees of freedomwere performed with a force-based accuracy threshold of 7 ×10⁻³ eV/Å. The zero-point energy (ZPE) contribution to theenergy and pressure was also calculated. The ZPE wascalculated at each volume increment through the quasi-harmonic approximation from the vibrational normal modesobtained at the Γ-point using the finite displacement methodimplemented in VASP VTST tools. Finite displacementcalculations were performed using the unit cell, which isquite large (lattice parameters 7−10 Å). However, it is possiblethat errors in the force associated with periodic images ofdisplacements are present. For this reason, we do not add thethermal contribution to the energy or pressure using the quasi-harmonic approximation because it will likely require a largersupercell which is too computationally expensive. Adding theZPE is intended to give better agreement with experimentwhile still being a tractable calculation. The pressure associatedwith the ZPE was added to the cold pressure to obtain theEOS. The ZPE pressure was calculated by taking the derivativeof the ZPE with respect to the volume.A molecular crystal structure search for possible polymorphs
of digly was performed at 10 GPa by using the first-principlesevolutionary crystal structure prediction method USPEX.59−61
The enthalpies were calculated with a similar DFT approachfor the USPEX search as for the EOS calculation describedabove, with exceptions noted below. The lattice parameters arealso measured in the XRD patterns which gives a goodestimate for the number of formula units. Therefore, the searchwas performed with 4 formula units (or digly molecules) in the
unit cell. This implies that only unit cells or primitive cells with4 formula units, or supercells with 1 or 2 formula units, areexplored in the search. While this implies that not everyconfiguration is explored (with a different number of formulaunits), 4 formula units covers a large portion of the energylandscape and is the same number of formula units containedin the α-digly unit cell. Using more formula units in the searchis prohibitive in terms of computational cost. Furthermore, inthe subset of structures that are explored we can identifywhether there exists energetically competitive structures athigh pressures. The search was performed with a populationsize of 50 for seven generations. A plane-wave energy cutoff of450 eV and k-point density of 0.08 Å−1 were used during thesearch for increased computational efficiency.
■ RESULTS AND DISCUSSION
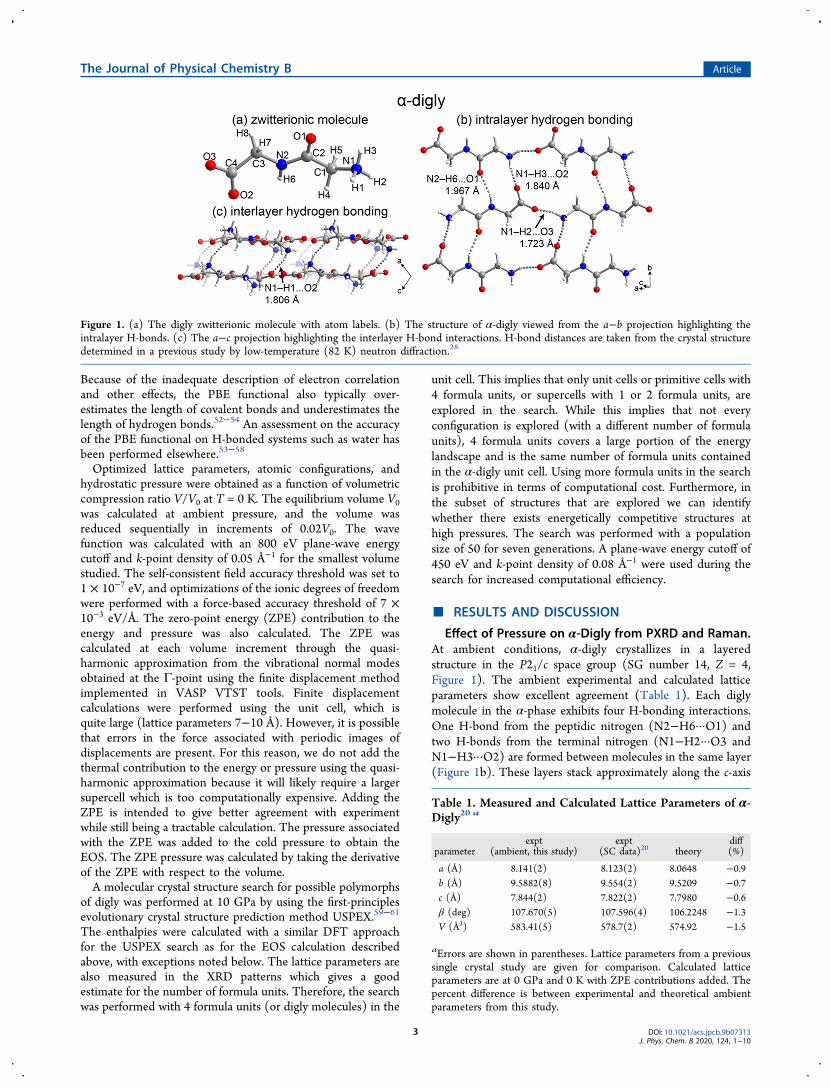
Effect of Pressure on α-Digly from PXRD and Raman.At ambient conditions, α-digly crystallizes in a layeredstructure in the P21/c space group (SG number 14, Z = 4,Figure 1). The ambient experimental and calculated latticeparameters show excellent agreement (Table 1). Each diglymolecule in the α-phase exhibits four H-bonding interactions.One H-bond from the peptidic nitrogen (N2−H6···O1) andtwo H-bonds from the terminal nitrogen (N1−H2···O3 andN1−H3···O2) are formed between molecules in the same layer(Figure 1b). These layers stack approximately along the c-axis
Figure 1. (a) The digly zwitterionic molecule with atom labels. (b) The structure of α-digly viewed from the a−b projection highlighting theintralayer H-bonds. (c) The a−c projection highlighting the interlayer H-bond interactions. H-bond distances are taken from the crystal structuredetermined in a previous study by low-temperature (82 K) neutron diffraction.28
Table 1. Measured and Calculated Lattice Parameters of α-Digly20 a
parameterexpt
(ambient, this study)expt
(SC data)20 theorydiff(%)
a (Å) 8.141(2) 8.123(2) 8.0648 −0.9b (Å) 9.5882(8) 9.554(2) 9.5209 −0.7c (Å) 7.844(2) 7.822(2) 7.7980 −0.6β (deg) 107.670(5) 107.596(4) 106.2248 −1.3V (Å3) 583.41(5) 578.7(2) 574.92 −1.5
aErrors are shown in parentheses. Lattice parameters from a previoussingle crystal study are given for comparison. Calculated latticeparameters are at 0 GPa and 0 K with ZPE contributions added. Thepercent difference is between experimental and theoretical ambientparameters from this study.
The Journal of Physical Chemistry B Article
DOI: 10.1021/acs.jpcb.9b07313J. Phys. Chem. B 2020, 124, 1−10
3
and are connected by the fourth H-bond from the terminalnitrogen atom (N1−H1···O2, Figure 1c).To probe the structural changes of α-digly upon quasi-
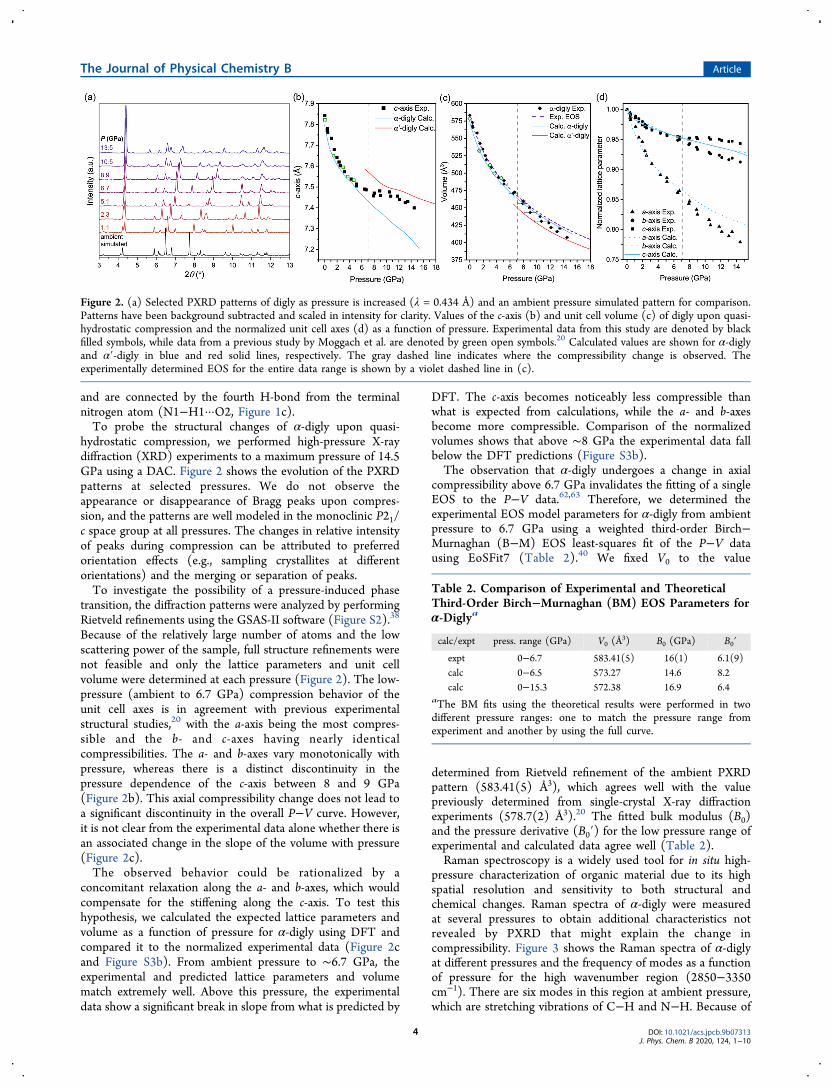
hydrostatic compression, we performed high-pressure X-raydiffraction (XRD) experiments to a maximum pressure of 14.5GPa using a DAC. Figure 2 shows the evolution of the PXRDpatterns at selected pressures. We do not observe theappearance or disappearance of Bragg peaks upon compres-sion, and the patterns are well modeled in the monoclinic P21/c space group at all pressures. The changes in relative intensityof peaks during compression can be attributed to preferredorientation effects (e.g., sampling crystallites at differentorientations) and the merging or separation of peaks.To investigate the possibility of a pressure-induced phase
transition, the diffraction patterns were analyzed by performingRietveld refinements using the GSAS-II software (Figure S2).38
Because of the relatively large number of atoms and the lowscattering power of the sample, full structure refinements werenot feasible and only the lattice parameters and unit cellvolume were determined at each pressure (Figure 2). The low-pressure (ambient to 6.7 GPa) compression behavior of theunit cell axes is in agreement with previous experimentalstructural studies,20 with the a-axis being the most compres-sible and the b- and c-axes having nearly identicalcompressibilities. The a- and b-axes vary monotonically withpressure, whereas there is a distinct discontinuity in thepressure dependence of the c-axis between 8 and 9 GPa(Figure 2b). This axial compressibility change does not lead toa significant discontinuity in the overall P−V curve. However,it is not clear from the experimental data alone whether there isan associated change in the slope of the volume with pressure(Figure 2c).The observed behavior could be rationalized by a
concomitant relaxation along the a- and b-axes, which wouldcompensate for the stiffening along the c-axis. To test thishypothesis, we calculated the expected lattice parameters andvolume as a function of pressure for α-digly using DFT andcompared it to the normalized experimental data (Figure 2cand Figure S3b). From ambient pressure to ∼6.7 GPa, theexperimental and predicted lattice parameters and volumematch extremely well. Above this pressure, the experimentaldata show a significant break in slope from what is predicted by
DFT. The c-axis becomes noticeably less compressible thanwhat is expected from calculations, while the a- and b-axesbecome more compressible. Comparison of the normalizedvolumes shows that above ∼8 GPa the experimental data fallbelow the DFT predictions (Figure S3b).The observation that α-digly undergoes a change in axial
compressibility above 6.7 GPa invalidates the fitting of a singleEOS to the P−V data.62,63 Therefore, we determined theexperimental EOS model parameters for α-digly from ambientpressure to 6.7 GPa using a weighted third-order Birch−Murnaghan (B−M) EOS least-squares fit of the P−V datausing EoSFit7 (Table 2).40 We fixed V0 to the value
determined from Rietveld refinement of the ambient PXRDpattern (583.41(5) Å3), which agrees well with the valuepreviously determined from single-crystal X-ray diffractionexperiments (578.7(2) Å3).20 The fitted bulk modulus (B0)and the pressure derivative (B0′) for the low pressure range ofexperimental and calculated data agree well (Table 2).Raman spectroscopy is a widely used tool for in situ high-
pressure characterization of organic material due to its highspatial resolution and sensitivity to both structural andchemical changes. Raman spectra of α-digly were measuredat several pressures to obtain additional characteristics notrevealed by PXRD that might explain the change incompressibility. Figure 3 shows the Raman spectra of α-diglyat different pressures and the frequency of modes as a functionof pressure for the high wavenumber region (2850−3350cm−1). There are six modes in this region at ambient pressure,which are stretching vibrations of C−H and N−H. Because of
Figure 2. (a) Selected PXRD patterns of digly as pressure is increased (λ = 0.434 Å) and an ambient pressure simulated pattern for comparison.Patterns have been background subtracted and scaled in intensity for clarity. Values of the c-axis (b) and unit cell volume (c) of digly upon quasi-hydrostatic compression and the normalized unit cell axes (d) as a function of pressure. Experimental data from this study are denoted by blackfilled symbols, while data from a previous study by Moggach et al. are denoted by green open symbols.20 Calculated values are shown for α-diglyand α′-digly in blue and red solid lines, respectively. The gray dashed line indicates where the compressibility change is observed. Theexperimentally determined EOS for the entire data range is shown by a violet dashed line in (c).
Table 2. Comparison of Experimental and TheoreticalThird-Order Birch−Murnaghan (BM) EOS Parameters forα-Diglya
calc/expt press. range (GPa) V0 (Å3) B0 (GPa) B0′
expt 0−6.7 583.41(5) 16(1) 6.1(9)calc 0−6.5 573.27 14.6 8.2calc 0−15.3 572.38 16.9 6.4
aThe BM fits using the theoretical results were performed in twodifferent pressure ranges: one to match the pressure range fromexperiment and another by using the full curve.
The Journal of Physical Chemistry B Article
DOI: 10.1021/acs.jpcb.9b07313J. Phys. Chem. B 2020, 124, 1−10
4
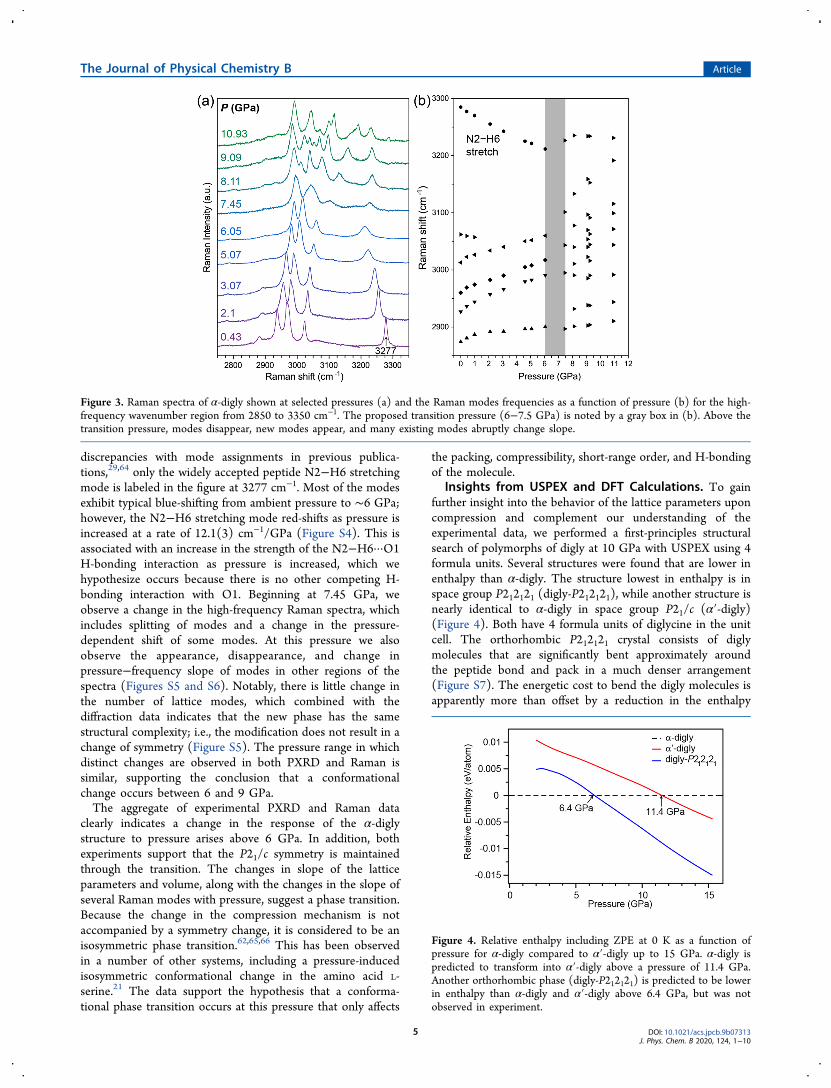
discrepancies with mode assignments in previous publica-tions,29,64 only the widely accepted peptide N2−H6 stretchingmode is labeled in the figure at 3277 cm−1. Most of the modesexhibit typical blue-shifting from ambient pressure to ∼6 GPa;however, the N2−H6 stretching mode red-shifts as pressure isincreased at a rate of 12.1(3) cm−1/GPa (Figure S4). This isassociated with an increase in the strength of the N2−H6···O1H-bonding interaction as pressure is increased, which wehypothesize occurs because there is no other competing H-bonding interaction with O1. Beginning at 7.45 GPa, weobserve a change in the high-frequency Raman spectra, whichincludes splitting of modes and a change in the pressure-dependent shift of some modes. At this pressure we alsoobserve the appearance, disappearance, and change inpressure−frequency slope of modes in other regions of thespectra (Figures S5 and S6). Notably, there is little change inthe number of lattice modes, which combined with thediffraction data indicates that the new phase has the samestructural complexity; i.e., the modification does not result in achange of symmetry (Figure S5). The pressure range in whichdistinct changes are observed in both PXRD and Raman issimilar, supporting the conclusion that a conformationalchange occurs between 6 and 9 GPa.The aggregate of experimental PXRD and Raman data
clearly indicates a change in the response of the α-diglystructure to pressure arises above 6 GPa. In addition, bothexperiments support that the P21/c symmetry is maintainedthrough the transition. The changes in slope of the latticeparameters and volume, along with the changes in the slope ofseveral Raman modes with pressure, suggest a phase transition.Because the change in the compression mechanism is notaccompanied by a symmetry change, it is considered to be anisosymmetric phase transition.62,65,66 This has been observedin a number of other systems, including a pressure-inducedisosymmetric conformational change in the amino acid L-serine.21 The data support the hypothesis that a conforma-tional phase transition occurs at this pressure that only affects
the packing, compressibility, short-range order, and H-bondingof the molecule.
Insights from USPEX and DFT Calculations. To gainfurther insight into the behavior of the lattice parameters uponcompression and complement our understanding of theexperimental data, we performed a first-principles structuralsearch of polymorphs of digly at 10 GPa with USPEX using 4formula units. Several structures were found that are lower inenthalpy than α-digly. The structure lowest in enthalpy is inspace group P212121 (digly-P212121), while another structure isnearly identical to α-digly in space group P21/c (α′-digly)(Figure 4). Both have 4 formula units of diglycine in the unitcell. The orthorhombic P212121 crystal consists of diglymolecules that are significantly bent approximately aroundthe peptide bond and pack in a much denser arrangement(Figure S7). The energetic cost to bend the digly molecules isapparently more than offset by a reduction in the enthalpy
Figure 3. Raman spectra of α-digly shown at selected pressures (a) and the Raman modes frequencies as a function of pressure (b) for the high-frequency wavenumber region from 2850 to 3350 cm−1. The proposed transition pressure (6−7.5 GPa) is noted by a gray box in (b). Above thetransition pressure, modes disappear, new modes appear, and many existing modes abruptly change slope.
Figure 4. Relative enthalpy including ZPE at 0 K as a function ofpressure for α-digly compared to α′-digly up to 15 GPa. α-digly ispredicted to transform into α′-digly above a pressure of 11.4 GPa.Another orthorhombic phase (digly-P212121) is predicted to be lowerin enthalpy than α-digly and α′-digly above 6.4 GPa, but was notobserved in experiment.
The Journal of Physical Chemistry B Article
DOI: 10.1021/acs.jpcb.9b07313J. Phys. Chem. B 2020, 124, 1−10
5
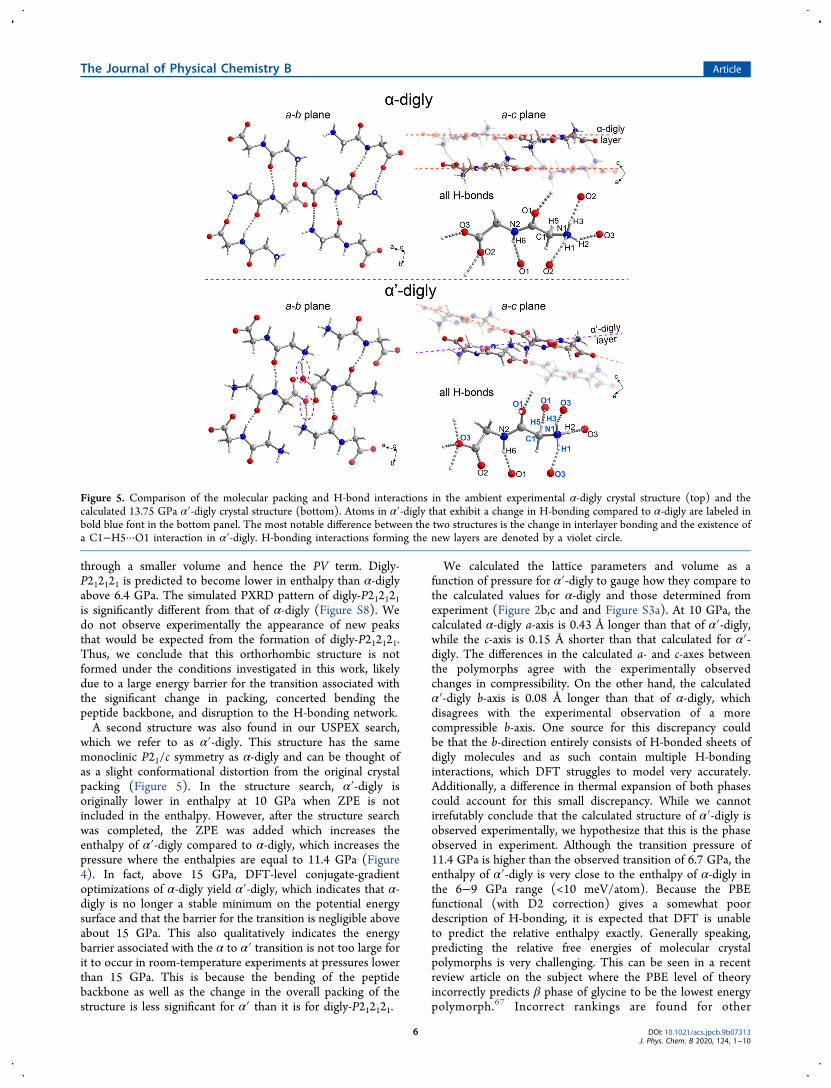
through a smaller volume and hence the PV term. Digly-P212121 is predicted to become lower in enthalpy than α-diglyabove 6.4 GPa. The simulated PXRD pattern of digly-P212121is significantly different from that of α-digly (Figure S8). Wedo not observe experimentally the appearance of new peaksthat would be expected from the formation of digly-P212121.Thus, we conclude that this orthorhombic structure is notformed under the conditions investigated in this work, likelydue to a large energy barrier for the transition associated withthe significant change in packing, concerted bending thepeptide backbone, and disruption to the H-bonding network.A second structure was also found in our USPEX search,
which we refer to as α′-digly. This structure has the samemonoclinic P21/c symmetry as α-digly and can be thought ofas a slight conformational distortion from the original crystalpacking (Figure 5). In the structure search, α′-digly isoriginally lower in enthalpy at 10 GPa when ZPE is notincluded in the enthalpy. However, after the structure searchwas completed, the ZPE was added which increases theenthalpy of α′-digly compared to α-digly, which increases thepressure where the enthalpies are equal to 11.4 GPa (Figure4). In fact, above 15 GPa, DFT-level conjugate-gradientoptimizations of α-digly yield α′-digly, which indicates that α-digly is no longer a stable minimum on the potential energysurface and that the barrier for the transition is negligible aboveabout 15 GPa. This also qualitatively indicates the energybarrier associated with the α to α′ transition is not too large forit to occur in room-temperature experiments at pressures lowerthan 15 GPa. This is because the bending of the peptidebackbone as well as the change in the overall packing of thestructure is less significant for α′ than it is for digly-P212121.
We calculated the lattice parameters and volume as afunction of pressure for α′-digly to gauge how they compare tothe calculated values for α-digly and those determined fromexperiment (Figure 2b,c and and Figure S3a). At 10 GPa, thecalculated α-digly a-axis is 0.43 Å longer than that of α′-digly,while the c-axis is 0.15 Å shorter than that calculated for α′-digly. The differences in the calculated a- and c-axes betweenthe polymorphs agree with the experimentally observedchanges in compressibility. On the other hand, the calculatedα′-digly b-axis is 0.08 Å longer than that of α-digly, whichdisagrees with the experimental observation of a morecompressible b-axis. One source for this discrepancy couldbe that the b-direction entirely consists of H-bonded sheets ofdigly molecules and as such contain multiple H-bondinginteractions, which DFT struggles to model very accurately.Additionally, a difference in thermal expansion of both phasescould account for this small discrepancy. While we cannotirrefutably conclude that the calculated structure of α′-digly isobserved experimentally, we hypothesize that this is the phaseobserved in experiment. Although the transition pressure of11.4 GPa is higher than the observed transition of 6.7 GPa, theenthalpy of α′-digly is very close to the enthalpy of α-digly inthe 6−9 GPa range (<10 meV/atom). Because the PBEfunctional (with D2 correction) gives a somewhat poordescription of H-bonding, it is expected that DFT is unableto predict the relative enthalpy exactly. Generally speaking,predicting the relative free energies of molecular crystalpolymorphs is very challenging. This can be seen in a recentreview article on the subject where the PBE level of theoryincorrectly predicts β phase of glycine to be the lowest energypolymorph.67 Incorrect rankings are found for other
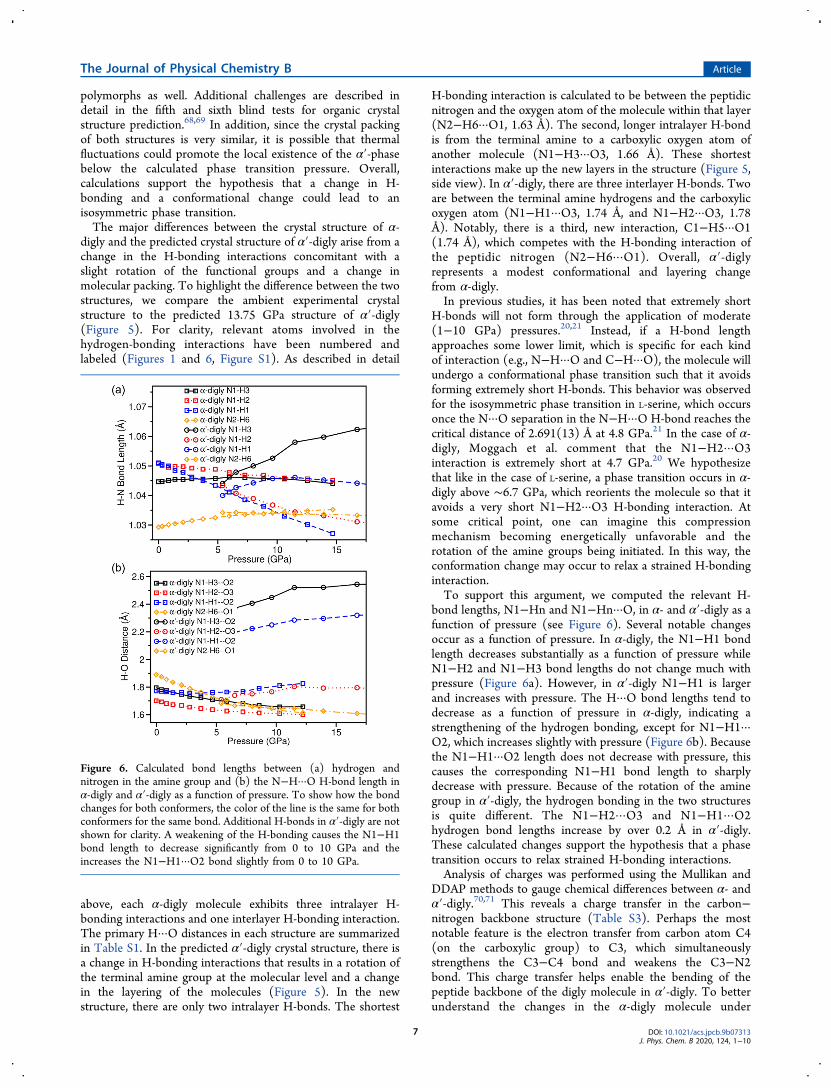
Figure 5. Comparison of the molecular packing and H-bond interactions in the ambient experimental α-digly crystal structure (top) and thecalculated 13.75 GPa α′-digly crystal structure (bottom). Atoms in α′-digly that exhibit a change in H-bonding compared to α-digly are labeled inbold blue font in the bottom panel. The most notable difference between the two structures is the change in interlayer bonding and the existence ofa C1−H5···O1 interaction in α′-digly. H-bonding interactions forming the new layers are denoted by a violet circle.
The Journal of Physical Chemistry B Article
DOI: 10.1021/acs.jpcb.9b07313J. Phys. Chem. B 2020, 124, 1−10
6
polymorphs as well. Additional challenges are described indetail in the fifth and sixth blind tests for organic crystalstructure prediction.68,69 In addition, since the crystal packingof both structures is very similar, it is possible that thermalfluctuations could promote the local existence of the α′-phasebelow the calculated phase transition pressure. Overall,calculations support the hypothesis that a change in H-bonding and a conformational change could lead to anisosymmetric phase transition.The major differences between the crystal structure of α-
digly and the predicted crystal structure of α′-digly arise from achange in the H-bonding interactions concomitant with aslight rotation of the functional groups and a change inmolecular packing. To highlight the difference between the twostructures, we compare the ambient experimental crystalstructure to the predicted 13.75 GPa structure of α′-digly(Figure 5). For clarity, relevant atoms involved in thehydrogen-bonding interactions have been numbered andlabeled (Figures 1 and 6, Figure S1). As described in detail
above, each α-digly molecule exhibits three intralayer H-bonding interactions and one interlayer H-bonding interaction.The primary H···O distances in each structure are summarizedin Table S1. In the predicted α′-digly crystal structure, there isa change in H-bonding interactions that results in a rotation ofthe terminal amine group at the molecular level and a changein the layering of the molecules (Figure 5). In the newstructure, there are only two intralayer H-bonds. The shortest
H-bonding interaction is calculated to be between the peptidicnitrogen and the oxygen atom of the molecule within that layer(N2−H6···O1, 1.63 Å). The second, longer intralayer H-bondis from the terminal amine to a carboxylic oxygen atom ofanother molecule (N1−H3···O3, 1.66 Å). These shortestinteractions make up the new layers in the structure (Figure 5,side view). In α′-digly, there are three interlayer H-bonds. Twoare between the terminal amine hydrogens and the carboxylicoxygen atom (N1−H1···O3, 1.74 Å, and N1−H2···O3, 1.78Å). Notably, there is a third, new interaction, C1−H5···O1(1.74 Å), which competes with the H-bonding interaction ofthe peptidic nitrogen (N2−H6···O1). Overall, α′-diglyrepresents a modest conformational and layering changefrom α-digly.In previous studies, it has been noted that extremely short
H-bonds will not form through the application of moderate(1−10 GPa) pressures.20,21 Instead, if a H-bond lengthapproaches some lower limit, which is specific for each kindof interaction (e.g., N−H···O and C−H···O), the molecule willundergo a conformational phase transition such that it avoidsforming extremely short H-bonds. This behavior was observedfor the isosymmetric phase transition in L-serine, which occursonce the N···O separation in the N−H···O H-bond reaches thecritical distance of 2.691(13) Å at 4.8 GPa.21 In the case of α-digly, Moggach et al. comment that the N1−H2···O3interaction is extremely short at 4.7 GPa.20 We hypothesizethat like in the case of L-serine, a phase transition occurs in α-digly above ∼6.7 GPa, which reorients the molecule so that itavoids a very short N1−H2···O3 H-bonding interaction. Atsome critical point, one can imagine this compressionmechanism becoming energetically unfavorable and therotation of the amine groups being initiated. In this way, theconformation change may occur to relax a strained H-bondinginteraction.To support this argument, we computed the relevant H-
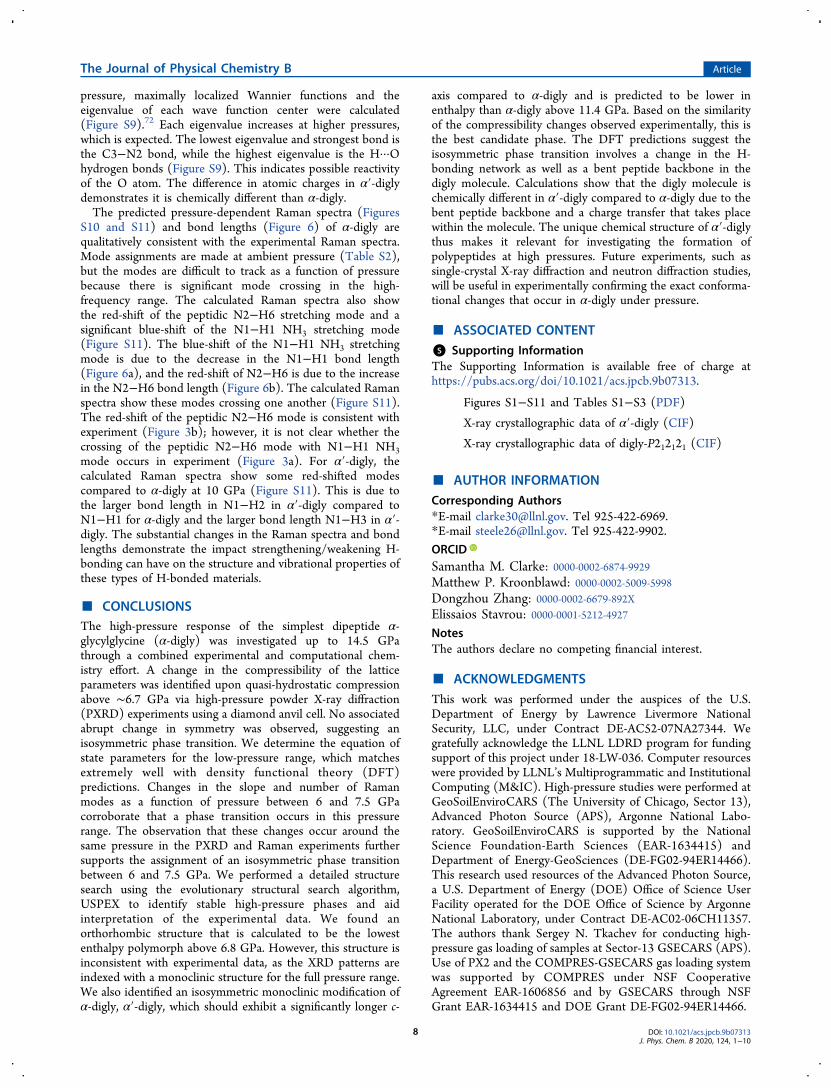
bond lengths, N1−Hn and N1−Hn···O, in α- and α′-digly as afunction of pressure (see Figure 6). Several notable changesoccur as a function of pressure. In α-digly, the N1−H1 bondlength decreases substantially as a function of pressure whileN1−H2 and N1−H3 bond lengths do not change much withpressure (Figure 6a). However, in α′-digly N1−H1 is largerand increases with pressure. The H···O bond lengths tend todecrease as a function of pressure in α-digly, indicating astrengthening of the hydrogen bonding, except for N1−H1···O2, which increases slightly with pressure (Figure 6b). Becausethe N1−H1···O2 length does not decrease with pressure, thiscauses the corresponding N1−H1 bond length to sharplydecrease with pressure. Because of the rotation of the aminegroup in α′-digly, the hydrogen bonding in the two structuresis quite different. The N1−H2···O3 and N1−H1···O2hydrogen bond lengths increase by over 0.2 Å in α′-digly.These calculated changes support the hypothesis that a phasetransition occurs to relax strained H-bonding interactions.Analysis of charges was performed using the Mullikan and
DDAP methods to gauge chemical differences between α- andα′-digly.70,71 This reveals a charge transfer in the carbon−nitrogen backbone structure (Table S3). Perhaps the mostnotable feature is the electron transfer from carbon atom C4(on the carboxylic group) to C3, which simultaneouslystrengthens the C3−C4 bond and weakens the C3−N2bond. This charge transfer helps enable the bending of thepeptide backbone of the digly molecule in α′-digly. To betterunderstand the changes in the α-digly molecule under
Figure 6. Calculated bond lengths between (a) hydrogen andnitrogen in the amine group and (b) the N−H···O H-bond length inα-digly and α′-digly as a function of pressure. To show how the bondchanges for both conformers, the color of the line is the same for bothconformers for the same bond. Additional H-bonds in α′-digly are notshown for clarity. A weakening of the H-bonding causes the N1−H1bond length to decrease significantly from 0 to 10 GPa and theincreases the N1−H1···O2 bond slightly from 0 to 10 GPa.
The Journal of Physical Chemistry B Article
DOI: 10.1021/acs.jpcb.9b07313J. Phys. Chem. B 2020, 124, 1−10
7
pressure, maximally localized Wannier functions and theeigenvalue of each wave function center were calculated(Figure S9).72 Each eigenvalue increases at higher pressures,which is expected. The lowest eigenvalue and strongest bond isthe C3−N2 bond, while the highest eigenvalue is the H···Ohydrogen bonds (Figure S9). This indicates possible reactivityof the O atom. The difference in atomic charges in α′-diglydemonstrates it is chemically different than α-digly.The predicted pressure-dependent Raman spectra (Figures
S10 and S11) and bond lengths (Figure 6) of α-digly arequalitatively consistent with the experimental Raman spectra.Mode assignments are made at ambient pressure (Table S2),but the modes are difficult to track as a function of pressurebecause there is significant mode crossing in the high-frequency range. The calculated Raman spectra also showthe red-shift of the peptidic N2−H6 stretching mode and asignificant blue-shift of the N1−H1 NH3 stretching mode(Figure S11). The blue-shift of the N1−H1 NH3 stretchingmode is due to the decrease in the N1−H1 bond length(Figure 6a), and the red-shift of N2−H6 is due to the increasein the N2−H6 bond length (Figure 6b). The calculated Ramanspectra show these modes crossing one another (Figure S11).The red-shift of the peptidic N2−H6 mode is consistent withexperiment (Figure 3b); however, it is not clear whether thecrossing of the peptidic N2−H6 mode with N1−H1 NH3mode occurs in experiment (Figure 3a). For α′-digly, thecalculated Raman spectra show some red-shifted modescompared to α-digly at 10 GPa (Figure S11). This is due tothe larger bond length in N1−H2 in α′-digly compared toN1−H1 for α-digly and the larger bond length N1−H3 in α′-digly. The substantial changes in the Raman spectra and bondlengths demonstrate the impact strengthening/weakening H-bonding can have on the structure and vibrational properties ofthese types of H-bonded materials.
■ CONCLUSIONSThe high-pressure response of the simplest dipeptide α-glycylglycine (α-digly) was investigated up to 14.5 GPathrough a combined experimental and computational chem-istry effort. A change in the compressibility of the latticeparameters was identified upon quasi-hydrostatic compressionabove ∼6.7 GPa via high-pressure powder X-ray diffraction(PXRD) experiments using a diamond anvil cell. No associatedabrupt change in symmetry was observed, suggesting anisosymmetric phase transition. We determine the equation ofstate parameters for the low-pressure range, which matchesextremely well with density functional theory (DFT)predictions. Changes in the slope and number of Ramanmodes as a function of pressure between 6 and 7.5 GPacorroborate that a phase transition occurs in this pressurerange. The observation that these changes occur around thesame pressure in the PXRD and Raman experiments furthersupports the assignment of an isosymmetric phase transitionbetween 6 and 7.5 GPa. We performed a detailed structuresearch using the evolutionary structural search algorithm,USPEX to identify stable high-pressure phases and aidinterpretation of the experimental data. We found anorthorhombic structure that is calculated to be the lowestenthalpy polymorph above 6.8 GPa. However, this structure isinconsistent with experimental data, as the XRD patterns areindexed with a monoclinic structure for the full pressure range.We also identified an isosymmetric monoclinic modification ofα-digly, α′-digly, which should exhibit a significantly longer c-
axis compared to α-digly and is predicted to be lower inenthalpy than α-digly above 11.4 GPa. Based on the similarityof the compressibility changes observed experimentally, this isthe best candidate phase. The DFT predictions suggest theisosymmetric phase transition involves a change in the H-bonding network as well as a bent peptide backbone in thedigly molecule. Calculations show that the digly molecule ischemically different in α′-digly compared to α-digly due to thebent peptide backbone and a charge transfer that takes placewithin the molecule. The unique chemical structure of α′-diglythus makes it relevant for investigating the formation ofpolypeptides at high pressures. Future experiments, such assingle-crystal X-ray diffraction and neutron diffraction studies,will be useful in experimentally confirming the exact conforma-tional changes that occur in α-digly under pressure.
■ ASSOCIATED CONTENT*S Supporting InformationThe Supporting Information is available free of charge athttps://pubs.acs.org/doi/10.1021/acs.jpcb.9b07313.
Figures S1−S11 and Tables S1−S3 (PDF)
X-ray crystallographic data of α′-digly (CIF)
X-ray crystallographic data of digly-P212121 (CIF)
■ AUTHOR INFORMATIONCorresponding Authors*E-mail [email protected]. Tel 925-422-6969.*E-mail [email protected]. Tel 925-422-9902.
ORCIDSamantha M. Clarke: 0000-0002-6874-9929Matthew P. Kroonblawd: 0000-0002-5009-5998Dongzhou Zhang: 0000-0002-6679-892XElissaios Stavrou: 0000-0001-5212-4927NotesThe authors declare no competing financial interest.
■ ACKNOWLEDGMENTSThis work was performed under the auspices of the U.S.Department of Energy by Lawrence Livermore NationalSecurity, LLC, under Contract DE-AC52-07NA27344. Wegratefully acknowledge the LLNL LDRD program for fundingsupport of this project under 18-LW-036. Computer resourceswere provided by LLNL’s Multiprogrammatic and InstitutionalComputing (M&IC). High-pressure studies were performed atGeoSoilEnviroCARS (The University of Chicago, Sector 13),Advanced Photon Source (APS), Argonne National Labo-ratory. GeoSoilEnviroCARS is supported by the NationalScience Foundation-Earth Sciences (EAR-1634415) andDepartment of Energy-GeoSciences (DE-FG02-94ER14466).This research used resources of the Advanced Photon Source,a U.S. Department of Energy (DOE) Office of Science UserFacility operated for the DOE Office of Science by ArgonneNational Laboratory, under Contract DE-AC02-06CH11357.The authors thank Sergey N. Tkachev for conducting high-pressure gas loading of samples at Sector-13 GSECARS (APS).Use of PX2 and the COMPRES-GSECARS gas loading systemwas supported by COMPRES under NSF CooperativeAgreement EAR-1606856 and by GSECARS through NSFGrant EAR-1634415 and DOE Grant DE-FG02-94ER14466.
The Journal of Physical Chemistry B Article
DOI: 10.1021/acs.jpcb.9b07313J. Phys. Chem. B 2020, 124, 1−10
8
■ REFERENCES(1) Fabbiani, F. P.; Pulham, C. R. High-pressure Studies ofPharmaceutical Compounds and Energetic Materials. Chem. Soc. Rev.2006, 35, 932−942.(2) Hazen, R. M.; Boctor, N.; Brandes, J. A.; Cody, G. D.; Hemley,R. J.; Sharma, A.; Yoder, H. S. High Pressure and the Origin of Life. J.Phys.: Condens. Matter 2002, 14, 11489−11494.(3) Daniel, I.; Oger, P.; Winter, R. Origins of Life and Biochemistryunder High-pressure Conditions. Chem. Soc. Rev. 2006, 35, 858−875.(4) Ohara, S.; Kakegawa, T.; Nakazawa, H. Pressure Effects on theAbiotic Polymerization of Glycine. Origins Life Evol. Biospheres 2007,37, 215−223.(5) Lemke, K. H.; Rosenbauer, R. J.; Bird, D. K. Peptide synthesis inearly Earth hydrothermal systems. Astrobiology 2009, 9, 141−146.(6) Pedreira-Segade, U.; Hao, J.; Montagnac, G.; Cardon, H.;Daniel, I. Spontaneous polymerization of glycine under hydrothermalconditions. ACS Earth and Space Chemistry 2019, 3, 1669−1677.(7) Goldman, N.; Reed, E. J.; Fried, L. E.; William Kuo, I.-F.; Maiti,A. Synthesis of Glycine-containing Complexes in Impacts of Cometson Early Earth. Nat. Chem. 2010, 2, 949.(8) Chyba, C.; Sagan, C. Endogenous Production, ExogenousDelivery and Impact-shock Synthesis of Organic Molecules: AnInventory for the Origins of Life. Nature 1992, 355, 125−132.(9) Sugahara, H.; Mimura, K. Glycine Oligomerization up toTriglycine by Shock Experiments Simulating Comet Impacts.Geochem. J. 2014, 48, 51−62.(10) Sugahara, H.; Mimura, K. Peptide Synthesis Triggered byComet Impacts: A Possible Method for Peptide Delivery to the EarlyEarth and Icy Satellites. Icarus 2015, 257, 103−112.(11) Otake, T.; Taniguchi, T.; Furukawa, Y.; Kawamura, F.;Nakazawa, H.; Kakegawa, T. Stability of Amino Acids and TheirOligomerization under High-pressure Conditions: Implications forPrebiotic Chemistry. Astrobiology 2011, 11, 799−813.(12) Kroonblawd, M.; Lindsey, R.; Goldman, N. Synthesis ofFunctionalized Nitrogen-containing Polycyclic Aromatic Hydro-carbons and Other Prebiotic Compounds in Impacting GlycineSolutions. Chem. Sci. 2019, 10, 6091−6098.(13) Moggach, S.; Parsons, S.; Allan, D. High-pressure Crystallo-graphic Study of L-cysteine, the Route to a New Polymorph. ActaCrystallogr., Sect. A: Found. Crystallogr. 2004, 60, No. s251.(14) Moggach, S. A.; Allan, D. R.; Clark, S. J.; Gutmann, M. J.;Parsons, S.; Pulham, C. R.; Sawyer, L. High-pressure Polymorphism inL-cysteine: The Crystal Structures of L-cysteine-iii and L-cysteine-iv.Acta Crystallogr., Sect. B: Struct. Sci. 2006, 62, 296−309.(15) Moggach, S. A.; Parsons, S.; Wood, P. A. High-pressurePolymorphism in Amino Acids. Crystallogr. Rev. 2008, 14, 143−184.(16) Hinton, J. K.; Clarke, S. M.; Steele, B. A.; Kuo, I.-F. W.;Greenberg, E.; Prakapenka, V. B.; Kunz, M.; Kroonblawd, M. P.;Stavrou, E. Effects of Pressure on the Structure and Lattice Dynamicsof α-glycine: A Combined Experimental and Theoretical Study.CrystEngComm 2019, 21, 4457.(17) Boldyreva, E. V.; Ivashevskaya, S. N.; Sowa, H.; Ahsbahs, H.;Weber, H.-P. Effect of High Pressure on Crystalline Glycine: A NewHigh-pressure Polymorph. Dokl. Phys. Chem. 2004, 396, 111−114.(18) Tumanov, N. A.; Boldyreva, E. V. X-Ray Diffraction and RamanStudy of Dl-Alanine at High Pressure: Revision of Phase Transitions.Acta Crystallogr., Sect. B: Struct. Sci. 2012, 68, 412−423.(19) Boldyreva, E. V.; Ivashevskaya, S. N.; Sowa, H.; Ahsbahs, H.;Weber, H.-P. Effect of Hydrostatic Pressure on the γ - Polymorph ofGlycine 1. A Polymorphic Transition into a New δ -form. Z.Kristallogr. - Cryst. Mater. 2005, 220, 50−57.(20) Moggach, S. A.; Allan, D. R.; Parsons, S.; Sawyer, L. Effect ofPressure on the Crystal Structure of α-glycylglycine to 4.7 GPa;Application of Hirshfeld Surfaces to Analyse Contacts on IncreasingPressure. Acta Crystallogr., Sect. B: Struct. Sci. 2006, 62, 310−320.(21) Moggach, S. A.; Allan, D. R.; Morrison, C. A.; Parsons, S.;Sawyer, L. Effect of Pressure on the Crystal Structure of L-serine-i andthe Crystal Structure of L-serine-ii at 5.4 GPa. Acta Crystallogr., Sect.B: Struct. Sci. 2005, 61, 58−68.
(22) Murli, C.; Sharma, S. M.; Karmakar, S.; Sikka, S. α-glycineunder High Pressures: A Raman Scattering Study. Phys. B 2003, 339,23−30.(23) Dawson, A.; Allan, D. R.; Belmonte, S. A.; Clark, S. J.; David,W. I. F.; McGregor, P. A.; Parsons, S.; Pulham, C. R.; Sawyer, L.Effect of High Pressure on the Crystal Structures of Polymorphs ofGlycine. Cryst. Growth Des. 2005, 5, 1415−1427.(24) Kroonblawd, M. P.; Pietrucci, F.; Saitta, A. M.; Goldman, N.Generating Converged Accurate Free Energy Surfaces for ChemicalReactions with a Force-matched Semiempirical Model. J. Chem.Theory Comput. 2018, 14, 2207−2218.(25) Kitadai, N. Thermodynamic Prediction of Glycine Polymer-ization As a Function of Temperature and Ph Consistent withExperimentally Obtained Results. J. Mol. Evol. 2014, 78, 171−187.(26) Bernal, J. D. The Crystal Structure of the Natural Amino Acidsand Related Compounds. Z. Kristallogr. - Cryst. Mater. 1931, 78, 363−369.(27) Hughes, E. W.; Moore, W. J. The Crystal Structure of β-glycylglycine. J. Am. Chem. Soc. 1949, 71, 2618−2623.(28) Kvick, Å.; Al-Karaghouli, A.; Koetzle, T. Deformation ElectronDensity of α-glycylglycine at 82 K. I. The neutron diffraction study*.Acta Crystallogr., Sect. B: Struct. Crystallogr. Cryst. Chem. 1977, 33,3796−3801.(29) Lagant, P.; Vergoten, G.; Loucheux-Lefebvre, M.; Fleury, G.Raman Spectra and Normal Vibrations of Dipeptides. I. Glycylglycine.Biopolymers 1983, 22, 1267−1283.(30) Shock, E. L. Stability of Peptides in High-temperature AqueousSolutions. Geochim. Cosmochim. Acta 1992, 56, 3481−3491.(31) Steiner, T. The Hydrogen Bond in the Solid State. Angew.Chem., Int. Ed. 2002, 41, 48−76.(32) Klotz, S.; Chervin, J.; Munsch, P.; Le Marchand, G. HydrostaticLimits of 11 Pressure Transmitting Media. J. Phys. D: Appl. Phys.2009, 42, 075413.(33) Fei, Y.; Ricolleau, A.; Frank, M.; Mibe, K.; Shen, G.;Prakapenka, V. Toward an Internally Consistent Pressure Scale.Proc. Natl. Acad. Sci. U. S. A. 2007, 104, 9182−9186.(34) Syassen, K. Ruby under Pressure. High Pressure Res. 2008, 28,75−126.(35) Prakapenka, V. B.; Kubo, A.; Kuznetsov, A.; Laskin, A.;Shkurikhin, O.; Dera, P.; Rivers, M. L.; Sutton, S. R. Advanced FlatTop Laser Heating System for High Pressure Research at GSECARS:Application to the Melting Behavior of Germanium. High Pressure Res.2008, 28, 225−235.(36) Zhang, D.; Dera, P. K.; Eng, P. J.; Stubbs, J. E.; Zhang, J. S.;Prakapenka, V. B.; Rivers, M. L. High Pressure Single CrystalDiffraction at PX 2. J. Visualized Exp. 2017, No. e54660.(37) Prescher, C.; Prakapenka, V. B. Dioptas: A Program forReduction of Two-dimensional X-ray Diffraction Data and DataExploration. High Pressure Res. 2015, 35, 223−230.(38) Toby, B. H.; Von Dreele, R. B. Gsas-ii: The Genesis of aModern Open-source All Purpose Crystallography Software Package.J. Appl. Crystallogr. 2013, 46, 544−549.(39) DIAMOND Version 4.x, CRYSTAL IMPACT, Kreuzherrenstr.102, 53227 Bonn, Germany.(40) Angel, R. J.; Alvaro, M.; Gonzalez-Platas, J. EosFit7c and aFortran Module (library) for Equation of State Calculations. Z.Kristallogr. - Cryst. Mater. 2014, 229, 405−419.(41) Hohenberg, P.; Kohn, W. Inhomogeneous Electron Gas. Phys.Rev. 1964, 136, B864−B871.(42) Kohn, W.; Sham, L. J. Self-consistent Equations IncludingExchange and Correlation Effects. Phys. Rev. 1965, 140, A1133−A1138.(43) Kresse, G.; Furthmuller, J. Efficiency of Ab-initio Total EnergyCalculations for Metals and Semiconductors Using a Plane-wave BasisSet. Comput. Mater. Sci. 1996, 6, 15−50.(44) Blochl, P. E. Projector Augmented-wave Method. Phys. Rev. B:Condens. Matter Mater. Phys. 1994, 50, 17953−17979.
The Journal of Physical Chemistry B Article
DOI: 10.1021/acs.jpcb.9b07313J. Phys. Chem. B 2020, 124, 1−10
9
(45) Kresse, G.; Joubert, D. From Ultrasoft Pseudopotentials to theProjector Augmented-wave Method. Phys. Rev. B: Condens. MatterMater. Phys. 1999, 59, 1758−1775.(46) Perdew, J. P.; Burke, K.; Ernzerhof, M. Generalized GradientApproximation Made Simple. Phys. Rev. Lett. 1996, 77, 3865−3868.(47) Grimme, S. Semiempirical GGA-Type Density FunctionalConstructed with a Long-Range Dispersion Correction. J. Comput.Chem. 2006, 27, 1787−1799.(48) Zhao, Y.; Truhlar, D. G. Benchmark Databases for NonbondedInteractions and Their Use to Test Density Functional Theory. J.Chem. Theory Comput. 2005, 1, 415−432.(49) Grimme, S.; Antony, J.; Schwabe, T.; Muck-Lichtenfeld, C.Density Functional Theory with Dispersion Corrections for Supra-molecular Structures, Aggregates, and Complexes of (Bio)OrganicMolecules. Org. Biomol. Chem. 2007, 5, 741−758.(50) Landerville, A. C.; Oleynik, I. I. Vibrational and ThermalProperties of β-HMX and TATB from Dispersion Corrected DensityFunctional Theory. AIP Conf. Proc. 2015, 1793, 050007.(51) Landerville, A. C.; Conroy, M. W.; Budzevich, M. M.; Lin, Y.;White, C. T.; Oleynik, I. I. Equations of State for Energetic Materialsfrom Density Functional Theory with van Der Waals, Thermal, andZero-Point Energy Corrections. Appl. Phys. Lett. 2010, 97, 251908.(52) Ernzerhof, M.; Scuseria, G. E. Assessment of the Perdew−burke−ernzerhof Exchange-correlation Functional. J. Chem. Phys.1999, 110, 5029−5036.(53) Tuma, C.; Boese, A. D.; Handy, N. C. Predicting the BindingEnergies of H-bonded Complexes: A Comparative DFT Study. Phys.Chem. Chem. Phys. 1999, 1, 3939−3947.(54) Santra, B.; Michaelides, A.; Scheffler, M. On the Accuracy ofDensity-functional Theory Exchange-Correlation Functionals for HBonds in Small Water Clusters: Benchmarks Approaching theComplete Basis Set Limit. J. Chem. Phys. 2007, 127, 184104.(55) Ireta, J.; Neugebauer, J.; Scheffler, M. On the Accuracy of DFTfor Describing Hydrogen Bonds: Dependence on the BondDirectionality. J. Phys. Chem. A 2004, 108, 5692−5698.(56) Novoa, J. J.; Sosa, C. Evaluation of the Density FunctionalApproximation on the Computation of Hydrogen Bond Interactions.J. Phys. Chem. 1995, 99, 15837−15845.(57) Grossman, J. C.; Schwegler, E.; Draeger, E. W.; Gygi, F.; Galli,G. Towards an Assessment of the Accuracy of Density FunctionalTheory for First Principles Simulations of Water. J. Chem. Phys. 2004,120, 300−311.(58) Todorova, T.; Seitsonen, A. P.; Hutter, J.; Kuo, I.-F. W.;Mundy, C. J. Molecular Dynamics Simulation of Liquid Water:Hybrid Density Functionals. J. Phys. Chem. B 2006, 110, 3685−3691.(59) Glass, C. W.; Oganov, A. R.; Hansen, N. USPEX-evolutionaryCrystal Structure Prediction. Comput. Phys. Commun. 2006, 175,713−720.(60) Lyakhov, A. O.; Oganov, A. R.; Valle, M. How to Predict VeryLarge and Complex Crystal Structures. Comput. Phys. Commun. 2010,181, 1623−1632.(61) Oganov, A. R.; Glass, C. W. Crystal Structure Prediction UsingAb Initio Evolutionary Techniques: Principles and Applications. J.Chem. Phys. 2006, 124, 244704.(62) Angel, R. New Phenomena in Minerals at High Pressures. PhaseTransitions 1996, 59, 105−119.(63) Angel, R.; Ross, N. Compression Mechanisms and Equations ofState. Philos. Trans. R. Soc., A 1996, 354, 1449−1459.(64) Chakrabborty, D.; Yash, A.; Manogaran, S. Ground StateVibrations of N-glycylglycine Hydrochloride: An Ab Initio Study. J.Mol. Struct.: THEOCHEM 1994, 303, 265−273.(65) Christy, A. G. Isosymmetric Structural Phase Transitions:Phenomenology and Examples. Acta Crystallogr., Sect. B: Struct. Sci.1995, 51, 753−757.(66) Gupta, S. C.; Chidambaram, R. Symmetry Systematics ofPressure-induced Phase Transitions. High Pressure Res. 1994, 12, 51−70.(67) Beran, G. J. O. Modeling Polymorphic Molecular Crystals withElectronic Structure Theory. Chem. Rev. 2016, 116, 5567−5613.
(68) Bardwell, D. A.; Adjiman, C. S.; Arnautova, Y. A.; Bartashevich,E.; Boerrigter, S. X.; Braun, D. E.; Cruz-Cabeza, A. J.; Day, G. M.;Della Valle, R. G.; Desiraju, G. R.; et al. Towards Crystal StructurePrediction of Complex Organic Compounds − A Report on The FifthBlind Test. Acta Crystallogr., Sect. B: Struct. Sci. 2011, 67, 535−551.(69) Reilly, A. M.; Cooper, R. I.; Adjiman, C. S.; Bhattacharya, S.;Boese, A. D.; Brandenburg, J. G.; Bygrave, P. J.; Bylsma, R.; Campbell,J. E.; Car, R.; et al. Report on the Sixth Blind Test of Organic CrystalStructure Prediction Methods. Acta Crystallogr., Sect. B: Struct. Sci.,Cryst. Eng. Mater. 2016, 72, 439−459.(70) Mulliken, R. S. Electronic Population Analysis on Lcao−moMolecular Wave Functions. I. J. Chem. Phys. 1955, 23, 1833−1840.(71) Blochl, P. E. Electrostatic Decoupling of Periodic Images ofPlane-Wave-Expanded Densities and Derived Atomic Point Charges.J. Chem. Phys. 1995, 103, 7422−7428.(72) Silvestrelli, P. L.; Parrinello, M. Water Molecule Dipole in theGas and in the Liquid Phase. Phys. Rev. Lett. 1999, 82, 3308−3311.
The Journal of Physical Chemistry B Article
DOI: 10.1021/acs.jpcb.9b07313J. Phys. Chem. B 2020, 124, 1−10
10