AmplitudeModulation - WBUTHELP.COMChapter5 AmplitudeModulation Amplitude modulation was historically...
25
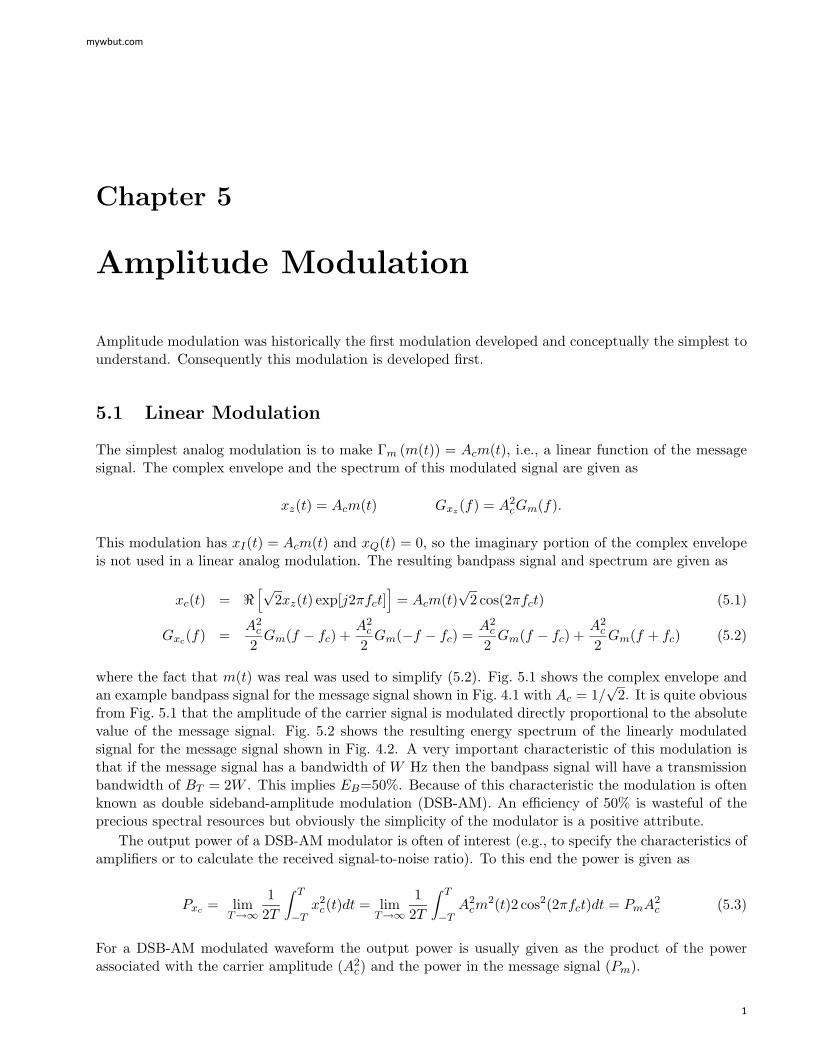
Chapter 5 Amplitude Modulation Amplitude modulation was historically the first modulation developed and conceptually the simplest to understand. Consequently this modulation is developed first. 5.1 Linear Modulation The simplest analog modulation is to make Γ m (m(t)) = A c m(t), i.e., a linear function of the message signal. The complex envelope and the spectrum of this modulated signal are given as x z (t)= A c m(t) G xz (f )= A 2 c G m (f ). This modulation has x I (t)= A c m(t) and x Q (t) = 0, so the imaginary portion of the complex envelope is not used in a linear analog modulation. The resulting bandpass signal and spectrum are given as x c (t) = √ 2x z (t) exp[j 2πf c t] = A c m(t) √ 2 cos(2πf c t) (5.1) G xc (f ) = A 2 c 2 G m (f − f c )+ A 2 c 2 G m (−f − f c )= A 2 c 2 G m (f − f c )+ A 2 c 2 G m (f + f c ) (5.2) where the fact that m(t) was real was used to simplify (5.2). Fig. 5.1 shows the complex envelope and an example bandpass signal for the message signal shown in Fig. 4.1 with A c =1/ √ 2. It is quite obvious from Fig. 5.1 that the amplitude of the carrier signal is modulated directly proportional to the absolute value of the message signal. Fig. 5.2 shows the resulting energy spectrum of the linearly modulated signal for the message signal shown in Fig. 4.2. A very important characteristic of this modulation is that if the message signal has a bandwidth of W Hz then the bandpass signal will have a transmission bandwidth of B T =2W . This implies E B =50%. Because of this characteristic the modulation is often known as double sideband-amplitude modulation (DSB-AM). An efficiency of 50% is wasteful of the precious spectral resources but obviously the simplicity of the modulator is a positive attribute. The output power of a DSB-AM modulator is often of interest (e.g., to specify the characteristics of amplifiers or to calculate the received signal-to-noise ratio). To this end the power is given as P xc = lim T →∞ 1 2T T −T x 2 c (t)dt = lim T →∞ 1 2T T −T A 2 c m 2 (t)2 cos 2 (2πf c t)dt = P m A 2 c (5.3) For a DSB-AM modulated waveform the output power is usually given as the product of the power associated with the carrier amplitude (A 2 c ) and the power in the message signal (P m ). mywbut.com 1
Transcript of AmplitudeModulation - WBUTHELP.COMChapter5 AmplitudeModulation Amplitude modulation was historically...
Chapter 5
Amplitude Modulation
Amplitude modulation was historically the first modulation developed and conceptually the simplest tounderstand. Consequently this modulation is developed first.
5.1 Linear Modulation
The simplest analog modulation is to make Γm (m(t)) = Acm(t), i.e., a linear function of the messagesignal. The complex envelope and the spectrum of this modulated signal are given as
xz(t) = Acm(t) Gxz(f) = A2cGm(f).
This modulation has xI(t) = Acm(t) and xQ(t) = 0, so the imaginary portion of the complex envelopeis not used in a linear analog modulation. The resulting bandpass signal and spectrum are given as
xc(t) = [√
2xz(t) exp[j2πfct]]
= Acm(t)√
2 cos(2πfct) (5.1)
Gxc(f) =A2
c
2Gm(f − fc) +
A2c
2Gm(−f − fc) =
A2c
2Gm(f − fc) +
A2c
2Gm(f + fc) (5.2)
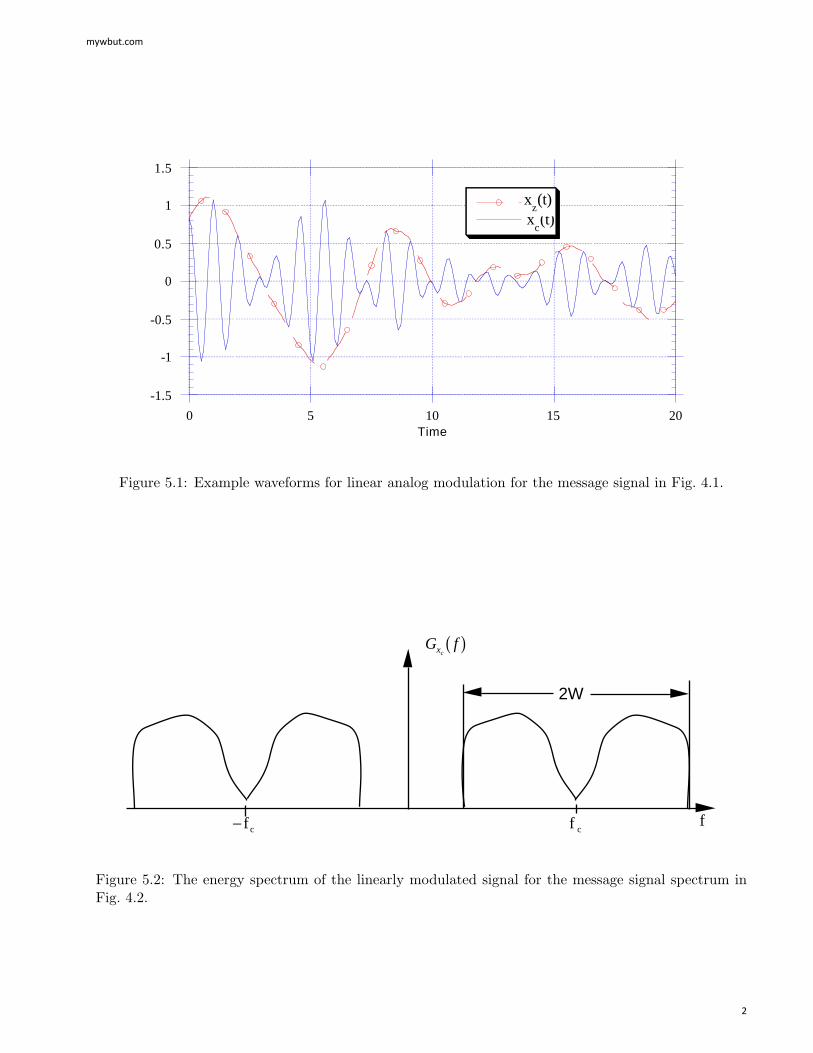
where the fact that m(t) was real was used to simplify (5.2). Fig. 5.1 shows the complex envelope andan example bandpass signal for the message signal shown in Fig. 4.1 with Ac = 1/
√2. It is quite obvious
from Fig. 5.1 that the amplitude of the carrier signal is modulated directly proportional to the absolutevalue of the message signal. Fig. 5.2 shows the resulting energy spectrum of the linearly modulatedsignal for the message signal shown in Fig. 4.2. A very important characteristic of this modulation isthat if the message signal has a bandwidth of W Hz then the bandpass signal will have a transmissionbandwidth of BT = 2W . This implies EB=50%. Because of this characteristic the modulation is oftenknown as double sideband-amplitude modulation (DSB-AM). An efficiency of 50% is wasteful of theprecious spectral resources but obviously the simplicity of the modulator is a positive attribute.
The output power of a DSB-AM modulator is often of interest (e.g., to specify the characteristics ofamplifiers or to calculate the received signal-to-noise ratio). To this end the power is given as
Pxc = limT→∞
12T
∫ T
−Tx2
c(t)dt = limT→∞
12T
∫ T
−TA2
cm2(t)2 cos2(2πfct)dt = PmA2
c (5.3)
For a DSB-AM modulated waveform the output power is usually given as the product of the powerassociated with the carrier amplitude (A2
c) and the power in the message signal (Pm).
mywbut.com
1
-1.5
-1
-0.5
0
0.5
1
1.5
0 5 10 15 20
xc(t)
Time
xz(t)
ff c− fc
2W
G fxc( )
Figure 5.1: Example waveforms for linear analog modulation for the message signal in Fig. 4.1.
Figure 5.2: The energy spectrum of the linearly modulated signal for the message signal spectrum inFig. 4.2.
mywbut.com
2
2 cos 2πfct( )
m(t) A c
Example 5.1: Linear modulation with
m(t) = β sin (2πfmt) Gm(f) =β2
4δ(f − fm) +
β2
4δ(f + fm)
producesxc(t) = Acβ sin (2πfmt)
√2 cos(2πfct)
and
Gxc(f) =A2
cβ2
8(δ(f − fm − fc) + δ(f + fm − fc) + δ(f − fm + fc) + δ(f + fm + fc)) .
The output power is
Pxc =A2
cβ2
2
5.1.1 Modulator and Demodulator
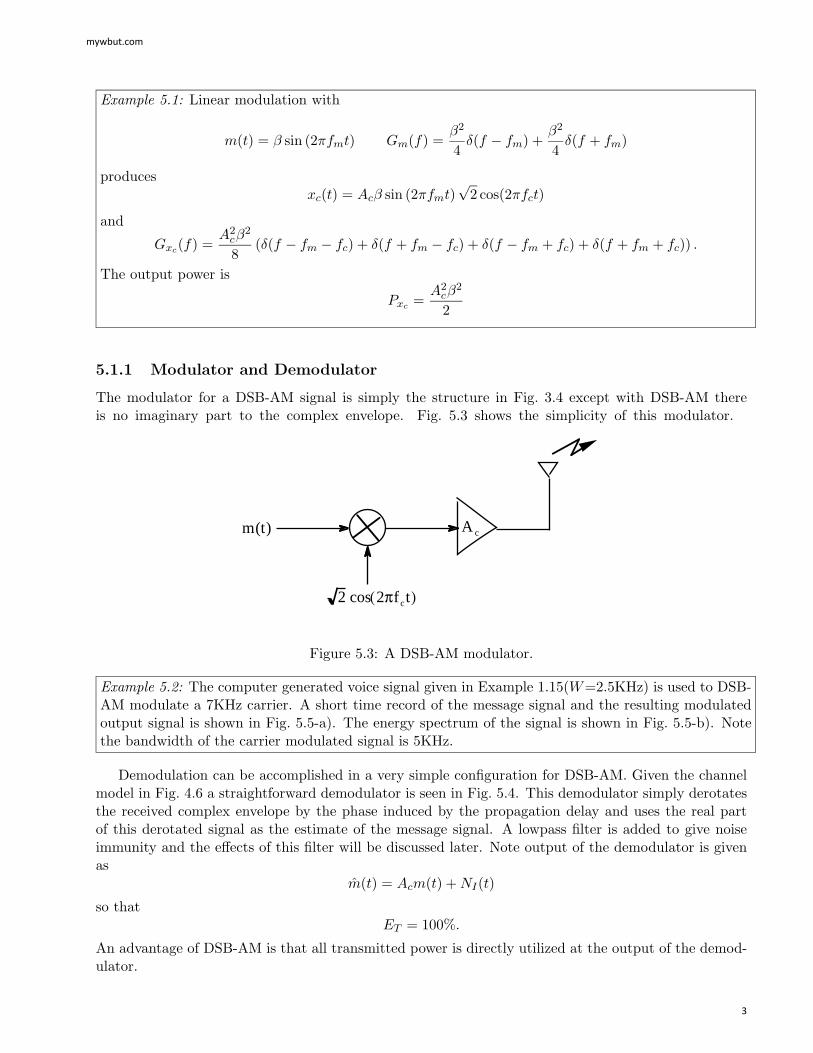
The modulator for a DSB-AM signal is simply the structure in Fig. 3.4 except with DSB-AM thereis no imaginary part to the complex envelope. Fig. 5.3 shows the simplicity of this modulator.
Figure 5.3: A DSB-AM modulator.
Example 5.2: The computer generated voice signal given in Example 1.15(W=2.5KHz) is used to DSB-AM modulate a 7KHz carrier. A short time record of the message signal and the resulting modulatedoutput signal is shown in Fig. 5.5-a). The energy spectrum of the signal is shown in Fig. 5.5-b). Notethe bandwidth of the carrier modulated signal is 5KHz.
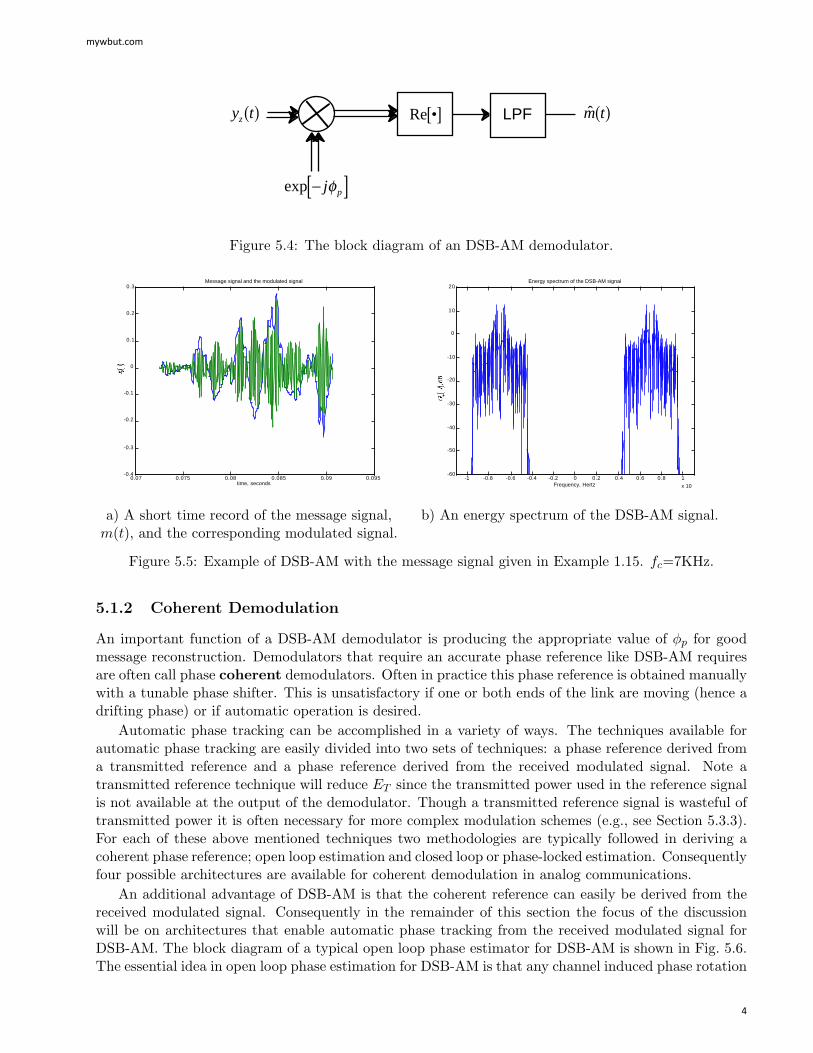
Demodulation can be accomplished in a very simple configuration for DSB-AM. Given the channelmodel in Fig. 4.6 a straightforward demodulator is seen in Fig. 5.4. This demodulator simply derotatesthe received complex envelope by the phase induced by the propagation delay and uses the real partof this derotated signal as the estimate of the message signal. A lowpass filter is added to give noiseimmunity and the effects of this filter will be discussed later. Note output of the demodulator is givenas
m(t) = Acm(t) + NI(t)
so thatET = 100%.
An advantage of DSB-AM is that all transmitted power is directly utilized at the output of the demod-ulator.
mywbut.com
3
LPF
exp −[ ]j pφ
m t( )Re •[ ]y tz( )
0.07 0.075 0.08 0.085 0.09 0.095-0.4
-0.3
-0.2
-0.1
0
0.1
0.2
0.3Message signal and the modulated signal
time, seconds-1 -0.8 -0.6 -0.4 -0.2 0 0.2 0.4 0.6 0.8 1
x 10
-60
-50
-40
-30
-20
-10
0
10
20Energy spectrum of the DSB-AM signal
Frequency, Hertz
Figure 5.4: The block diagram of an DSB-AM demodulator.
a) A short time record of the message signal,m(t), and the corresponding modulated signal.
b) An energy spectrum of the DSB-AM signal.
Figure 5.5: Example of DSB-AM with the message signal given in Example 1.15. fc=7KHz.
5.1.2 Coherent Demodulation
An important function of a DSB-AM demodulator is producing the appropriate value of φp for goodmessage reconstruction. Demodulators that require an accurate phase reference like DSB-AM requiresare often call phase coherent demodulators. Often in practice this phase reference is obtained manuallywith a tunable phase shifter. This is unsatisfactory if one or both ends of the link are moving (hence adrifting phase) or if automatic operation is desired.
Automatic phase tracking can be accomplished in a variety of ways. The techniques available forautomatic phase tracking are easily divided into two sets of techniques: a phase reference derived froma transmitted reference and a phase reference derived from the received modulated signal. Note atransmitted reference technique will reduce ET since the transmitted power used in the reference signalis not available at the output of the demodulator. Though a transmitted reference signal is wasteful oftransmitted power it is often necessary for more complex modulation schemes (e.g., see Section 5.3.3).For each of these above mentioned techniques two methodologies are typically followed in deriving acoherent phase reference; open loop estimation and closed loop or phase-locked estimation. Consequentlyfour possible architectures are available for coherent demodulation in analog communications.
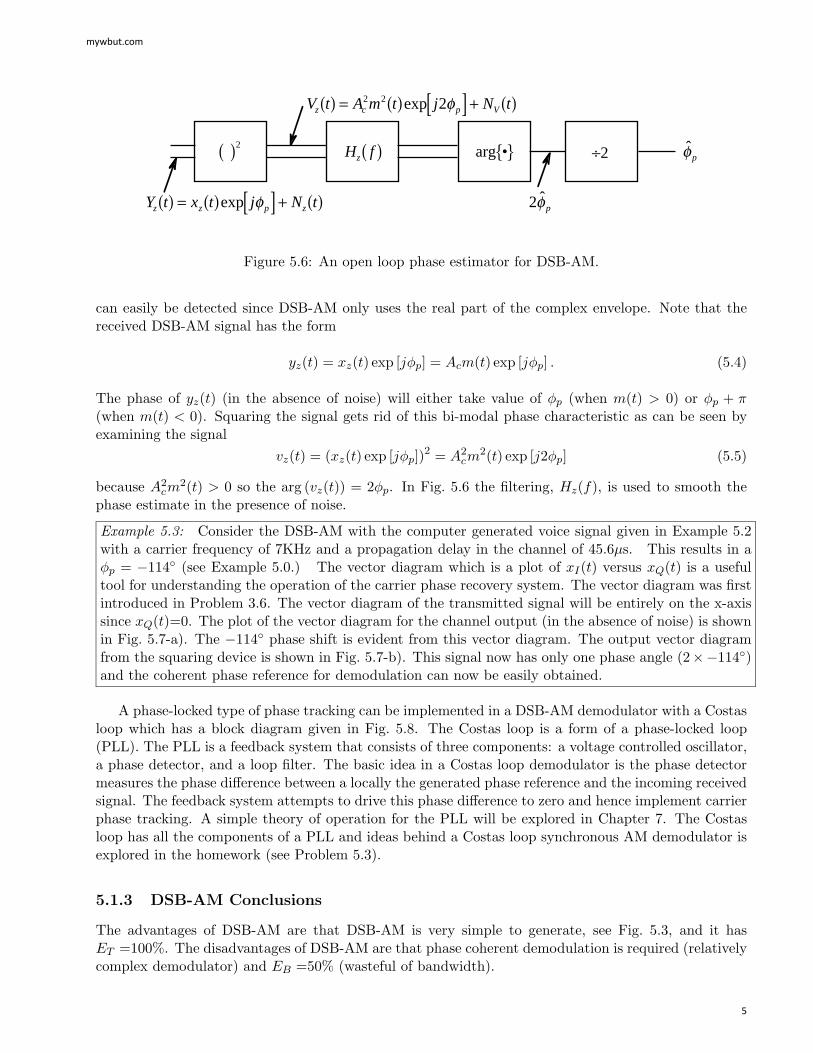
An additional advantage of DSB-AM is that the coherent reference can easily be derived from thereceived modulated signal. Consequently in the remainder of this section the focus of the discussionwill be on architectures that enable automatic phase tracking from the received modulated signal forDSB-AM. The block diagram of a typical open loop phase estimator for DSB-AM is shown in Fig. 5.6.The essential idea in open loop phase estimation for DSB-AM is that any channel induced phase rotation
mywbut.com
4
( )2H fz( ) arg •
Y t x t j N tz z p z( ) = ( ) [ ] + ( )exp φ
÷2 φp
2φp
V t A m t j N tz c p V( ) = ( ) [ ] + ( )2 2 2exp φ
Figure 5.6: An open loop phase estimator for DSB-AM.
can easily be detected since DSB-AM only uses the real part of the complex envelope. Note that thereceived DSB-AM signal has the form
yz(t) = xz(t) exp [jφp] = Acm(t) exp [jφp] . (5.4)
The phase of yz(t) (in the absence of noise) will either take value of φp (when m(t) > 0) or φp + π(when m(t) < 0). Squaring the signal gets rid of this bi-modal phase characteristic as can be seen byexamining the signal
vz(t) = (xz(t) exp [jφp])2 = A2
cm2(t) exp [j2φp] (5.5)
because A2cm
2(t) > 0 so the arg (vz(t)) = 2φp. In Fig. 5.6 the filtering, Hz(f), is used to smooth thephase estimate in the presence of noise.
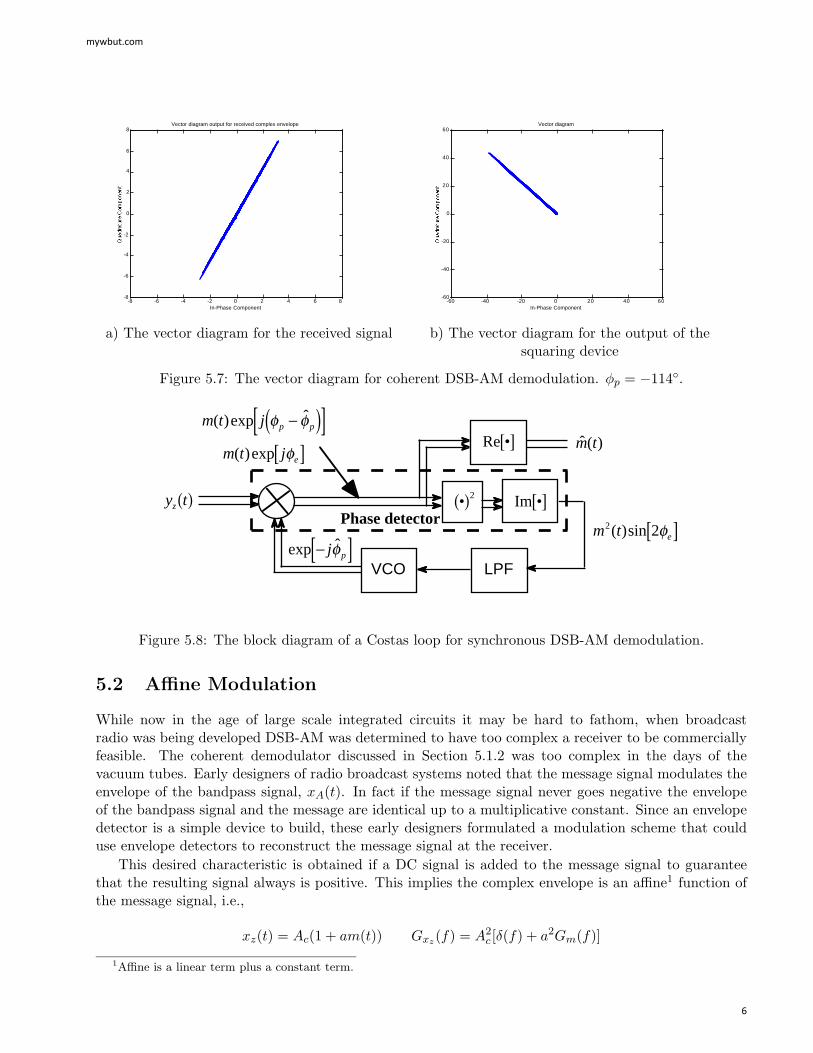
Example 5.3: Consider the DSB-AM with the computer generated voice signal given in Example 5.2with a carrier frequency of 7KHz and a propagation delay in the channel of 45.6µs. This results in aφp = −114 (see Example 5.0.) The vector diagram which is a plot of xI(t) versus xQ(t) is a usefultool for understanding the operation of the carrier phase recovery system. The vector diagram was firstintroduced in Problem 3.6. The vector diagram of the transmitted signal will be entirely on the x-axissince xQ(t)=0. The plot of the vector diagram for the channel output (in the absence of noise) is shownin Fig. 5.7-a). The −114 phase shift is evident from this vector diagram. The output vector diagramfrom the squaring device is shown in Fig. 5.7-b). This signal now has only one phase angle (2×−114)and the coherent phase reference for demodulation can now be easily obtained.
A phase-locked type of phase tracking can be implemented in a DSB-AM demodulator with a Costasloop which has a block diagram given in Fig. 5.8. The Costas loop is a form of a phase-locked loop(PLL). The PLL is a feedback system that consists of three components: a voltage controlled oscillator,a phase detector, and a loop filter. The basic idea in a Costas loop demodulator is the phase detectormeasures the phase difference between a locally the generated phase reference and the incoming receivedsignal. The feedback system attempts to drive this phase difference to zero and hence implement carrierphase tracking. A simple theory of operation for the PLL will be explored in Chapter 7. The Costasloop has all the components of a PLL and ideas behind a Costas loop synchronous AM demodulator isexplored in the homework (see Problem 5.3).
5.1.3 DSB-AM Conclusions
The advantages of DSB-AM are that DSB-AM is very simple to generate, see Fig. 5.3, and it hasET =100%. The disadvantages of DSB-AM are that phase coherent demodulation is required (relativelycomplex demodulator) and EB =50% (wasteful of bandwidth).
mywbut.com
5
-8 -6 -4 -2 0 2 4 6 8-8
-6
-4
-2
0
2
4
6
8Vector diagram output for received complex envelope
In-Phase Component-60 -40 -20 0 20 40 60
-60
-40
-20
0
20
40
60Vector diagram
In-Phase Component
•( )2
m t j
m t j
p p
e
( )exp ˆ
( )exp
φ φ
φ
−( )[ ][ ]
LPFVCO
Phase detector
ˆ ( )m t
Im •[ ]
Re •[ ]
m t e2 2( )sin φ[ ]
exp ˆ−[ ]j pφ
y tz( )
a) The vector diagram for the received signal b) The vector diagram for the output of thesquaring device
Figure 5.7: The vector diagram for coherent DSB-AM demodulation. φp = −114.
Figure 5.8: The block diagram of a Costas loop for synchronous DSB-AM demodulation.
5.2 Affine Modulation
While now in the age of large scale integrated circuits it may be hard to fathom, when broadcastradio was being developed DSB-AM was determined to have too complex a receiver to be commerciallyfeasible. The coherent demodulator discussed in Section 5.1.2 was too complex in the days of thevacuum tubes. Early designers of radio broadcast systems noted that the message signal modulates theenvelope of the bandpass signal, xA(t). In fact if the message signal never goes negative the envelopeof the bandpass signal and the message are identical up to a multiplicative constant. Since an envelopedetector is a simple device to build, these early designers formulated a modulation scheme that coulduse envelope detectors to reconstruct the message signal at the receiver.
This desired characteristic is obtained if a DC signal is added to the message signal to guaranteethat the resulting signal always is positive. This implies the complex envelope is an affine1 function ofthe message signal, i.e.,
xz(t) = Ac(1 + am(t)) Gxz(f) = A2c [δ(f) + a2Gm(f)]
1Affine is a linear term plus a constant term.
mywbut.com
6
f
W
ff c−fc
2W
G fxc( )
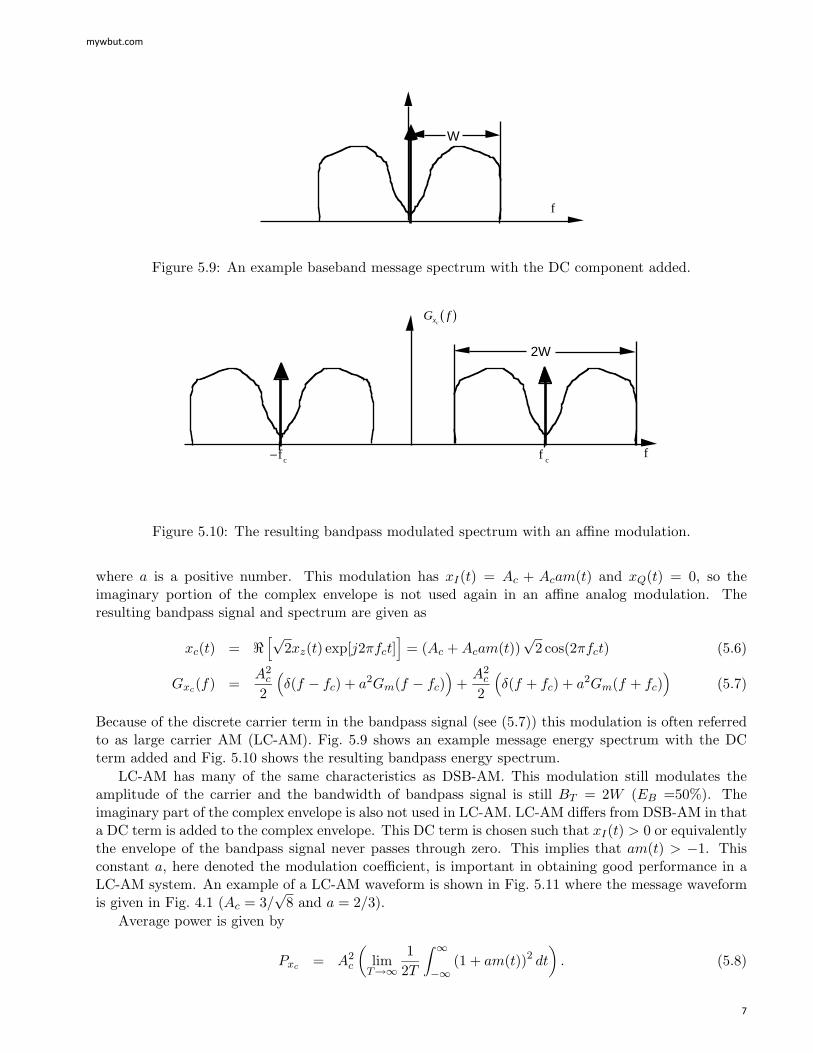
Figure 5.9: An example baseband message spectrum with the DC component added.
Figure 5.10: The resulting bandpass modulated spectrum with an affine modulation.
where a is a positive number. This modulation has xI(t) = Ac + Acam(t) and xQ(t) = 0, so theimaginary portion of the complex envelope is not used again in an affine analog modulation. Theresulting bandpass signal and spectrum are given as
xc(t) = [√
2xz(t) exp[j2πfct]]
= (Ac + Acam(t))√
2 cos(2πfct) (5.6)
Gxc(f) =A2
c
2
(δ(f − fc) + a2Gm(f − fc)
)+
A2c
2
(δ(f + fc) + a2Gm(f + fc)
)(5.7)
Because of the discrete carrier term in the bandpass signal (see (5.7)) this modulation is often referredto as large carrier AM (LC-AM). Fig. 5.9 shows an example message energy spectrum with the DCterm added and Fig. 5.10 shows the resulting bandpass energy spectrum.
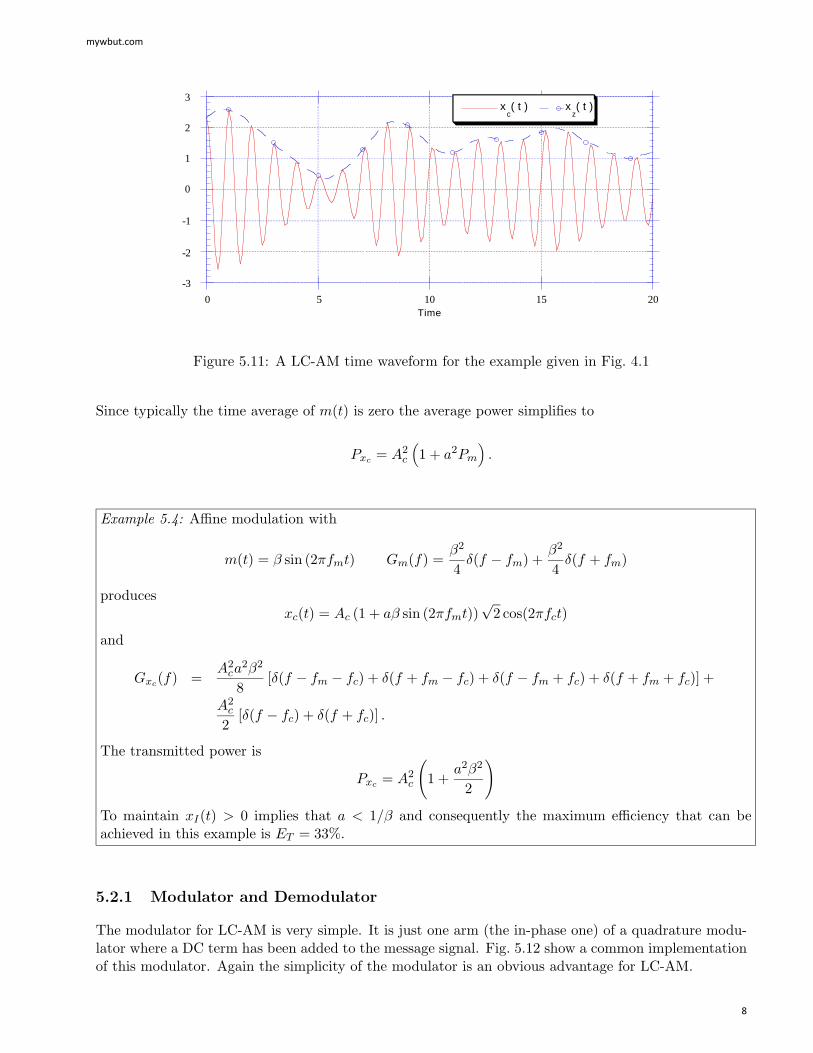
LC-AM has many of the same characteristics as DSB-AM. This modulation still modulates theamplitude of the carrier and the bandwidth of bandpass signal is still BT = 2W (EB =50%). Theimaginary part of the complex envelope is also not used in LC-AM. LC-AM differs from DSB-AM in thata DC term is added to the complex envelope. This DC term is chosen such that xI(t) > 0 or equivalentlythe envelope of the bandpass signal never passes through zero. This implies that am(t) > −1. Thisconstant a, here denoted the modulation coefficient, is important in obtaining good performance in aLC-AM system. An example of a LC-AM waveform is shown in Fig. 5.11 where the message waveformis given in Fig. 4.1 (Ac = 3/
√8 and a = 2/3).
Average power is given by
Pxc = A2c
(lim
T→∞1
2T
∫ ∞−∞
(1 + am(t))2 dt). (5.8)
mywbut.com
7
-3
-2
-1
0
1
2
3
0 5 10 15 20Time
xz( t )x
c( t )
Figure 5.11: A LC-AM time waveform for the example given in Fig. 4.1
Since typically the time average of m(t) is zero the average power simplifies to
Pxc = A2c
(1 + a2Pm
).
Example 5.4: Affine modulation with
m(t) = β sin (2πfmt) Gm(f) =β2
4δ(f − fm) +
β2
4δ(f + fm)
producesxc(t) = Ac (1 + aβ sin (2πfmt))
√2 cos(2πfct)
and
Gxc(f) =A2
ca2β2
8[δ(f − fm − fc) + δ(f + fm − fc) + δ(f − fm + fc) + δ(f + fm + fc)] +
A2c
2[δ(f − fc) + δ(f + fc)] .
The transmitted power is
Pxc = A2c
(1 +
a2β2
2
)
To maintain xI(t) > 0 implies that a < 1/β and consequently the maximum efficiency that can beachieved in this example is ET = 33%.
5.2.1 Modulator and Demodulator
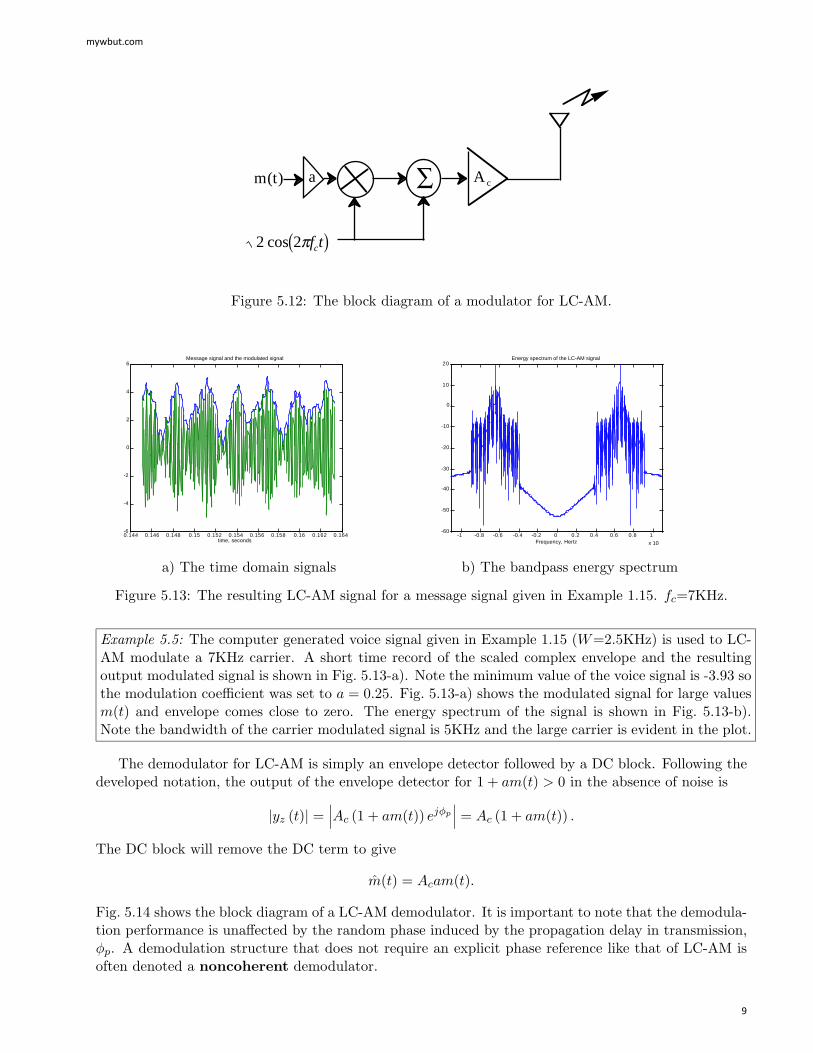
The modulator for LC-AM is very simple. It is just one arm (the in-phase one) of a quadrature modu-lator where a DC term has been added to the message signal. Fig. 5.12 show a common implementationof this modulator. Again the simplicity of the modulator is an obvious advantage for LC-AM.
mywbut.com
8
m(t) A c∑a
2 2cos πf tc( )
0.144 0.146 0.148 0.15 0.152 0.154 0.156 0.158 0.16 0.162 0.164-6
-4
-2
0
2
4
6Message signal and the modulated signal
time, seconds-1 -0.8 -0.6 -0.4 -0.2 0 0.2 0.4 0.6 0.8 1
x 10
-60
-50
-40
-30
-20
-10
0
10
20Energy spectrum of the LC-AM signal
Frequency, Hertz
Figure 5.12: The block diagram of a modulator for LC-AM.
a) The time domain signals b) The bandpass energy spectrum
Figure 5.13: The resulting LC-AM signal for a message signal given in Example 1.15. fc=7KHz.
Example 5.5: The computer generated voice signal given in Example 1.15 (W=2.5KHz) is used to LC-AM modulate a 7KHz carrier. A short time record of the scaled complex envelope and the resultingoutput modulated signal is shown in Fig. 5.13-a). Note the minimum value of the voice signal is -3.93 sothe modulation coefficient was set to a = 0.25. Fig. 5.13-a) shows the modulated signal for large valuesm(t) and envelope comes close to zero. The energy spectrum of the signal is shown in Fig. 5.13-b).Note the bandwidth of the carrier modulated signal is 5KHz and the large carrier is evident in the plot.
The demodulator for LC-AM is simply an envelope detector followed by a DC block. Following thedeveloped notation, the output of the envelope detector for 1 + am(t) > 0 in the absence of noise is
|yz (t)| =∣∣∣Ac (1 + am(t)) ejφp
∣∣∣ = Ac (1 + am(t)) .
The DC block will remove the DC term to give
m(t) = Acam(t).
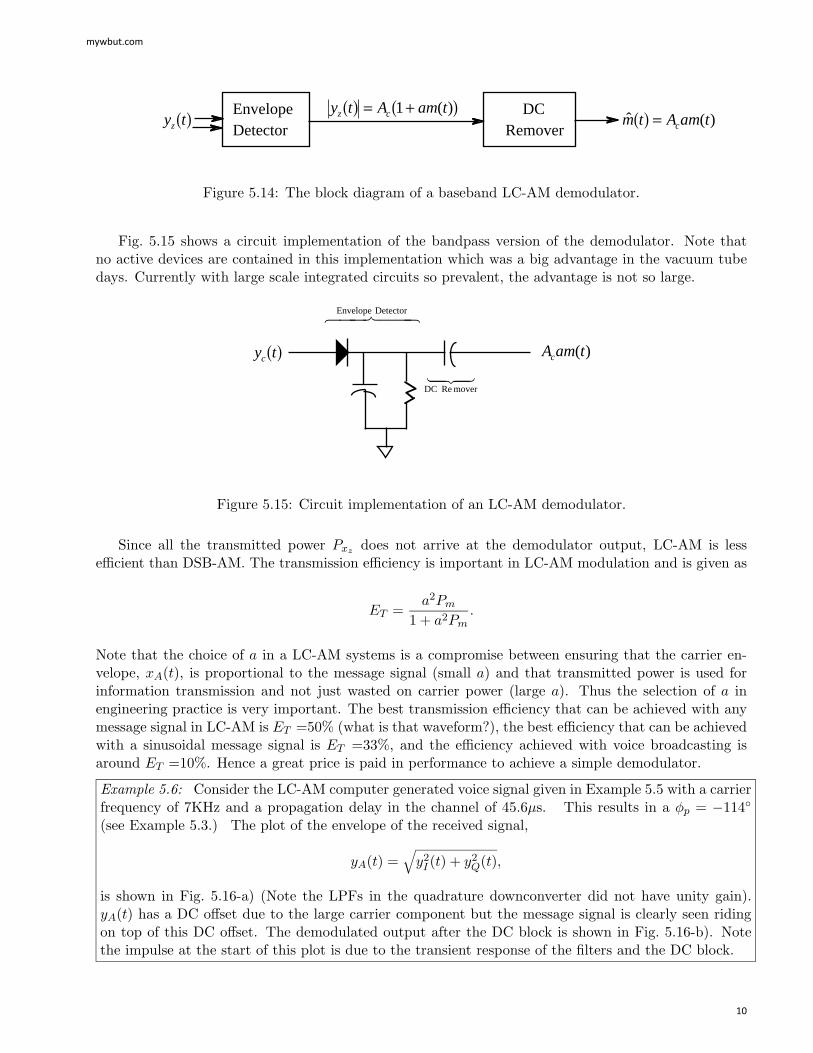
Fig. 5.14 shows the block diagram of a LC-AM demodulator. It is important to note that the demodula-tion performance is unaffected by the random phase induced by the propagation delay in transmission,φp. A demodulation structure that does not require an explicit phase reference like that of LC-AM isoften denoted a noncoherent demodulator.
mywbut.com
9
EnvelopeDetector
DCRemover
y tz( )y t A am tz c( ) = +( )1 ( )
ˆ ( )m t A am tc( ) =
Envelope Detector6 7 4 4 8 4 4
DC Re mover1 2 4 3 4
y tc( ) A am tc ( )
Figure 5.14: The block diagram of a baseband LC-AM demodulator.
Fig. 5.15 shows a circuit implementation of the bandpass version of the demodulator. Note thatno active devices are contained in this implementation which was a big advantage in the vacuum tubedays. Currently with large scale integrated circuits so prevalent, the advantage is not so large.
Figure 5.15: Circuit implementation of an LC-AM demodulator.
Since all the transmitted power Pxz does not arrive at the demodulator output, LC-AM is lessefficient than DSB-AM. The transmission efficiency is important in LC-AM modulation and is given as
ET =a2Pm
1 + a2Pm.
Note that the choice of a in a LC-AM systems is a compromise between ensuring that the carrier en-velope, xA(t), is proportional to the message signal (small a) and that transmitted power is used forinformation transmission and not just wasted on carrier power (large a). Thus the selection of a inengineering practice is very important. The best transmission efficiency that can be achieved with anymessage signal in LC-AM is ET =50% (what is that waveform?), the best efficiency that can be achievedwith a sinusoidal message signal is ET =33%, and the efficiency achieved with voice broadcasting isaround ET =10%. Hence a great price is paid in performance to achieve a simple demodulator.
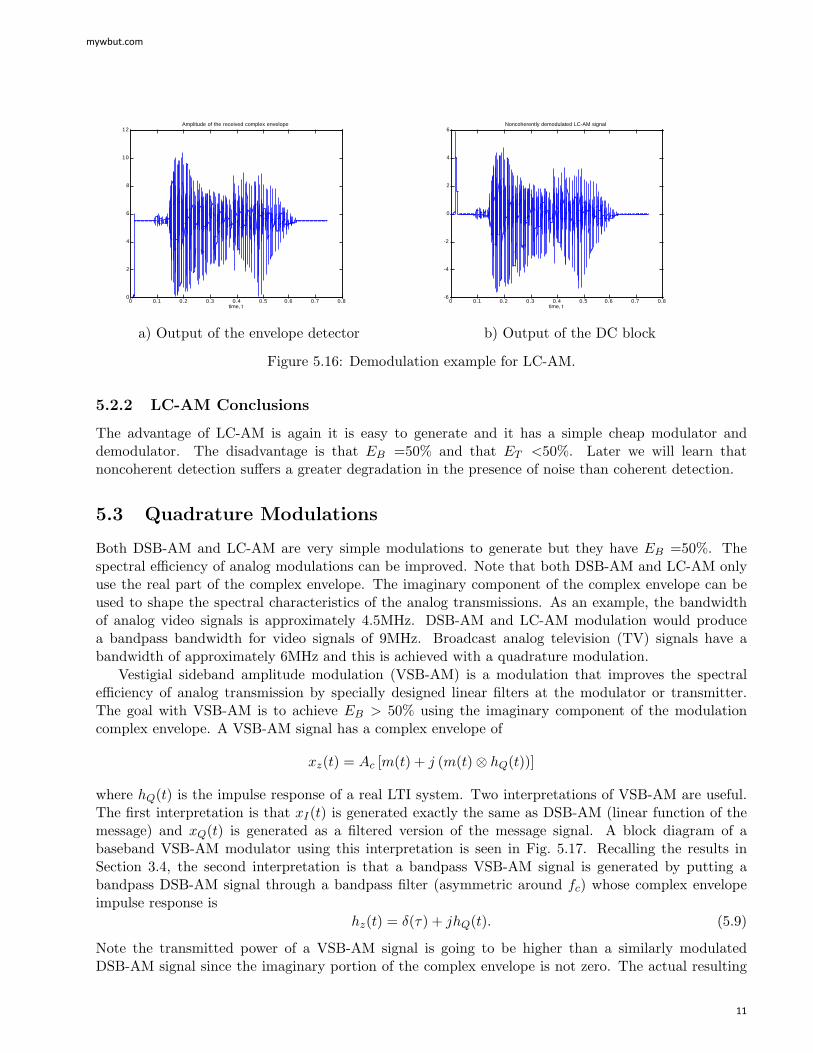
Example 5.6: Consider the LC-AM computer generated voice signal given in Example 5.5 with a carrierfrequency of 7KHz and a propagation delay in the channel of 45.6µs. This results in a φp = −114
(see Example 5.3.) The plot of the envelope of the received signal,
yA(t) =√y2
I (t) + y2Q(t),
is shown in Fig. 5.16-a) (Note the LPFs in the quadrature downconverter did not have unity gain).yA(t) has a DC offset due to the large carrier component but the message signal is clearly seen ridingon top of this DC offset. The demodulated output after the DC block is shown in Fig. 5.16-b). Notethe impulse at the start of this plot is due to the transient response of the filters and the DC block.
mywbut.com
10
0 0.1 0.2 0.3 0.4 0.5 0.6 0.7 0.80
2
4
6
8
10
12Amplitude of the received complex envelope
time, t0 0.1 0.2 0.3 0.4 0.5 0.6 0.7 0.8
-6
-4
-2
0
2
4
6Noncoherently demodulated LC-AM signal
time, t
a) Output of the envelope detector b) Output of the DC block
Figure 5.16: Demodulation example for LC-AM.
5.2.2 LC-AM Conclusions
The advantage of LC-AM is again it is easy to generate and it has a simple cheap modulator anddemodulator. The disadvantage is that EB =50% and that ET <50%. Later we will learn thatnoncoherent detection suffers a greater degradation in the presence of noise than coherent detection.
5.3 Quadrature Modulations
Both DSB-AM and LC-AM are very simple modulations to generate but they have EB =50%. Thespectral efficiency of analog modulations can be improved. Note that both DSB-AM and LC-AM onlyuse the real part of the complex envelope. The imaginary component of the complex envelope can beused to shape the spectral characteristics of the analog transmissions. As an example, the bandwidthof analog video signals is approximately 4.5MHz. DSB-AM and LC-AM modulation would producea bandpass bandwidth for video signals of 9MHz. Broadcast analog television (TV) signals have abandwidth of approximately 6MHz and this is achieved with a quadrature modulation.
Vestigial sideband amplitude modulation (VSB-AM) is a modulation that improves the spectralefficiency of analog transmission by specially designed linear filters at the modulator or transmitter.The goal with VSB-AM is to achieve EB > 50% using the imaginary component of the modulationcomplex envelope. A VSB-AM signal has a complex envelope of
xz(t) = Ac [m(t) + j (m(t)⊗ hQ(t))]
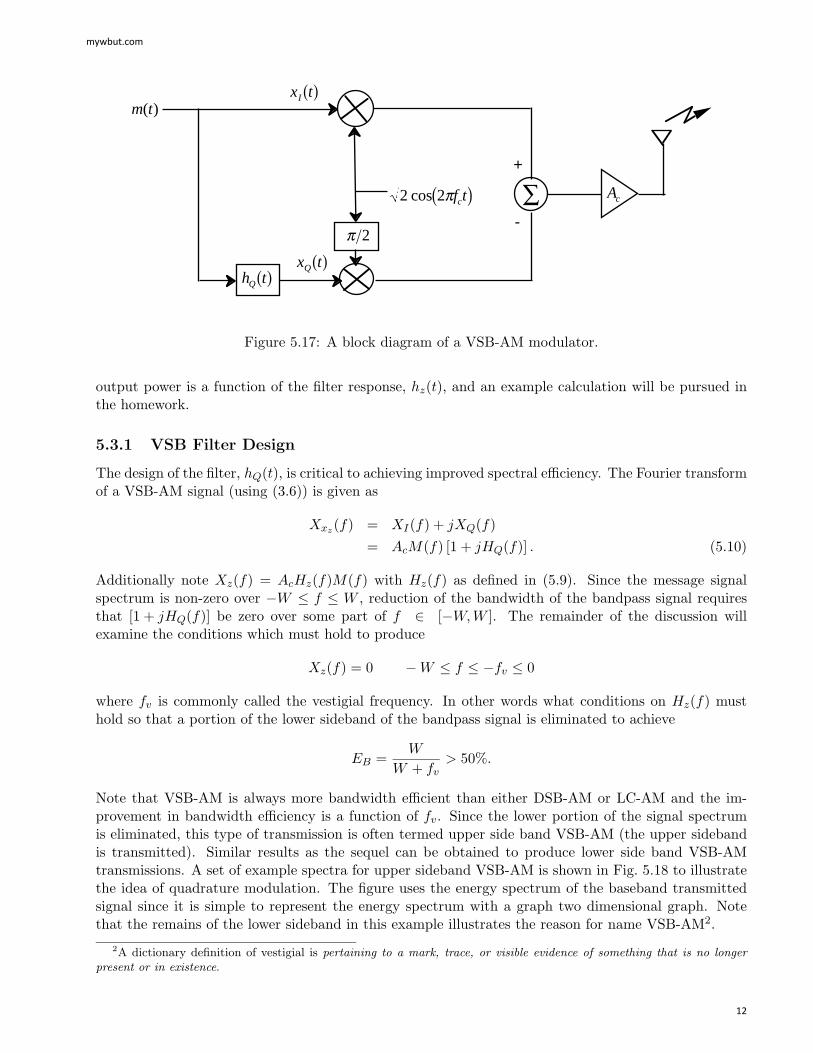
where hQ(t) is the impulse response of a real LTI system. Two interpretations of VSB-AM are useful.The first interpretation is that xI(t) is generated exactly the same as DSB-AM (linear function of themessage) and xQ(t) is generated as a filtered version of the message signal. A block diagram of abaseband VSB-AM modulator using this interpretation is seen in Fig. 5.17. Recalling the results inSection 3.4, the second interpretation is that a bandpass VSB-AM signal is generated by putting abandpass DSB-AM signal through a bandpass filter (asymmetric around fc) whose complex envelopeimpulse response is
hz(t) = δ(τ) + jhQ(t). (5.9)
Note the transmitted power of a VSB-AM signal is going to be higher than a similarly modulatedDSB-AM signal since the imaginary portion of the complex envelope is not zero. The actual resulting
mywbut.com
11
2 2cos πf tc( )
m t( )
h tQ( )
∑+
-
Ac
π 2
x tI ( )
x tQ( )
Figure 5.17: A block diagram of a VSB-AM modulator.
output power is a function of the filter response, hz(t), and an example calculation will be pursued inthe homework.
5.3.1 VSB Filter Design
The design of the filter, hQ(t), is critical to achieving improved spectral efficiency. The Fourier transformof a VSB-AM signal (using (3.6)) is given as
Xxz(f) = XI(f) + jXQ(f)= AcM(f) [1 + jHQ(f)] . (5.10)
Additionally note Xz(f) = AcHz(f)M(f) with Hz(f) as defined in (5.9). Since the message signalspectrum is non-zero over −W ≤ f ≤ W , reduction of the bandwidth of the bandpass signal requiresthat [1 + jHQ(f)] be zero over some part of f ∈ [−W,W ]. The remainder of the discussion willexamine the conditions which must hold to produce
Xz(f) = 0 −W ≤ f ≤ −fv ≤ 0
where fv is commonly called the vestigial frequency. In other words what conditions on Hz(f) musthold so that a portion of the lower sideband of the bandpass signal is eliminated to achieve
EB =W
W + fv> 50%.
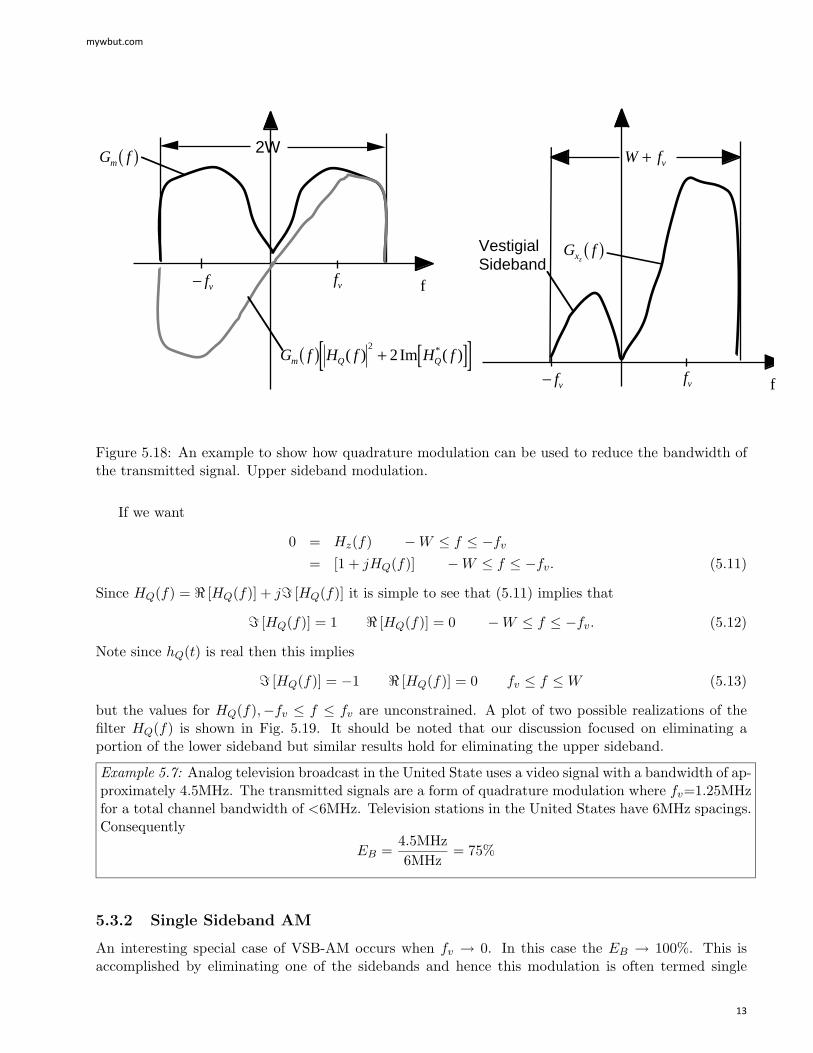
Note that VSB-AM is always more bandwidth efficient than either DSB-AM or LC-AM and the im-provement in bandwidth efficiency is a function of fv. Since the lower portion of the signal spectrumis eliminated, this type of transmission is often termed upper side band VSB-AM (the upper sidebandis transmitted). Similar results as the sequel can be obtained to produce lower side band VSB-AMtransmissions. A set of example spectra for upper sideband VSB-AM is shown in Fig. 5.18 to illustratethe idea of quadrature modulation. The figure uses the energy spectrum of the baseband transmittedsignal since it is simple to represent the energy spectrum with a graph two dimensional graph. Notethat the remains of the lower sideband in this example illustrates the reason for name VSB-AM2.
2A dictionary definition of vestigial is pertaining to a mark, trace, or visible evidence of something that is no longerpresent or in existence.
mywbut.com
12
f
2W
fv− fv
ffv− fv
G f H f H fm Q Q( ) + [ ][ ]( ) Im ( )*22
G fm( )
G fxz( )
W fv+
VestigialSideband
Figure 5.18: An example to show how quadrature modulation can be used to reduce the bandwidth ofthe transmitted signal. Upper sideband modulation.
If we want
0 = Hz(f) −W ≤ f ≤ −fv
= [1 + jHQ(f)] −W ≤ f ≤ −fv. (5.11)
Since HQ(f) = [HQ(f)] + j [HQ(f)] it is simple to see that (5.11) implies that
[HQ(f)] = 1 [HQ(f)] = 0 −W ≤ f ≤ −fv. (5.12)
Note since hQ(t) is real then this implies
[HQ(f)] = −1 [HQ(f)] = 0 fv ≤ f ≤W (5.13)
but the values for HQ(f),−fv ≤ f ≤ fv are unconstrained. A plot of two possible realizations of thefilter HQ(f) is shown in Fig. 5.19. It should be noted that our discussion focused on eliminating aportion of the lower sideband but similar results hold for eliminating the upper sideband.
Example 5.7: Analog television broadcast in the United State uses a video signal with a bandwidth of ap-proximately 4.5MHz. The transmitted signals are a form of quadrature modulation where fv=1.25MHzfor a total channel bandwidth of <6MHz. Television stations in the United States have 6MHz spacings.Consequently
EB =4.5MHz6MHz
= 75%
5.3.2 Single Sideband AM
An interesting special case of VSB-AM occurs when fv → 0. In this case the EB → 100%. This isaccomplished by eliminating one of the sidebands and hence this modulation is often termed single
mywbut.com
13
f v−f v
1
-1
Im ( )H fQ1 ( )[ ]
Im ( )H fQ2 ( )[ ]
f
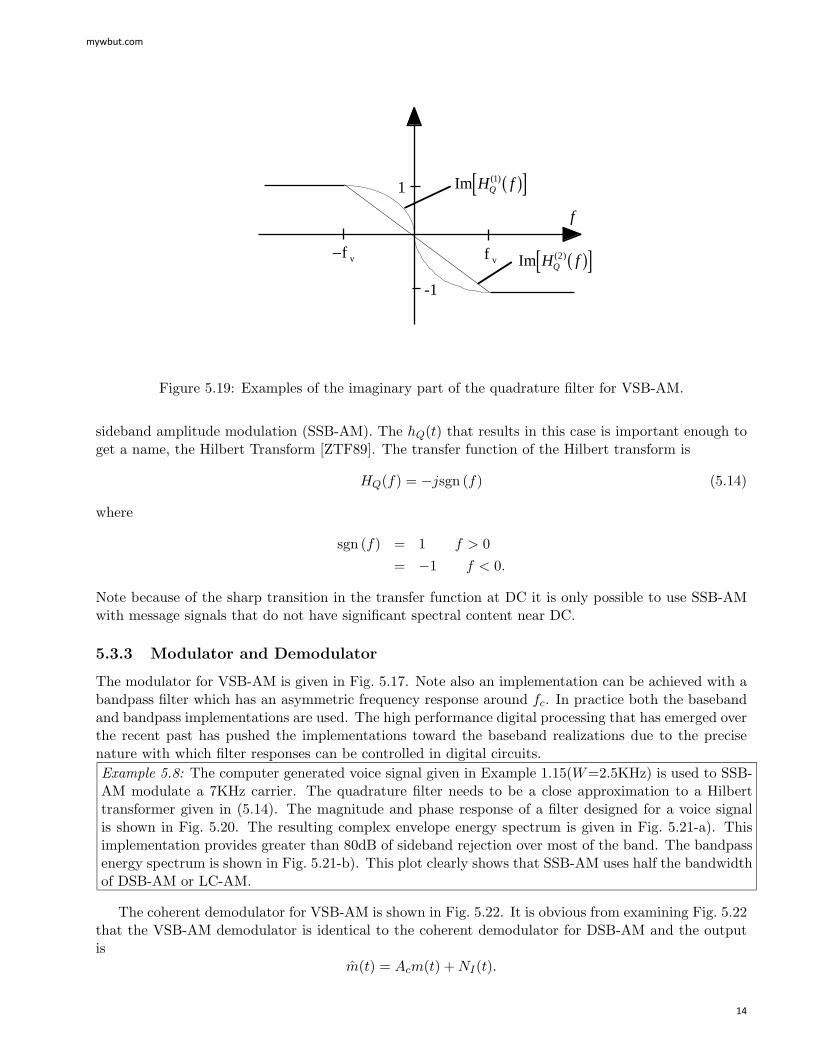
Figure 5.19: Examples of the imaginary part of the quadrature filter for VSB-AM.
sideband amplitude modulation (SSB-AM). The hQ(t) that results in this case is important enough toget a name, the Hilbert Transform [ZTF89]. The transfer function of the Hilbert transform is
HQ(f) = −jsgn (f) (5.14)
where
sgn (f) = 1 f > 0= −1 f < 0.
Note because of the sharp transition in the transfer function at DC it is only possible to use SSB-AMwith message signals that do not have significant spectral content near DC.
5.3.3 Modulator and Demodulator
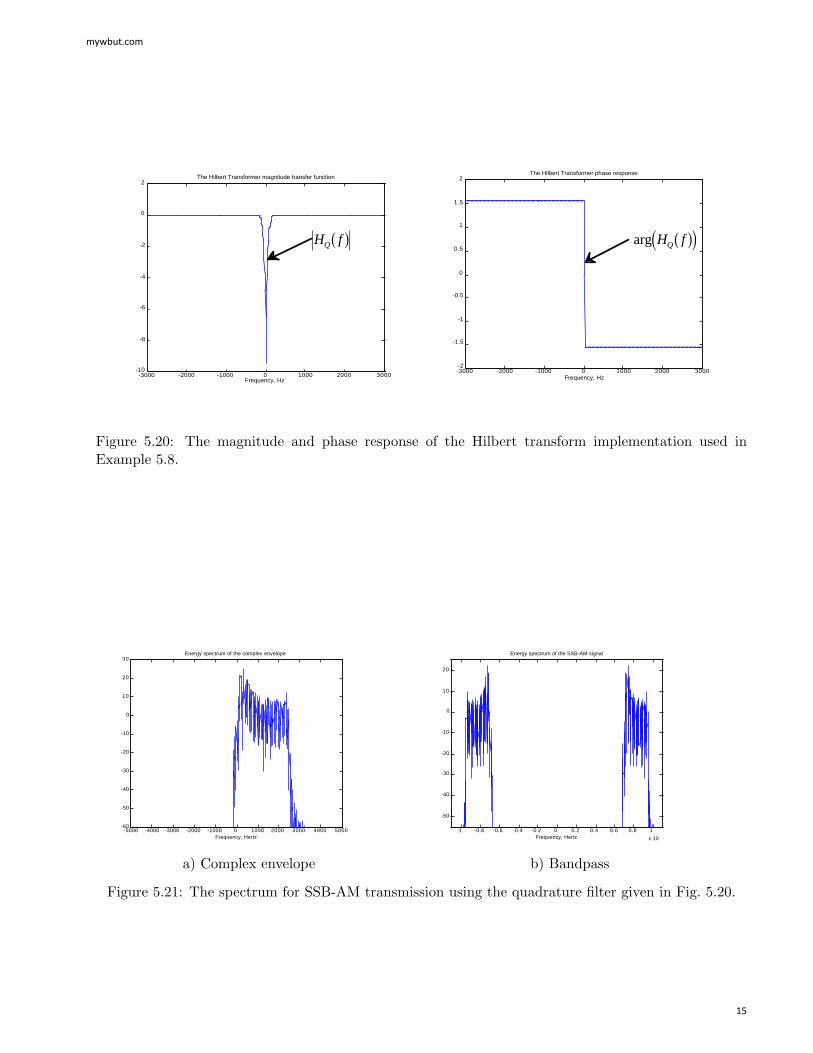
The modulator for VSB-AM is given in Fig. 5.17. Note also an implementation can be achieved with abandpass filter which has an asymmetric frequency response around fc. In practice both the basebandand bandpass implementations are used. The high performance digital processing that has emerged overthe recent past has pushed the implementations toward the baseband realizations due to the precisenature with which filter responses can be controlled in digital circuits.Example 5.8: The computer generated voice signal given in Example 1.15(W=2.5KHz) is used to SSB-AM modulate a 7KHz carrier. The quadrature filter needs to be a close approximation to a Hilberttransformer given in (5.14). The magnitude and phase response of a filter designed for a voice signalis shown in Fig. 5.20. The resulting complex envelope energy spectrum is given in Fig. 5.21-a). Thisimplementation provides greater than 80dB of sideband rejection over most of the band. The bandpassenergy spectrum is shown in Fig. 5.21-b). This plot clearly shows that SSB-AM uses half the bandwidthof DSB-AM or LC-AM.
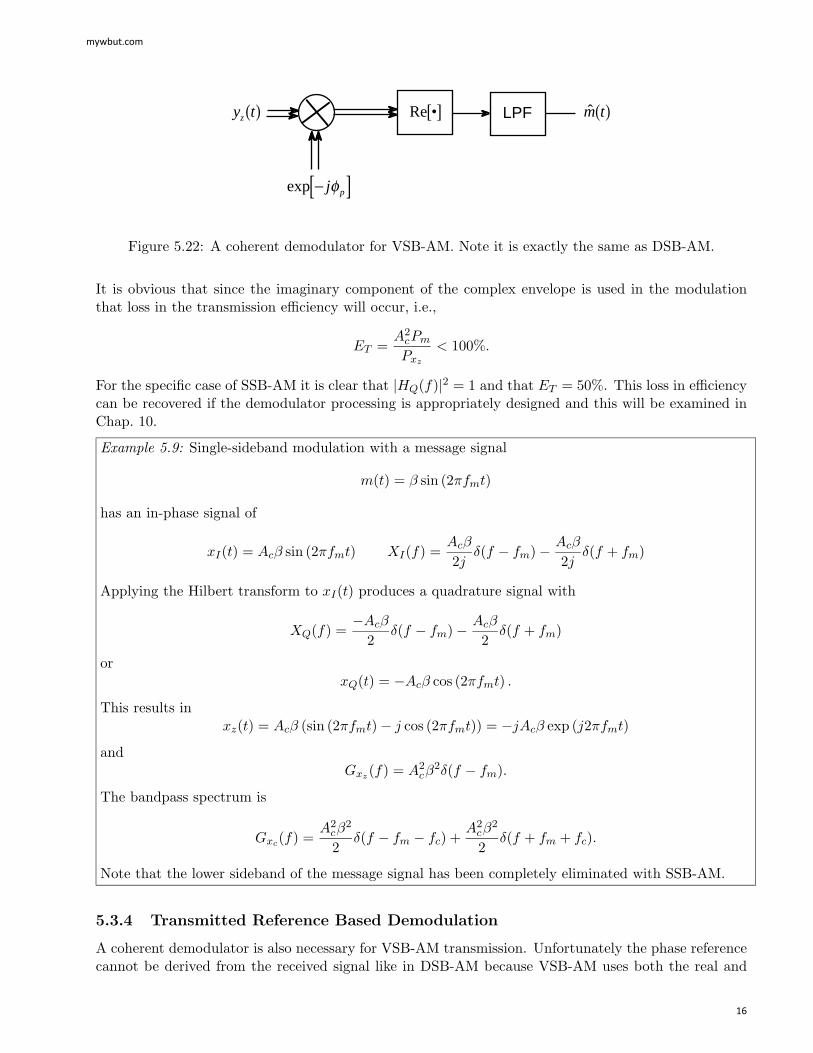
The coherent demodulator for VSB-AM is shown in Fig. 5.22. It is obvious from examining Fig. 5.22that the VSB-AM demodulator is identical to the coherent demodulator for DSB-AM and the outputis
m(t) = Acm(t) + NI(t).
mywbut.com
14
-3000 -2000 -1000 0 1000 2000 3000-10
-8
-6
-4
-2
0
2The Hilbert Transformer magnitude transfer function
Frequency, Hz
-3000 -2000 -1000 0 1000 2000 3000-2
-1.5
-1
-0.5
0
0.5
1
1.5
2The Hilbert Transformer phase response
Frequency, Hz
H fQ( ) arg H fQ( )( )
-5000 -4000 -3000 -2000 -1000 0 1000 2000 3000 4000 5000-60
-50
-40
-30
-20
-10
0
10
20
30Energy spectrum of the complex envelope
Frequency, Hertz-1 -0.8 -0.6 -0.4 -0.2 0 0.2 0.4 0.6 0.8 1
x 10
-50
-40
-30
-20
-10
0
10
20
Energy spectrum of the SSB-AM signal
Frequency, Hertz
Figure 5.20: The magnitude and phase response of the Hilbert transform implementation used inExample 5.8.
a) Complex envelope b) Bandpass
Figure 5.21: The spectrum for SSB-AM transmission using the quadrature filter given in Fig. 5.20.
mywbut.com
15
LPF
exp −[ ]j pφ
m t( )Re •[ ]y tz( )
Figure 5.22: A coherent demodulator for VSB-AM. Note it is exactly the same as DSB-AM.
It is obvious that since the imaginary component of the complex envelope is used in the modulationthat loss in the transmission efficiency will occur, i.e.,
ET =A2
cPm
Pxz
< 100%.
For the specific case of SSB-AM it is clear that |HQ(f)|2 = 1 and that ET = 50%. This loss in efficiencycan be recovered if the demodulator processing is appropriately designed and this will be examined inChap. 10.
Example 5.9: Single-sideband modulation with a message signal
m(t) = β sin (2πfmt)
has an in-phase signal of
xI(t) = Acβ sin (2πfmt) XI(f) =Acβ
2jδ(f − fm)− Acβ
2jδ(f + fm)
Applying the Hilbert transform to xI(t) produces a quadrature signal with
XQ(f) =−Acβ
2δ(f − fm)− Acβ
2δ(f + fm)
orxQ(t) = −Acβ cos (2πfmt) .
This results inxz(t) = Acβ (sin (2πfmt)− j cos (2πfmt)) = −jAcβ exp (j2πfmt)
andGxz(f) = A2
cβ2δ(f − fm).
The bandpass spectrum is
Gxc(f) =A2
cβ2
2δ(f − fm − fc) +
A2cβ
2
2δ(f + fm + fc).
Note that the lower sideband of the message signal has been completely eliminated with SSB-AM.
5.3.4 Transmitted Reference Based Demodulation
A coherent demodulator is also necessary for VSB-AM transmission. Unfortunately the phase referencecannot be derived from the received signal like in DSB-AM because VSB-AM uses both the real and
mywbut.com
16
-4 -3 -2 -1 0 1 2 3 4-4
-3
-2
-1
0
1
2
3
4Vector diagram
∑ I/QUpconverter
m t( ) NotchFilter
h tQ( )
a
fc
x tI ( )
x tQ( )
x tc( )
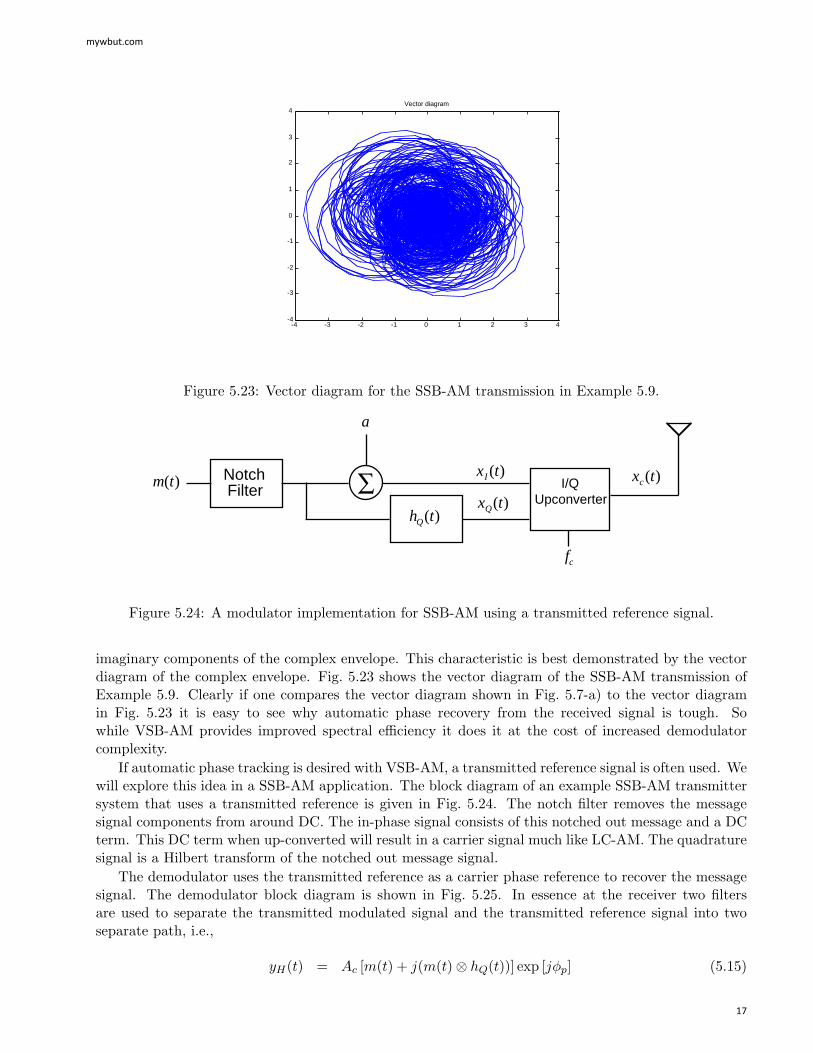
Figure 5.23: Vector diagram for the SSB-AM transmission in Example 5.9.
Figure 5.24: A modulator implementation for SSB-AM using a transmitted reference signal.
imaginary components of the complex envelope. This characteristic is best demonstrated by the vectordiagram of the complex envelope. Fig. 5.23 shows the vector diagram of the SSB-AM transmission ofExample 5.9. Clearly if one compares the vector diagram shown in Fig. 5.7-a) to the vector diagramin Fig. 5.23 it is easy to see why automatic phase recovery from the received signal is tough. Sowhile VSB-AM provides improved spectral efficiency it does it at the cost of increased demodulatorcomplexity.
If automatic phase tracking is desired with VSB-AM, a transmitted reference signal is often used. Wewill explore this idea in a SSB-AM application. The block diagram of an example SSB-AM transmittersystem that uses a transmitted reference is given in Fig. 5.24. The notch filter removes the messagesignal components from around DC. The in-phase signal consists of this notched out message and a DCterm. This DC term when up-converted will result in a carrier signal much like LC-AM. The quadraturesignal is a Hilbert transform of the notched out message signal.
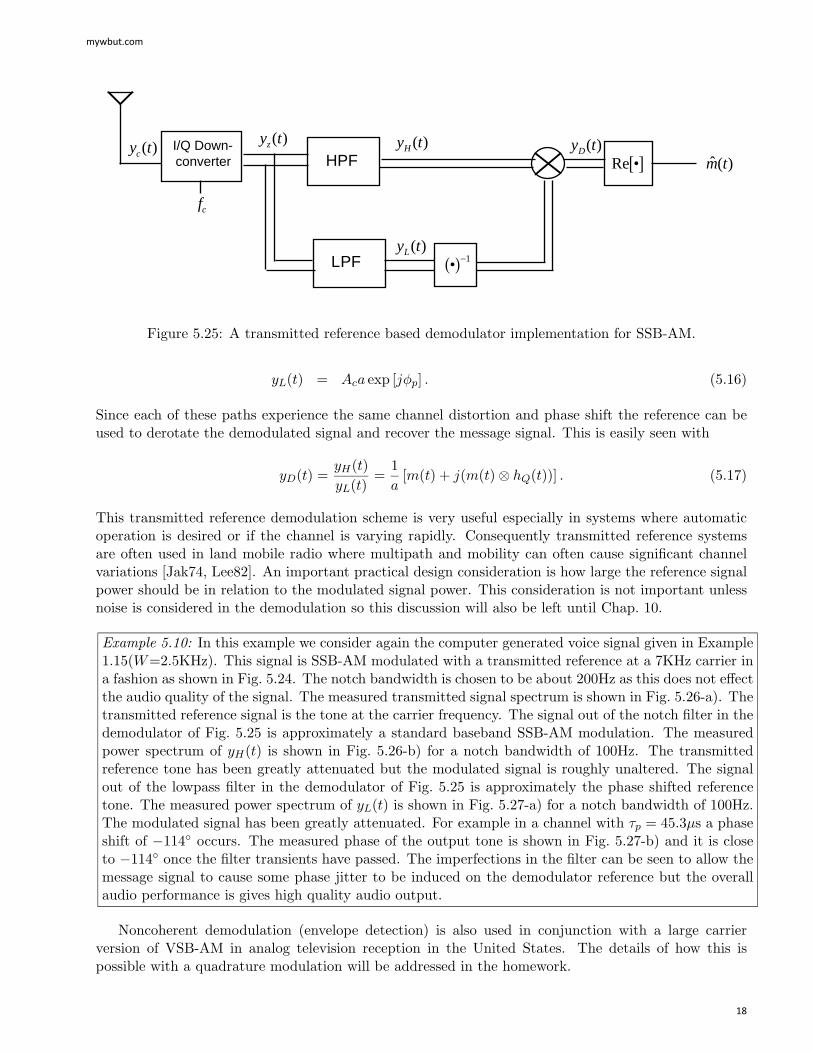
The demodulator uses the transmitted reference as a carrier phase reference to recover the messagesignal. The demodulator block diagram is shown in Fig. 5.25. In essence at the receiver two filtersare used to separate the transmitted modulated signal and the transmitted reference signal into twoseparate path, i.e.,
yH(t) = Ac [m(t) + j(m(t)⊗ hQ(t))] exp [jφp] (5.15)
mywbut.com
17
I/Q Down-converter HPF
LPF •( )−1
Re •[ ] ˆ ( )m t
fc
y tc( )y tz( ) y tH ( )
y tL( )
y tD( )
Figure 5.25: A transmitted reference based demodulator implementation for SSB-AM.
yL(t) = Aca exp [jφp] . (5.16)
Since each of these paths experience the same channel distortion and phase shift the reference can beused to derotate the demodulated signal and recover the message signal. This is easily seen with
yD(t) =yH(t)yL(t)
=1a
[m(t) + j(m(t)⊗ hQ(t))] . (5.17)
This transmitted reference demodulation scheme is very useful especially in systems where automaticoperation is desired or if the channel is varying rapidly. Consequently transmitted reference systemsare often used in land mobile radio where multipath and mobility can often cause significant channelvariations [Jak74, Lee82]. An important practical design consideration is how large the reference signalpower should be in relation to the modulated signal power. This consideration is not important unlessnoise is considered in the demodulation so this discussion will also be left until Chap. 10.
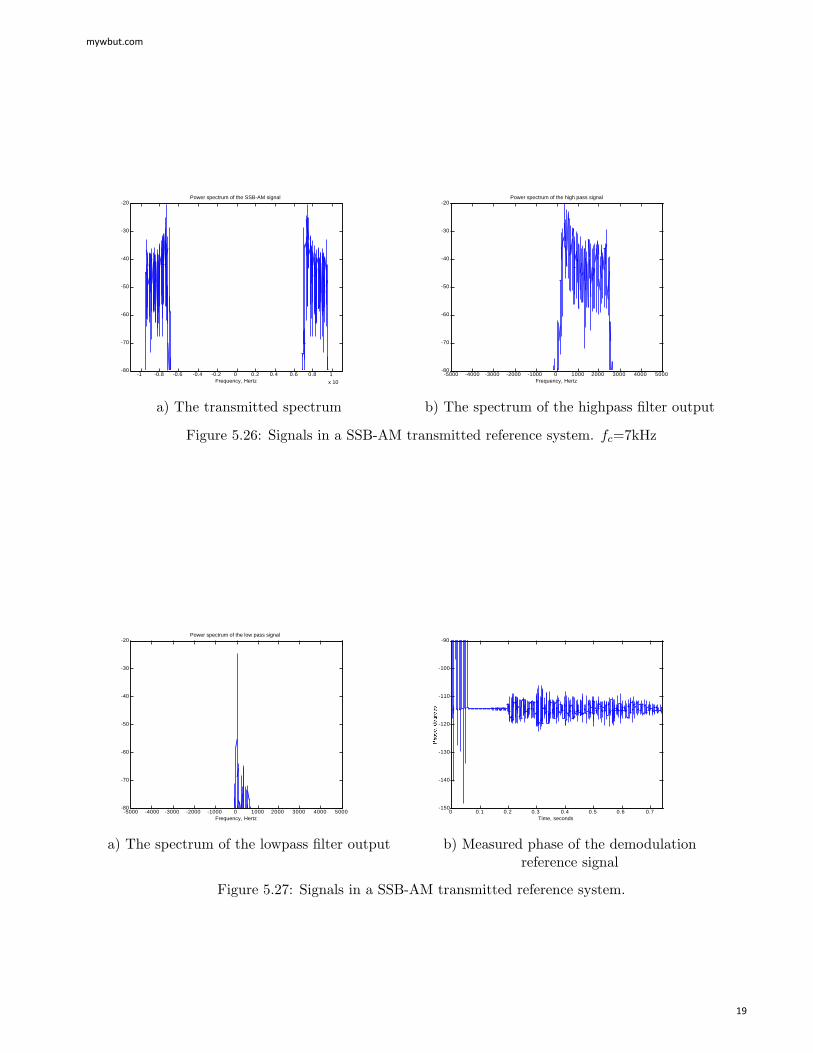
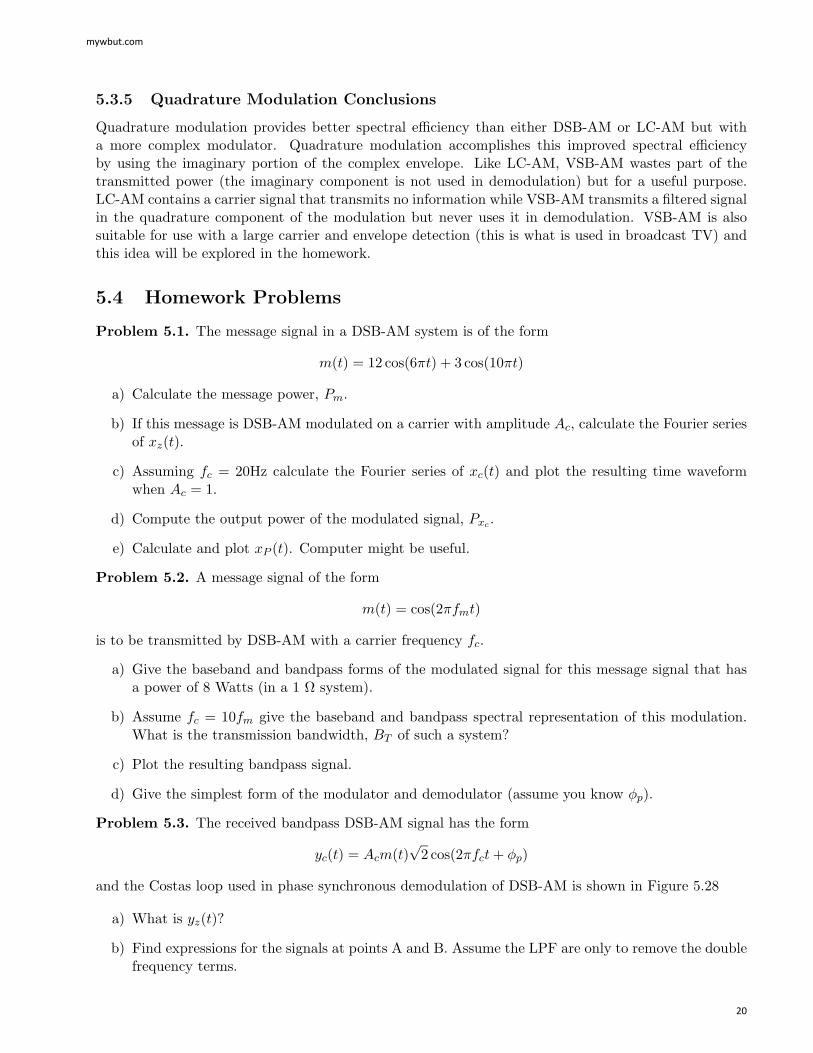
Example 5.10: In this example we consider again the computer generated voice signal given in Example1.15(W=2.5KHz). This signal is SSB-AM modulated with a transmitted reference at a 7KHz carrier ina fashion as shown in Fig. 5.24. The notch bandwidth is chosen to be about 200Hz as this does not effectthe audio quality of the signal. The measured transmitted signal spectrum is shown in Fig. 5.26-a). Thetransmitted reference signal is the tone at the carrier frequency. The signal out of the notch filter in thedemodulator of Fig. 5.25 is approximately a standard baseband SSB-AM modulation. The measuredpower spectrum of yH(t) is shown in Fig. 5.26-b) for a notch bandwidth of 100Hz. The transmittedreference tone has been greatly attenuated but the modulated signal is roughly unaltered. The signalout of the lowpass filter in the demodulator of Fig. 5.25 is approximately the phase shifted referencetone. The measured power spectrum of yL(t) is shown in Fig. 5.27-a) for a notch bandwidth of 100Hz.The modulated signal has been greatly attenuated. For example in a channel with τp = 45.3µs a phaseshift of −114 occurs. The measured phase of the output tone is shown in Fig. 5.27-b) and it is closeto −114 once the filter transients have passed. The imperfections in the filter can be seen to allow themessage signal to cause some phase jitter to be induced on the demodulator reference but the overallaudio performance is gives high quality audio output.
Noncoherent demodulation (envelope detection) is also used in conjunction with a large carrierversion of VSB-AM in analog television reception in the United States. The details of how this ispossible with a quadrature modulation will be addressed in the homework.
mywbut.com
18
-1 -0.8 -0.6 -0.4 -0.2 0 0.2 0.4 0.6 0.8 1
x 10
-80
-70
-60
-50
-40
-30
-20Power spectrum of the SSB-AM signal
Frequency, Hertz-5000 -4000 -3000 -2000 -1000 0 1000 2000 3000 4000 5000
-80
-70
-60
-50
-40
-30
-20Power spectrum of the high pass signal
Frequency, Hertz
-5000 -4000 -3000 -2000 -1000 0 1000 2000 3000 4000 5000-80
-70
-60
-50
-40
-30
-20Power spectrum of the low pass signal
Frequency, Hertz0 0.1 0.2 0.3 0.4 0.5 0.6 0.7
-150
-140
-130
-120
-110
-100
-90
Time, seconds
a) The transmitted spectrum b) The spectrum of the highpass filter output
Figure 5.26: Signals in a SSB-AM transmitted reference system. fc=7kHz
a) The spectrum of the lowpass filter output b) Measured phase of the demodulationreference signal
Figure 5.27: Signals in a SSB-AM transmitted reference system.
mywbut.com
19
5.3.5 Quadrature Modulation Conclusions
Quadrature modulation provides better spectral efficiency than either DSB-AM or LC-AM but witha more complex modulator. Quadrature modulation accomplishes this improved spectral efficiencyby using the imaginary portion of the complex envelope. Like LC-AM, VSB-AM wastes part of thetransmitted power (the imaginary component is not used in demodulation) but for a useful purpose.LC-AM contains a carrier signal that transmits no information while VSB-AM transmits a filtered signalin the quadrature component of the modulation but never uses it in demodulation. VSB-AM is alsosuitable for use with a large carrier and envelope detection (this is what is used in broadcast TV) andthis idea will be explored in the homework.
5.4 Homework Problems
Problem 5.1. The message signal in a DSB-AM system is of the form
m(t) = 12 cos(6πt) + 3 cos(10πt)
a) Calculate the message power, Pm.
b) If this message is DSB-AM modulated on a carrier with amplitude Ac, calculate the Fourier seriesof xz(t).
c) Assuming fc = 20Hz calculate the Fourier series of xc(t) and plot the resulting time waveformwhen Ac = 1.
d) Compute the output power of the modulated signal, Pxc .
e) Calculate and plot xP (t). Computer might be useful.
Problem 5.2. A message signal of the form
m(t) = cos(2πfmt)
is to be transmitted by DSB-AM with a carrier frequency fc.
a) Give the baseband and bandpass forms of the modulated signal for this message signal that hasa power of 8 Watts (in a 1 Ω system).
b) Assume fc = 10fm give the baseband and bandpass spectral representation of this modulation.What is the transmission bandwidth, BT of such a system?
c) Plot the resulting bandpass signal.
d) Give the simplest form of the modulator and demodulator (assume you know φp).
Problem 5.3. The received bandpass DSB-AM signal has the form
yc(t) = Acm(t)√
2 cos(2πfct + φp)
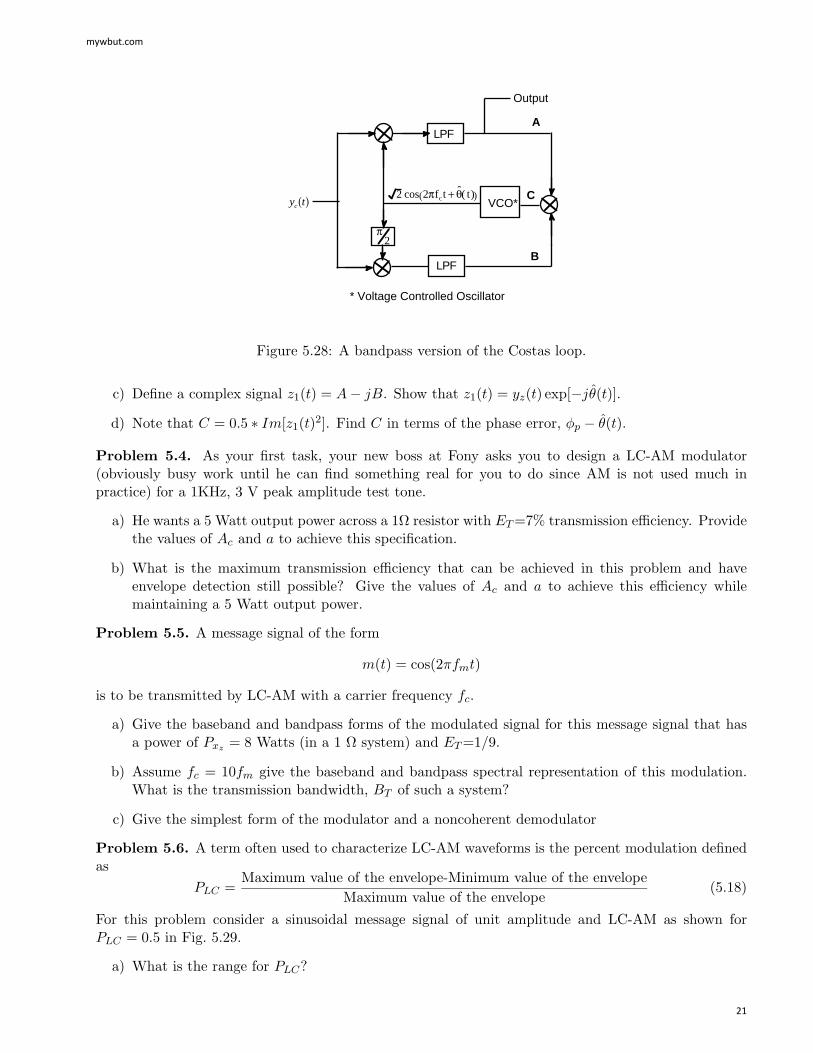
and the Costas loop used in phase synchronous demodulation of DSB-AM is shown in Figure 5.28
a) What is yz(t)?
b) Find expressions for the signals at points A and B. Assume the LPF are only to remove the doublefrequency terms.
mywbut.com
20
LPF
LPF
VCO*
Output
A
B
C
* Voltage Controlled Oscillator
2 cos 2πfc t + ˆ θ ( t)( )
π2
y tc( )
Figure 5.28: A bandpass version of the Costas loop.
c) Define a complex signal z1(t) = A− jB. Show that z1(t) = yz(t) exp[−jθ(t)].
d) Note that C = 0.5 ∗ Im[z1(t)2]. Find C in terms of the phase error, φp − θ(t).
Problem 5.4. As your first task, your new boss at Fony asks you to design a LC-AM modulator(obviously busy work until he can find something real for you to do since AM is not used much inpractice) for a 1KHz, 3 V peak amplitude test tone.
a) He wants a 5 Watt output power across a 1Ω resistor with ET =7% transmission efficiency. Providethe values of Ac and a to achieve this specification.
b) What is the maximum transmission efficiency that can be achieved in this problem and haveenvelope detection still possible? Give the values of Ac and a to achieve this efficiency whilemaintaining a 5 Watt output power.
Problem 5.5. A message signal of the form
m(t) = cos(2πfmt)
is to be transmitted by LC-AM with a carrier frequency fc.
a) Give the baseband and bandpass forms of the modulated signal for this message signal that hasa power of Pxz = 8 Watts (in a 1 Ω system) and ET =1/9.
b) Assume fc = 10fm give the baseband and bandpass spectral representation of this modulation.What is the transmission bandwidth, BT of such a system?
c) Give the simplest form of the modulator and a noncoherent demodulator
Problem 5.6. A term often used to characterize LC-AM waveforms is the percent modulation definedas
PLC =Maximum value of the envelope-Minimum value of the envelope
Maximum value of the envelope(5.18)
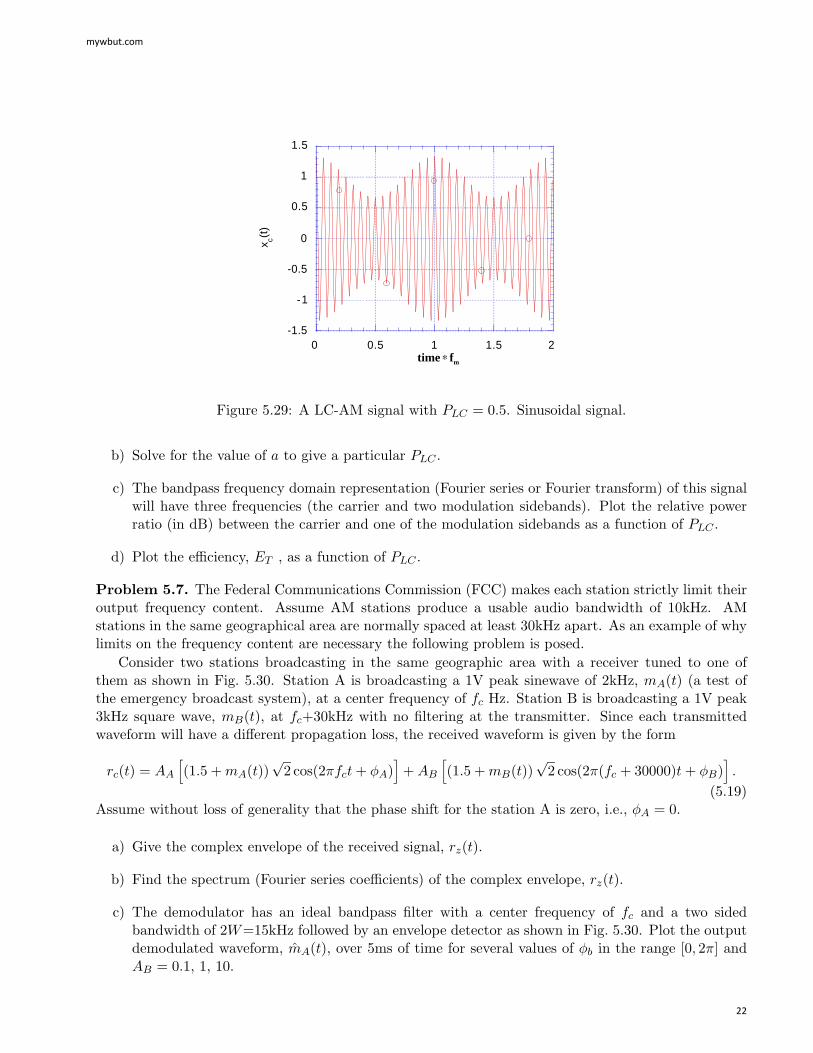
For this problem consider a sinusoidal message signal of unit amplitude and LC-AM as shown forPLC = 0.5 in Fig. 5.29.
a) What is the range for PLC?
mywbut.com
21
-1.5
-1
-0.5
0
0.5
1
1.5
0 0.5 1 1.5 2
x c(t)
i /ftime ∗ fm
Figure 5.29: A LC-AM signal with PLC = 0.5. Sinusoidal signal.
b) Solve for the value of a to give a particular PLC .
c) The bandpass frequency domain representation (Fourier series or Fourier transform) of this signalwill have three frequencies (the carrier and two modulation sidebands). Plot the relative powerratio (in dB) between the carrier and one of the modulation sidebands as a function of PLC .
d) Plot the efficiency, ET , as a function of PLC .
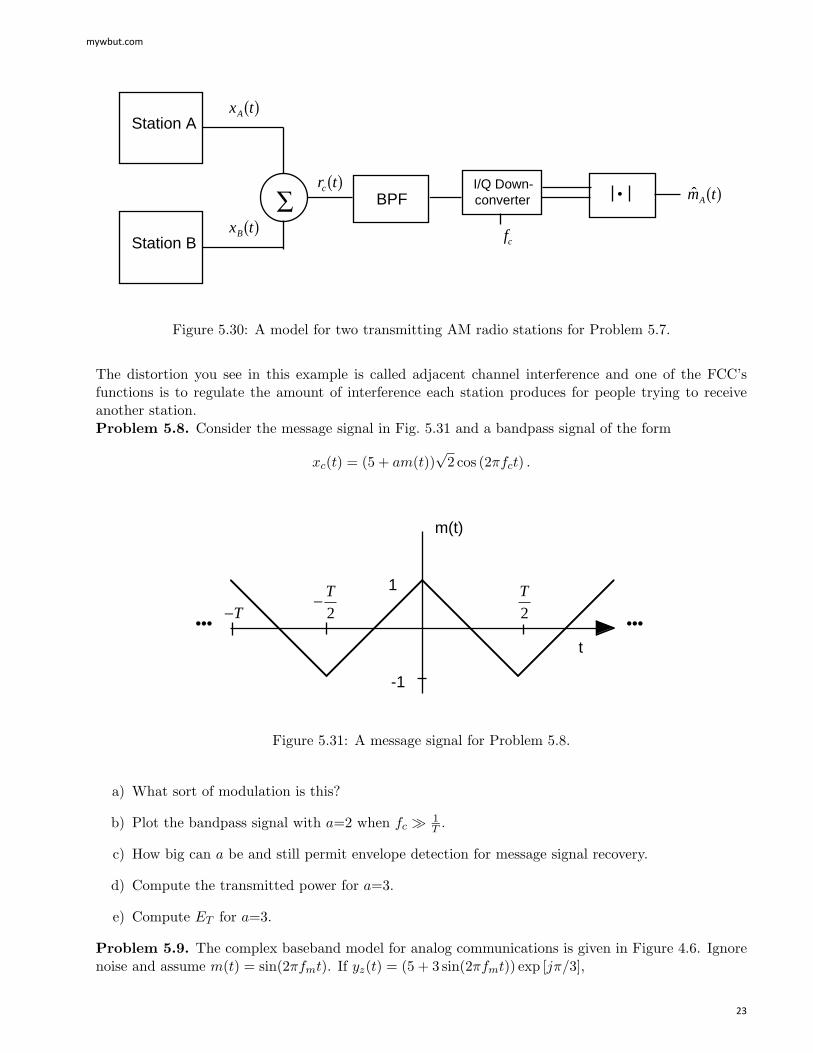
Problem 5.7. The Federal Communications Commission (FCC) makes each station strictly limit theiroutput frequency content. Assume AM stations produce a usable audio bandwidth of 10kHz. AMstations in the same geographical area are normally spaced at least 30kHz apart. As an example of whylimits on the frequency content are necessary the following problem is posed.
Consider two stations broadcasting in the same geographic area with a receiver tuned to one ofthem as shown in Fig. 5.30. Station A is broadcasting a 1V peak sinewave of 2kHz, mA(t) (a test ofthe emergency broadcast system), at a center frequency of fc Hz. Station B is broadcasting a 1V peak3kHz square wave, mB(t), at fc+30kHz with no filtering at the transmitter. Since each transmittedwaveform will have a different propagation loss, the received waveform is given by the form
rc(t) = AA
[(1.5 + mA(t))
√2 cos(2πfct + φA)
]+ AB
[(1.5 + mB(t))
√2 cos(2π(fc + 30000)t + φB)
].
(5.19)Assume without loss of generality that the phase shift for the station A is zero, i.e., φA = 0.
a) Give the complex envelope of the received signal, rz(t).
b) Find the spectrum (Fourier series coefficients) of the complex envelope, rz(t).
c) The demodulator has an ideal bandpass filter with a center frequency of fc and a two sidedbandwidth of 2W=15kHz followed by an envelope detector as shown in Fig. 5.30. Plot the outputdemodulated waveform, mA(t), over 5ms of time for several values of φb in the range [0, 2π] andAB = 0.1, 1, 10.
mywbut.com
22
Station A
Station B
I/Q Down-converter
x tA( )
x tB( )∑
fc
•BPF m tA( )r tc( )
••• •••
m(t)
t
1
-1
− T
2T
2−T
Figure 5.30: A model for two transmitting AM radio stations for Problem 5.7.
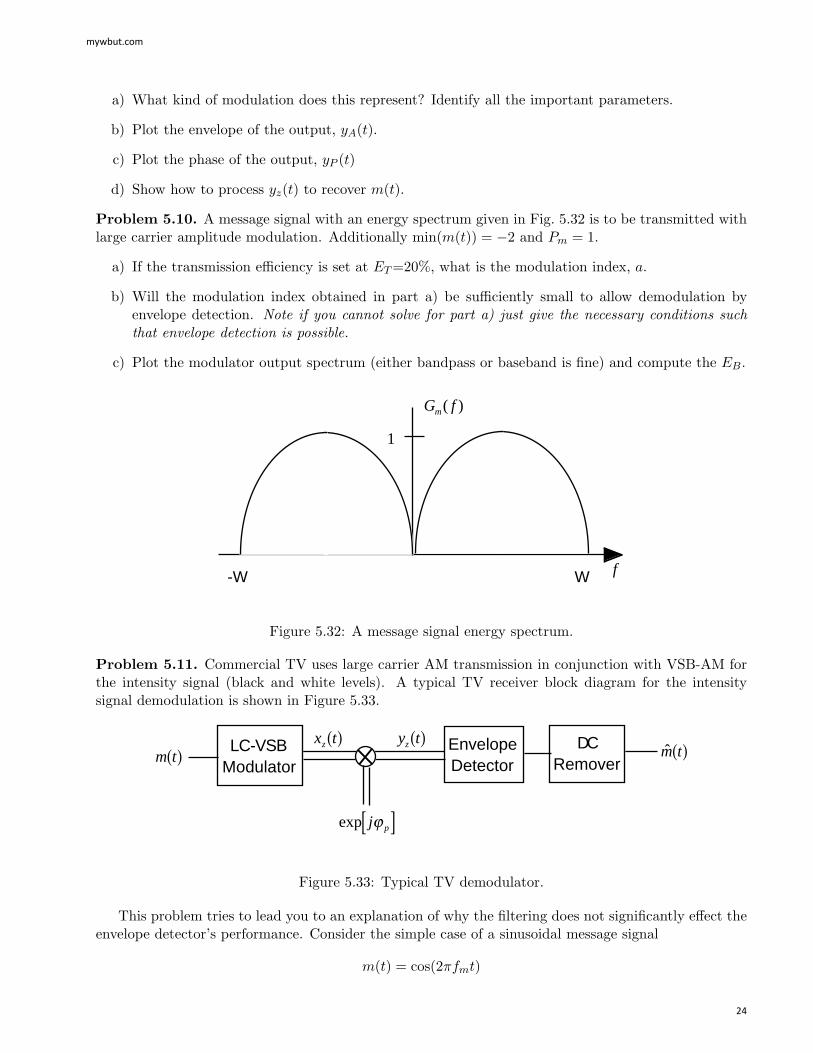
The distortion you see in this example is called adjacent channel interference and one of the FCC’sfunctions is to regulate the amount of interference each station produces for people trying to receiveanother station.Problem 5.8. Consider the message signal in Fig. 5.31 and a bandpass signal of the form
xc(t) = (5 + am(t))√
2 cos (2πfct) .
Figure 5.31: A message signal for Problem 5.8.
a) What sort of modulation is this?
b) Plot the bandpass signal with a=2 when fc 1T .
c) How big can a be and still permit envelope detection for message signal recovery.
d) Compute the transmitted power for a=3.
e) Compute ET for a=3.
Problem 5.9. The complex baseband model for analog communications is given in Figure 4.6. Ignorenoise and assume m(t) = sin(2πfmt). If yz(t) = (5 + 3 sin(2πfmt)) exp [jπ/3],
mywbut.com
23
G fm( )
f
1
-W W
LC-VSBModulator
EnvelopeDetector
DCRemover
exp j pϕ[ ]
m t( ) m t( )x tz( ) y tz( )
a) What kind of modulation does this represent? Identify all the important parameters.
b) Plot the envelope of the output, yA(t).
c) Plot the phase of the output, yP (t)
d) Show how to process yz(t) to recover m(t).
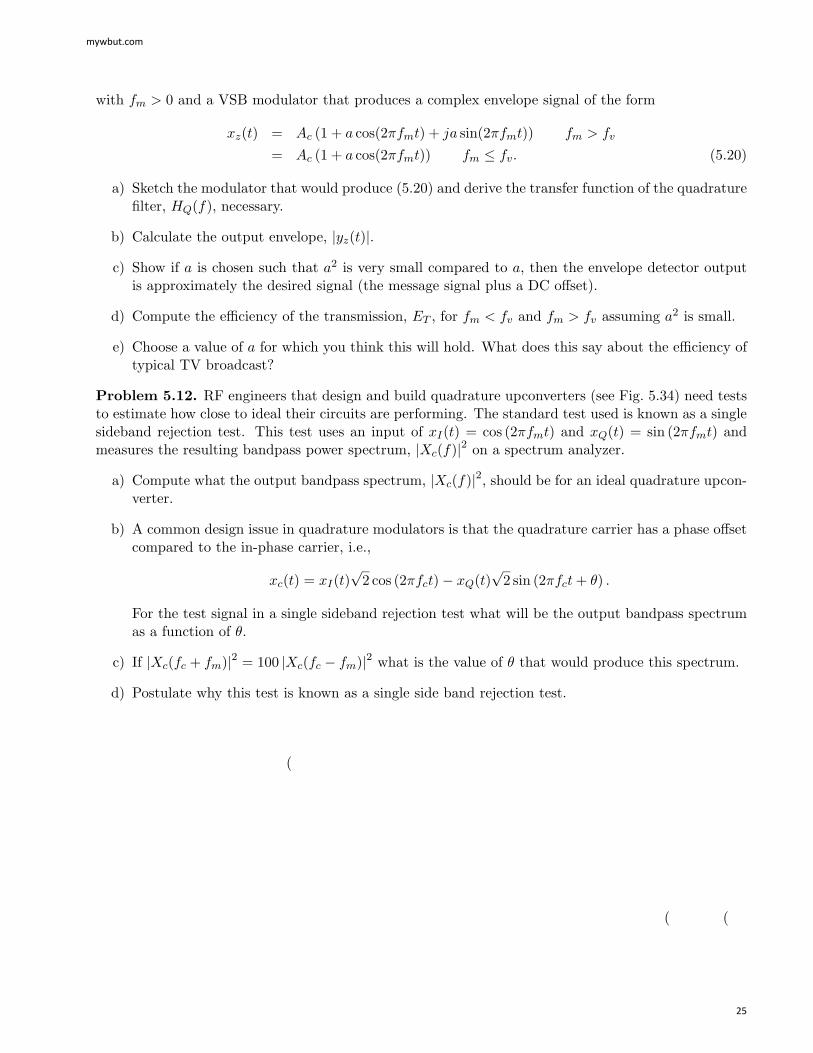
Problem 5.10. A message signal with an energy spectrum given in Fig. 5.32 is to be transmitted withlarge carrier amplitude modulation. Additionally min(m(t)) = −2 and Pm = 1.
a) If the transmission efficiency is set at ET =20%, what is the modulation index, a.
b) Will the modulation index obtained in part a) be sufficiently small to allow demodulation byenvelope detection. Note if you cannot solve for part a) just give the necessary conditions suchthat envelope detection is possible.
c) Plot the modulator output spectrum (either bandpass or baseband is fine) and compute the EB.
Figure 5.32: A message signal energy spectrum.
Problem 5.11. Commercial TV uses large carrier AM transmission in conjunction with VSB-AM forthe intensity signal (black and white levels). A typical TV receiver block diagram for the intensitysignal demodulation is shown in Figure 5.33.
Figure 5.33: Typical TV demodulator.
This problem tries to lead you to an explanation of why the filtering does not significantly effect theenvelope detector’s performance. Consider the simple case of a sinusoidal message signal
m(t) = cos(2πfmt)
mywbut.com
24
with fm > 0 and a VSB modulator that produces a complex envelope signal of the form
xz(t) = Ac (1 + a cos(2πfmt) + ja sin(2πfmt)) fm > fv
= Ac (1 + a cos(2πfmt)) fm ≤ fv. (5.20)
a) Sketch the modulator that would produce (5.20) and derive the transfer function of the quadraturefilter, HQ(f), necessary.
b) Calculate the output envelope, |yz(t)|.
c) Show if a is chosen such that a2 is very small compared to a, then the envelope detector outputis approximately the desired signal (the message signal plus a DC offset).
d) Compute the efficiency of the transmission, ET , for fm < fv and fm > fv assuming a2 is small.
e) Choose a value of a for which you think this will hold. What does this say about the efficiency oftypical TV broadcast?
Problem 5.12. RF engineers that design and build quadrature upconverters (see Fig. 5.34) need teststo estimate how close to ideal their circuits are performing. The standard test used is known as a singlesideband rejection test. This test uses an input of xI(t) = cos (2πfmt) and xQ(t) = sin (2πfmt) andmeasures the resulting bandpass power spectrum, |Xc(f)|2 on a spectrum analyzer.
a) Compute what the output bandpass spectrum, |Xc(f)|2, should be for an ideal quadrature upcon-verter.
b) A common design issue in quadrature modulators is that the quadrature carrier has a phase offsetcompared to the in-phase carrier, i.e.,
xc(t) = xI(t)√
2 cos (2πfct)− xQ(t)√
2 sin (2πfct + θ) .
For the test signal in a single sideband rejection test what will be the output bandpass spectrumas a function of θ.
c) If |Xc(fc + fm)|2 = 100 |Xc(fc − fm)|2 what is the value of θ that would produce this spectrum.
d) Postulate why this test is known as a single side band rejection test.
(
( (
mywbut.com
25