
Alignment of a Muon Tomography Station with GEM Detector
49
Afrouz Ataei Advisor: Prof. Marcus Hohlmann Alignment of a Muon Tomography Station with GEM Detectors Master’s Thesis Defense 1 July 8,2016 Committee Members : Dr. Francisco Yumiceva Prof. Debasis Mitra
Transcript of Alignment of a Muon Tomography Station with GEM Detector
Afrouz Ataei
Advisor: Prof. Marcus Hohlmann
Alignment of a Muon Tomography Station
with GEM Detectors
Master’s Thesis Defense
1
July 8,2016
Committee Members :
Dr. Francisco Yumiceva
Prof. Debasis Mitra
What is Muon tomography?
The Gas Electron Multiplier
Scalable Readout System(SRS)
Alignment of GEM Detectors Using Tracks
Conclusion
Future Work
2
Outline
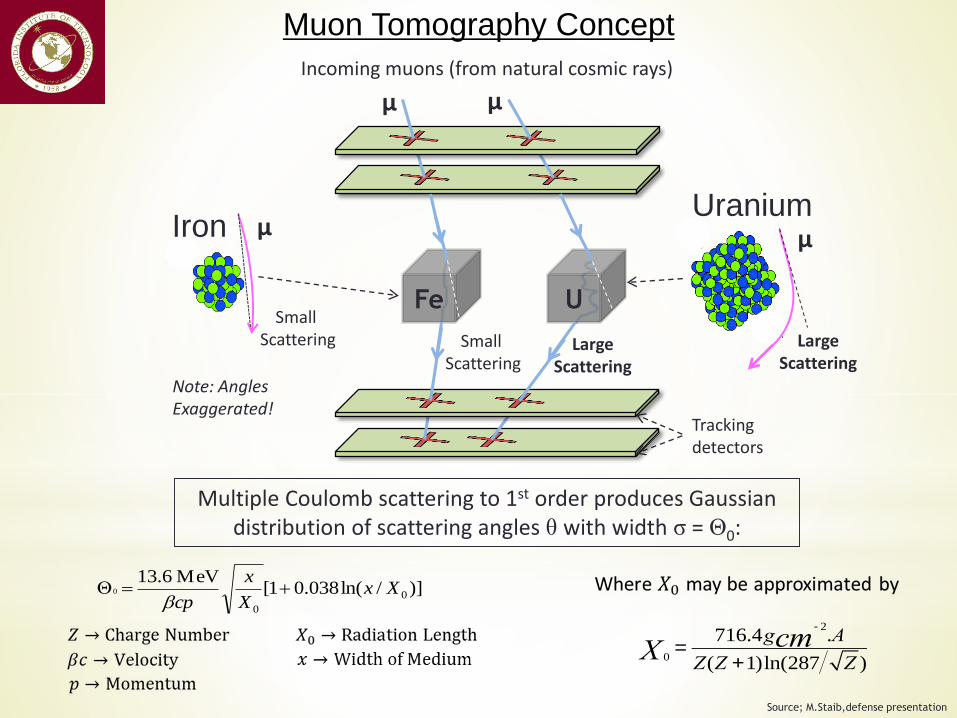
Muon Tomography Concept
μμ
Fe U
LargeScattering
Small Scattering
μIron
Small Scattering
Uraniumμ
LargeScattering
μμ
Incoming muons (from natural cosmic rays)
Note: Angles Exaggerated!
)]/ln(038.01[MeV6.13
0
0
0 XxX
x
cp
Tracking detectors
Multiple Coulomb scattering to 1st order produces Gaussian distribution of scattering angles θ with width σ = Θ0:
0X =716.4g
-2
cm .A
Z(Z +1)ln(287 Z )
Source; M.Staib,defense presentation
4
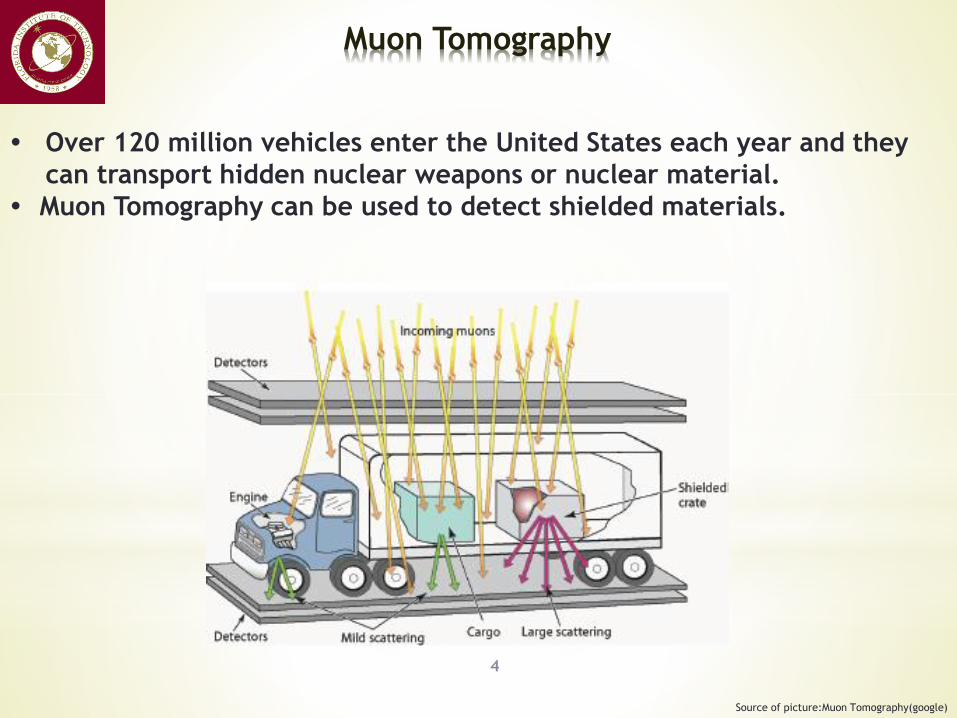
Muon Tomography
Over 120 million vehicles enter the United States each year and they
can transport hidden nuclear weapons or nuclear material.
Muon Tomography can be used to detect shielded materials.
Source of picture:Muon Tomography(google)
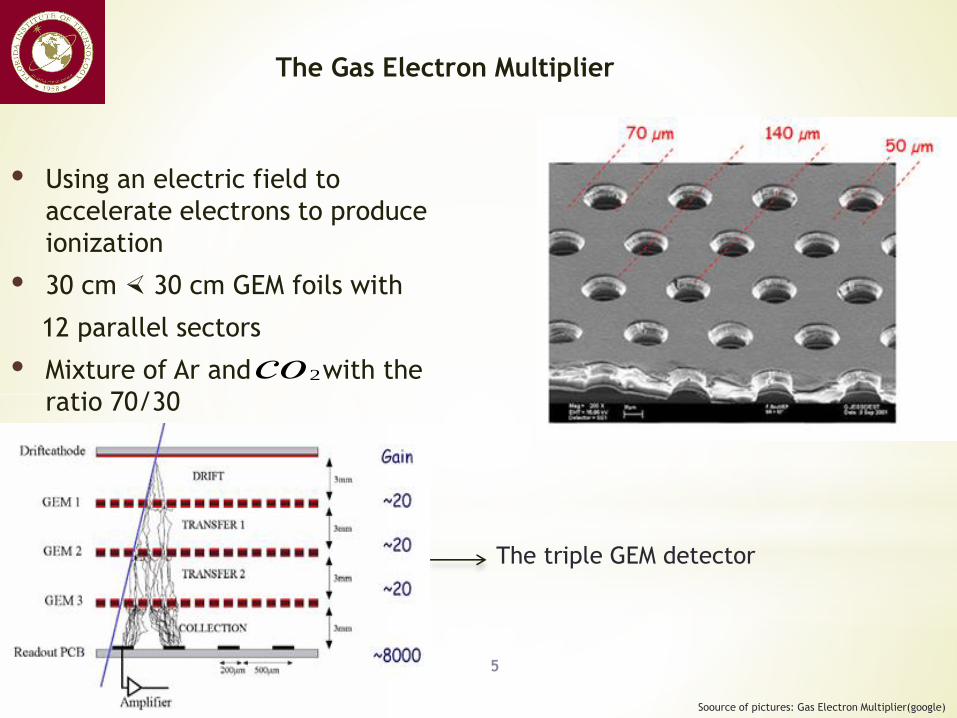
The Gas Electron Multiplier
Using an electric field to
accelerate electrons to produce
ionization
30 cm 30 cm GEM foils with
12 parallel sectors
Mixture of Ar and with the
ratio 70/30
5
The triple GEM detector
2co
Soource of pictures: Gas Electron Multiplier(google)
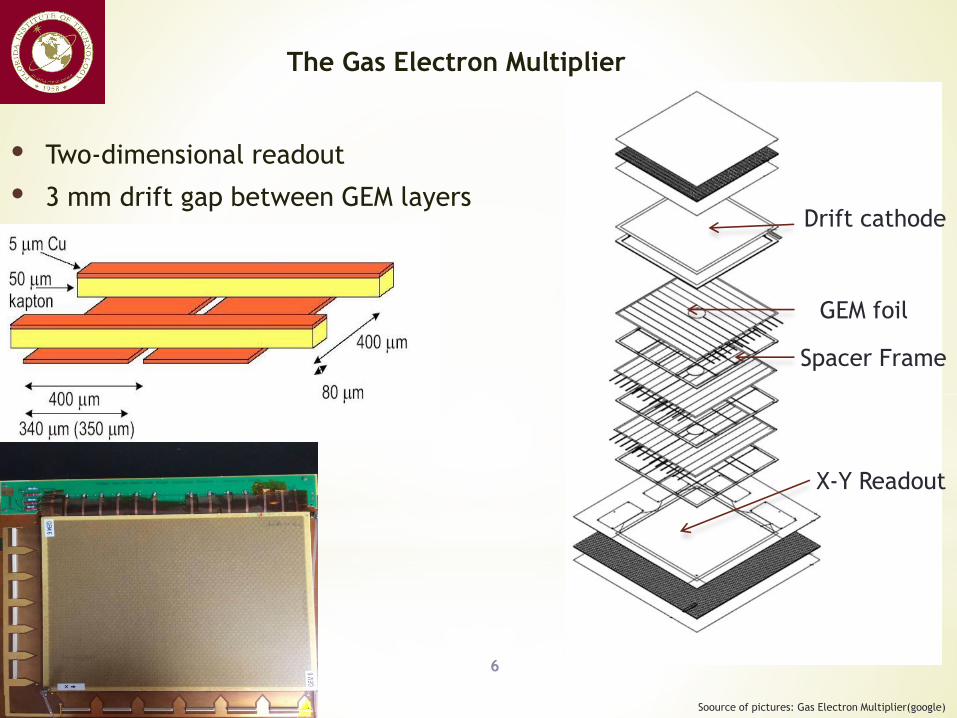
The Gas Electron Multiplier
Two-dimensional readout
3 mm drift gap between GEM layers
6
Drift cathode
GEM foil
Spacer Frame
X-Y Readout
Soource of pictures: Gas Electron Multiplier(google)
Data Acquisition
7
- Detector Data is sent to DAQ for event by event.
- DATE(Data Acquisition and Test Environment) is used for
collecting raw data from all FECs.
- AMORE(Automatic MOnitoRing Environment) is used for
offline and online analysis.
- Common and publisher folders are created for AMORE
version using for MTS .
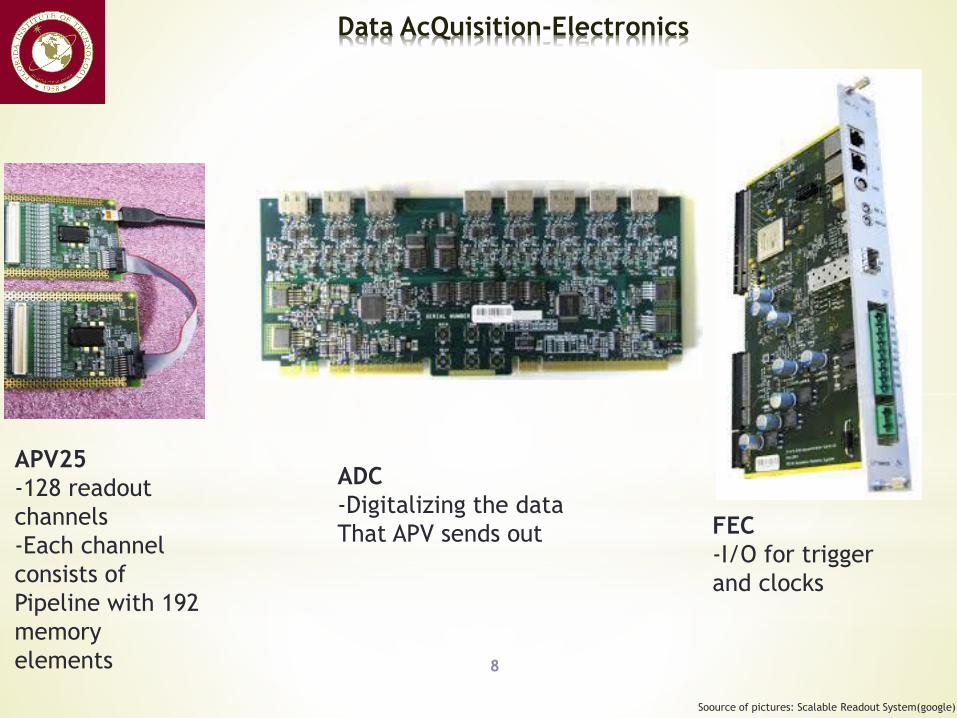
Data AcQuisition-Electronics
8
APV25
-128 readout
channels
-Each channel
consists of
Pipeline with 192
memory
elements
ADC
-Digitalizing the data
That APV sends out FEC
-I/O for trigger
and clocks
Soource of pictures: Scalable Readout System(google)
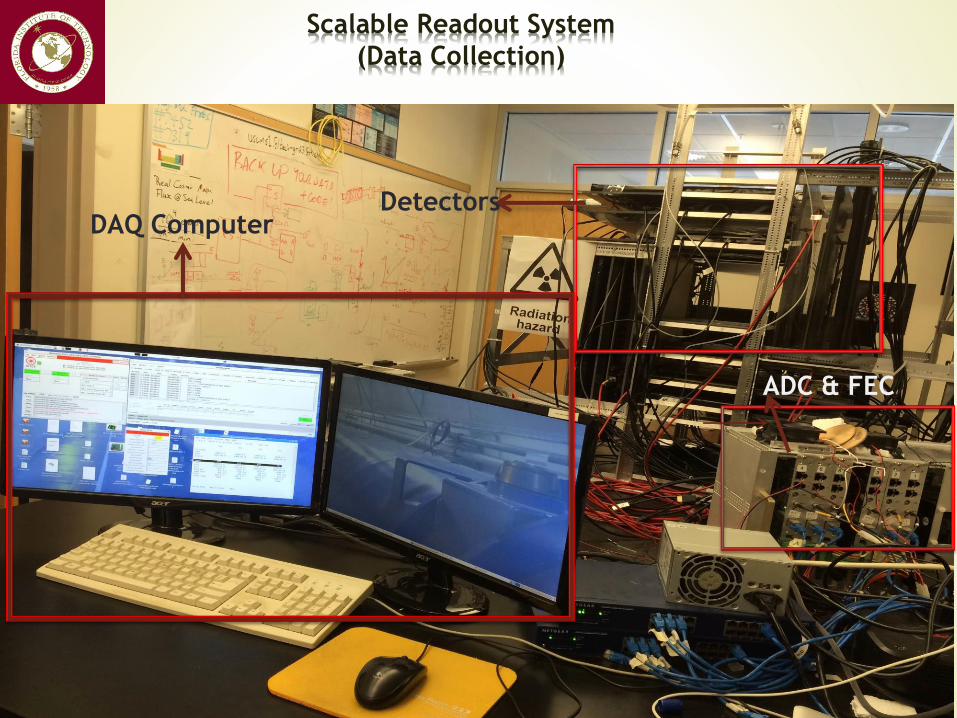
Scalable Readout System
(Data Collection)
9
Detectors
ADC & FEC
DAQ Computer
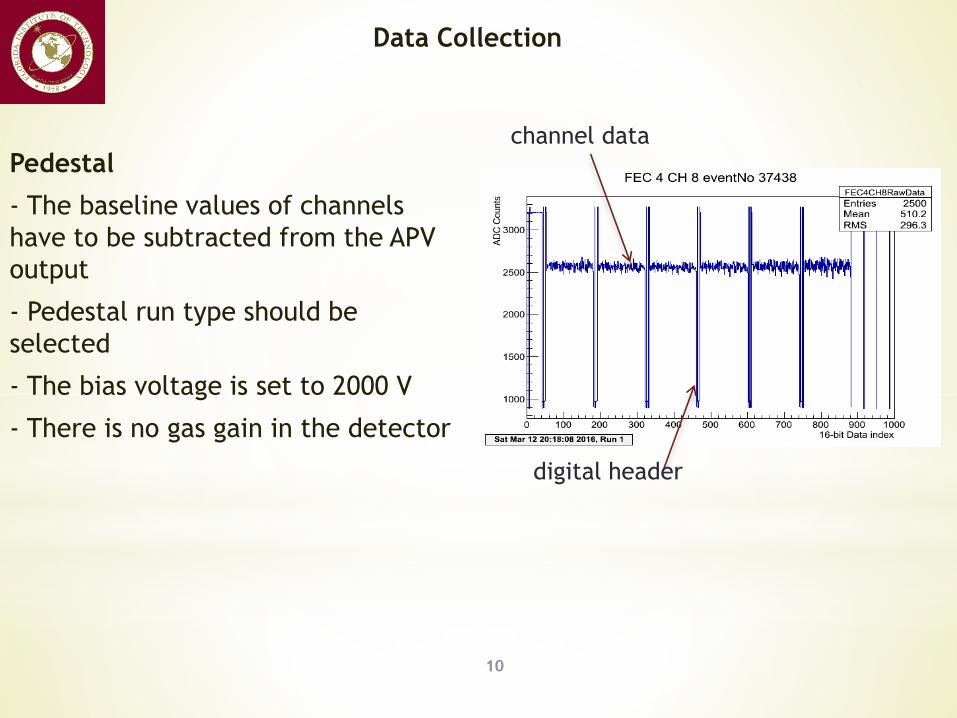
Data Collection
Pedestal
- The baseline values of channels
have to be subtracted from the APV
output
- Pedestal run type should be
selected
- The bias voltage is set to 2000 V
- There is no gas gain in the detector
10
digital header
channel data
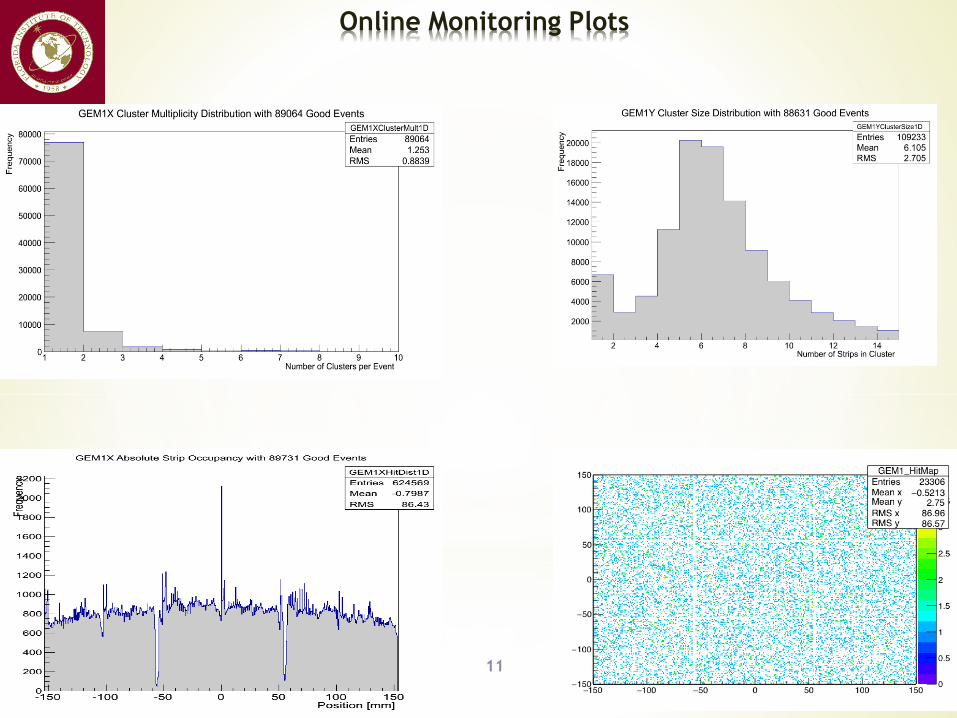
Online Monitoring Plots
11
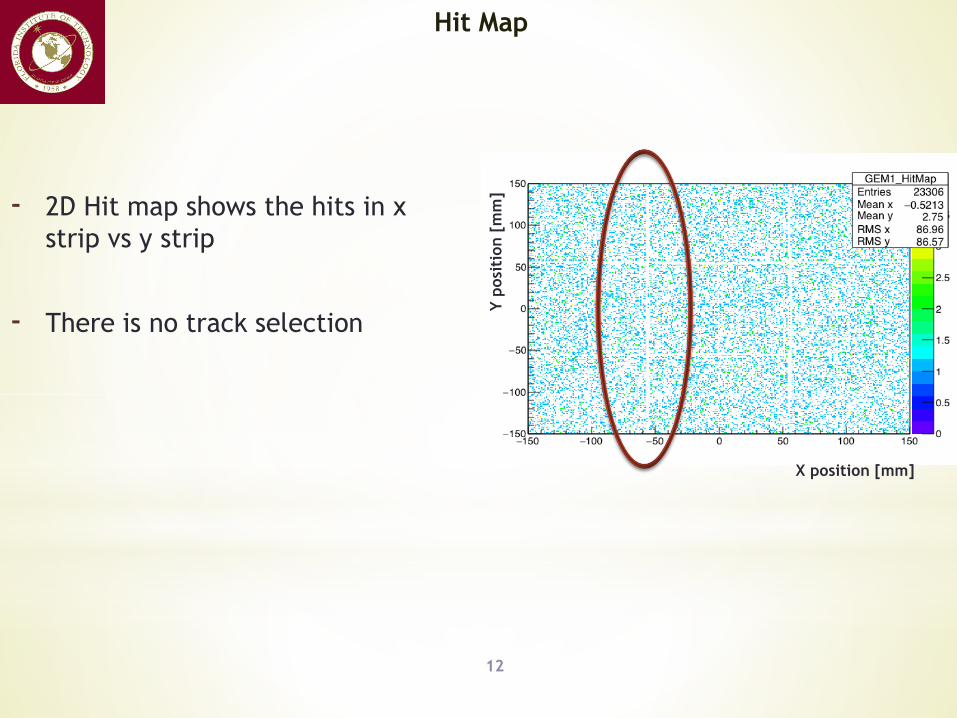
Hit Map
- 2D Hit map shows the hits in x
strip vs y strip
- There is no track selection
12
X position [mm]
Y p
osi
tion [
mm
]
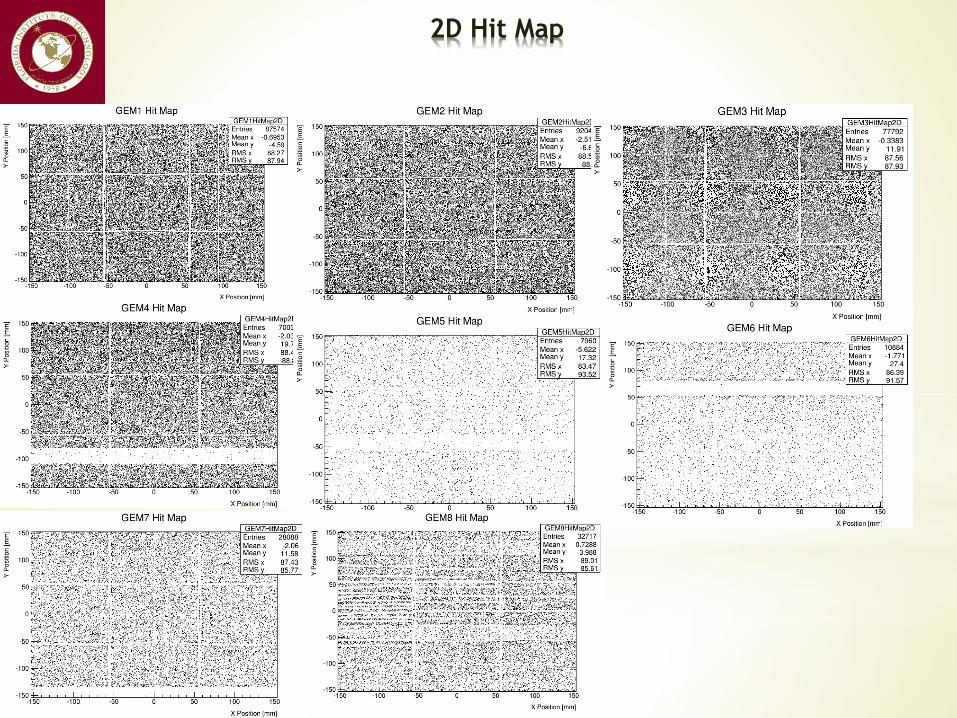
2D Hit Map
13
14
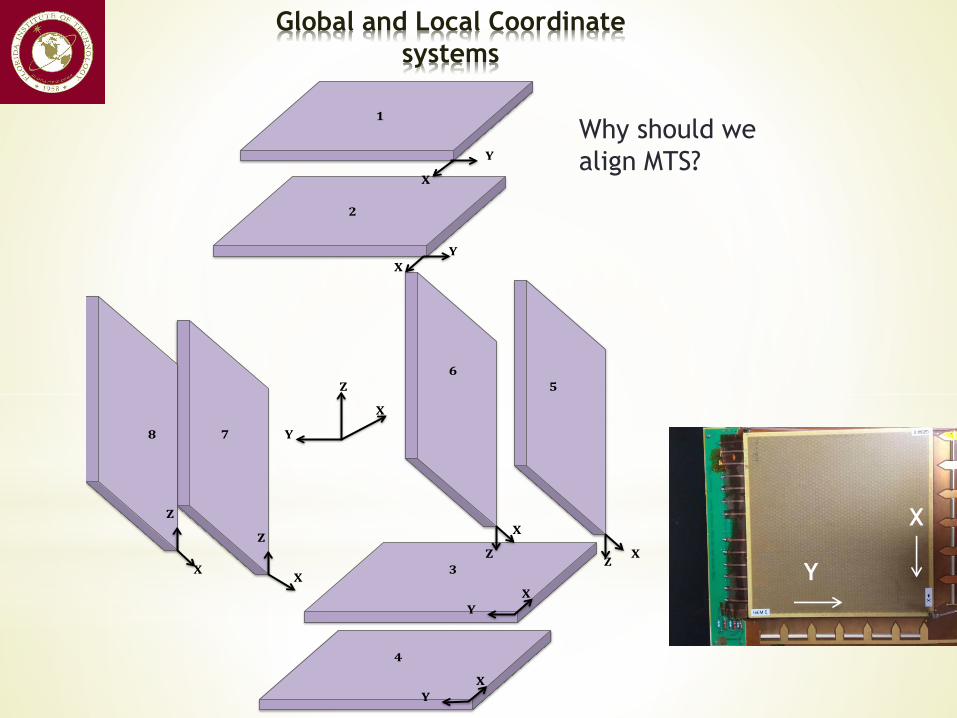
Global and Local Coordinate
systems
Why should we
align MTS?
Y
X
Y
X
X
XZ
X
Z
Z
Z
XX
X
X
Y
Y
1
2
5
6
78
4
3
1
2
Z
Y
X
Y
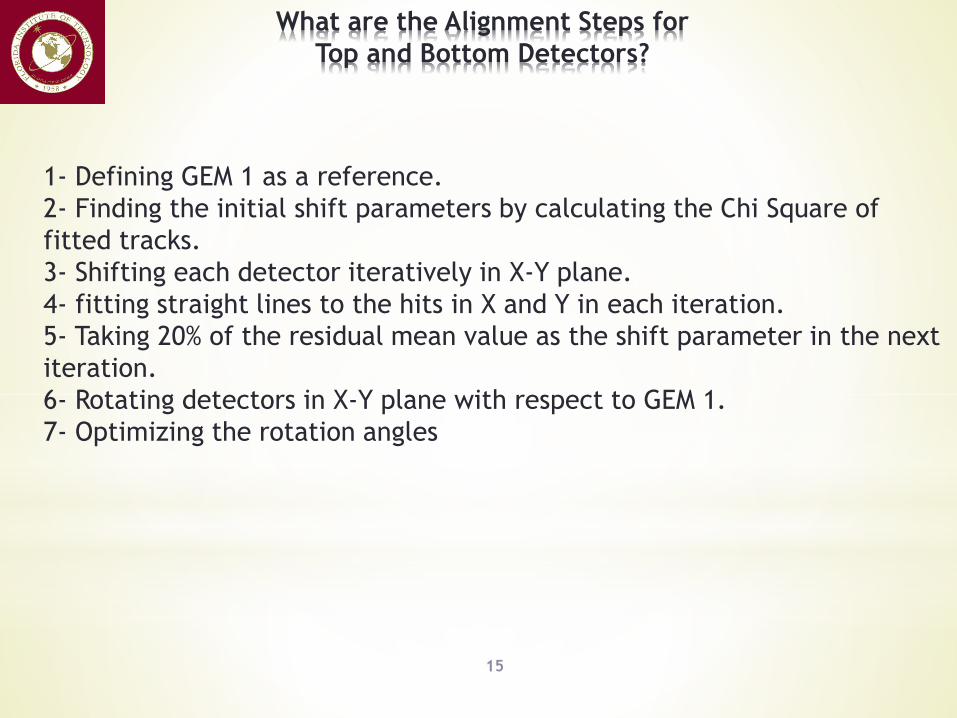
What are the Alignment Steps for
Top and Bottom Detectors?
15
1- Defining GEM 1 as a reference.
2- Finding the initial shift parameters by calculating the Chi Square of
fitted tracks.
3- Shifting each detector iteratively in X-Y plane.
4- fitting straight lines to the hits in X and Y in each iteration.
5- Taking 20% of the residual mean value as the shift parameter in the next
iteration.
6- Rotating detectors in X-Y plane with respect to GEM 1.
7- Optimizing the rotation angles
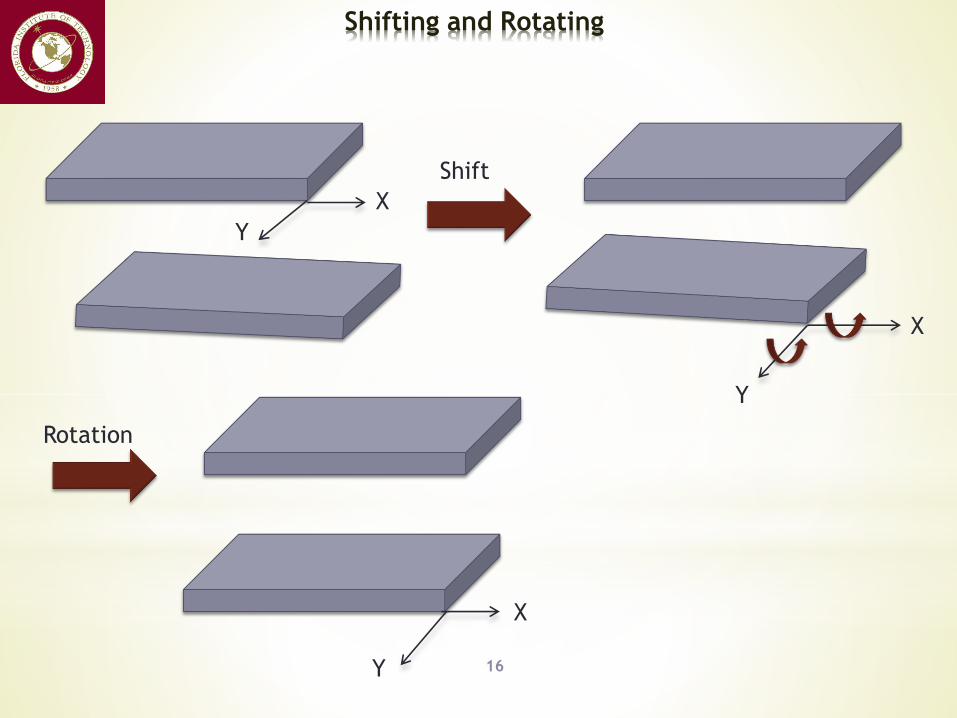
Shifting and Rotating
16
Shift
Rotation
X
Y
X
Y
X
Y
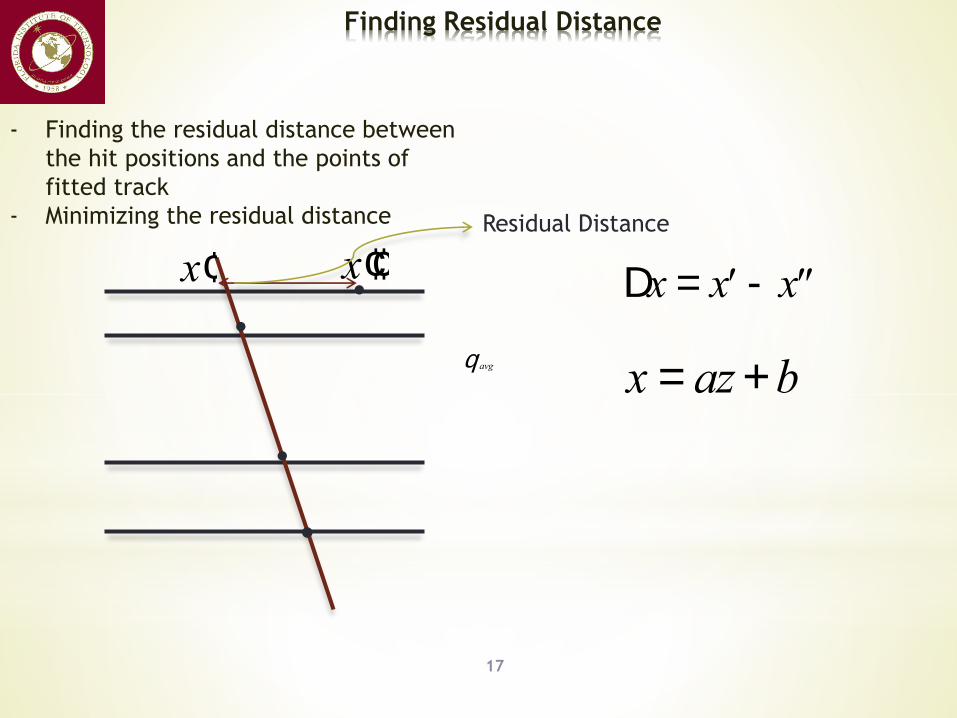
Finding Residual Distance
17
- Finding the residual distance between
the hit positions and the points of
fitted track
- Minimizing the residual distance
.
.
.
.avgq
Dx = ¢x - ¢¢x¢x ¢¢x
x = az+b
Residual Distance
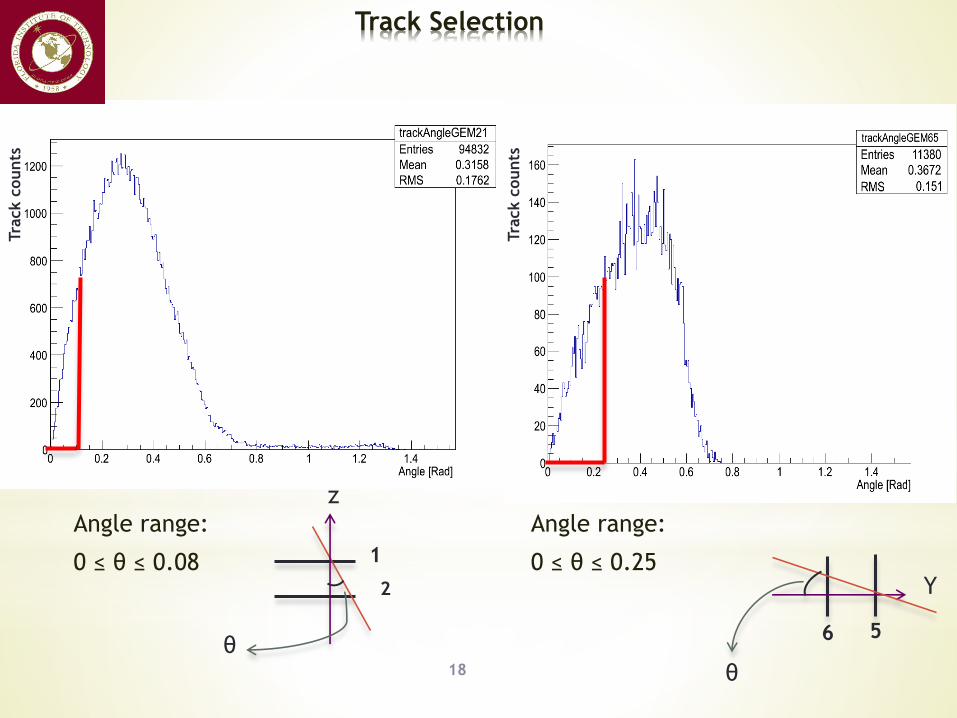
Angle range:
0 ≤ θ ≤ 0.08
Angle range:
0 ≤ θ ≤ 0.25
18
Track SelectionTra
ck c
ounts
Tra
ck c
ounts
z
1
2
56
Y
θθ
19
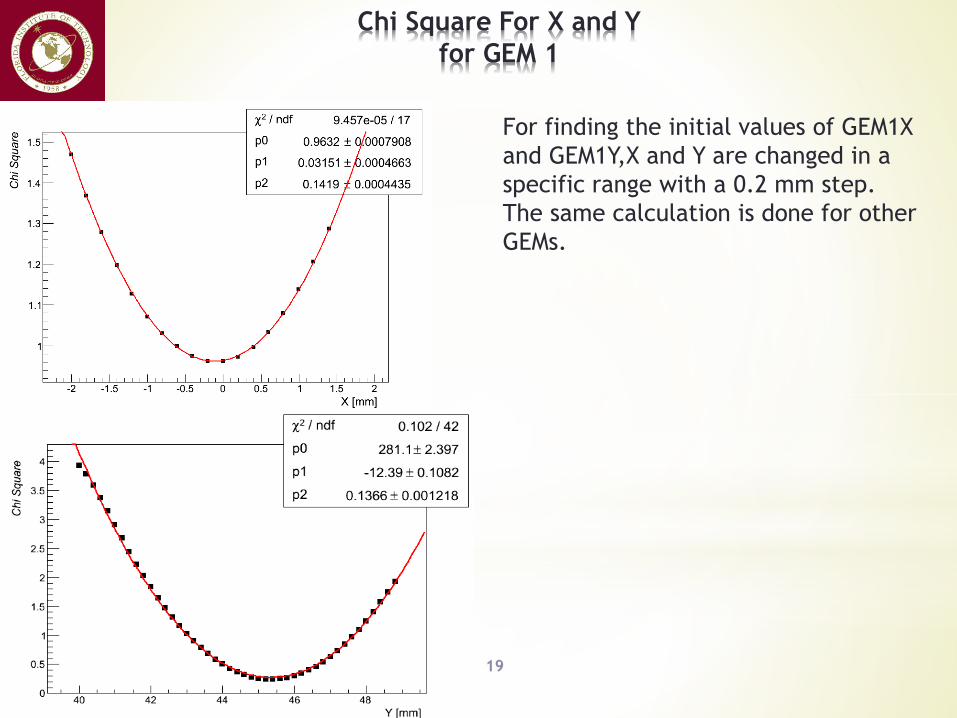
Chi Square For X and Y
for GEM 1
For finding the initial values of GEM1X
and GEM1Y,X and Y are changed in a
specific range with a 0.2 mm step.
The same calculation is done for other
GEMs.
20
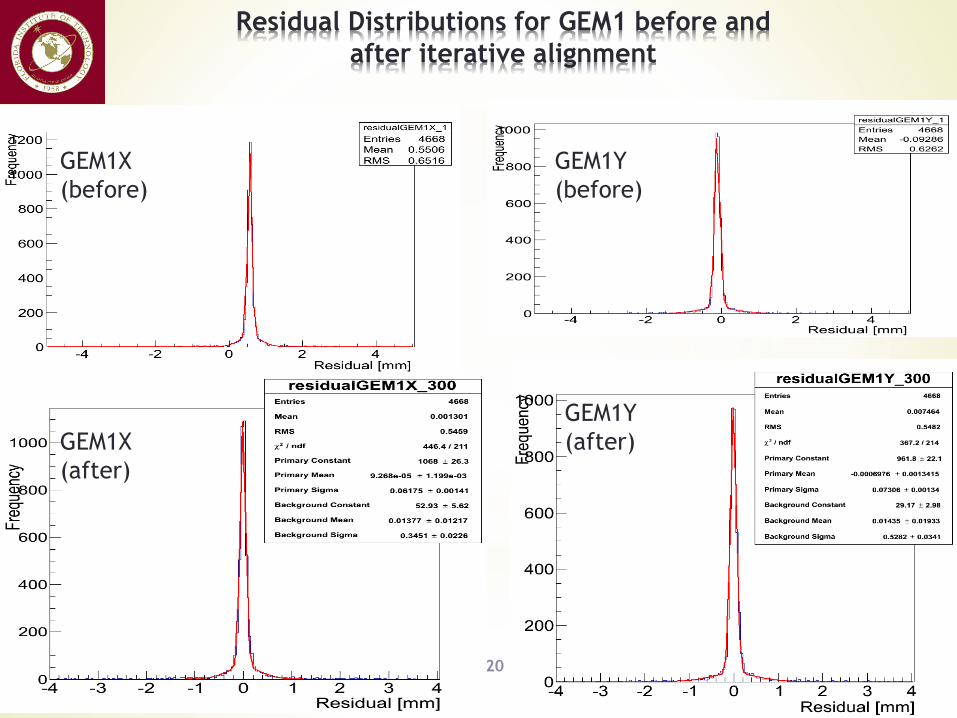
Residual Distributions for GEM1 before and
after iterative alignment
GEM1X
(before)
GEM1X
(after)
GEM1Y
(before)
GEM1Y
(after)
21
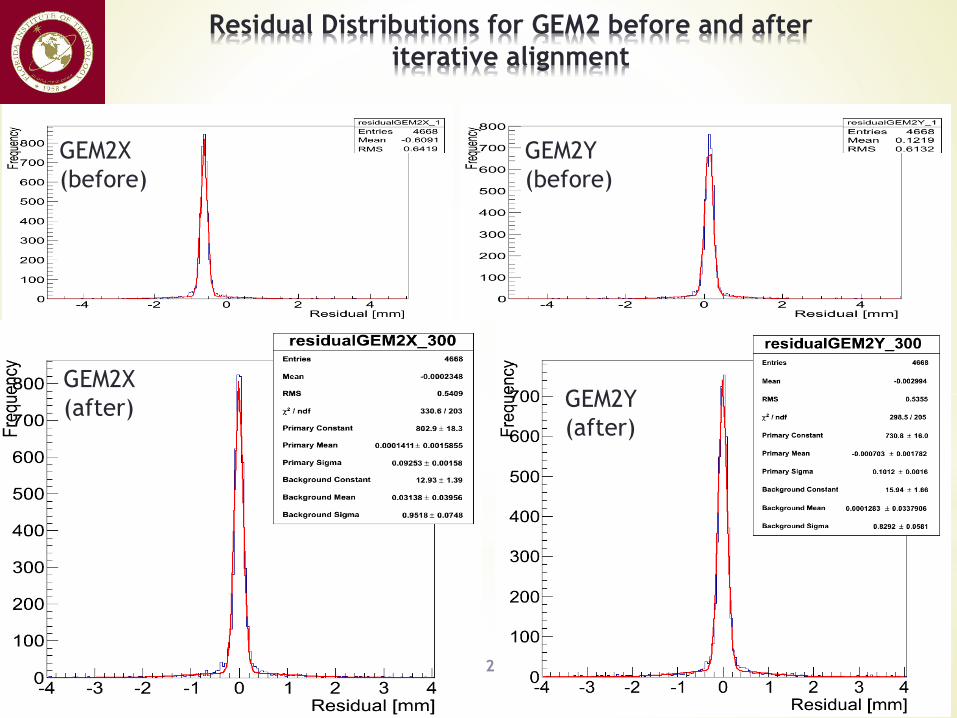
Residual Distributions for GEM2 before and after
iterative alignment
GEM2X
(before)
GEM2X
(after)
GEM2Y
(before)
GEM2Y
(after)
22
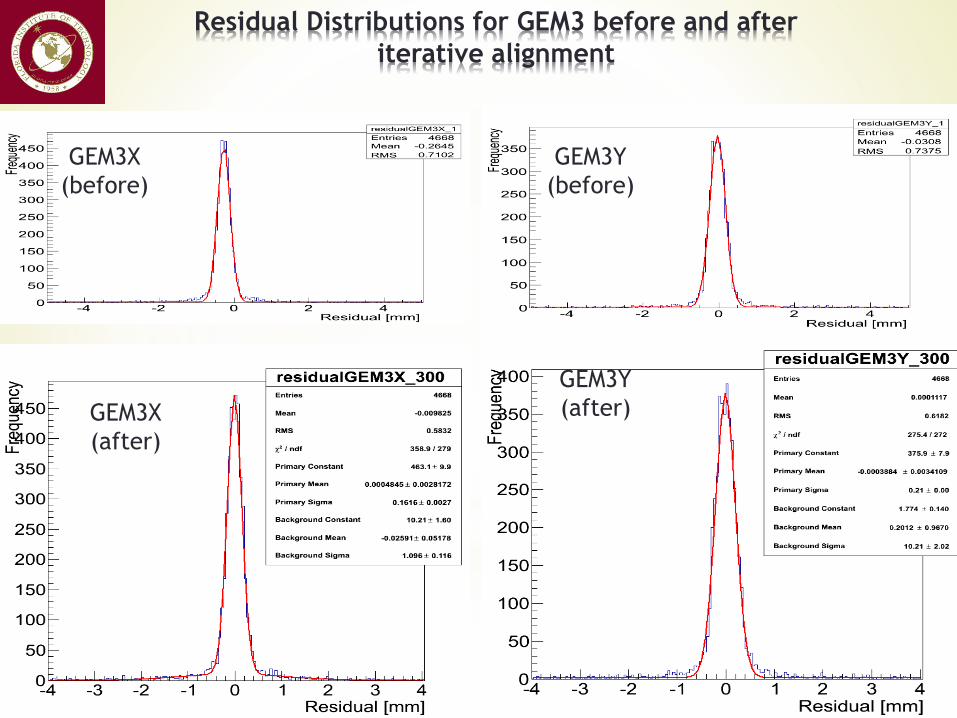
Residual Distributions for GEM3 before and after
iterative alignment
GEM3X
(before)
GEM3X
(after)
GEM3Y
(before)
GEM3Y
(after)
23
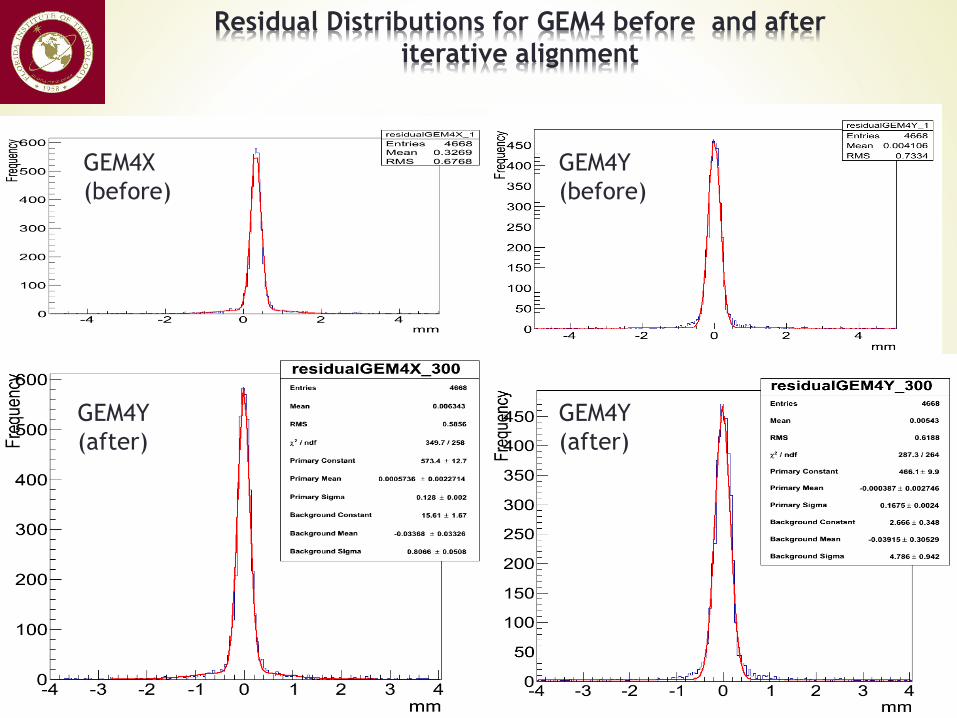
Residual Distributions for GEM4 before and after
iterative alignment
GEM4X
(before)
GEM4Y
(after)
GEM4Y
(before)
GEM4Y
(after)
24
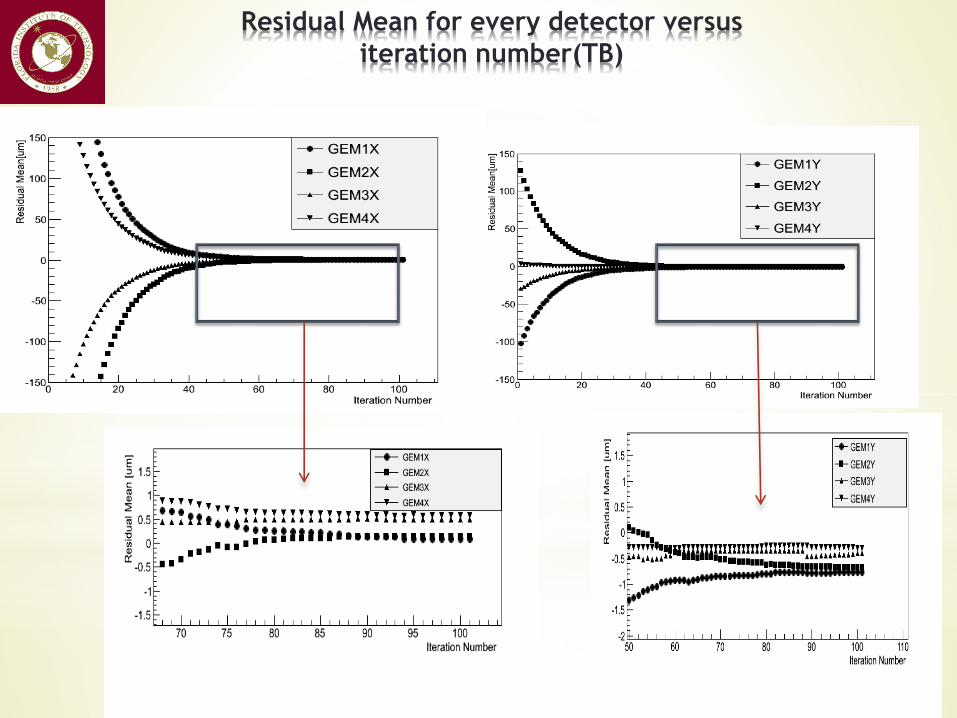
Residual Mean for every detector versus
iteration number(TB)
25
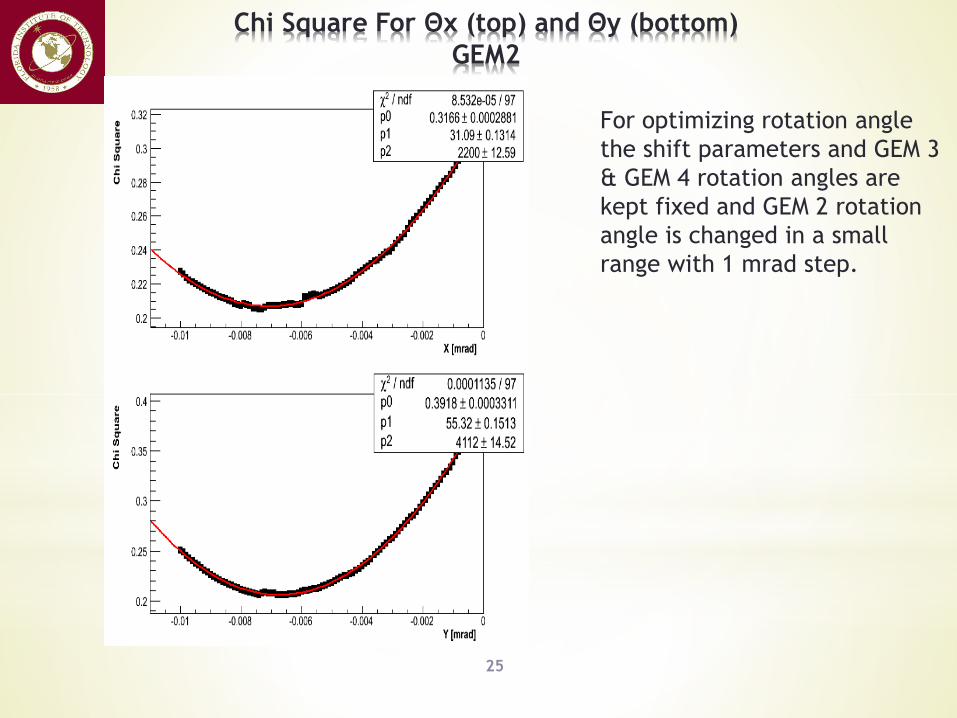
Chi Square For Θx (top) and Θy (bottom)
GEM2
For optimizing rotation angle
the shift parameters and GEM 3
& GEM 4 rotation angles are
kept fixed and GEM 2 rotation
angle is changed in a small
range with 1 mrad step.
26
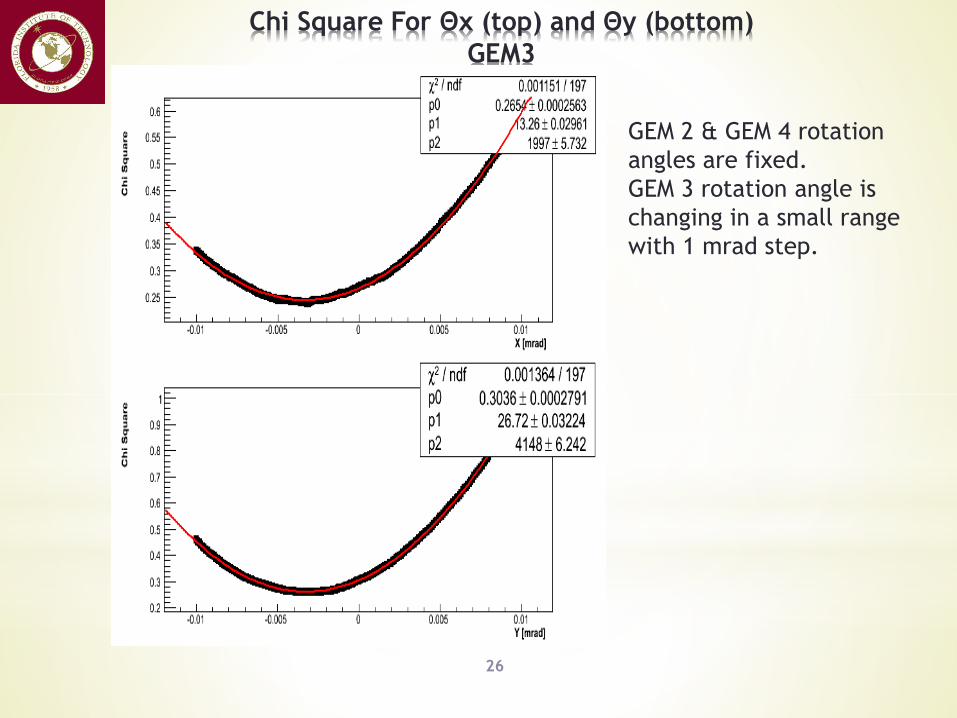
Chi Square For Θx (top) and Θy (bottom)
GEM3
GEM 2 & GEM 4 rotation
angles are fixed.
GEM 3 rotation angle is
changing in a small range
with 1 mrad step.
27
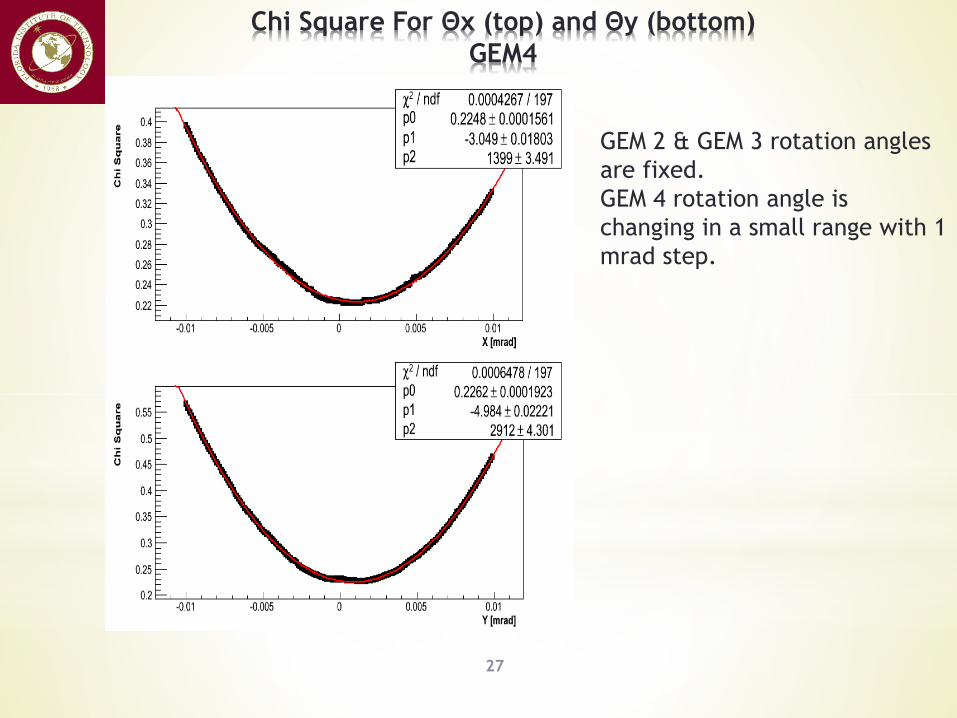
Chi Square For Θx (top) and Θy (bottom)
GEM4
GEM 2 & GEM 3 rotation angles
are fixed.
GEM 4 rotation angle is
changing in a small range with 1
mrad step.
28
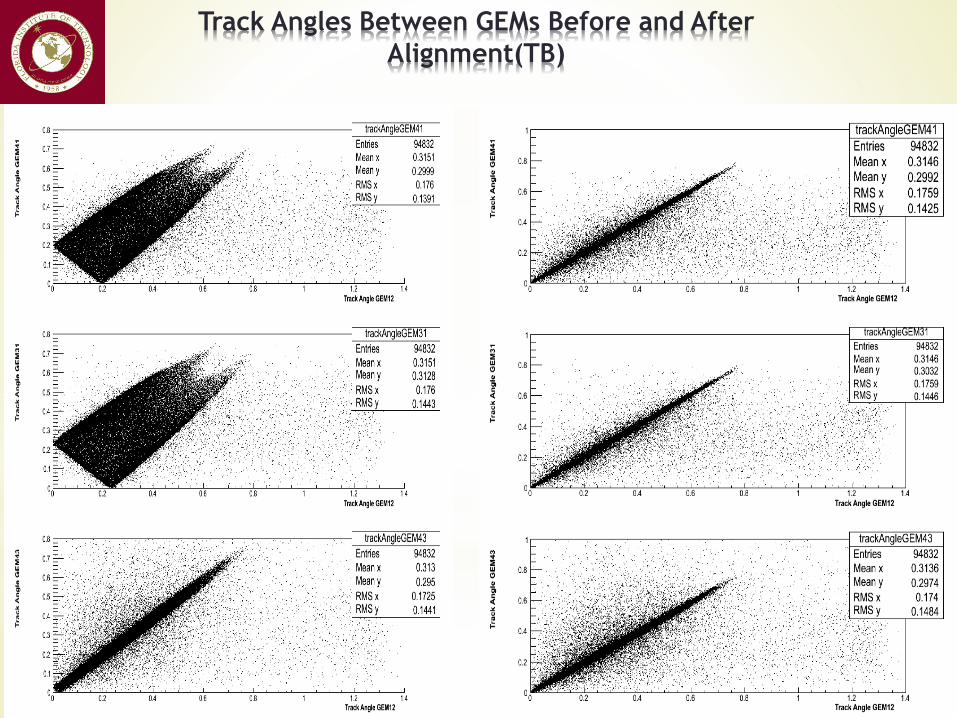
Track Angles Between GEMs Before and After
Alignment(TB)
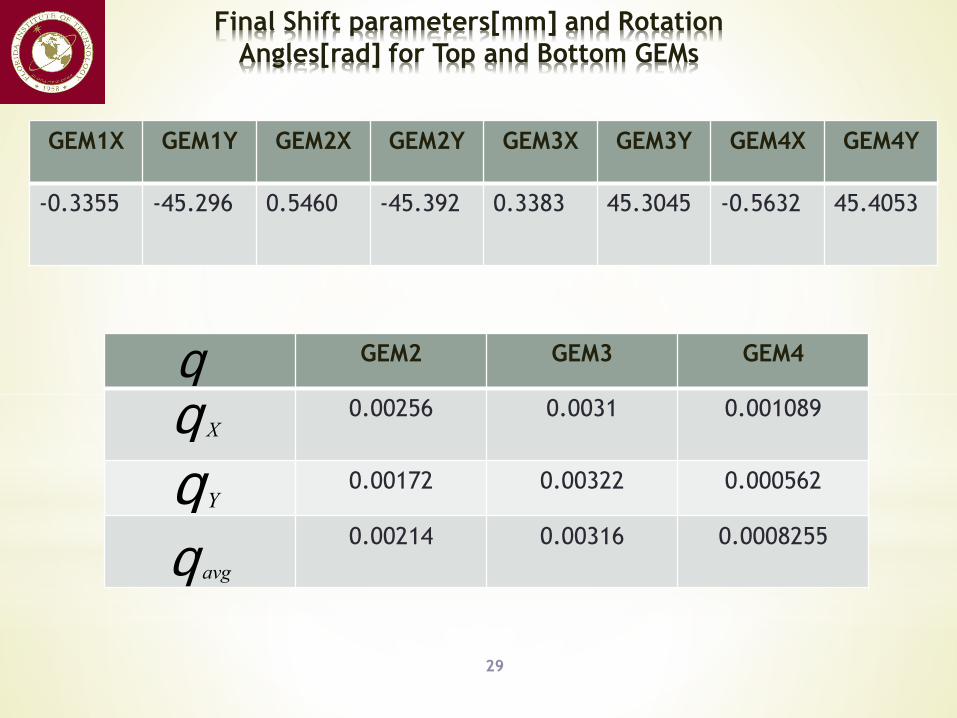
Final Shift parameters[mm] and Rotation
Angles[rad] for Top and Bottom GEMs
29
GEM1X GEM1Y GEM2X GEM2Y GEM3X GEM3Y GEM4X GEM4Y
-0.3355 -45.296 0.5460 -45.392 0.3383 45.3045 -0.5632 45.4053
GEM2 GEM3 GEM4
0.00256 0.0031 0.001089
0.00172 0.00322 0.000562
0.00214 0.00316 0.0008255
q
YqXq
avgq
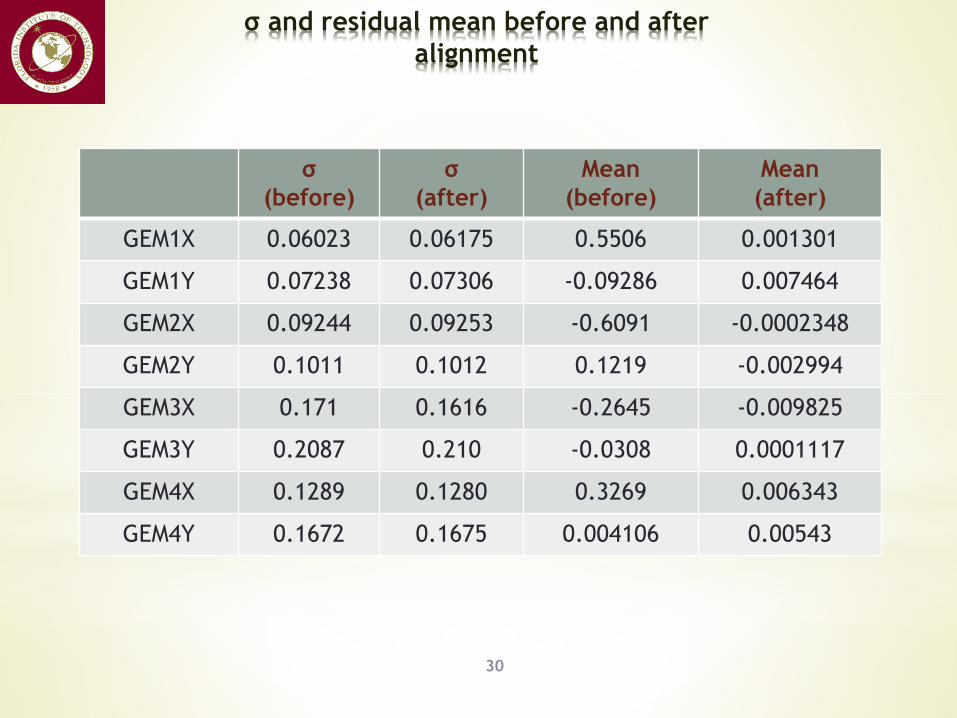
σ and residual mean before and after
alignment
30
σ
(before)
σ
(after)
Mean
(before)
Mean
(after)
GEM1X 0.06023 0.06175 0.5506 0.001301
GEM1Y 0.07238 0.07306 -0.09286 0.007464
GEM2X 0.09244 0.09253 -0.6091 -0.0002348
GEM2Y 0.1011 0.1012 0.1219 -0.002994
GEM3X 0.171 0.1616 -0.2645 -0.009825
GEM3Y 0.2087 0.210 -0.0308 0.0001117
GEM4X 0.1289 0.1280 0.3269 0.006343
GEM4Y 0.1672 0.1675 0.004106 0.00543

What are the Alignment Steps for
Left and Right Detectors?
31
1- Defining GEM 5 as a reference.
2- Finding the initial shift parameters by calculating the chi square of fitted
tracks.
3- Shifting each detector iteratively in X-Z plane.
4- fitting straight lines to the hits in X and Z in each iteration.
5- Taking 20% of the residual mean value as the shift parameter in the next
iteration.
6- Rotating detectors in X-Z plane with respect to GEM 5.
7- Optimizing the rotation angles
32
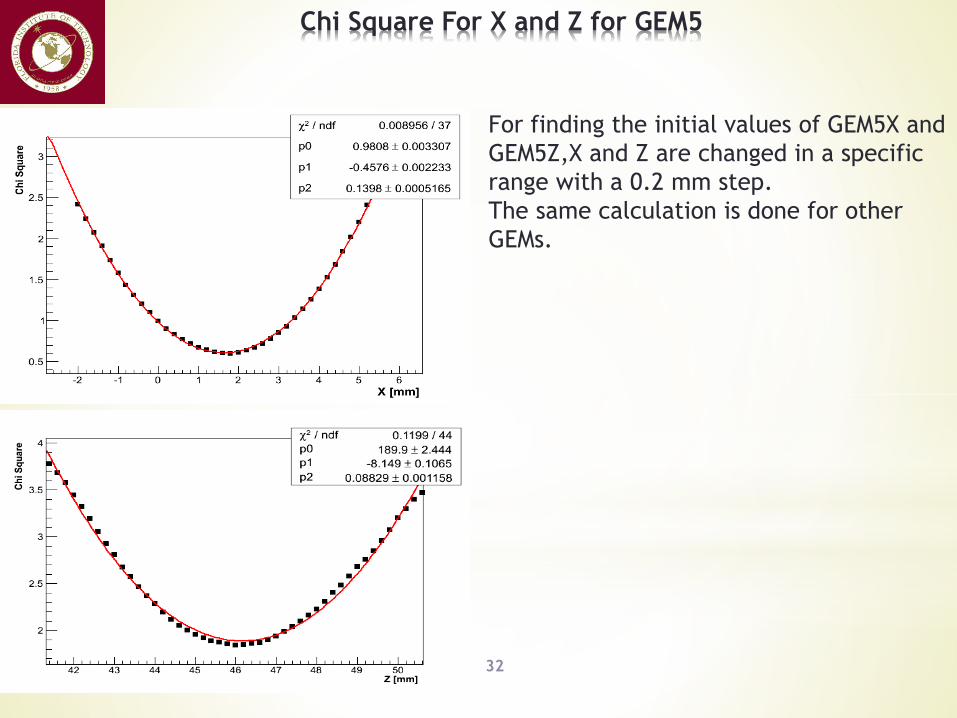
Chi Square For X and Z for GEM5
For finding the initial values of GEM5X and
GEM5Z,X and Z are changed in a specific
range with a 0.2 mm step.
The same calculation is done for other
GEMs.
33
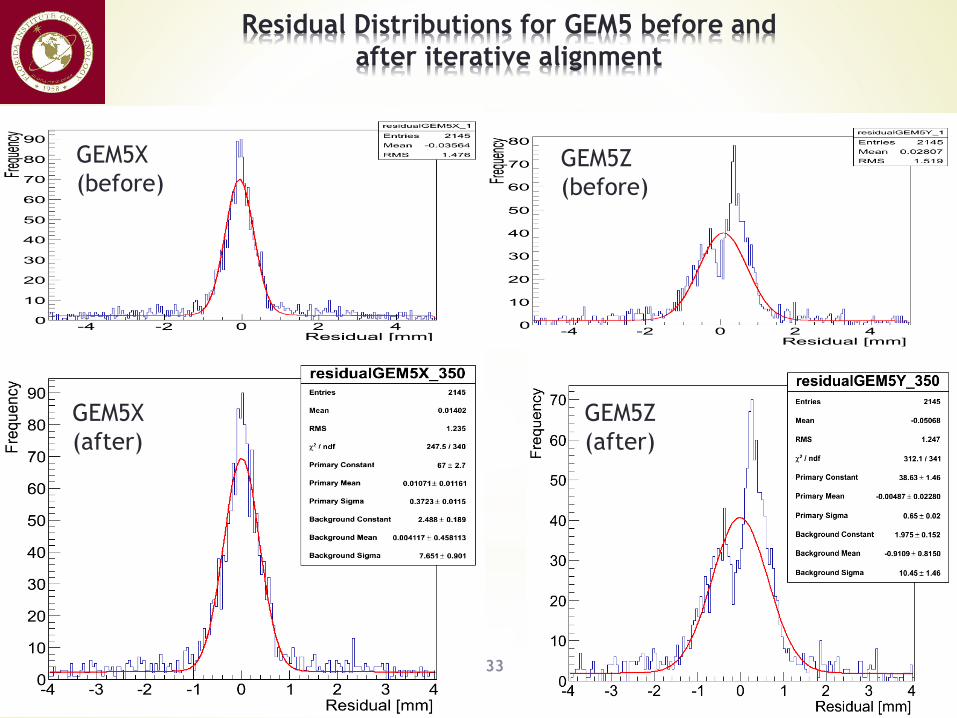
Residual Distributions for GEM5 before and
after iterative alignment
GEM5X
(before)
GEM5X
(after)
GEM5Z
(before)
GEM5Z
(after)
34
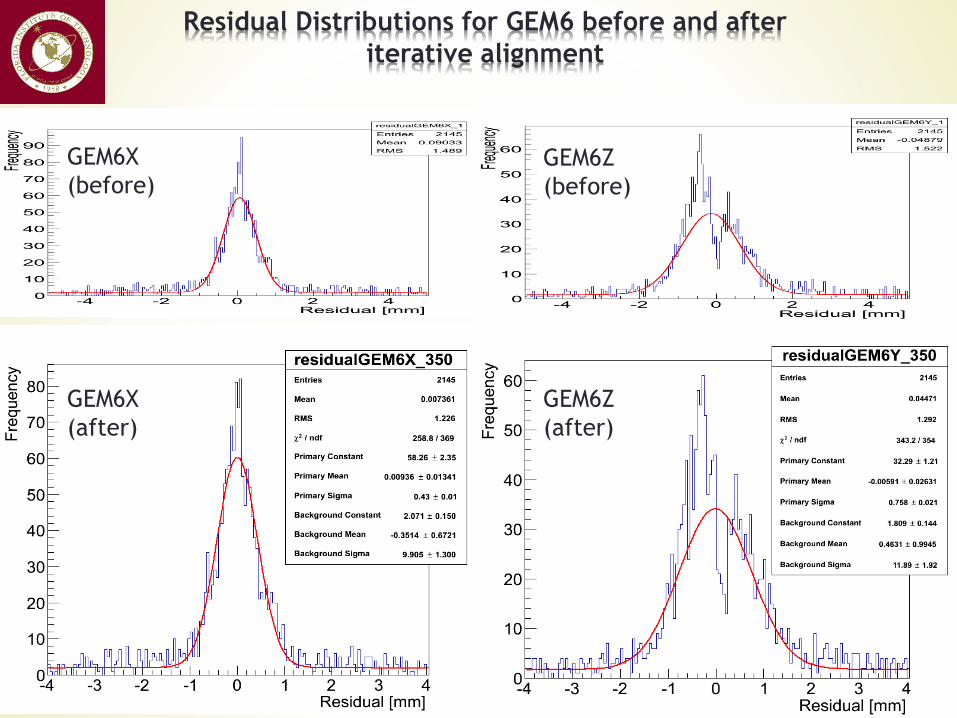
Residual Distributions for GEM6 before and after
iterative alignment
GEM6X
(before)
GEM6X
(after)
GEM6Z
(before)
GEM6Z
(after)
35
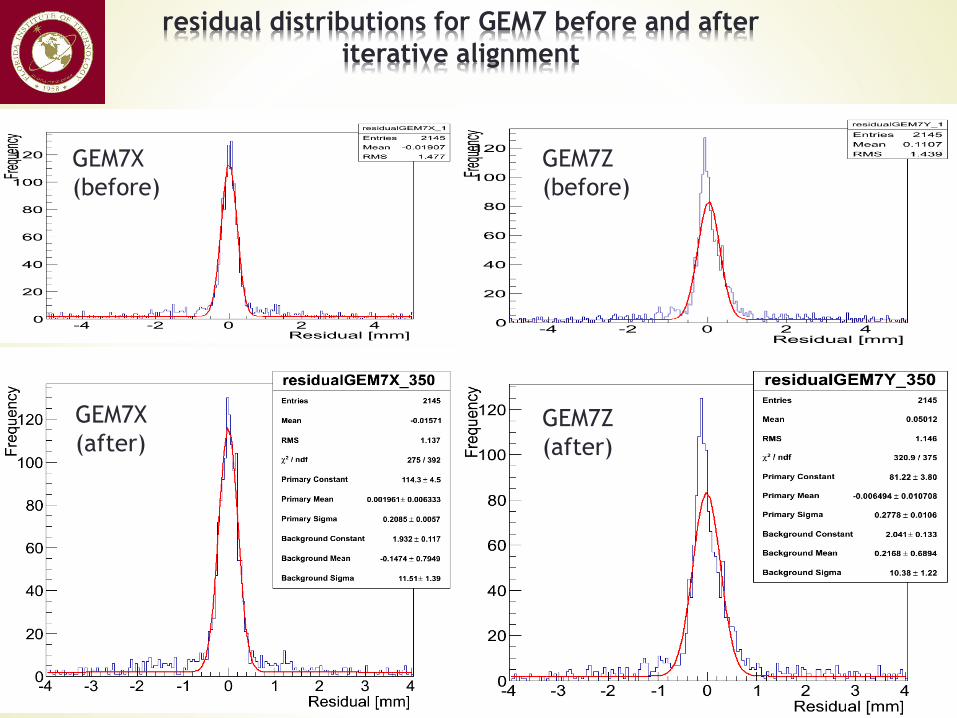
residual distributions for GEM7 before and after
iterative alignment
GEM7X
(before)
GEM7Z
(before)
GEM7X
(after)GEM7Z
(after)
36
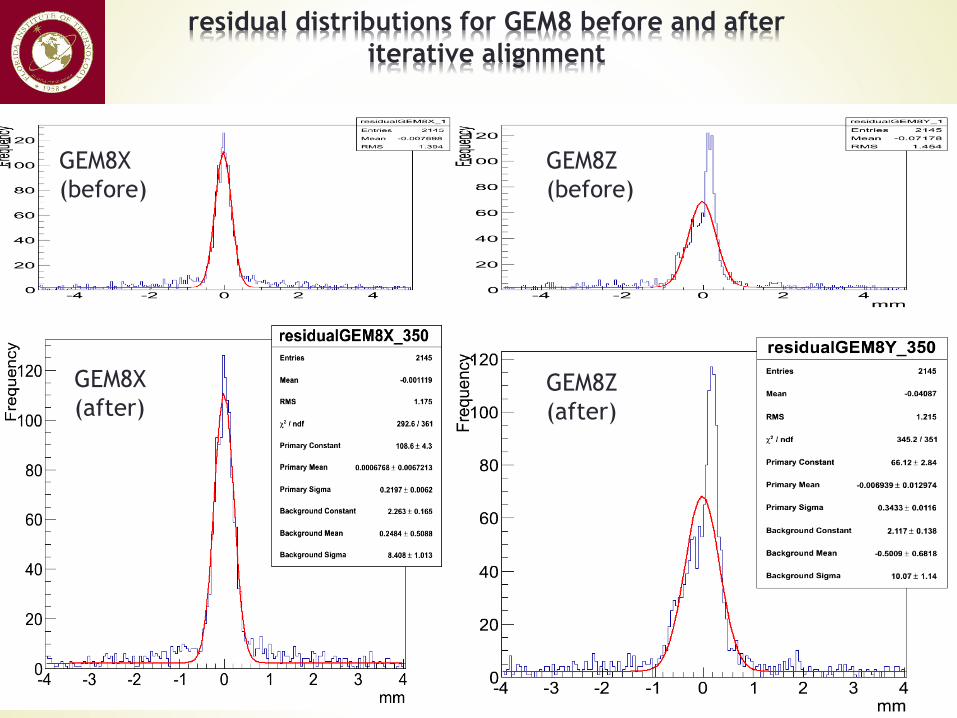
residual distributions for GEM8 before and after
iterative alignment
GEM8X
(before)
GEM8Z
(before)
GEM8X
(after)GEM8Z
(after)
37
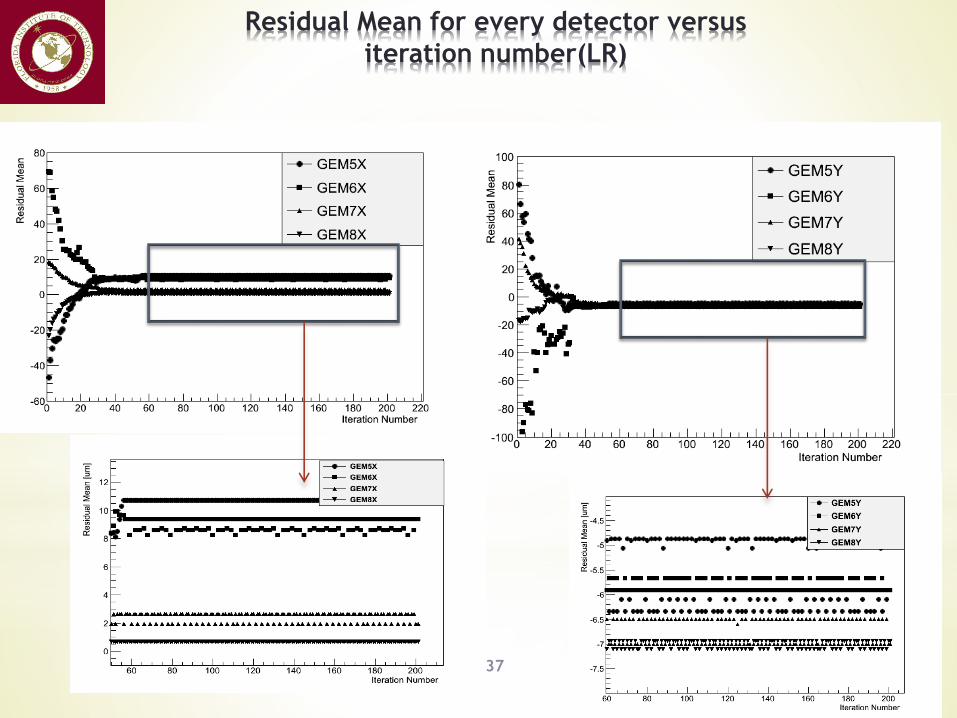
Residual Mean for every detector versus
iteration number(LR)
38
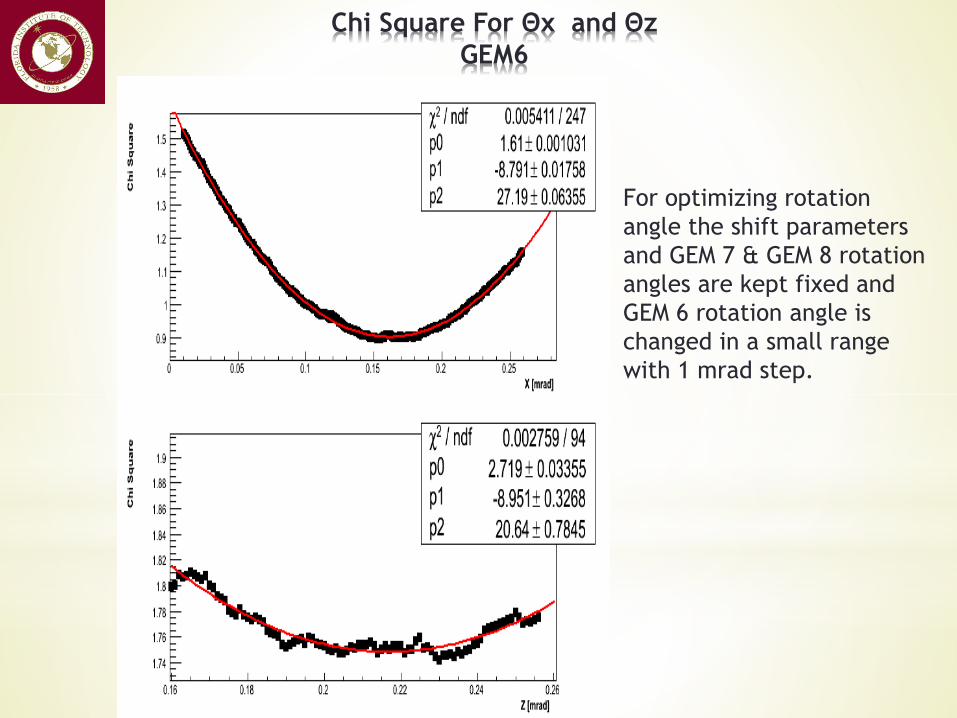
Chi Square For Θx and Θz
GEM6
For optimizing rotation
angle the shift parameters
and GEM 7 & GEM 8 rotation
angles are kept fixed and
GEM 6 rotation angle is
changed in a small range
with 1 mrad step.
39
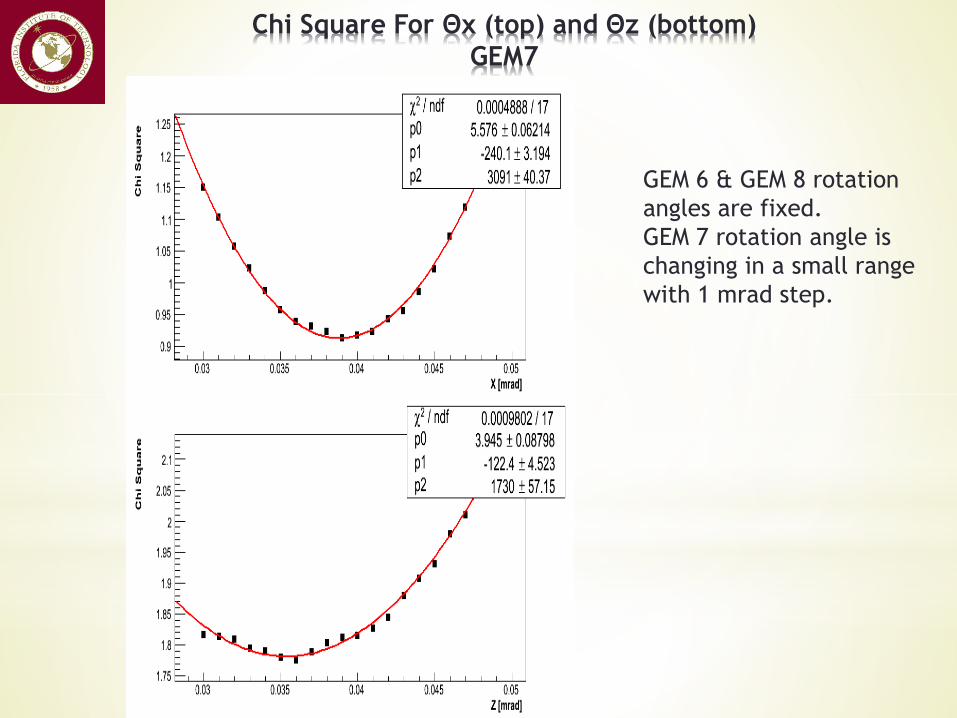
Chi Square For Θx (top) and Θz (bottom)
GEM7
GEM 6 & GEM 8 rotation
angles are fixed.
GEM 7 rotation angle is
changing in a small range
with 1 mrad step.
40
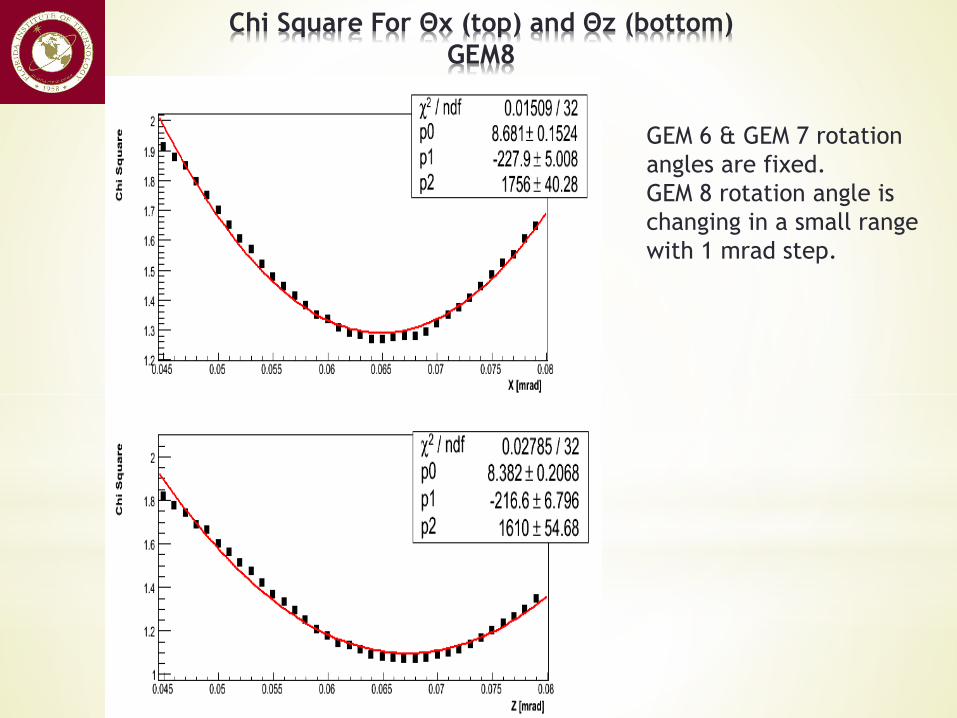
Chi Square For Θx (top) and Θz (bottom)
GEM8
GEM 6 & GEM 7 rotation
angles are fixed.
GEM 8 rotation angle is
changing in a small range
with 1 mrad step.
41
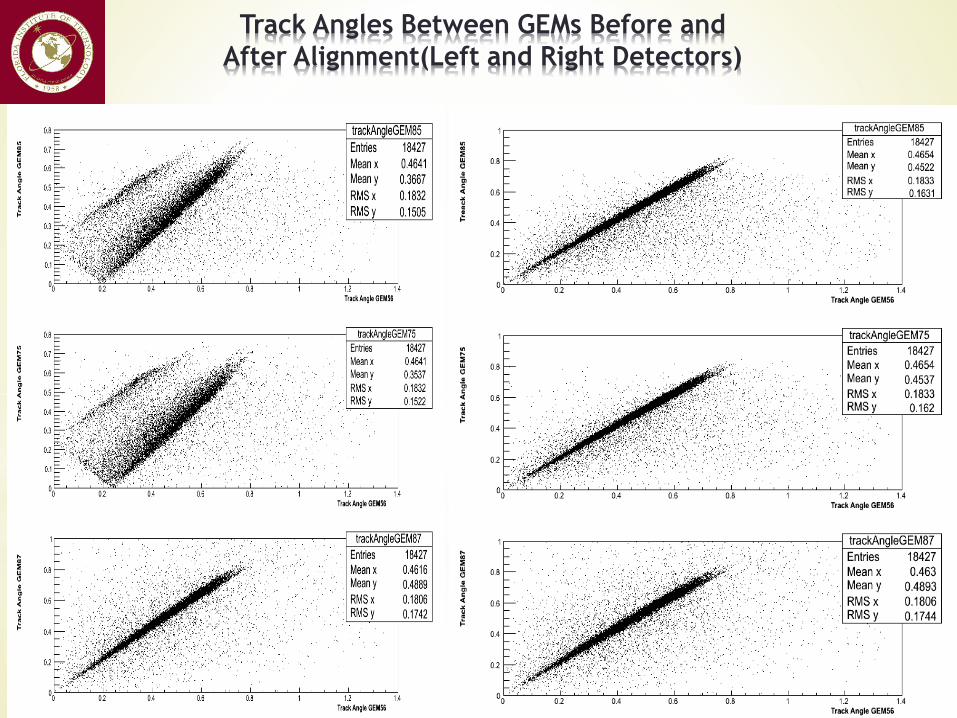
Track Angles Between GEMs Before and
After Alignment(Left and Right Detectors)
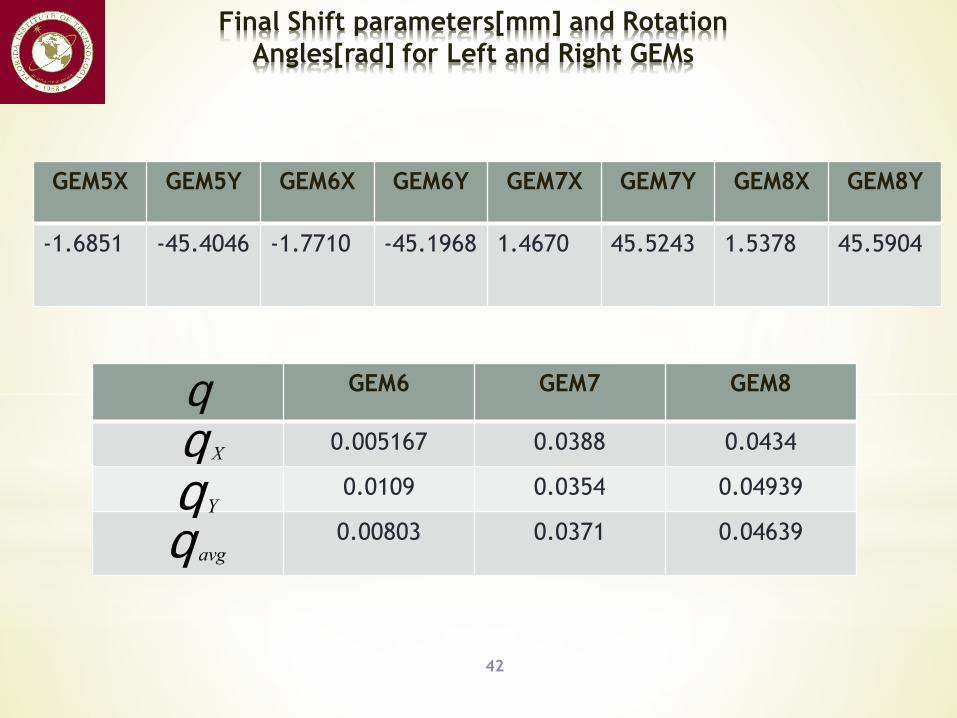
Final Shift parameters[mm] and Rotation
Angles[rad] for Left and Right GEMs
42
GEM5X GEM5Y GEM6X GEM6Y GEM7X GEM7Y GEM8X GEM8Y
-1.6851 -45.4046 -1.7710 -45.1968 1.4670 45.5243 1.5378 45.5904
GEM6 GEM7 GEM8
0.005167 0.0388 0.0434
0.0109 0.0354 0.04939
0.00803 0.0371 0.04639
XqYqavgq
q
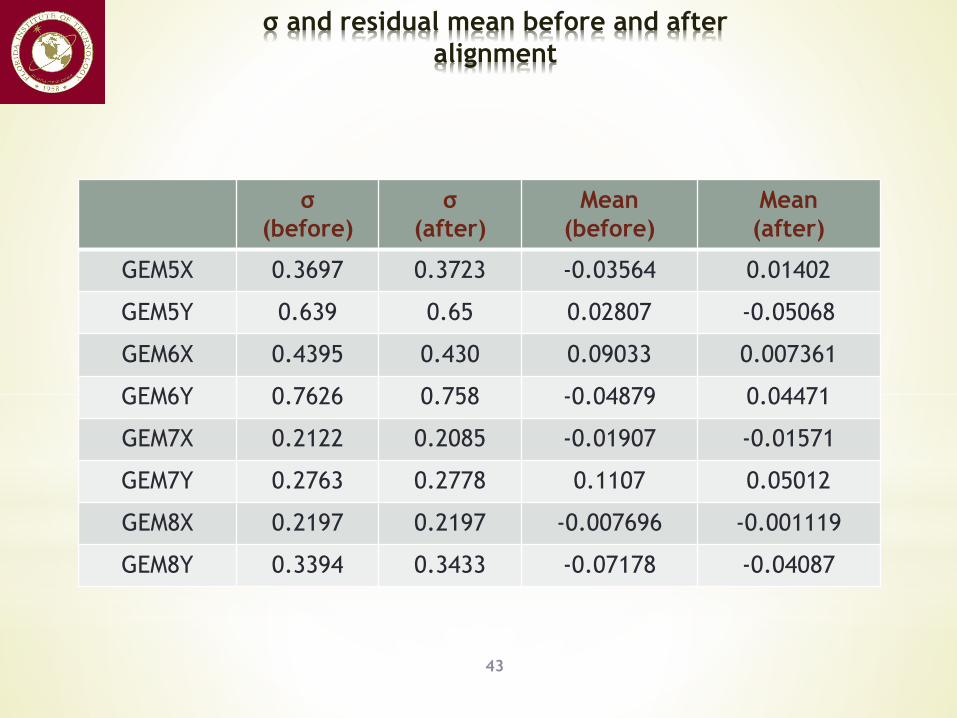
σ and residual mean before and after
alignment
43
σ
(before)
σ
(after)
Mean
(before)
Mean
(after)
GEM5X 0.3697 0.3723 -0.03564 0.01402
GEM5Y 0.639 0.65 0.02807 -0.05068
GEM6X 0.4395 0.430 0.09033 0.007361
GEM6Y 0.7626 0.758 -0.04879 0.04471
GEM7X 0.2122 0.2085 -0.01907 -0.01571
GEM7Y 0.2763 0.2778 0.1107 0.05012
GEM8X 0.2197 0.2197 -0.007696 -0.001119
GEM8Y 0.3394 0.3433 -0.07178 -0.04087
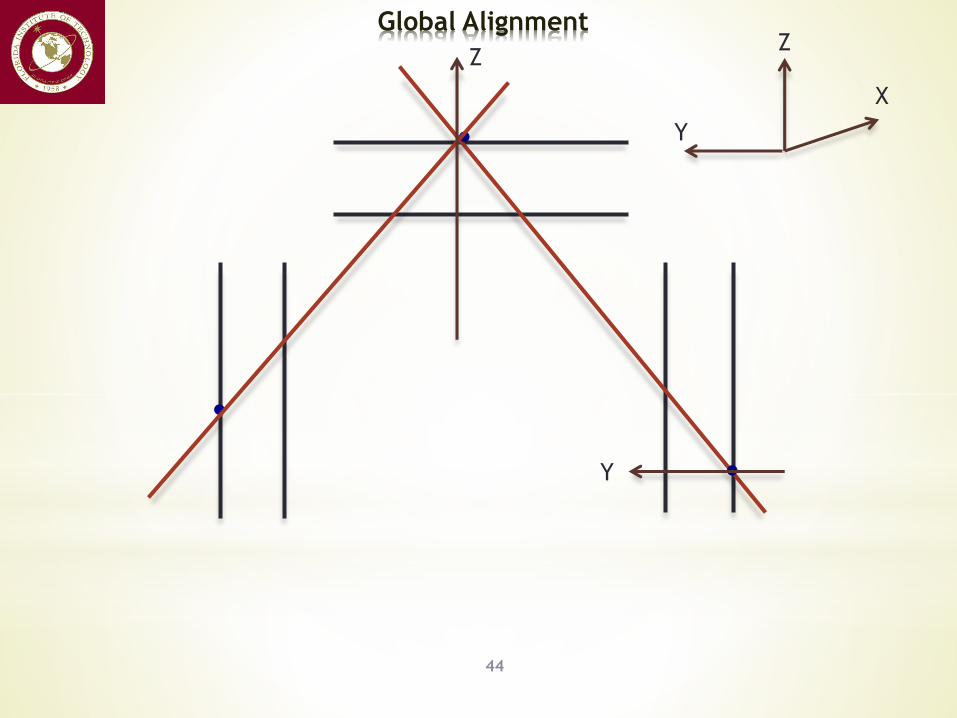
Global Alignment
44
.
..
Z
Y
Z
Y
X
45
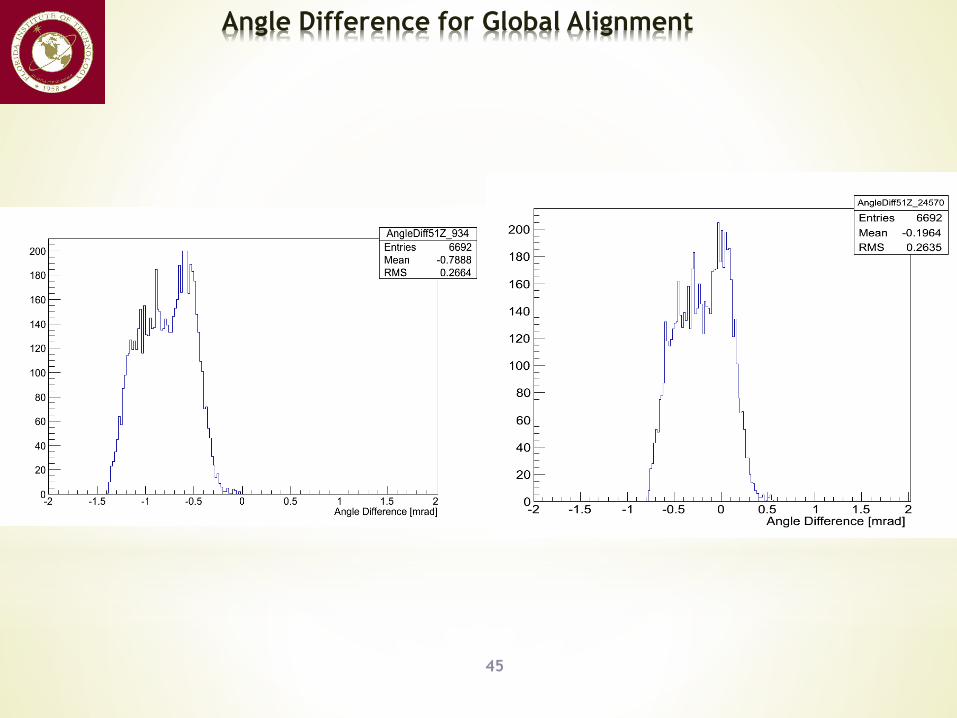
Angle Difference for Global Alignment
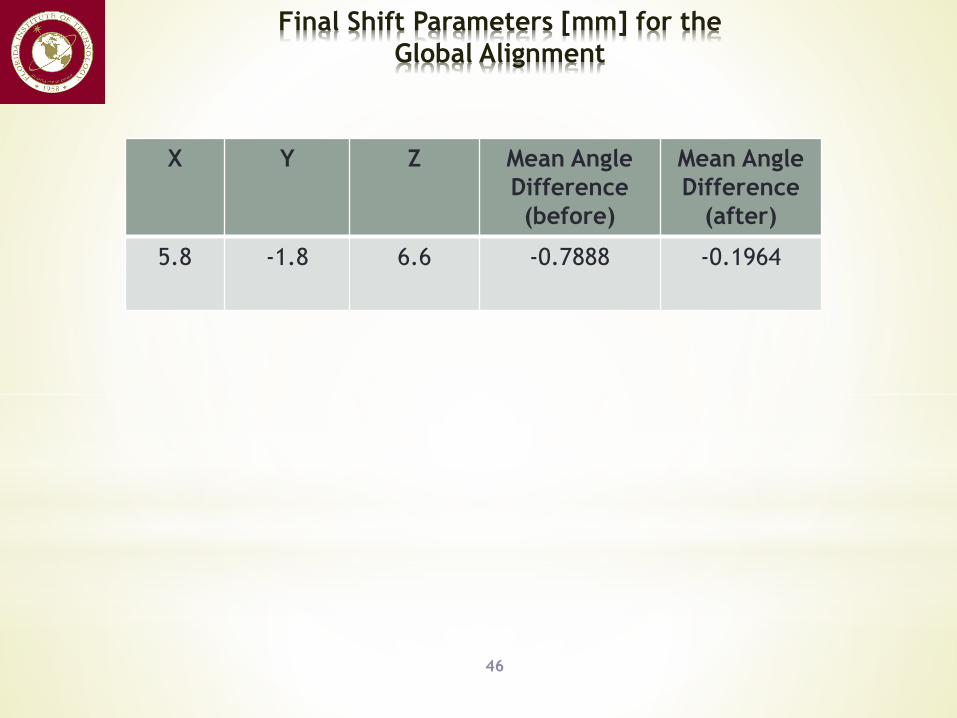
Final Shift Parameters [mm] for the
Global Alignment
46
X Y Z Mean Angle
Difference
(before)
Mean Angle
Difference
(after)
5.8 -1.8 6.6 -0.7888 -0.1964
Conclusions
47
- The alignment is done precisely because:
1) The residual mean values are almost 0 after alignment.
2)The Chi Square tests show a parabolic trend.
3)The track angles are diagonal after alignment.
- The best final shift parameters and rotation angles is
calculated from the track candidates.
Future Work
48
- Using more detectors in order to get better statistics for
doing alignment.
- Using 3D fit for doing Global Alignment
- Redesigning the Printed Circuit Board(PCB) of detectors
- Placing GEM 5 and GEM 6 completely vertical in the frame
- Using web base software Slow Control Run Initialization
Byte-wise Environment(SCRIBE)
- Using cluster to process data

Thanks!
Questions?
49