
Air Force Research Laboratory - AF · 06/10/2016 · than AP8 at low altitudes • AP8 MAX is...
35
1 Distribution A: Approved for public release; distribution unlimited. OPS-16-12513 Integrity Service Excellence LEO Protons in AP9 6 October 2016 Ξιλοκαστρο, Ελλαδα (Xylokastro, Greece) Stuart Huston Confluence Analytics, Inc. Air Force Research Laboratory
Transcript of Air Force Research Laboratory - AF · 06/10/2016 · than AP8 at low altitudes • AP8 MAX is...
1Distribution A: Approved for public release; distribution unlimited. OPS-16-12513
Integrity Service Excellence
LEO Protons in AP9
6 October 2016Ξιλοκαστρο, Ελλαδα
(Xylokastro, Greece)
Stuart Huston Confluence Analytics, Inc.
Air Force Research Laboratory
2Distribution A: Approved for public release; distribution unlimited. OPS-16-12513
Background
• ESA* performed an independent validation of AE9/AP9 – Compared AP9 with data and other models– One conclusion was that AP9 proton fluxes are significantly
higher than data and other models, especially for LEO and at low energy (< 10 MeV)
• IRENE team wanted to determine possible reasons and resolutions
• This study focuses on the low energy (< 20 MeV) LEO protons– This is a very difficult population to measure– We expect RBSP/RPS to provide the “definitive” measurements
for > 50 MeV– What can we learn about lower energies?
*Heynderickx, D., and P. Truscott, “NARMI Technical Note 2: Validation and Comparison Results,” 27 October 2014.
3Distribution A: Approved for public release; distribution unlimited. OPS-16-12513
Background
• AP9 predicts much larger fluxes of low energy (< 10 MeV) protons than AP8 at low altitudes
• AP8 MAX is based largely on data from Azur– Flew in 1969 – 1970 (0.3 years near solar maximum): very short time span– AP8 only uses 1 month of data (November 1969)– 1.5 – 104 MeV in 7 channels (ΔE/Emid ≈ 0.7)– D. Heynderickx/ESA processed & cleaned the data, have provided data to
IRENE team– Very clean data set, low altitude measurements at 90° pitch angle
• AP9 below 10 MeV is based mainly on CRRES PROTEL– Flew in 1990 – 1991 (1.3 years near solar maximum): short time span– 1 – 100 MeV in 24 channels (ΔE/Emid ≈ 0.2)– Much data for low L is based on high-altitude pitch angle resolved
measurements• AP9 implicitly uses data from S3-3 (0.1 – 2 MeV) via templates
– Vampola published a model based on S3-3; low-altitude fluxes were much higher than AP8
4Distribution A: Approved for public release; distribution unlimited. OPS-16-12513
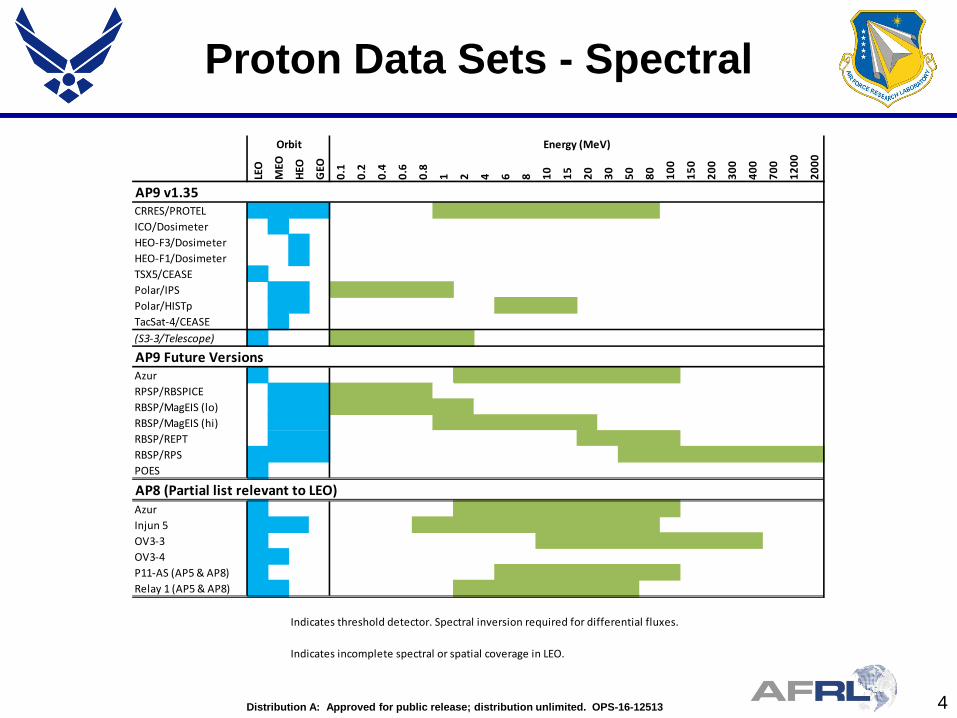
Proton Data Sets - Spectral
LEO
MEO
HEO
GEO
0.1
0.2
0.4
0.6
0.8
1 2 4 6 8 10 15 20 30 50 80 100
150
200
300
400
700
1200
2000
CRRES/PROTELICO/DosimeterHEO-F3/DosimeterHEO-F1/DosimeterTSX5/CEASEPolar/IPSPolar/HISTpTacSat-4/CEASE(S3-3/Telescope)
AzurRPSP/RBSPICERBSP/MagEIS (lo)RBSP/MagEIS (hi)RBSP/REPTRBSP/RPSPOES
AzurInjun 5OV3-3OV3-4P11-AS (AP5 & AP8)Relay 1 (AP5 & AP8)
Indicates threshold detector. Spectral inversion required for differential fluxes.
Indicates incomplete spectral or spatial coverage in LEO.
Orbit Energy (MeV)
AP9 v1.35
AP9 Future Versions
AP8 (Partial list relevant to LEO)
5Distribution A: Approved for public release; distribution unlimited. OPS-16-12513
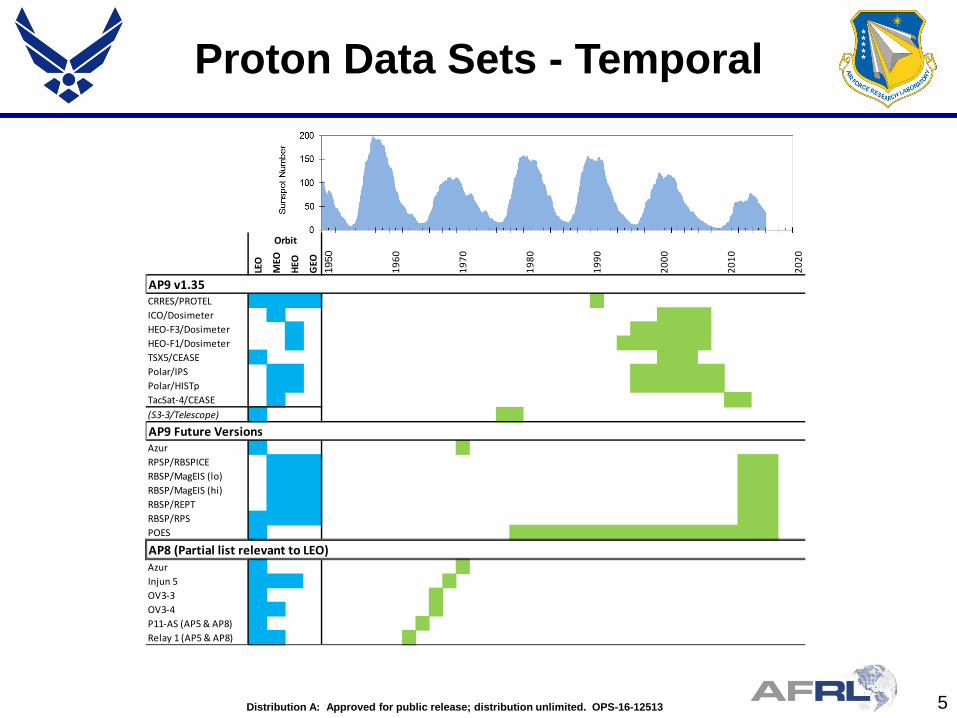
Proton Data Sets - Temporal
LEO
MEO
HEO
GEO
1950
1960
1970
1980
1990
2000
2010
2020
CRRES/PROTELICO/DosimeterHEO-F3/DosimeterHEO-F1/DosimeterTSX5/CEASEPolar/IPSPolar/HISTpTacSat-4/CEASE(S3-3/Telescope)
AzurRPSP/RBSPICERBSP/MagEIS (lo)RBSP/MagEIS (hi)RBSP/REPTRBSP/RPSPOES
AzurInjun 5OV3-3OV3-4P11-AS (AP5 & AP8)Relay 1 (AP5 & AP8)
Orbit
AP9 v1.35
AP9 Future Versions
AP8 (Partial list relevant to LEO)
6Distribution A: Approved for public release; distribution unlimited. OPS-16-12513
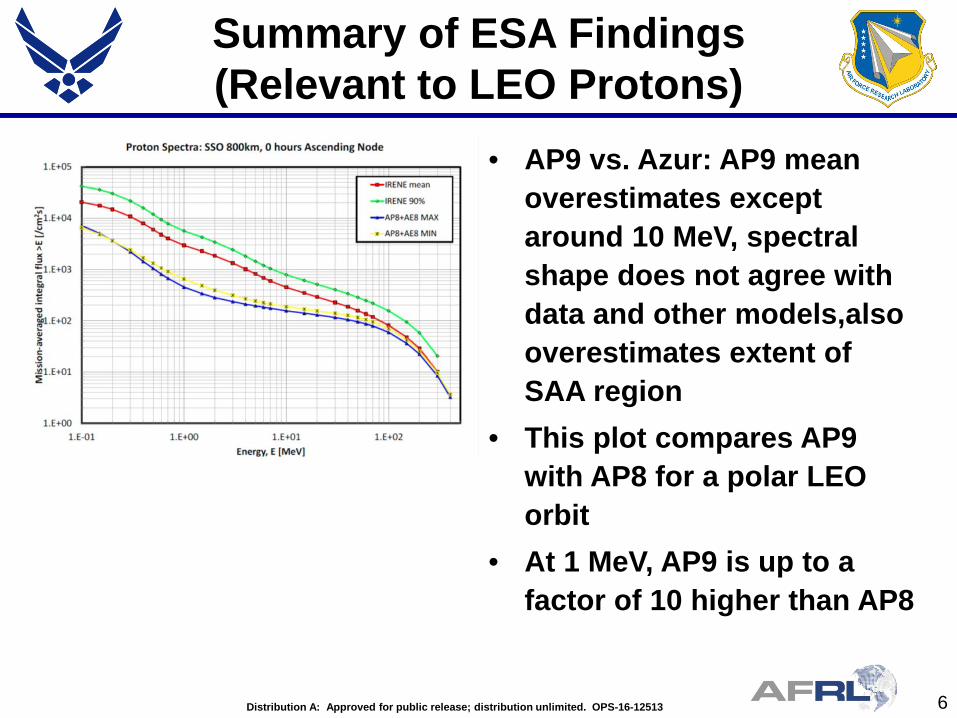
Summary of ESA Findings (Relevant to LEO Protons)
• AP9 vs. Azur: AP9 mean overestimates except around 10 MeV, spectral shape does not agree with data and other models,alsooverestimates extent of SAA region
• This plot compares AP9 with AP8 for a polar LEO orbit
• At 1 MeV, AP9 is up to a factor of 10 higher than AP8
7Distribution A: Approved for public release; distribution unlimited. OPS-16-12513
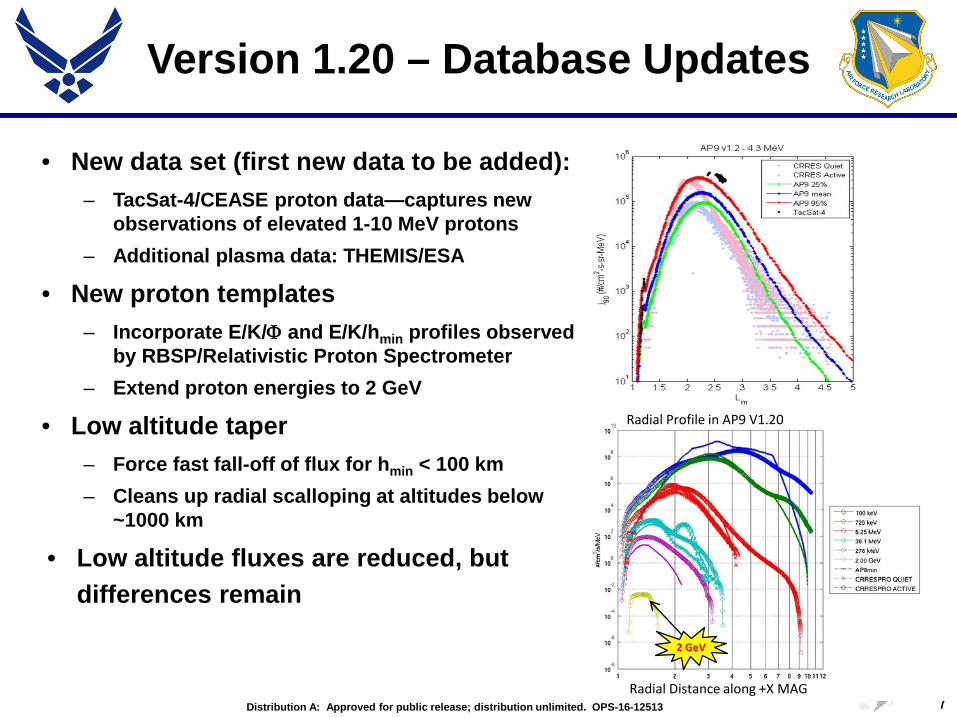
Version 1.20 – Database Updates
• New data set (first new data to be added):– TacSat-4/CEASE proton data—captures new
observations of elevated 1-10 MeV protons– Additional plasma data: THEMIS/ESA
• New proton templates– Incorporate E/K/Φ and E/K/hmin profiles observed
by RBSP/Relativistic Proton Spectrometer– Extend proton energies to 2 GeV
• Low altitude taper– Force fast fall-off of flux for hmin < 100 km– Cleans up radial scalloping at altitudes below
~1000 km
• Low altitude fluxes are reduced, but differences remain
2 GeV
Radial Profile in AP9 V1.20
Radial Distance along +X MAG
8Distribution A: Approved for public release; distribution unlimited. OPS-16-12513
Analyses Performed
AE9/AP9 Team performed several analyses to investigate reasons for differences, with primary emphasis:
What is the spectral shape of LEO protons between 1 and 30 MeV?
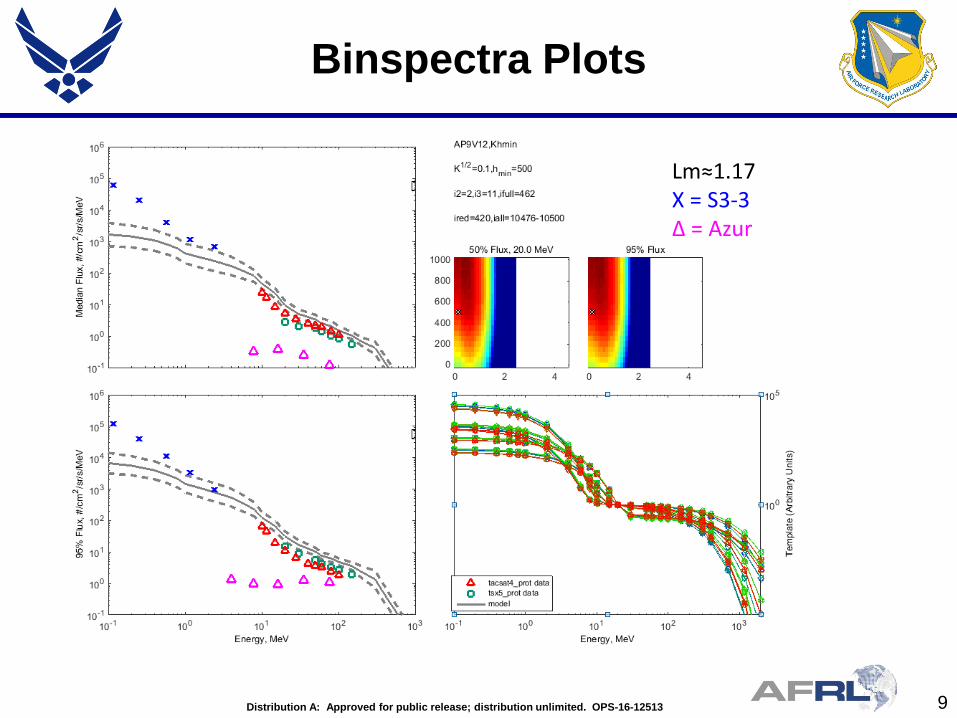
• “Binspectra” plots– Plot energy spectra in each AP9 bin for all data sets used– Plot model as well– We have added additional data sets not currently in AP9 (e.g., Azur, S3-3)– These show uncertainty of measurements and model in each bin
• S3-3 analysis– Data showed very high fluxes for L < 1.9– Although S3-3 data have not been used directly in AP9, they were included in templates– Analysis focused on identifying potential contamination
• Review other data sets and analytical models– Injun 5, AP8, SIZM, Blanchard & Hess, …
• TacSat-4 data analysis– Attempt to deduce spectral shape from counts in different CEASE channels– Intent is to determine whether TacSat-4 data is consistent with a spectral shape like Azur– This analysis is not covered in this talk
9Distribution A: Approved for public release; distribution unlimited. OPS-16-12513
Binspectra Plots
Lm≈1.17X = S3-3Δ = Azur
10Distribution A: Approved for public release; distribution unlimited. OPS-16-12513
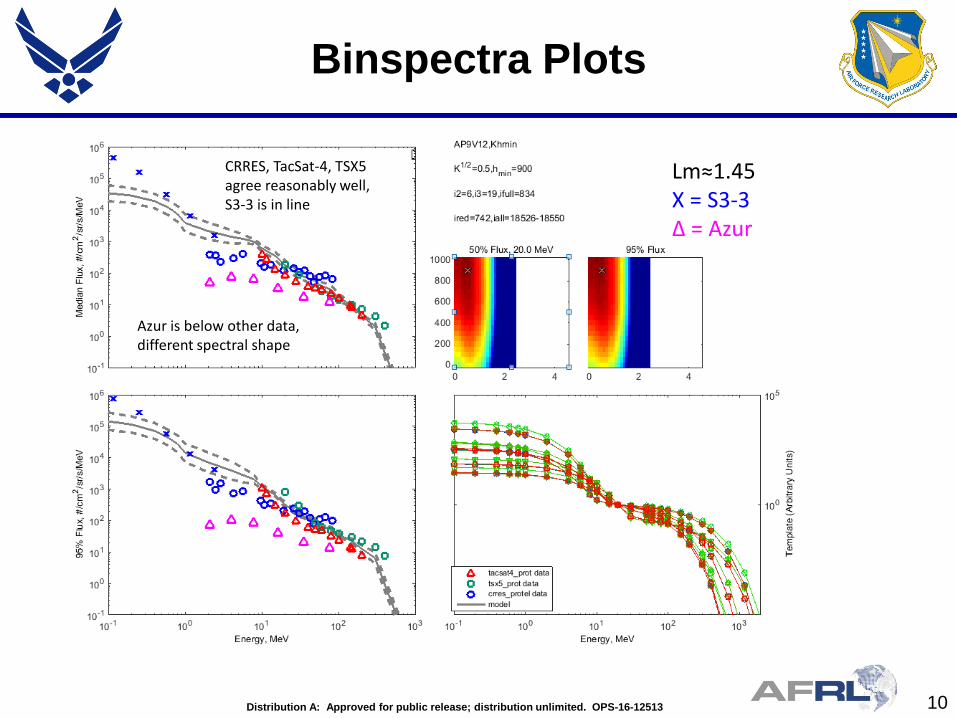
Binspectra Plots
Lm≈1.45X = S3-3Δ = Azur
CRRES, TacSat-4, TSX5 agree reasonably well, S3-3 is in line
Azur is below other data, different spectral shape
11Distribution A: Approved for public release; distribution unlimited. OPS-16-12513
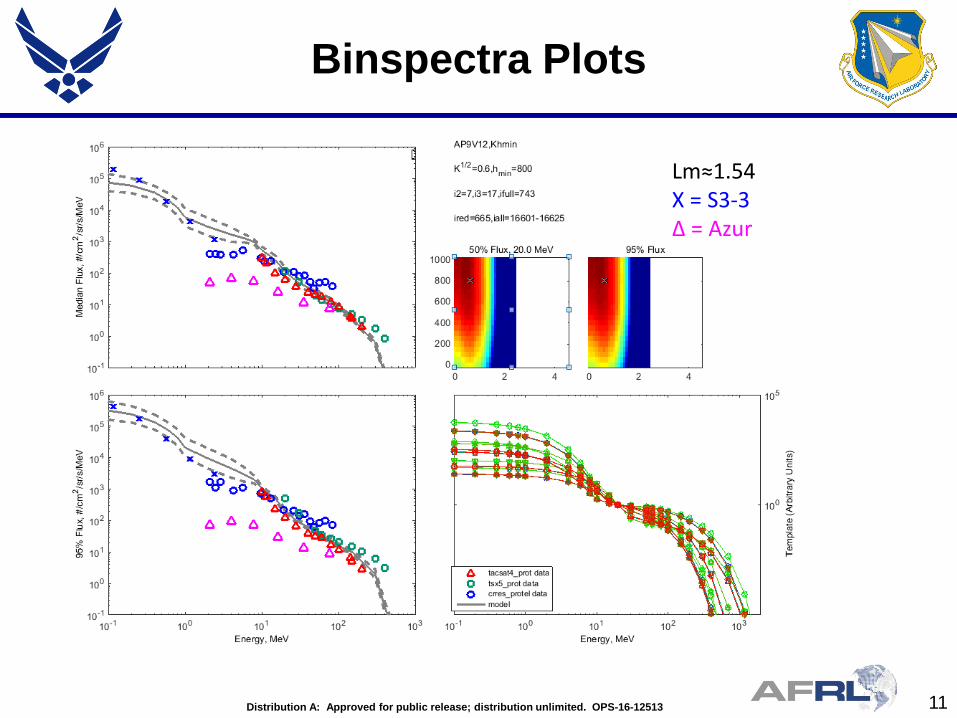
Binspectra Plots
Lm≈1.54X = S3-3Δ = Azur
12Distribution A: Approved for public release; distribution unlimited. OPS-16-12513
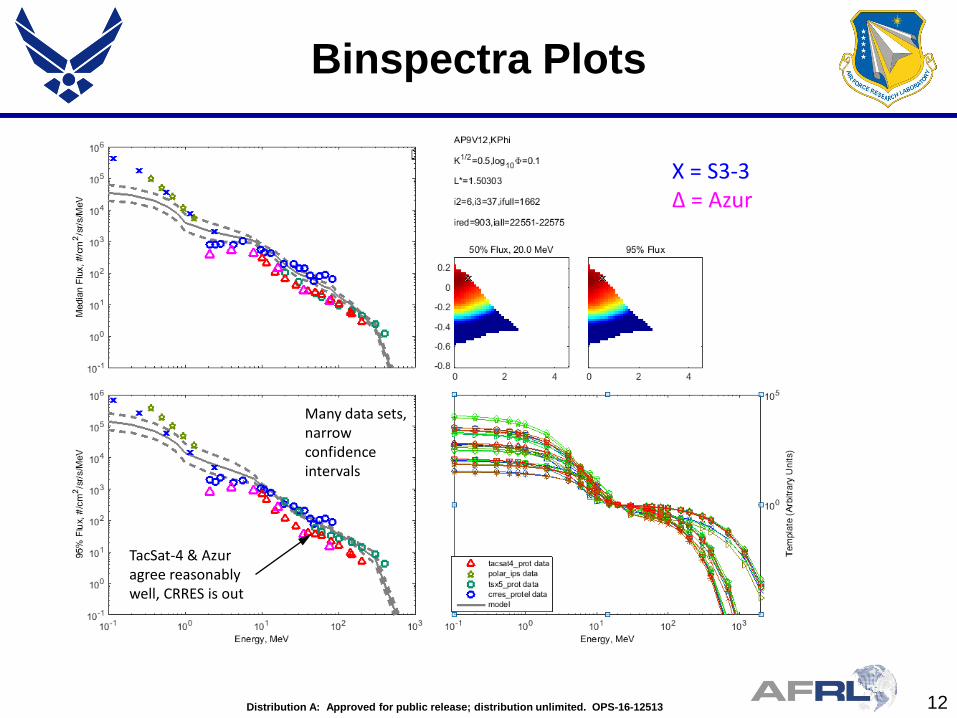
Binspectra Plots
TacSat-4 & Azur agree reasonably well, CRRES is out
Many data sets, narrow confidence intervals
X = S3-3Δ = Azur
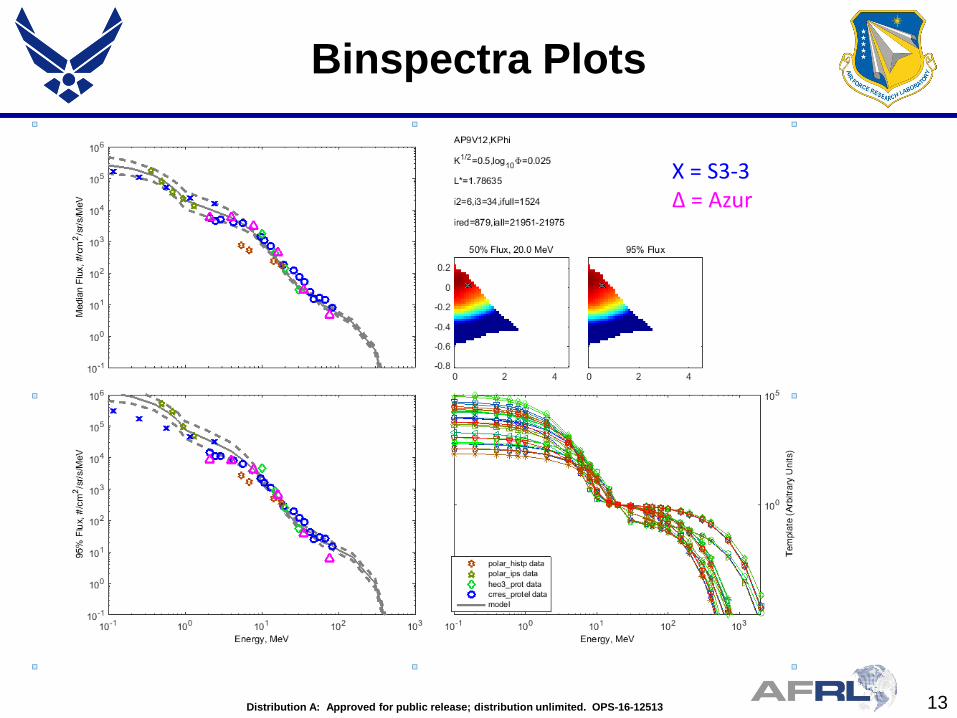
13Distribution A: Approved for public release; distribution unlimited. OPS-16-12513
Binspectra Plots
X = S3-3Δ = Azur

14Distribution A: Approved for public release; distribution unlimited. OPS-16-12513
Binspectra Plots
Many data sets, narrow confidence intervals
X = S3-3Δ = Azur
15Distribution A: Approved for public release; distribution unlimited. OPS-16-12513
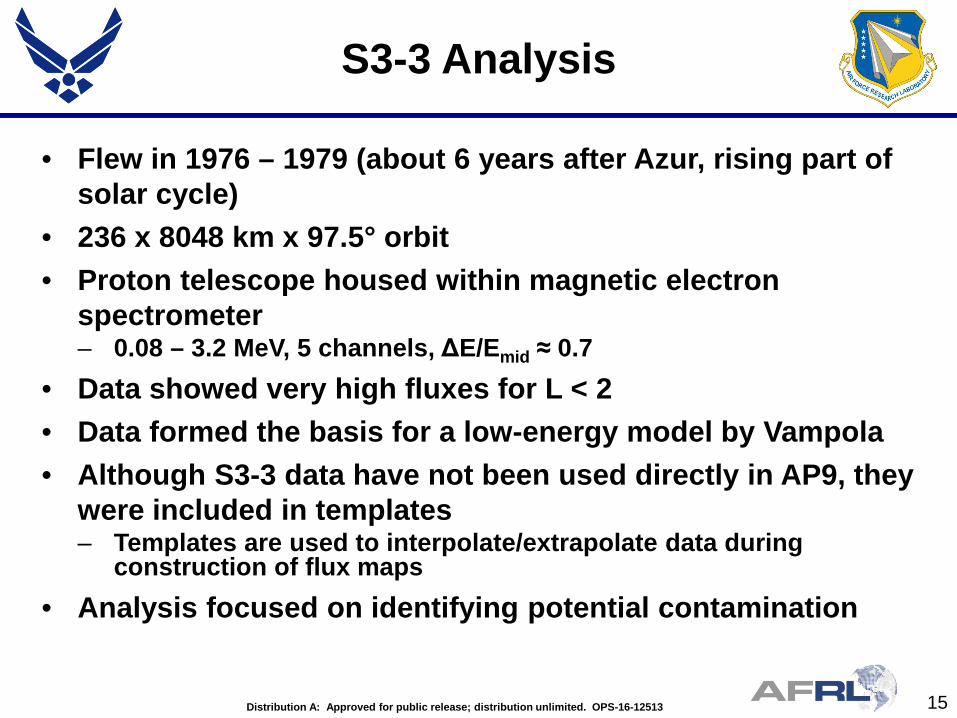
S3-3 Analysis
• Flew in 1976 – 1979 (about 6 years after Azur, rising part of solar cycle)
• 236 x 8048 km x 97.5° orbit• Proton telescope housed within magnetic electron
spectrometer– 0.08 – 3.2 MeV, 5 channels, ΔE/Emid ≈ 0.7
• Data showed very high fluxes for L < 2• Data formed the basis for a low-energy model by Vampola• Although S3-3 data have not been used directly in AP9, they
were included in templates– Templates are used to interpolate/extrapolate data during
construction of flux maps• Analysis focused on identifying potential contamination
16Distribution A: Approved for public release; distribution unlimited. OPS-16-12513
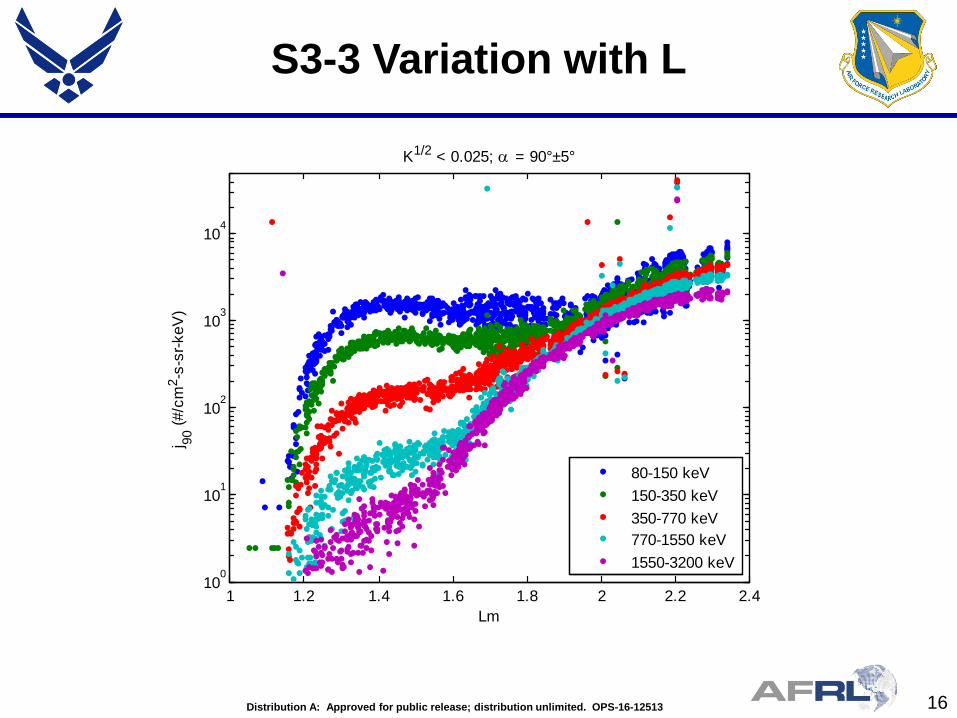
S3-3 Variation with L
1 1.2 1.4 1.6 1.8 2 2.2 2.410
0
101
102
103
104
Lm
j 90 (#
/cm
2 -s-
sr-k
eV)K1/2 < 0.025; α = 90°±5°
80-150 keV150-350 keV350-770 keV770-1550 keV1550-3200 keV
17Distribution A: Approved for public release; distribution unlimited. OPS-16-12513
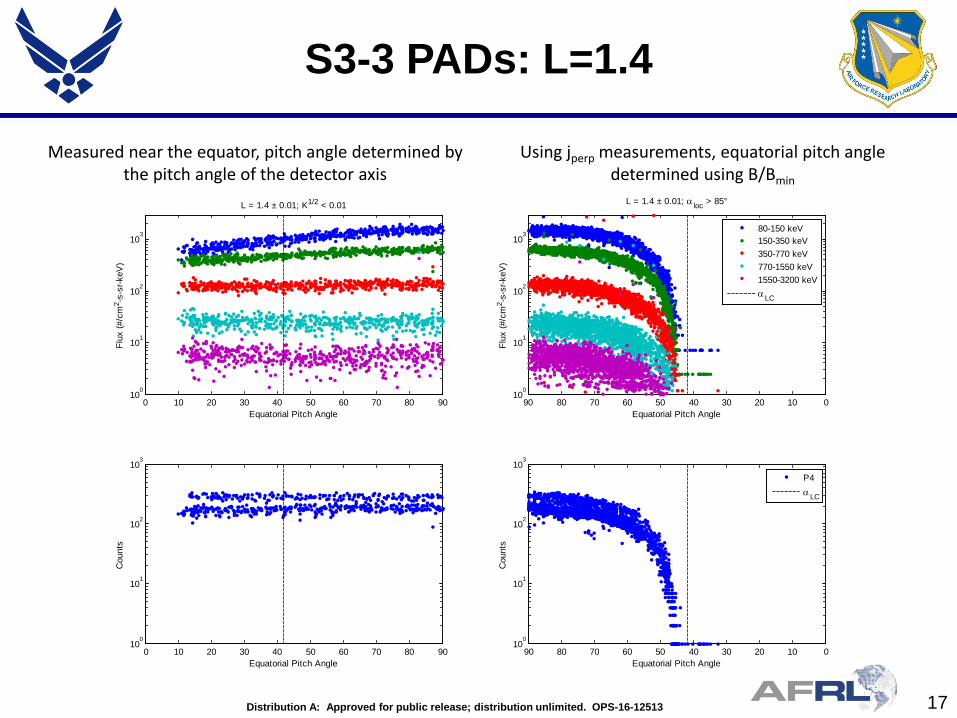
S3-3 PADs: L=1.4
0 10 20 30 40 50 60 70 80 9010
0
101
102
103
L = 1.4 ± 0.01; K1/2 < 0.01
Equatorial Pitch Angle
Flux
(#/c
m2 -
s-sr
-keV
)
0 10 20 30 40 50 60 70 80 9010
0
101
102
103
Equatorial Pitch Angle
Cou
nts
010203040506070809010
0
101
102
103
L = 1.4 ± 0.01; α loc > 85°
Equatorial Pitch Angle
Flux
(#/c
m2 -
s-sr
-keV
)
010203040506070809010
0
101
102
103
Equatorial Pitch Angle
Cou
nts
P4αLC
80-150 keV150-350 keV350-770 keV770-1550 keV1550-3200 keVαLC
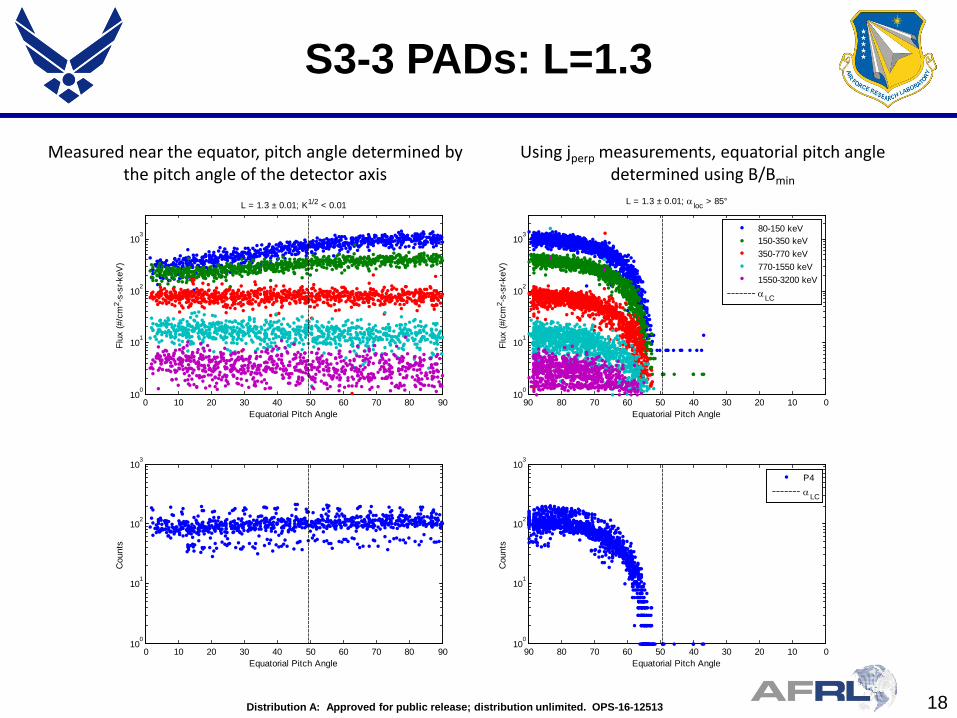
Measured near the equator, pitch angle determined by the pitch angle of the detector axis
Using jperp measurements, equatorial pitch angle determined using B/Bmin
18Distribution A: Approved for public release; distribution unlimited. OPS-16-12513
S3-3 PADs: L=1.3
0 10 20 30 40 50 60 70 80 9010
0
101
102
103
L = 1.3 ± 0.01; K1/2 < 0.01
Equatorial Pitch Angle
Flux
(#/c
m2 -
s-sr
-keV
)
0 10 20 30 40 50 60 70 80 9010
0
101
102
103
Equatorial Pitch Angle
Cou
nts
010203040506070809010
0
101
102
103
L = 1.3 ± 0.01; α loc > 85°
Equatorial Pitch Angle
Flux
(#/c
m2 -
s-sr
-keV
)
010203040506070809010
0
101
102
103
Equatorial Pitch Angle
Cou
nts
80-150 keV150-350 keV350-770 keV770-1550 keV1550-3200 keVαLC
P4αLC
Measured near the equator, pitch angle determined by the pitch angle of the detector axis
Using jperp measurements, equatorial pitch angle determined using B/Bmin
19Distribution A: Approved for public release; distribution unlimited. OPS-16-12513
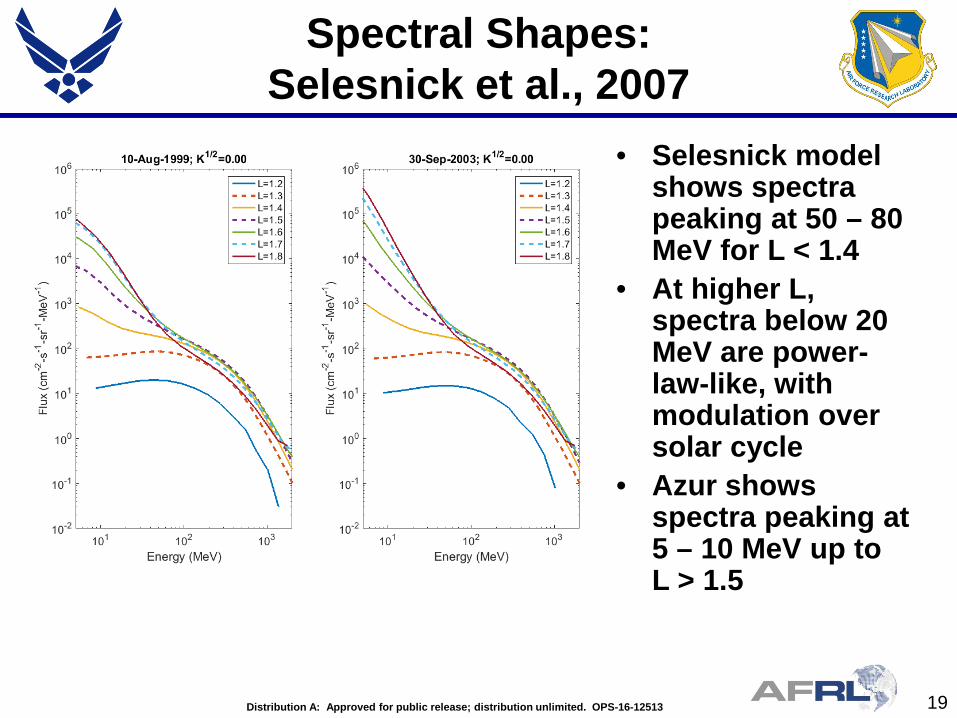
Spectral Shapes: Selesnick et al., 2007
• Selesnick model shows spectra peaking at 50 – 80 MeV for L < 1.4
• At higher L, spectra below 20 MeV are power-law-like, with modulation over solar cycle
• Azur shows spectra peaking at 5 – 10 MeV up to L > 1.5
20Distribution A: Approved for public release; distribution unlimited. OPS-16-12513
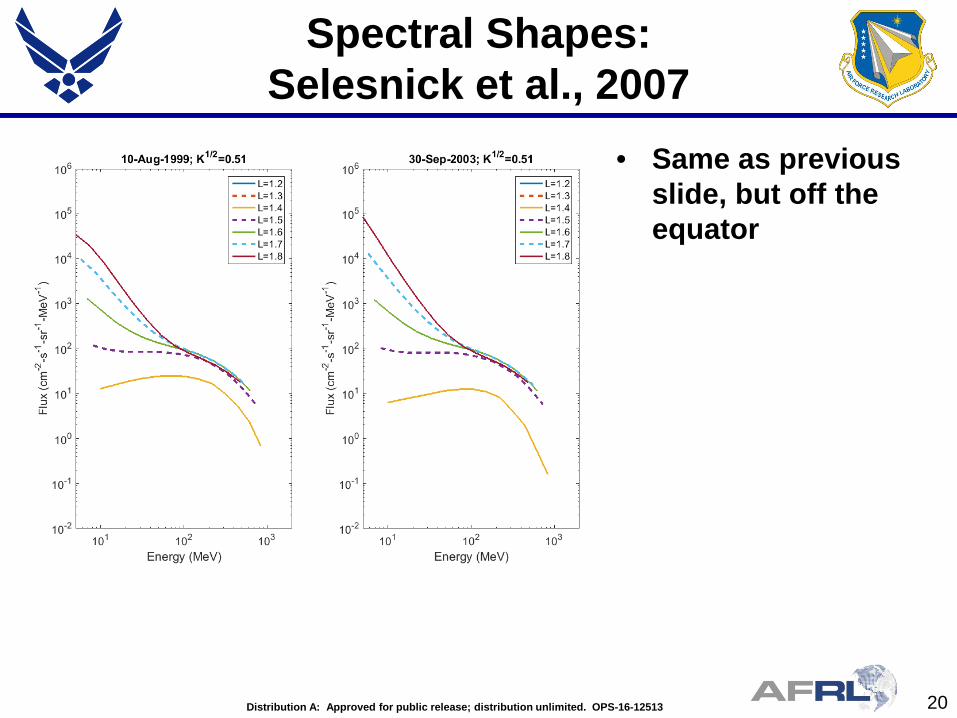
Spectral Shapes: Selesnick et al., 2007
• Same as previous slide, but off the equator
21Distribution A: Approved for public release; distribution unlimited. OPS-16-12513
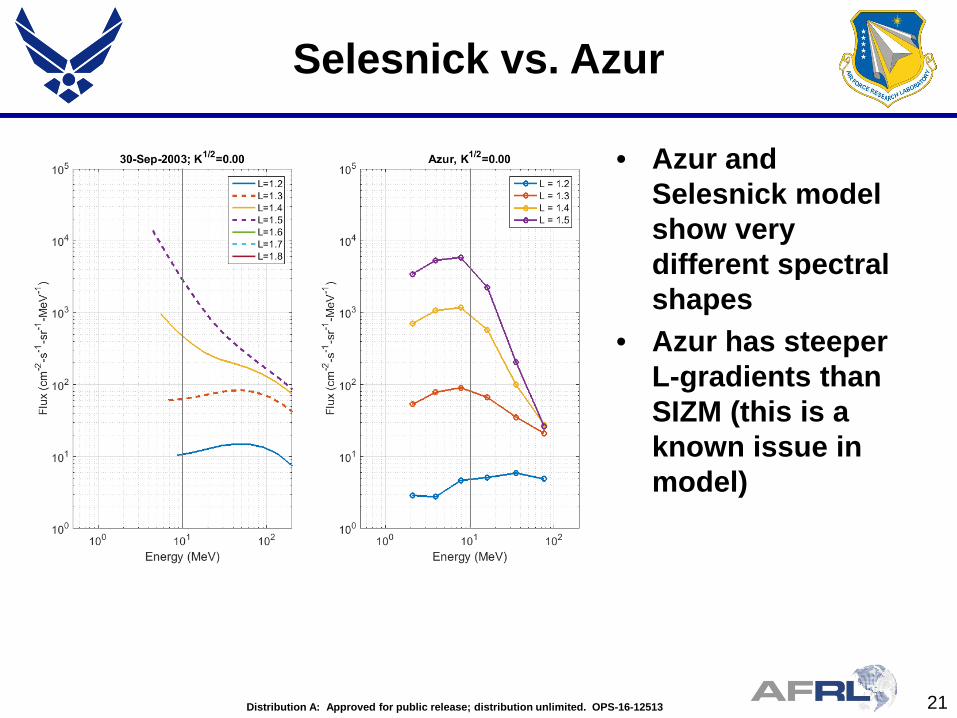
Selesnick vs. Azur
• Azur and Selesnick model show very different spectral shapes
• Azur has steeper L-gradients than SIZM (this is a known issue in model)

22Distribution A: Approved for public release; distribution unlimited. OPS-16-12513
Claflin & White (1974)
• Solves diffusion equation including Coulomb energy loss, nuclear inelastic scattering, secular decrease of internal field
• Uses solar-cycle averaged atmosphere
• Extended to lower energies (~ 2 MeV) for comparison with Azur and OV3-4
• For E < 10 MeV, basically flat for L < 1.25, peaks at 6 - 8 MeV for higher L
23Distribution A: Approved for public release; distribution unlimited. OPS-16-12513
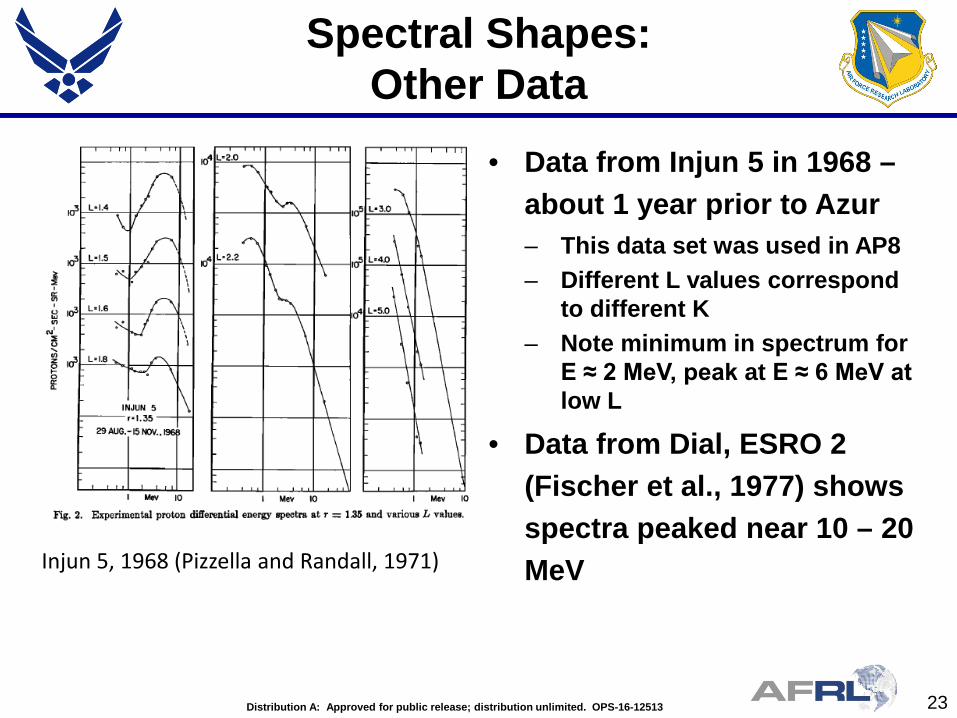
Spectral Shapes:Other Data
• Data from Injun 5 in 1968 –about 1 year prior to Azur– This data set was used in AP8– Different L values correspond
to different K– Note minimum in spectrum for
E ≈ 2 MeV, peak at E ≈ 6 MeV at low L
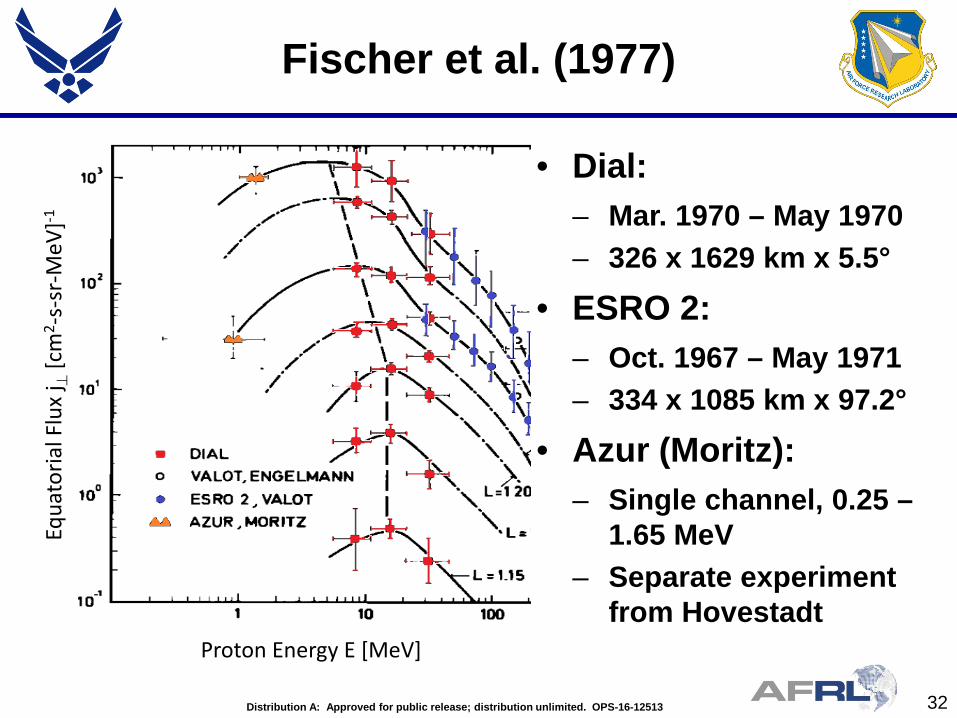
• Data from Dial, ESRO 2 (Fischer et al., 1977) shows spectra peaked near 10 – 20 MeVInjun 5, 1968 (Pizzella and Randall, 1971)
24Distribution A: Approved for public release; distribution unlimited. OPS-16-12513
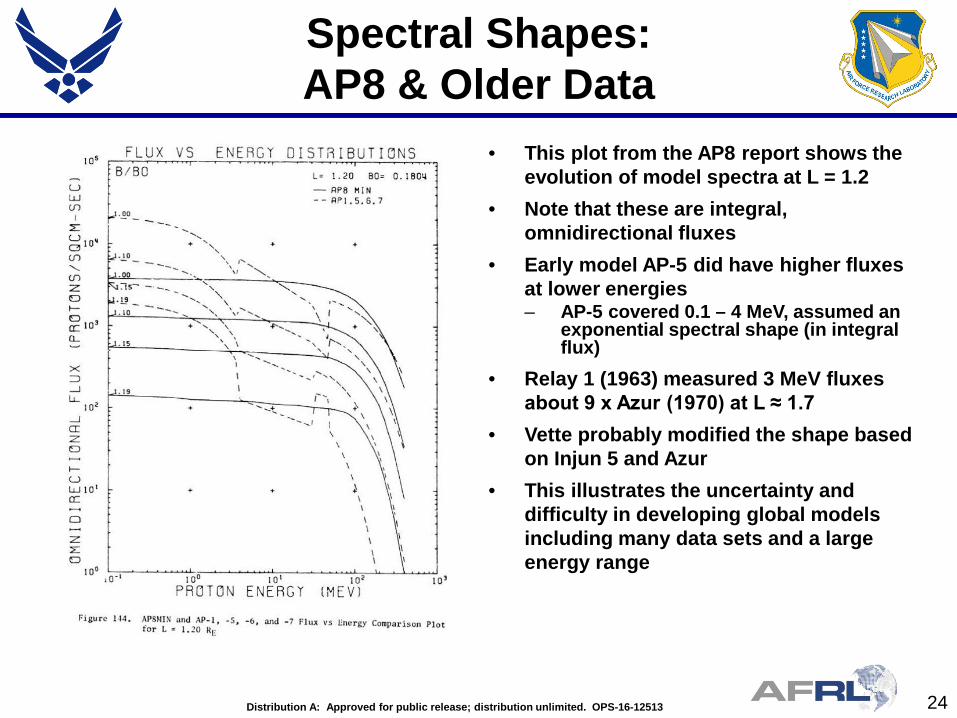
Spectral Shapes:AP8 & Older Data
• This plot from the AP8 report shows the evolution of model spectra at L = 1.2
• Note that these are integral, omnidirectional fluxes
• Early model AP-5 did have higher fluxes at lower energies– AP-5 covered 0.1 – 4 MeV, assumed an
exponential spectral shape (in integral flux)
• Relay 1 (1963) measured 3 MeV fluxes about 9 x Azur (1970) at L ≈ 1.7
• Vette probably modified the shape based on Injun 5 and Azur
• This illustrates the uncertainty and difficulty in developing global models including many data sets and a large energy range
25Distribution A: Approved for public release; distribution unlimited. OPS-16-12513
Summary of Results
• Binspectra plots– There are often large differences among data sets– Azur is sometimes the odd one out– S3-3 is generally in line with other data sets– Agreement among data sets improves above L ≈ 1.5
• S3-3– No reason to doubt large fluxes for L < 1.9– May be a transient phenomenon, but fairly stable over 2.8 years of data (1976 –
1979)
• Other data and models– Azur and contemporary data sets (1967 – 1971, Injun 5, Dial, ESRO 2) show spectra
peaked at 5 – 20 MeV– Physics-based models indicate a range of spectral shapes, but these are mostly for
energies > 10 MeV– Models provide little guidance for lower energies—spectrum below 10 MeV could be
flat or power law (or something else)
• TacSat-4 Tests– TacSat-4/CEASE response appears to be inconsistent with Azur spectral shapes
26Distribution A: Approved for public release; distribution unlimited. OPS-16-12513
Miscellaneous Points
• For E < 10 MeV, AP9 is largely driven by data from CRRES/PROTEL– Much work was performed to remove initial contamination of measurements at
E < 10 MeV (including after release of CRRESPRO model)– Note that in many cases AP9 fluxes are more like CRRES active data
• Measurements of < 10 MeV protons in inner zone are very difficult, primarily due to contamination from penetrating protons
• The fact that Azur is lower than other data sets indicates that the others could be contaminated (but not beyond a reasonable doubt)
• AP9 data sets from 1990 and later have been cross-calibrated with GOES – However, cross-calibration is uncertain for E < 10 MeV
• Fluxes vary over multiple dimensions (e.g., E, K, Φ, t; perhaps MLT, …)– Slicing and dicing for comparison (e.g., comparing energy spectra at one K/Φ)
can be misleading, especially in regions with large flux gradients, due to uncertainty in coordinates as well as measurements themselves
27Distribution A: Approved for public release; distribution unlimited. OPS-16-12513
Conclusions (1 of 2)
• We trust the data in AP9, model agrees with data
• We also trust Azur data• Most likely hypothesis is that Azur (and
contemporary measurements) and S3-3 represent two different geophysical states
28Distribution A: Approved for public release; distribution unlimited. OPS-16-12513
Conclusions (2 of 2)
• We expect that including Azur data (due in Version 1.5) will reduce AP9 fluxes, unclear how much– Confidence intervals will also change
• We are also developing new templates which should improve spectral shapes and altitude gradients
• Including solar cycle variations will also help• Need to eventually explain the discrepancies and
natural variability– Clean measurements of < 20 MeV protons in IZ– Extend theory to lower energies– Better methods for cross-calibration at lower energies

29Distribution A: Approved for public release; distribution unlimited. OPS-16-12513
Epilogue: RBSP
• RBSP < 20 MeV protons (MagEIS and RBSPICE) do not have a requirement for measurements in inner zone
• REPT (20 – 100 MeV) measurements in inner zone require significant data processing to remove contamination from penetrating protons
• RPS measurements in inner zone are clean
30Distribution A: Approved for public release; distribution unlimited. OPS-16-12513
Backup Charts
31Distribution A: Approved for public release; distribution unlimited. OPS-16-12513
Azur
• Data from Nov. 1969 – Mar. 1970 (0.3 years near Solar Max)
• 384 x 3145 km x 102.9° orbit; 1.5 – 104 MeV– 6 channels, ΔE/Emid ≈ 0.7
• Magnetically stabilized, so it always measures jperp
• A fairly large SPE occurred in Nov. 1969, right at launch; several smaller events occurred during the mission
32Distribution A: Approved for public release; distribution unlimited. OPS-16-12513
Fischer et al. (1977)
• Dial:– Mar. 1970 – May 1970– 326 x 1629 km x 5.5°
• ESRO 2:– Oct. 1967 – May 1971– 334 x 1085 km x 97.2°
• Azur (Moritz):– Single channel, 0.25 –
1.65 MeV– Separate experiment
from Hovestadt
Equa
toria
l Flu
x j ⊥
[cm
2 -s-
sr-M
eV]-1
Proton Energy E [MeV]

33Distribution A: Approved for public release; distribution unlimited. OPS-16-12513
Valot (1972)
• Valot: ESRO 2• Pizzella & Randall:
Injun 5• Naugle & Kniffen:
Emulsion stack (Sept. 1960)
• Mihalov & White: KH 7-10 (1964-045A); 149 x 307 km x 95.5°
34Distribution A: Approved for public release; distribution unlimited. OPS-16-12513
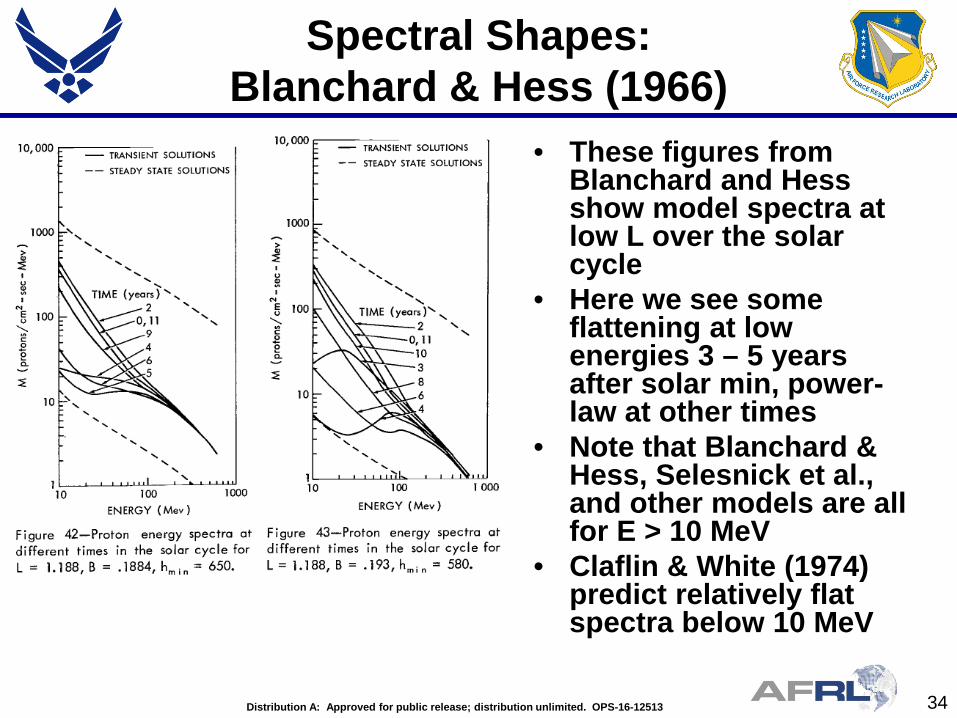
Spectral Shapes: Blanchard & Hess (1966)
• These figures from Blanchard and Hess show model spectra at low L over the solar cycle
• Here we see some flattening at low energies 3 – 5 years after solar min, power-law at other times
• Note that Blanchard & Hess, Selesnick et al., and other models are all for E > 10 MeV
• Claflin & White (1974) predict relatively flat spectra below 10 MeV
35Distribution A: Approved for public release; distribution unlimited. OPS-16-12513
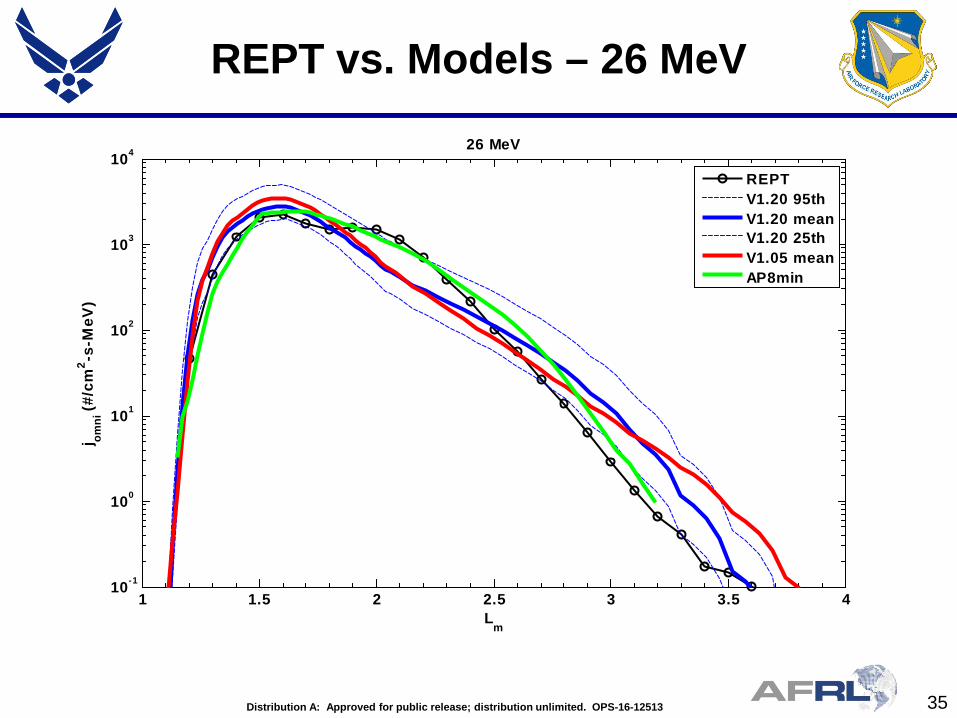
REPT vs. Models – 26 MeV
1 1.5 2 2.5 3 3.5 410-1
100
101
102
103
104
Lm
j omni
(#/
cm2 -s
-MeV
)
26 MeV
REPTV1.20 95thV1.20 meanV1.20 25thV1.05 meanAP8min