Acquisition and Analysis of Bispectral Bidirectional Reflectance and Reradiation Distribution...
7
Acquisition and Analysis of Bispectral Bidirectional Reflectance and Reradiation Distribution Functions Matthias B. Hullin 1 Johannes Hanika 2 Boris Ajdin 2 Hans-Peter Seidel 1 Jan Kautz 3 Hendrik P. A. Lensch 2 1 MPI Informatik 2 Ulm University 3 University College London λ i λ o Fluor. yellow Fluorescent red Green spray paint Pink spray paint Dull day-glo red White paper Figure 1: Fluorescent materials absorb part of the incoming light at wavelength λ i and reradiate it at the longer wavelength λ o . We have measured bispectral BRRDFs to capture such materials and render them in the spectral environment map of a winter sunset. The bottom row depicts slices of the bispectral BRRDF, showing one rendered sphere for each pair of incident and reflected or reradiated wavelengths (λ o , λ i ) ∈ [400 nm; 720 nm] × [380 nm; 720 nm]. Fluorescence is represented by the off-diagonal entries. Abstract In fluorescent materials, light from a certain band of incident wave- lengths is reradiated at longer wavelengths, i.e., with a reduced per-photon energy. While fluorescent materials are common in ev- eryday life, they have received little attention in computer graph- ics. Especially, no bidirectional reradiation measurements of flu- orescent materials have been available so far. In this paper, we extend the well-known concept of the bidirectional reflectance dis- tribution function (BRDF) to account for energy transfer between wavelengths, resulting in a Bispectral Bidirectional Reflectance and Reradiation Distribution Function (bispectral BRRDF). Using a bidirectional and bispectral measurement setup, we acquire re- flectance and reradiation data of a variety of fluorescent materials, including vehicle paints, paper and fabric, and compare their render- ings with RGB, RGB×RGB, and spectral BRDFs. Our acquisition is guided by a principal component analysis on complete bispectral data taken under a sparse set of angles. We show that in order to faithfully reproduce the full bispectral information for all other an- gles, only a very small number of wavelength pairs needs to be measured at a high angular resolution. CR Categories: I.4.1 [Image Processing and Computer Vision]: Digitization and Image Capture—Reflectance; I.3.7 [Computer Graphics]: Three-Dimensional Graphics and Realism—Color, shading, shadowing, and texture; Keywords: fluorescence, spectral BRDF, bispectral BRRDF, bi- spectral rendering 1 Introduction Fluorescent materials change the wavelength of light upon reflec- tion. This applies to many everyday materials, for instance human teeth, utility vehicle paints, detergents (fabric whiteners), or even ordinary photocopying paper. This shift of wavelength causes com- pelling visual effects if it occurs within the visible spectrum or turns UV radiation into visible light. In particular, many fluorescent sur- faces appear brighter than perfectly white surfaces (Figure 2). The underlying physical mechanism is well understood. A fluores- cent medium consists of atoms or molecules that absorb incident photons at a given wavelength, and re-emit them after a short time (in the order of 10 −8 s). During this time interval, the electrons of the fluorescent molecule remain in an excited state above the ground energy level. The re-emission of a photon occurs as the fluorophore relaxes to its ground state. Due to mechanical interac- tion with the surrounding molecules, some of the excitation energy is lost during this process, leading to a change of wavelength, or Stokes shift. As required for conservation of energy, except in the case of multi-photon interactions, this shift always occurs towards longer wavelengths, corresponding to a loss in per-photon energy. The wavelength-shifting behavior of a fluorescent material can be intuitively described bispectrally using a so-called reradiation ma- trix [Donaldson 1954], specifying for each combination of incom- ing and outgoing wavelengths the amount of reradiated light. At
description
Scientific document
Transcript of Acquisition and Analysis of Bispectral Bidirectional Reflectance and Reradiation Distribution...
Acquisition and Analysis of Bispectral
Bidirectional Reflectance and Reradiation Distribution Functions
Matthias B. Hullin1 Johannes Hanika2 Boris Ajdin2 Hans-Peter Seidel1 Jan Kautz3 Hendrik P. A. Lensch2
1MPI Informatik 2Ulm University 3University College London
λi
λo
Fluor. yellow Fluorescent red Green spray paint Pink spray paint Dull day-glo red White paper
Figure 1: Fluorescent materials absorb part of the incoming light at wavelength λi and reradiate it at the longer wavelength λo. We havemeasured bispectral BRRDFs to capture such materials and render them in the spectral environment map of a winter sunset. The bottomrow depicts slices of the bispectral BRRDF, showing one rendered sphere for each pair of incident and reflected or reradiated wavelengths(λo,λi) ∈ [400nm;720nm]× [380nm;720nm]. Fluorescence is represented by the off-diagonal entries.
Abstract
In fluorescent materials, light from a certain band of incident wave-lengths is reradiated at longer wavelengths, i.e., with a reducedper-photon energy. While fluorescent materials are common in ev-eryday life, they have received little attention in computer graph-ics. Especially, no bidirectional reradiation measurements of flu-orescent materials have been available so far. In this paper, weextend the well-known concept of the bidirectional reflectance dis-tribution function (BRDF) to account for energy transfer betweenwavelengths, resulting in a Bispectral Bidirectional Reflectanceand Reradiation Distribution Function (bispectral BRRDF). Usinga bidirectional and bispectral measurement setup, we acquire re-flectance and reradiation data of a variety of fluorescent materials,including vehicle paints, paper and fabric, and compare their render-ings with RGB, RGB×RGB, and spectral BRDFs. Our acquisitionis guided by a principal component analysis on complete bispectraldata taken under a sparse set of angles. We show that in order tofaithfully reproduce the full bispectral information for all other an-gles, only a very small number of wavelength pairs needs to bemeasured at a high angular resolution.
CR Categories: I.4.1 [Image Processing and Computer Vision]:Digitization and Image Capture—Reflectance;
I.3.7 [Computer Graphics]: Three-Dimensional Graphics andRealism—Color, shading, shadowing, and texture;
Keywords: fluorescence, spectral BRDF, bispectral BRRDF, bi-spectral rendering
1 Introduction
Fluorescent materials change the wavelength of light upon reflec-tion. This applies to many everyday materials, for instance human
teeth, utility vehicle paints, detergents (fabric whiteners), or evenordinary photocopying paper. This shift of wavelength causes com-pelling visual effects if it occurs within the visible spectrum or turnsUV radiation into visible light. In particular, many fluorescent sur-faces appear brighter than perfectly white surfaces (Figure 2).
The underlying physical mechanism is well understood. A fluores-cent medium consists of atoms or molecules that absorb incidentphotons at a given wavelength, and re-emit them after a short time(in the order of 10−8 s). During this time interval, the electronsof the fluorescent molecule remain in an excited state above theground energy level. The re-emission of a photon occurs as thefluorophore relaxes to its ground state. Due to mechanical interac-tion with the surrounding molecules, some of the excitation energyis lost during this process, leading to a change of wavelength, orStokes shift. As required for conservation of energy, except in thecase of multi-photon interactions, this shift always occurs towardslonger wavelengths, corresponding to a loss in per-photon energy.
The wavelength-shifting behavior of a fluorescent material can beintuitively described bispectrally using a so-called reradiation ma-trix [Donaldson 1954], specifying for each combination of incom-ing and outgoing wavelengths the amount of reradiated light. At
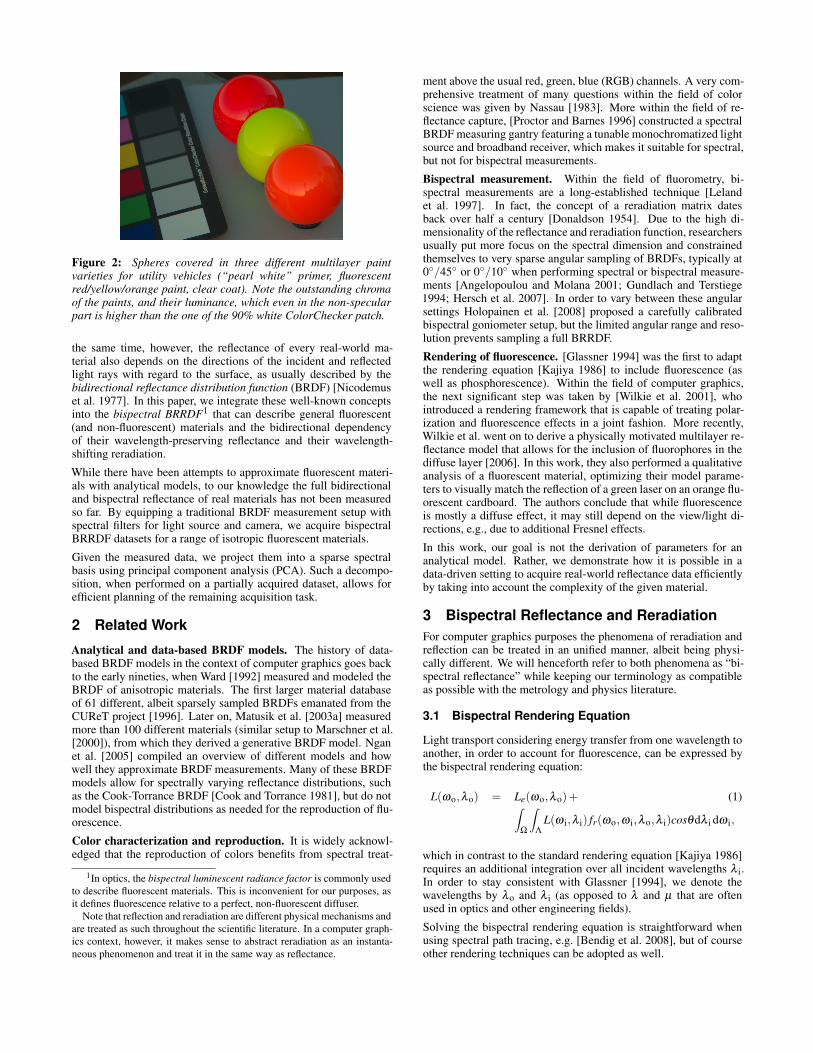
Figure 2: Spheres covered in three different multilayer paintvarieties for utility vehicles (“pearl white” primer, fluorescentred/yellow/orange paint, clear coat). Note the outstanding chromaof the paints, and their luminance, which even in the non-specularpart is higher than the one of the 90% white ColorChecker patch.
the same time, however, the reflectance of every real-world ma-terial also depends on the directions of the incident and reflectedlight rays with regard to the surface, as usually described by thebidirectional reflectance distribution function (BRDF) [Nicodemuset al. 1977]. In this paper, we integrate these well-known conceptsinto the bispectral BRRDF1 that can describe general fluorescent(and non-fluorescent) materials and the bidirectional dependencyof their wavelength-preserving reflectance and their wavelength-shifting reradiation.
While there have been attempts to approximate fluorescent materi-als with analytical models, to our knowledge the full bidirectionaland bispectral reflectance of real materials has not been measuredso far. By equipping a traditional BRDF measurement setup withspectral filters for light source and camera, we acquire bispectralBRRDF datasets for a range of isotropic fluorescent materials.
Given the measured data, we project them into a sparse spectralbasis using principal component analysis (PCA). Such a decompo-sition, when performed on a partially acquired dataset, allows forefficient planning of the remaining acquisition task.
2 Related Work
Analytical and data-based BRDF models. The history of data-based BRDF models in the context of computer graphics goes backto the early nineties, when Ward [1992] measured and modeled theBRDF of anisotropic materials. The first larger material databaseof 61 different, albeit sparsely sampled BRDFs emanated from theCUReT project [1996]. Later on, Matusik et al. [2003a] measuredmore than 100 different materials (similar setup to Marschner et al.[2000]), from which they derived a generative BRDF model. Nganet al. [2005] compiled an overview of different models and howwell they approximate BRDF measurements. Many of these BRDFmodels allow for spectrally varying reflectance distributions, suchas the Cook-Torrance BRDF [Cook and Torrance 1981], but do notmodel bispectral distributions as needed for the reproduction of flu-orescence.
Color characterization and reproduction. It is widely acknowl-edged that the reproduction of colors benefits from spectral treat-
1In optics, the bispectral luminescent radiance factor is commonly used
to describe fluorescent materials. This is inconvenient for our purposes, as
it defines fluorescence relative to a perfect, non-fluorescent diffuser.
Note that reflection and reradiation are different physical mechanisms and
are treated as such throughout the scientific literature. In a computer graph-
ics context, however, it makes sense to abstract reradiation as an instanta-
neous phenomenon and treat it in the same way as reflectance.
ment above the usual red, green, blue (RGB) channels. A very com-prehensive treatment of many questions within the field of colorscience was given by Nassau [1983]. More within the field of re-flectance capture, [Proctor and Barnes 1996] constructed a spectralBRDFmeasuring gantry featuring a tunable monochromatized lightsource and broadband receiver, which makes it suitable for spectral,but not for bispectral measurements.
Bispectral measurement. Within the field of fluorometry, bi-spectral measurements are a long-established technique [Lelandet al. 1997]. In fact, the concept of a reradiation matrix datesback over half a century [Donaldson 1954]. Due to the high di-mensionality of the reflectance and reradiation function, researchersusually put more focus on the spectral dimension and constrainedthemselves to very sparse angular sampling of BRDFs, typically at0/45 or 0/10 when performing spectral or bispectral measure-ments [Angelopoulou and Molana 2001; Gundlach and Terstiege1994; Hersch et al. 2007]. In order to vary between these angularsettings Holopainen et al. [2008] proposed a carefully calibratedbispectral goniometer setup, but the limited angular range and reso-lution prevents sampling a full BRRDF.
Rendering of fluorescence. [Glassner 1994] was the first to adaptthe rendering equation [Kajiya 1986] to include fluorescence (aswell as phosphorescence). Within the field of computer graphics,the next significant step was taken by [Wilkie et al. 2001], whointroduced a rendering framework that is capable of treating polar-ization and fluorescence effects in a joint fashion. More recently,Wilkie et al. went on to derive a physically motivated multilayer re-flectance model that allows for the inclusion of fluorophores in thediffuse layer [2006]. In this work, they also performed a qualitativeanalysis of a fluorescent material, optimizing their model parame-ters to visually match the reflection of a green laser on an orange flu-orescent cardboard. The authors conclude that while fluorescenceis mostly a diffuse effect, it may still depend on the view/light di-rections, e.g., due to additional Fresnel effects.
In this work, our goal is not the derivation of parameters for ananalytical model. Rather, we demonstrate how it is possible in adata-driven setting to acquire real-world reflectance data efficientlyby taking into account the complexity of the given material.
3 Bispectral Reflectance and Reradiation
For computer graphics purposes the phenomena of reradiation andreflection can be treated in an unified manner, albeit being physi-cally different. We will henceforth refer to both phenomena as “bi-spectral reflectance” while keeping our terminology as compatibleas possible with the metrology and physics literature.
3.1 Bispectral Rendering Equation
Light transport considering energy transfer from one wavelength toanother, in order to account for fluorescence, can be expressed bythe bispectral rendering equation:
L(ωo,λo) = Le(ωo,λo)+ (1)∫
Ω
∫
ΛL(ω i,λ i) fr(ωo,ω i,λo,λ i)cosθdλ i dω i,
which in contrast to the standard rendering equation [Kajiya 1986]requires an additional integration over all incident wavelengths λ i.In order to stay consistent with Glassner [1994], we denote thewavelengths by λo and λ i (as opposed to λ and µ that are oftenused in optics and other engineering fields).
Solving the bispectral rendering equation is straightforward whenusing spectral path tracing, e.g. [Bendig et al. 2008], but of courseother rendering techniques can be adopted as well.

Radiance L(ω)[
Wsr·m2
]
Spectral Radiance L(ω,λ )[
Wsr·m2·nm
]
Spectral Irradiance E(λ ) =∫
ΩL(ω,λ )dω[
Wm2·nm
]
Irradiance E =∫
Λ
∫
Ω L(ω,λ )dω dλ[
Wm2
]
Table 1: Definitions of spectral quantities; ω refers to directionsand λ to wavelengths.
3.2 Bispectral BRRDF
The bispectral rendering equation includes the bispectral BRRDFfr(ωo,ω i,λo,λ i) that describes the angularly dependent reflectancefor any pair of wavelengths. Its definition is different from thewell-known definition of a spectral BRDF [Nicodemus et al. 1977]which cannot represent fluorescent materials. Furthermore, it ismore general than the use of directionally independent reradiationmatrices as proposed by Donaldson [1954].
Before we provide the general bispectral BRRDF, let us briefly re-call the definition of a spectral BRDF. The required spectral quanti-ties are defined in Table 1. Note that the spectral quantities featurea different unit compared to their non-spectral counterparts. Fol-lowing Nicodemus et al. [1977], the differential reflected spectralradiance dLo(ωo,λo) due to the incident differential spectral irradi-ance dE(λ ) from direction ω i is given as:
dLo(ωo,λ ) = dE(λ ) fr(ωo,ω i,λ )
[
W
sr ·m2 ·nm
]
, (2)
with ω i and ωo being the incident and outgoing directions. Thespectral BRDF fr(ωo,ω i,λ ) for a single wavelength is thereforedefined as the ratio of differential reflected spectral radiance to dif-ferential incident spectral irradiance:
fr(ωo,ω i,λ ) =dLo(ωo,λ )
dE(λ )=
dLo(ωo,λ )
L i(ω i,λ )cos(θ i)dω i
[
1
sr
]
. (3)
It follows that the unit of the spectral BRDF is[
1sr
]
, which isthe same as for non-wavelength dependent BRDFs fr(ωo,ω i), al-though the units for L and E differ in the spectral vs. non-spectralcase.
We now generalize Nicodemus’ derivation of the BRDF to accountfor cross-wavelength energy transfer by the bispectral BRRDF andshow that its unit differs from the spectral BRDF. Referring to thebispectral rendering equation (Eq. 1) the differential reflected andreradiated spectral radiance (differential with regard to the incidentdirection ω i and the incident wavelength λ i) is due to incident dou-ble differential (non-spectral) irradiance for ω i and λ i:
d2Lo(ωo,λo) = d2E · fr(ωo,ω i,λo,λ i)
[
W
sr ·m2 ·nm
]
, (4)
and hence the bispectral BRRDF may be defined as
fr(ωo,ω i,λo,λ i) =d2Lo(ωo,λo)
L i(ω i,λ i)cos(θ i)dω i dλ i
[
1
sr ·nm
]
. (5)
The bispectral BRRDF is a general way to represent fluorescentmaterials as it does not make any assumptions about the material.
In the discretized case, an individual sample of the bispectralBRRDF for the directions (ω i,ωo) expresses the energy transferfrom the incoming spectrum to the reflected spectrum as a matrixover λo and λ i, see Figure 1. While the diagonal entries refer toreflection at the same wavelength, the fluorescent effect is repre-sented by the off-diagonal part. As there is typically no transferfrom longer to shorter wavelengths (towards higher energy), the up-per triangle will remain black.
4 Measurement and Reconstruction
4.1 Setup
In order to acquire isotropic bispectral BRRDFs, we have built afully automated image-based measurement device. It follows thedesign of Matusik et al. [2003a] for isotropic BRDFs but with theadded capability to emit and acquire at specific wavelength bands(Figure 3).
Figure 3: A depiction of our setup. A sample sphere (1) is mountedon a turntable (2), to which a digital monochrome still camera (3) isattached. The camera is equipped with a visible-spectrum tunablefilter (4). The sphere is illuminated by a light guide coupled xenonlight source (5) with another tunable filter (6) mounted in front;near-UV light is generated with LEDs that can be selected usinga motorized wheel (7). On the exit aperture of (6) and the entryaperture of (4), we attach optical depolarizers.
The spectral filters used are LCD-based Lyot filters (CRi VariSpecVIS10/35mm) whose transmission bands are about 10 nm–20 nmwide and range from 400 nm to 720 nm. We apply additional polar-ization scrambling optics to undo the linear polarization from theLCD filters so as not to bake any unwanted side effects into themeasured BRRDF. Figure 4 illustrates the strong influence of polar-ization both on the specular and the diffuse reflection for a samplewith clear coat. Our experiments show that even non-coated, appar-ently diffuse surfaces do not necessarily completely decorrelate thepolarization state.
As light source we employ a xenon arc lamp coupled into a lightfiber (XION medical Xenon R180), whose light has a flat andstable spectrum (measured using a spectroradiometer) but ratherweak blue and UV output, especially after passing the spectral filter.We therefore add LEDs for better coverage of this range (370 nm–420 nm in 10 nm steps). The camera is a monochrome, digital stillcamera (Jenoptik ProgRes MFcool), with which we acquire high-dynamic-range images using exposure series from 1ms to 16 s.
Avg. H/H H/V V/V V/H
Figure 4: Influence of polarization on reflection from a sphere:Average image and difference images (red: negative) depending onthe polarization state of light source and observer, where “H/V”stands for “horizontal in, vertical out”. Near the Brewster angle,the specular highlight is contained almost exclusively in the V/Vcomponent. Also, note the variation in the diffuse regions.
Paulita
Highlight
Paulita
Highlight
4.2 Geometric and Spectral Calibration
Calibrating such a measurement setup geometrically and spectrallyis not a trivial task. On the geometrical side, Havran et al. [2005]propose Helmholtz reciprocity as a validity criterion for the mea-surement setup. However, luminescent materials (that do not pre-serve the wavelength of light) do not fulfill Helmholtz reciprocityby nature [Springsteen 1999; Clarke and Parry 1985]. Therefore,we chose to treat the spectral and geometric calibration indepen-dently of each other. Geometric validation of our BRRDF mea-surement setup is provided by a reciprocity check using a non-fluorescent sample sphere.
The spectral response of the system is determined by taking intoaccount the spectral transmission or sensitivity curves for all ofthe components [DeRose et al. 2007; Holopainen et al. 2008], ei-ther as obtained from the manufacturers or calibrated using a pho-tospectrometer. We obtain the absolute scaling from a bispectralmeasurement on a flat Spectralon target, which preserves the wave-length and has a well-defined reflectance (99% quasi-Lambertianreflectivity across the spectrum). Due to a slight crosstalk betweenneighboring filter bands, we observe a small contribution of thewavelength-preserving reflection to non-diagonal elements in thebispectral matrix. For normalization, we require the rows of the cap-tured bispectral Spectralon BRRDF sample to add up to 0.99 sr−1,which, along with the transmission curves for the illumination anddetection branch, gives us a spectral scaling factor s(λo,λ i) for eachwavelength pair. Any captured camera value is scaled according tos(λo,λ i) before generating one entry in the matrix of a bispectralBRRDF sample.
4.3 Measurement and Data Processing
The straightforward way of acquiring a bispectral BRRDF is tocapture images at all turntable rotations β for every pair of wave-lengths (λo,λ i). For practical reasons we constrain ourselves to20 nm steps in the range from 380 nm to 720 nm for λ i and 400 nmto 720 nm for λo, amounting to 170 images per β as the upper tri-angle of the bispectral matrix can be ignored. We vary β in therange of 5 to 170. For highly specular materials a stepping of 5
is chosen to sufficiently sample the sharp highlight while we take acoarser sampling of 10 for materials of lesser angular bandwidth.The acquired data then undergo geometric processing and resam-pling.
Adaptive measurement. In the case of a PCA-steered measure-ment (Section 5), we first acquire full bispectral data sets for a smallnumber of turntable angles. After performing the PCA decomposi-tion, we acquire dense angular data only for the sparse bispectralbasis that is required for a good reconstruction. Only a small set ofwavelength pairs needs to be measured.
Geometric processing. Depending on the material, we use twodifferent sample geometries: coated spheres for the paints and acustom-made piecewise cylindrical object (Figure 12) wrapped instripes of paper or fabric.
Due to the varying normals of the shapes each surface point willbe illuminated and viewed from a slightly different direction. Fromsimple geometric considerations we can determine (ωo,ω i) for ev-ery pixel captured under a specific turntable rotation β .
For storage and further processing, we discretize the data for eachwavelength pair in 323 bins using the (θo,θ i, φdiff) parameterizationchosen in [Matusik et al. 2003a]. For the strongly specular materi-als, 643 bins are used. Bins that are not populated due to the coarsesampling of the turntable position are filled in by diffusion.
In the rendering step, a specific reflectance samplefr(θo,θ i,φdiff,λo,λ i) is obtained by multilinear interpolationfrom our bispectral BRRDF representation.
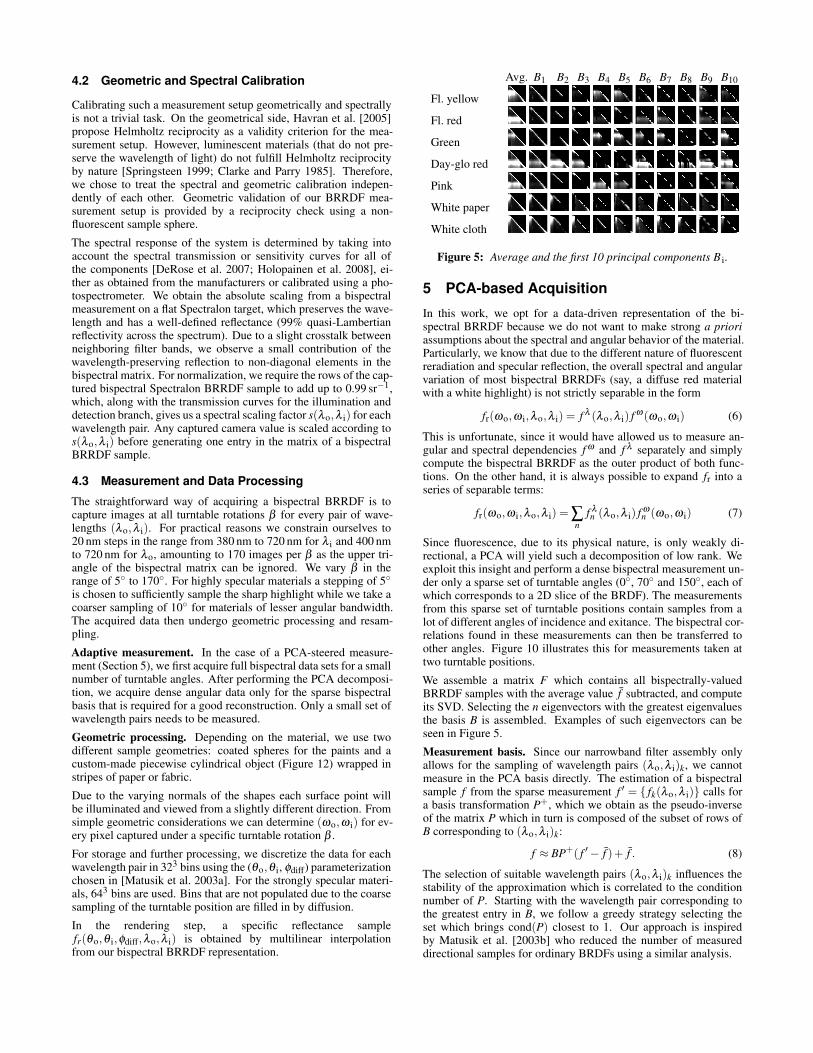
Avg. B1 B2 B3 B4 B5 B6 B7 B8 B9 B10
Fl. yellow
Fl. red
Green
Day-glo red
Pink
White paper
White cloth
Figure 5: Average and the first 10 principal components B i.
5 PCA-based Acquisition
In this work, we opt for a data-driven representation of the bi-spectral BRRDF because we do not want to make strong a prioriassumptions about the spectral and angular behavior of the material.Particularly, we know that due to the different nature of fluorescentreradiation and specular reflection, the overall spectral and angularvariation of most bispectral BRRDFs (say, a diffuse red materialwith a white highlight) is not strictly separable in the form
fr(ωo,ω i,λo,λ i) = f λ (λo,λ i) fω (ωo,ω i) (6)
This is unfortunate, since it would have allowed us to measure an-gular and spectral dependencies fω and f λ separately and simplycompute the bispectral BRRDF as the outer product of both func-tions. On the other hand, it is always possible to expand fr into aseries of separable terms:
fr(ωo,ω i,λo,λ i) = ∑n
f λn (λo,λ i) f
ωn (ωo,ω i) (7)
Since fluorescence, due to its physical nature, is only weakly di-rectional, a PCA will yield such a decomposition of low rank. Weexploit this insight and perform a dense bispectral measurement un-der only a sparse set of turntable angles (0, 70 and 150, each ofwhich corresponds to a 2D slice of the BRDF). The measurementsfrom this sparse set of turntable positions contain samples from alot of different angles of incidence and exitance. The bispectral cor-relations found in these measurements can then be transferred toother angles. Figure 10 illustrates this for measurements taken attwo turntable positions.
We assemble a matrix F which contains all bispectrally-valuedBRRDF samples with the average value f subtracted, and computeits SVD. Selecting the n eigenvectors with the greatest eigenvaluesthe basis B is assembled. Examples of such eigenvectors can beseen in Figure 5.
Measurement basis. Since our narrowband filter assembly onlyallows for the sampling of wavelength pairs (λo,λ i)k, we cannotmeasure in the PCA basis directly. The estimation of a bispectralsample f from the sparse measurement f ′ = fk(λo,λ i) calls fora basis transformation P+, which we obtain as the pseudo-inverseof the matrix P which in turn is composed of the subset of rows ofB corresponding to (λo,λ i)k:
f ≈ BP+( f ′− f )+ f . (8)
The selection of suitable wavelength pairs (λo,λ i)k influences thestability of the approximation which is correlated to the conditionnumber of P. Starting with the wavelength pair corresponding tothe greatest entry in B, we follow a greedy strategy selecting theset which brings cond(P) closest to 1. Our approach is inspiredby Matusik et al. [2003b] who reduced the number of measureddirectional samples for ordinary BRDFs using a similar analysis.

#Comp. 1 2 3 4 5 10 20 30 1% 0.1%
Dull red 2 5
Orange 4 7
Green 2 6
Pink 2 7
Speckled 4 8
Figure 6: Image-based same-angle reconstruction of full bi-spectral data (20 nm resolution) from a small number of acquiredbispectral samples. As a reference, we provide ground truth in thetop half of each image, and the number of basis vectors required forthe residual energy to drop below 1% and 0.1%, respectively. Notethat in the case of strong specular highlights (Orange, Speckled),the numerical error does not reflect the visual difference well.
Figure 7: The Speckled sample, while not a homogeneous BRRDF,represents the class of mixed materials with angularly dependentvisibility of the individual components. Note the red shift towardsgrazing angles in the defocused shot (right). Photos taken under420nm light.
5.1 Insights
Same-angle reconstruction using standard PCA. In Figure 6, weshow a reconstruction of a single-angle bispectral measurementfrom the PCA basis for the same angle. The error measure pro-vided is given by the residual energy as determined by the SVDand relates to the full bispectral dataset with 170 wavelength pairs,not just the resulting sRGB color vectors as shown in the figure.Although the fidelity increases with the cardinality of the measure-ment basis, the visual appearance even at a numerical error as lowas 1% or 0.1% is not always fully satisfactory. It is due to the least-squares nature of the SVD that materials with particularly strongspecular highlights (Orange, Speckled) attract the attention of thefirst few eigenvectors at the expense of a slower convergence in thenonspecular regions. Remarkably, a decent reconstruction is oftenachieved even before the inclusion of the first measurement of anoff-diagonal wavelength pair. In all five examples, the first 9 compo-nents were based purely on wavelength-preserving measurements.
Speckled dataset. The “Speckled” material (Figure 7) is a fluores-cent yellow sphere onto which we manually applied a non-uniformlayer of red speckles. While this sample does not have a homo-geneous BRRDF, we included it as it represents a material withcomplex microstructure resulting in directionally dependent fluo-rescence, as can be seen in the defocused image (Figure 7 right).
Figure 8: As saturation function x = sat(x), we chose the inverseof x = sign(x)(x2 + |x|), which is linear for small values of |x|, butof O(
√x) asymptotically.
#Comp. 1 2 3 4 5 10
Orange
Speckled
Figure 9: By applying a saturation function on the covariancematrix, the convergence in the non-specular parts is significantlyimproved.
Taming the specular highlight. It is to be expected that a signal de-composition based on a L1 measure would no longer overemphasizethe importance of the specular highlight. However, the few L1-PCAapproaches in existence are computationally rather expensive and,due to their nonlinear optimization scheme, offer no guarantee ofglobal convergence [Baccini et al. 1996; Ke and Kanade 2003]. Inorder to emulate a similar behavior using a standard PCA, we applya saturation function on the values in the covariance matrix (and itsinverse after the reconstruction), which dampens the high pixel val-ues in the highlight region (Figure 8). As a consequence, the visualconvergence is sped up considerably (Figure 9).
Angular dependency. For most materials (except Speckled), theresulting principal components show that the fluorescent entries inthe reradiation matrix λi 6= λo, taken for themselves, carry a ratherweak angular dependency, i.e., indicating reasonable separability.However, as soon as the full matrix, the full bispectral BRRDF in-cluding the non-fluorescent elements, is considered, at least two,most often even more separable functions are required for faithfulreproduction.
Angle transfer. Earlier on, we assumed that the bispectral de-composition of an angular BRRDF slice can be transferred to thespectrally sparse measurements taken under different angles. InFigure 10, we provide experimental evidence for this assumption.Using a PCA basis that was computed using fully-bispectral mea-surements at turntable angles of 0 and 70, we reconstruct a fullybispectral intermediate slice at 35 out of only five measured wave-length pairs.
Our PCA-guided measurement routine allows us to drastically re-duce the acquisition cost. As an example, let us assume a samplingof 5 steps from 0 to 150 for the turntable position. If all 170bispectral entries are captured for each angle, the total time of opti-cal exposure amounts to approx. 45 hours. By performing the fullbispectral measurement under three turntable orientations only, andby measuring only 5 out of 170 wavelength pairs for the remainingangles, the acquisition time drops to 5.5 hours.
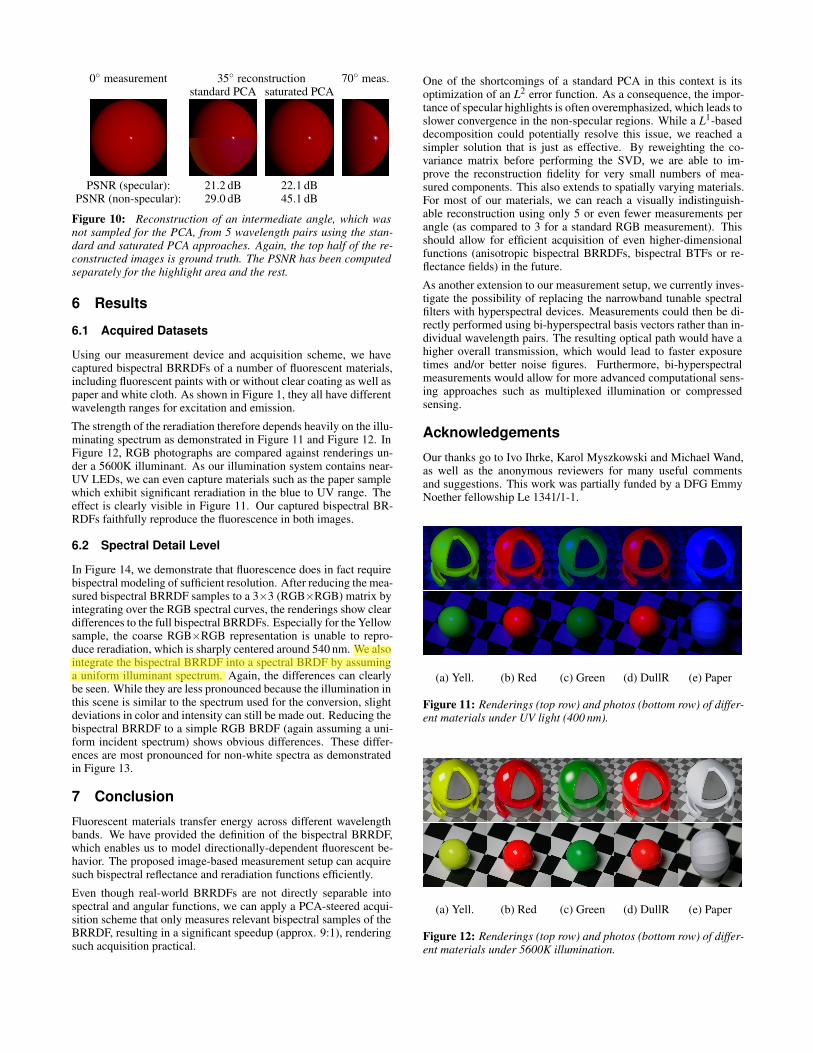
0 measurement 35 reconstruction 70 meas.standard PCA saturated PCA
PSNR (specular): 21.2 dB 22.1 dBPSNR (non-specular): 29.0 dB 45.1 dB
Figure 10: Reconstruction of an intermediate angle, which wasnot sampled for the PCA, from 5 wavelength pairs using the stan-dard and saturated PCA approaches. Again, the top half of the re-constructed images is ground truth. The PSNR has been computedseparately for the highlight area and the rest.
6 Results
6.1 Acquired Datasets
Using our measurement device and acquisition scheme, we havecaptured bispectral BRRDFs of a number of fluorescent materials,including fluorescent paints with or without clear coating as well aspaper and white cloth. As shown in Figure 1, they all have differentwavelength ranges for excitation and emission.
The strength of the reradiation therefore depends heavily on the illu-minating spectrum as demonstrated in Figure 11 and Figure 12. InFigure 12, RGB photographs are compared against renderings un-der a 5600K illuminant. As our illumination system contains near-UV LEDs, we can even capture materials such as the paper samplewhich exhibit significant reradiation in the blue to UV range. Theeffect is clearly visible in Figure 11. Our captured bispectral BR-RDFs faithfully reproduce the fluorescence in both images.
6.2 Spectral Detail Level
In Figure 14, we demonstrate that fluorescence does in fact requirebispectral modeling of sufficient resolution. After reducing the mea-sured bispectral BRRDF samples to a 3×3 (RGB×RGB) matrix byintegrating over the RGB spectral curves, the renderings show cleardifferences to the full bispectral BRRDFs. Especially for the Yellowsample, the coarse RGB×RGB representation is unable to repro-duce reradiation, which is sharply centered around 540 nm. We alsointegrate the bispectral BRRDF into a spectral BRDF by assuminga uniform illuminant spectrum. Again, the differences can clearlybe seen. While they are less pronounced because the illumination inthis scene is similar to the spectrum used for the conversion, slightdeviations in color and intensity can still be made out. Reducing thebispectral BRRDF to a simple RGB BRDF (again assuming a uni-form incident spectrum) shows obvious differences. These differ-ences are most pronounced for non-white spectra as demonstratedin Figure 13.
7 Conclusion
Fluorescent materials transfer energy across different wavelengthbands. We have provided the definition of the bispectral BRRDF,which enables us to model directionally-dependent fluorescent be-havior. The proposed image-based measurement setup can acquiresuch bispectral reflectance and reradiation functions efficiently.
Even though real-world BRRDFs are not directly separable intospectral and angular functions, we can apply a PCA-steered acqui-sition scheme that only measures relevant bispectral samples of theBRRDF, resulting in a significant speedup (approx. 9:1), renderingsuch acquisition practical.
One of the shortcomings of a standard PCA in this context is itsoptimization of an L2 error function. As a consequence, the impor-tance of specular highlights is often overemphasized, which leads toslower convergence in the non-specular regions. While a L1-baseddecomposition could potentially resolve this issue, we reached asimpler solution that is just as effective. By reweighting the co-variance matrix before performing the SVD, we are able to im-prove the reconstruction fidelity for very small numbers of mea-sured components. This also extends to spatially varying materials.For most of our materials, we can reach a visually indistinguish-able reconstruction using only 5 or even fewer measurements perangle (as compared to 3 for a standard RGB measurement). Thisshould allow for efficient acquisition of even higher-dimensionalfunctions (anisotropic bispectral BRRDFs, bispectral BTFs or re-flectance fields) in the future.
As another extension to our measurement setup, we currently inves-tigate the possibility of replacing the narrowband tunable spectralfilters with hyperspectral devices. Measurements could then be di-rectly performed using bi-hyperspectral basis vectors rather than in-dividual wavelength pairs. The resulting optical path would have ahigher overall transmission, which would lead to faster exposuretimes and/or better noise figures. Furthermore, bi-hyperspectralmeasurements would allow for more advanced computational sens-ing approaches such as multiplexed illumination or compressedsensing.
Acknowledgements
Our thanks go to Ivo Ihrke, Karol Myszkowski and Michael Wand,as well as the anonymous reviewers for many useful commentsand suggestions. This work was partially funded by a DFG EmmyNoether fellowship Le 1341/1-1.
(a) Yell. (b) Red (c) Green (d) DullR (e) Paper
Figure 11: Renderings (top row) and photos (bottom row) of differ-ent materials under UV light (400 nm).
(a) Yell. (b) Red (c) Green (d) DullR (e) Paper
Figure 12: Renderings (top row) and photos (bottom row) of differ-ent materials under 5600K illumination.
Paulita
Highlight
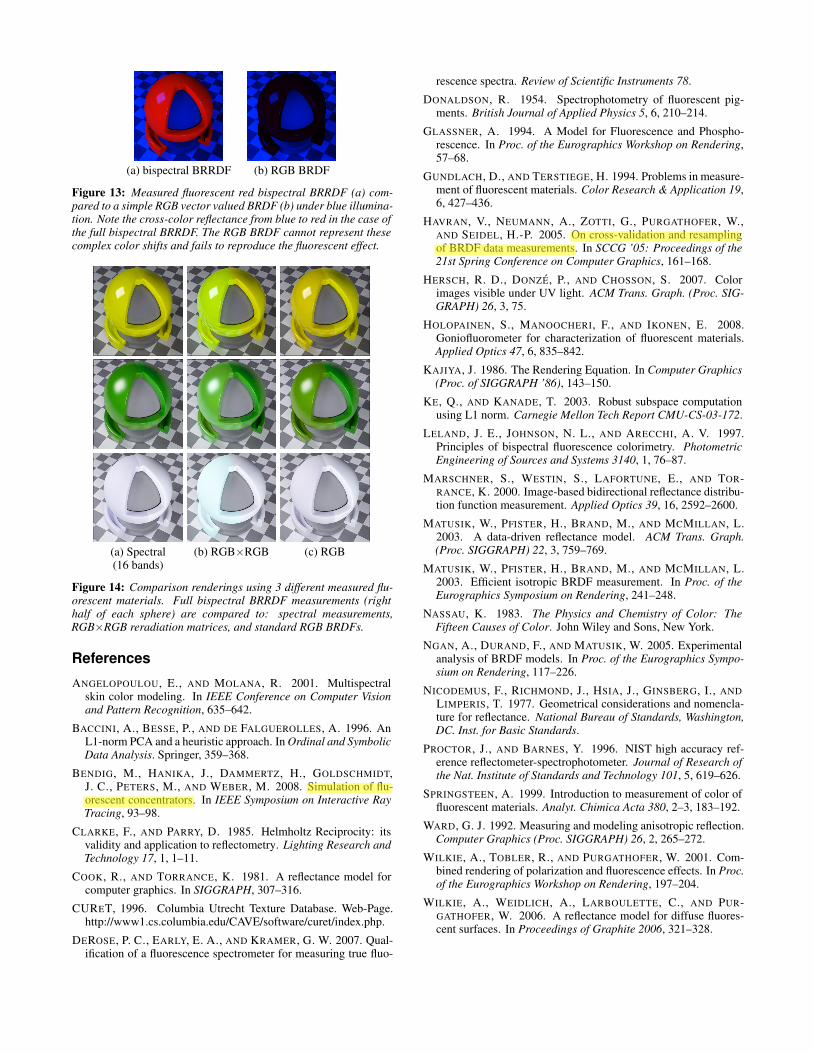
(a) bispectral BRRDF (b) RGB BRDF
Figure 13: Measured fluorescent red bispectral BRRDF (a) com-pared to a simple RGB vector valued BRDF (b) under blue illumina-tion. Note the cross-color reflectance from blue to red in the case ofthe full bispectral BRRDF. The RGB BRDF cannot represent thesecomplex color shifts and fails to reproduce the fluorescent effect.
(a) Spectral (b) RGB×RGB (c) RGB(16 bands)
Figure 14: Comparison renderings using 3 different measured flu-orescent materials. Full bispectral BRRDF measurements (righthalf of each sphere) are compared to: spectral measurements,RGB×RGB reradiation matrices, and standard RGB BRDFs.
References
ANGELOPOULOU, E., AND MOLANA, R. 2001. Multispectralskin color modeling. In IEEE Conference on Computer Visionand Pattern Recognition, 635–642.
BACCINI, A., BESSE, P., AND DE FALGUEROLLES, A. 1996. AnL1-norm PCA and a heuristic approach. InOrdinal and SymbolicData Analysis. Springer, 359–368.
BENDIG, M., HANIKA, J., DAMMERTZ, H., GOLDSCHMIDT,J. C., PETERS, M., AND WEBER, M. 2008. Simulation of flu-orescent concentrators. In IEEE Symposium on Interactive RayTracing, 93–98.
CLARKE, F., AND PARRY, D. 1985. Helmholtz Reciprocity: itsvalidity and application to reflectometry. Lighting Research andTechnology 17, 1, 1–11.
COOK, R., AND TORRANCE, K. 1981. A reflectance model forcomputer graphics. In SIGGRAPH, 307–316.
CURET, 1996. Columbia Utrecht Texture Database. Web-Page.http://www1.cs.columbia.edu/CAVE/software/curet/index.php.
DEROSE, P. C., EARLY, E. A., AND KRAMER, G. W. 2007. Qual-ification of a fluorescence spectrometer for measuring true fluo-
rescence spectra. Review of Scientific Instruments 78.
DONALDSON, R. 1954. Spectrophotometry of fluorescent pig-ments. British Journal of Applied Physics 5, 6, 210–214.
GLASSNER, A. 1994. A Model for Fluorescence and Phospho-rescence. In Proc. of the Eurographics Workshop on Rendering,57–68.
GUNDLACH, D., AND TERSTIEGE, H. 1994. Problems in measure-ment of fluorescent materials. Color Research & Application 19,6, 427–436.
HAVRAN, V., NEUMANN, A., ZOTTI, G., PURGATHOFER, W.,AND SEIDEL, H.-P. 2005. On cross-validation and resamplingof BRDF data measurements. In SCCG ’05: Proceedings of the21st Spring Conference on Computer Graphics, 161–168.
HERSCH, R. D., DONZE, P., AND CHOSSON, S. 2007. Colorimages visible under UV light. ACM Trans. Graph. (Proc. SIG-GRAPH) 26, 3, 75.
HOLOPAINEN, S., MANOOCHERI, F., AND IKONEN, E. 2008.Goniofluorometer for characterization of fluorescent materials.Applied Optics 47, 6, 835–842.
KAJIYA, J. 1986. The Rendering Equation. In Computer Graphics(Proc. of SIGGRAPH ’86), 143–150.
KE, Q., AND KANADE, T. 2003. Robust subspace computationusing L1 norm. Carnegie Mellon Tech Report CMU-CS-03-172.
LELAND, J. E., JOHNSON, N. L., AND ARECCHI, A. V. 1997.Principles of bispectral fluorescence colorimetry. PhotometricEngineering of Sources and Systems 3140, 1, 76–87.
MARSCHNER, S., WESTIN, S., LAFORTUNE, E., AND TOR-RANCE, K. 2000. Image-based bidirectional reflectance distribu-tion function measurement. Applied Optics 39, 16, 2592–2600.
MATUSIK, W., PFISTER, H., BRAND, M., AND MCMILLAN, L.2003. A data-driven reflectance model. ACM Trans. Graph.(Proc. SIGGRAPH) 22, 3, 759–769.
MATUSIK, W., PFISTER, H., BRAND, M., AND MCMILLAN, L.2003. Efficient isotropic BRDF measurement. In Proc. of theEurographics Symposium on Rendering, 241–248.
NASSAU, K. 1983. The Physics and Chemistry of Color: TheFifteen Causes of Color. John Wiley and Sons, New York.
NGAN, A., DURAND, F., AND MATUSIK, W. 2005. Experimentalanalysis of BRDF models. In Proc. of the Eurographics Sympo-sium on Rendering, 117–226.
NICODEMUS, F., RICHMOND, J., HSIA, J., GINSBERG, I., AND
LIMPERIS, T. 1977. Geometrical considerations and nomencla-ture for reflectance. National Bureau of Standards, Washington,DC. Inst. for Basic Standards.
PROCTOR, J., AND BARNES, Y. 1996. NIST high accuracy ref-erence reflectometer-spectrophotometer. Journal of Research ofthe Nat. Institute of Standards and Technology 101, 5, 619–626.
SPRINGSTEEN, A. 1999. Introduction to measurement of color offluorescent materials. Analyt. Chimica Acta 380, 2–3, 183–192.
WARD, G. J. 1992. Measuring and modeling anisotropic reflection.Computer Graphics (Proc. SIGGRAPH) 26, 2, 265–272.
WILKIE, A., TOBLER, R., AND PURGATHOFER, W. 2001. Com-bined rendering of polarization and fluorescence effects. In Proc.of the Eurographics Workshop on Rendering, 197–204.
WILKIE, A., WEIDLICH, A., LARBOULETTE, C., AND PUR-GATHOFER, W. 2006. A reflectance model for diffuse fluores-cent surfaces. In Proceedings of Graphite 2006, 321–328.
Paulita
Highlight
Paulita
Highlight