Acknowledgements - COHA | Canadian Ornamental … Report 2009-04-27.en.pdf · comprehensive report...
138
© Deloitte & Touche LLP and affiliated entities. Canadian Ornamental Horticulture Alliance i Consulting The impact of ornamental horticulture on Canada’s economy An economic and environmental impact assessment of the Canadian ornamental horticulture sector of production agriculture January 2009
Transcript of Acknowledgements - COHA | Canadian Ornamental … Report 2009-04-27.en.pdf · comprehensive report...
� � 頴盭챴 虒蘟蘟 蘟αα © Deloitte & Touche LLP and affiliated entities. Canadian Ornamental Horticulture Alliance i
Consulting
The impact of ornamental
horticulture on Canada’s
economy
An economic and environmental impact assessment of the Canadian ornamental horticulture sector of production agriculture
January 2009

© Deloitte & Touche LLP and affiliated entities. Canadian Ornamental Horticulture Alliance ii
Acknowledgements
The Canadian Ornamental Horticulture Alliance (COHA) gratefully acknowledges funding provided by Agriculture and Agri-Food Canada through the Advancing Canadian Agriculture and Agri-Food (ACAAF) program.
Agriculture and Agri-Food Canada (AAFC) is pleased to participate in this project. AAFC is committed to working with industry partners to increase public awareness of the importance of the agriculture and agri-food industry to Canada. Opinions expressed in this document are those of Deloitte and not necessarily those of AAFC or COHA.
COHA would also like to gratefully acknowledge the efforts of the following organizations:
Deloitte Inc.
University of Guelph
Canadian Nursery Landscape Association (CNLA)
Flowers Canada Growers (FCG)
Fédération Interdisciplinaire De L’horticulture Ornementale Du Québec (FIHOQ)
Jayeff Partners
Ornamental producers from across Canada who participated in this study
Channel stakeholders from across Canada who participated in the study
Statistics Canada
Quality Response Inc.
Project Steering Committee Deloitte project team
Dr. Irwin Smith Sean Smyth
Luce Daigneault Dwayne Mathers
Victor Santacruz Richard Carson
Chris Andrews The Honourable Pierre Pettigrew, PC
James Farrar Dr. Youbin Zheng (University of Guelph)
Rita Weerdenburg
Michel-Antoine Renaud
Special contributions by
Jack Slibar, Deloitte
Kristen Pizzolo, Deloitte
Ron Bidulka, Deloitte
Liz Isaak, Deloitte

© Deloitte & Touche LLP and affiliated entities. Canadian Ornamental Horticulture Alliance iii
Table of contents
Glossary of select terms............................................................................................................. v
Executive summary .................................................................................................................. 1
1. Profile of the Canadian Ornamental Horticultural Sector ............................................................ 6
Summary ......................................................................................................................... 6
Sector structure - historical development and current situation ...................................... 6
2. Economic impact of the Canadian Ornamental Horticultural Sector ............................................ 15
Summary ....................................................................................................................... 15
Sector structure............................................................................................................. 15
Economic impact analysis overview ............................................................................... 16
Economic impact multipliers .......................................................................................... 18
Economic impacts of the domestic ornamental horticultural sector ............................... 20
Provincial results ........................................................................................................... 23
Gross Domestic Product (GDP) impacts and comparison of government supports between ornamentals and food crops ...................................................................... 24
The ornamental horticulture sector’s economic impact is increasing ............................. 25
Conclusions ................................................................................................................... 26
3. Key trends impacting the sector ............................................................................................ 27
Summary ....................................................................................................................... 27
Aging baby boomers ...................................................................................................... 29
Recommendations ....................................................................................................... 30
Continued downward trend in housing starts and resales ............................................. 31
Recommendations ....................................................................................................... 34
Strong demand for innovation ....................................................................................... 35
Recommendations ....................................................................................................... 37
Concern for the environment ......................................................................................... 38
Recommendations ....................................................................................................... 41
Key consumer perceptions and preferences .................................................................. 42
Recommendations ....................................................................................................... 44
4. Sector channel assessment................................................................................................... 47

© Deloitte & Touche LLP and affiliated entities. Canadian Ornamental Horticulture Alliance iv
Summary ....................................................................................................................... 47
Notice to reader ........................................................................................................... 47
Channels of distribution ................................................................................................ 48
Gaining a better understanding of channel stakeholder perspectives ............................ 53
Comparing producer performance to channel stakeholder expectations ........................ 58
Top growth opportunities for producers, as identified by channel stakeholders ............ 60
Recommended options for COHA to consider ................................................................. 61
5. Competitive impacts of key cost drivers ................................................................................. 65
Summary ....................................................................................................................... 65
Ornamental profitability ................................................................................................ 66
Key cost drivers explored .............................................................................................. 69
Labour ........................................................................................................................... 69
Foreign exchange .......................................................................................................... 71
Input costs .................................................................................................................... 73
Utility expenses ............................................................................................................. 77
Net interest expense ..................................................................................................... 79
Net fuel expenses .......................................................................................................... 80
Addendum: water expense ............................................................................................ 81
6. Sector use of water ............................................................................................................. 82
Summary ....................................................................................................................... 82
Utilization of water ........................................................................................................ 83
Comparing water usage: ornamental horticulture vs. other industries .......................... 85
7. Policy Strategy .................................................................................................................... 98
Regulatory framework ................................................................................................... 98
Overview of government relations .............................................................................. 102
Implementing the policy strategy: recommendations and rationale ............................ 110
Appendix A: Sub-sector output details ..................................................................................... 115
Appendix B: Farm gate gross receipts statistics ........................................................................ 117
Appendix C: Canadian retail outlets ......................................................................................... 124
Appendix D: Cost driver statistics ........................................................................................... 127

© Deloitte & Touche LLP and affiliated entities. Canadian Ornamental Horticulture Alliance v
Glossary of select terms
Canadian Ornamental Horticulture Sector: the Canadian Ornamental Horticulture Sector is defined as representing the following production sub-sectors or sub-segments: floriculture (potted plants (foliage plants and potted flowering plants), bedding and spring plants, cut flowers, cuttings, tree seedlings and other propagating material); nursery; sod and Christmas trees.
Cost of goods sold (COGS): direct costs attributable to the production of the goods sold by a business or producer. This amount includes the cost of the materials used in creating the good (i.e. seeds, starter plants, fertilizer, etc.) along with the direct labour costs used to produce the good. COGS exclude indirect expenses such as distribution costs and costs associated with sales, marketing and promotion.
Food crop production: crop production (excluding floriculture greenhouse, nursery, sod, Christmas tree production).
Gross margin: a business’ total sales revenue (e.g. farm gate gross receipts, sales from non-crop products like rental income, etc.) minus its cost of goods sold. It is often expressed as a percentage by dividing the gross margin by a company’s total sales revenue. Gross margin is different from operating margin.
Net operating income: a business’ profit from their ordinary business activities, before any taxable deductions.

© Deloitte & Touche LLP and affiliated entities. Canadian Ornamental Horticulture Alliance 1
Executive summary
The following sections below present a high-level executive summary of key findings detailed in the comprehensive report attached.
The Canadian ornamental horticulture sector of production agriculture has been, and continues to be, a significant core part of Canadian agriculture by several different measures, including: farm gate cash receipts, recent growth trends, impacts to the downstream value chain, employment and exports.
Sector profile and economic significance
• Consumers spent nearly $6.3 billion at the retail level on ornamental horticultural products and another $1.8 billion on landscaping services in 2007, with the average Canadian household spending $650 on the sector’s products and services
• Ornamental horticulture represents the largest horticulture sub-segment, representing over 40 percent of horticulture’s $5.4 billion in farm gate receipts. In 2007, gross farm gate receipts for the ornamental sector amounted to $2.3 billion with a compound annual growth rate (CAGR) of 1.7 percent (2002-2007)
• Floriculture is the largest sub-segment in the ornamental sector, representing nearly 65 percent of total sales, followed by the nursery, sod and Christmas tree segments. The sod and nursery sub-sectors reported the highest annual growth rates in the ornamental sector with 7.9 and 4.6 percent (CAGR) respectively
• Nearly 90 percent of ornamental gross farm gate receipts are distributed amongst three Canadian provinces: Ontario (50 percent); British Columbia (24 percent) and Québec (14 percent)
• Québec and BC experienced the highest growth rates over the last five years (2002-2007) at 2.9 and 2.5 percent respectively − Ontario followed with an annual growth of 1.3 percent (CAGR)
• In general, the 2006 Census of Agriculture reveals that the urban market holds potential for the ornamental sector – 24.4 percent of all gross farm receipts were generated by farms that are located in Census Metropolitan Areas (CMA), compared to 7.5 percent on a national level1. This proximity of production to major urban centres shortens the shipping distances, providing a competitive advantage when it comes to logistics and potential to be recognized as local product by those consumers for which that attribute is important in their buying decision.
• The ornamental production, horticultural services, horticultural equipment manufacturing, and trade and distribution sectors are a stimulus to the entire Canadian economy
• Based on multipliers generated from Statistics Canada Input-Output (“I/O”) tables, total economic contribution of the ornamental horticultural sector to Canada is:
o $14.48 billion, comprised of
� $6.98 billion in output
� $7.5 billion in value added impacts,
• Direct sector employment is 110,750 full-time equivalent positions. Together with indirect employment generated by the sector, the total direct and indirect full-time equivalent employment is 132,776 jobs. With the number of people employed in the sector on a seasonal basis, the actual number of workers is much higher. In addition, the sector induces a significant number of additional jobs through household spending by employees in the sector. It is estimated that for every two jobs in the sector, another job is generated in the economy
1 Source: Statistics Canada, The Daily, Wednesday, May 16th, 2006 Census of Agriculture: Farm operations and operators http://www.statcan.ca/Daily/English/070516/d070516a.htm
© Deloitte & Touche LLP and affiliated entities. Canadian Ornamental Horticulture Alliance 2
• The sector generates $3.8 billion in employment income and another $850 million in end-user taxes generated (PST and GST). Ornamentals are the only sector of agriculture that attracts GST at the first point of transfer in the value chain, from the producer to the wholesaler, retailer or final consumer. All other agriculture is zero-rated for GST purposes at the point at which the farmer sells to the next stage in the value chain.
Key trends impacting the sector
• Based upon the trends identified, there are three market growth strategies that COHA could employ to grow profitable sales: market penetration, product development and market development. Due to the sector’s current brand gap, a diversification strategy (which heavily leverages a strong brand) is not recommended.
• There are a number of macro trends occurring today which position ornamental horticulture in a positive light and demonstrate opportunities for profitable growth. Some of the leading trends include: aging baby boomer cohort which is estimated to spend between $7.8 billion and $14.4 billion annually on garden and garden-related activities during retirement; the plausible return of ‘cocooning’ due to continued interest in renovations and a poor economic outlook; and the rising concern for the environment which encompasses regulatory changes, Gen-Y influences and attitudinal changes towards ‘green’.
• Use of ornamental horticulture presents consumers with a number of natural advantages which address some very relevant challenges of the 21ST century (i.e. pollution, the Urban Heat Island Effect, rising heating and cooling costs, etc.). Moreover, well-considered investments in ornamentals have also demonstrated financial benefits to homeowners vis-à-vis appreciating resale values. Firms within the sector need to improve upon how they communicate these benefits to consumers, to fully exploit this advantage - especially at consumer key purchase decision points.
• A number of good insights are drawn as to consumer perceptions and preferences (i.e. appearance and ease of maintenance are leading purchase drivers; unlike pricing, fragrance and origin) and concluded with what that means to the sector.
• There is a significant opportunity for the sector to invest further in innovation that is not strictly limited to the development of actual ornamentals. Packaging, customization and personalization innovations are also in demand. Bottom line: innovation is a requirement demanded by consumers and a gap recognized by channel stakeholders.
Sector channel assessment
• There are four main channels of distribution used by the sector today: retail, wholesale and resale, direct and other. The retail channel is the sector’s most significant channel today (40 percent), followed by the wholesale and resale channel (37 percent). Direct sales and other sales follow at 13 percent and 10 percent, respectively.
• Sector exports, which include re-exports2, have declined significantly (approximately $135 million or 28 percent) since 2003 to a current total of $340 million (2007).
Floriculture exports represent about 10 percent of their overall farm gate gross receipts. As the Canadian dollar has appreciated in value vis-à-vis the US dollar over the past three years, floriculture exports have declined each year.
• Nursery and garden centre outlets are on the rise and their growth has outpaced that of key mass merchant, big box and large format retailers. Today, it is estimated that there are over 9,000 retail outlets (including florists), across Canada that carry ornamental products.
2 Re-exports refer to goods that are first imported and then subsequently exported without any significant value-added enhancements made to them.
© Deloitte & Touche LLP and affiliated entities. Canadian Ornamental Horticulture Alliance 3
• A number of producer challenges are identified and discussed in this report; including some support to illustrate that regional producers are being adversely impacted by centralized buying practices.
• Perspectives of several channel stakeholders are also examined along a number of key considerations or “value drivers”. A number of gaps are identified and prioritized with key insights drawn.
• Finally, a series of leading growth opportunities were identified through discussions with a number of channel stakeholders from across Canada and are outlined in this report. The report then concludes with a number of recommended options for COHA to consider, including: further emphasis as to the sector’s need for innovation; why national standards are worth exploring further, improving account management to generate profitable sales and an opportunity for producers to work with buyers to improve their margins through enhancing their “value proposition” in ways unrelated to pricing.
Competitive impacts of key cost drivers
• Ontario, followed closely by British Columbia, is host to the largest ornamental horticulture producers in Canada. In 2006, the average total operating revenue for a farm within these two provinces was $1.4 million and $1.1 million, respectively. The Prairie region, Quebec and the Atlantic region followed with their average producers generating $0.6 million, $0.5 million and $0.3 million in sales (i.e. predominantly farm gate gross receipts; however can include miscellaneous sales from other categories), accordingly.
• In terms of profitability, between 2002 and 2006 the average net operating margin for a Canadian ornamental producer was 9.5 percent. On a regional basis, the Prairie region led with an average net operating margin of 11.9 percent, followed closely by Quebec (10.7 percent). BC and Ontario averaged 9.1 percent and nine percent, respectively, while the Atlantic region attained the lowest profitability score of 7.1 percent.
• 2007 was a volatile year that saw many input costs skyrocket which had a dramatic effect on ornamental businesses. To complicate matters, the strong majority of producers surveyed indicate that they are having difficulty transferring these increases onto buyers. Profitability is suffering as a result.
• It is cautiously estimated (please see report for details on estimating methodology) that profitability will decrease by four percent for the average Canadian ornamental farmer in 2007. Statistics Canada’s 2007 ornamental profitability and expenditure figures are yet to be released in order to validate these estimates.
• Key cost drivers which have the greatest potential impact to producer profitability are examined and discussed in this report. These include labour, foreign exchange, inputs (seeds and plants, utility expenses, fertilizer and lime expenses and pesticide expense), interest and energy (utilities and fuel).
Water utilization
• It is estimated that the Canadian ornamental horticulture sector’s annual water usage is nearly 187 million m3 with the vast majority of water used being attributable to nursery operations (96.3 percent). Annual water usage for greenhouse and sod operations is estimated to be 6.6 million m3 (3.5 percent) and 0.4 million m3 (0.2 percent), respectively. On average, nursery production uses 8,361 m3/ha/year (in outdoor growing conditions); floriculture greenhouse production uses much less water at 657 m3/ha/year.
• The sector’s water intake represents about 3.9 percent of the total water intake in Canadian agriculture. Put differently, for every cubic metre of water intake the Canadian ornamental horticulture sector generates $21.94 in farm gate receipts. Comparatively, the broader
© Deloitte & Touche LLP and affiliated entities. Canadian Ornamental Horticulture Alliance 4
agriculture industry is not as efficient, generating $3.73 less ($18.20/m3 of water intake) for every cubic metre of water intake3.
• It is estimated that approximately 15 percent of water used in greenhouses is attributable to the ornamental sector.
• A survey of 60 producers found that for floriculture greenhouse operations, 44.8 percent of growers paid for their water usage. The average cost for these operators was $1.04/m3 and ranged from $0.51/m3 to $2.50/m3. Only 6.9 percent of the growers paid a water access fee – all of whom were located in Ontario. None of the surveyed growers paid any water trucking fee.
• As for nursery operations, 26.7 percent of nursery growers paid for their water, 6.7 percent paid for trucking (all in Ontario) and 23.3 percent paid a water access fee (all in BC, ON and Quebec). The water access fee ranged from $120 to $4,000 per nursery per year. Since the data collected on water cost varied greatly it is not possible to calculate a reliable average cost. Surveyed growers were not able to provide the amount of trucking fees paid.
• The majority of nursery and floriculture greenhouse growers surveyed are not recycling their water and lack knowledge regarding water treatment technologies. Moreover, most do not use water treatment technologies and lack sufficient knowledge about the technologies available.
• The University of Guelph offers a number of recommendations to improve water utilization within the ornamental sector, including that:
o the federal and provincial governments should invest more heavily in research and development activities related to water conservation and treatment technologies;
o government extension agents or specialists should work closely with universities and other research institutes to conduct research and demonstration projects in water conservation and treatment technologies;
o additional research in the nursery sub-sector be conducted to assess water management protocols, recycling protocols and distribution systems.
• An inventory and summary overview of commonly used irrigation water treatment technologies was conducted by the University of Guelph and is contained in the report.
Policy strategy
• Canada’s ornamental horticulture sector has a major economic impact in Canada and significant potential to develop and expand; as such the sector should be a target for growth by government at all levels
• Innovation is fundamental to the future of the sector, and steering a greater proportion of agricultural industry research funding toward ornamental horticulture should be among COHA’s and both the Federal and Provincial level government’s top priorities
• There is a vast range of regulations impacting the ornamental horticultural sector, including
• Trade agreements, trade barriers & import restrictions
• Patents, royalties & copyrights
• Environmental protection
• Pesticide and other chemical regulations
• Labour code, including farm labour unionization; etc.
3 According to Statistics Canada, the domestic agriculture industry generated $40.5 billion in farm gate sales for 2007; it took in 4,098 million m3 of water. The
ornamental horticulture sector earned $2.2 billion in farm gate sales that same year and took in 187 million m3 of water. The ratios stated above are calculated by
dividing farm gate sales into water intake.

© Deloitte & Touche LLP and affiliated entities. Canadian Ornamental Horticulture Alliance 5
• Producer survey results indicate that the sector faces high compliance costs, and that a mismatch in the fabric of regulatory enforcement, particularly in connection with quarantine or the elimination of trade tariffs can have a catastrophic consequence for a producer
• Results of interviews with Federal and Provincial government contacts indicate that:
• COHA’s ability to shape and influence public policy is underdeveloped relative to the economic size and activity of its constituent members; and
• COHA’s desired public policy participation and influence level exceeds its current level of political currency
• Because the sector has no marketing boards, quota systems, or quality/grading standards to protect Canada’s producers against highly competitive U.S., South American, or international growers, strong industry association representation and cohesive messaging at both the Federal and Provincial levels is needed to represent the interests of Canadian producers
© Deloitte & Touche LLP and affiliated entities. Canadian Ornamental Horticulture Alliance 6
1. Profile of the Canadian Ornamental Horticultural
Sector
Summary
• Consumers spent nearly $6.3 billion at the retail level on ornamental horticultural products and another $1.8 billion on landscaping services in 2007, with the average Canadian household spending $650 on the sector’s products and services.
• Ornamental horticulture represents the largest horticulture sub-segment, representing over 40 percent of horticulture’s $5.4 billion in gross farm gate receipts. In 2007, gross farm gate receipts for the ornamental sector amounted to $2.3 billion with a compound annual growth rate (CAGR) of 1.7 percent (2002-2007).
• Floriculture is the largest sub-segment in the ornamental sector, representing nearly 65 percent of total sales, followed by the nursery, sod and Christmas tree segments. The sod and nursery sub-sectors reported the highest annual growth rates in the ornamental sector with 7.9 and 4.6 percent (CAGR) respectively.
• Nearly 90 percent of ornamental gross farm gate receipts are distributed amongst three Canadian provinces: Ontario (50 percent); British Columbia (24 percent) and Québec (14 percent).
• Québec and BC experienced the highest growth rates over the last five years (2002-2007) at 2.9 and 2.5 percent respectively − Ontario followed with an annual growth of 1.3 percent (CAGR).
• Imports (unlike domestic exports) of ornamental products are on the rise, growing by nearly six percent over the past five years to a total of $180 million in 2007.
• In general, the 2006 Census of Agriculture reveals that the urban market holds potential for the ornamental sector – 24.4 percent of all gross farm receipts were generated by farms that are located in Census Metropolitan Areas (CMA), compared to 7.5 percent on a national level4. This proximity of production to major urban centres shortens the shipping distances, providing a competitive advantage when it comes to logistics and potential to be recognized as local product by those consumers for which that attribute is important in their buying decision.
Sector structure - historical development and current situation5
The Canadian horticulture sector is a diverse sector, ranging from the production of edible products such as fruits and vegetables to the ornamental sector, which includes floriculture, nursery and landscaping, sod and Christmas trees. According to Agriculture and Agri-Food Canada, in 2006 the value of farm cash receipts for horticulture was $5.4 billion6, with ornamental horticulture being the largest sub-segment, representing 41.8 percent. In 2007, farm cash receipts for the ornamental sector amounted to $2.3 billion with a compound annual growth rate (CAGR) of 1.7 percent (2002-2007)7.
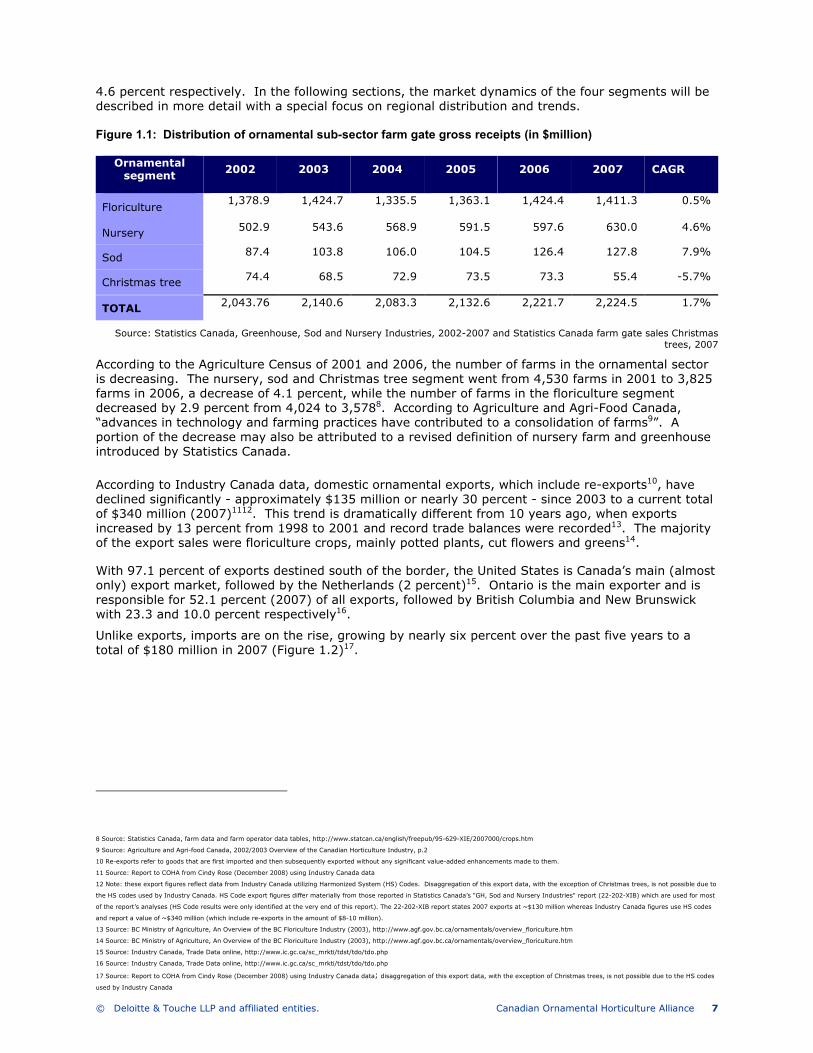
As illustrated in Figure 1.1, with $1.4 billion in farm cash receipts, the floriculture segment is the largest sub-sector in the ornamental sector, representing nearly 65 percent of all ornamental farm cash receipts, followed by the nursery sub-segment, and sod and Christmas trees. The sod and nursery sub-sectors reported the highest growth rates (CAGR) in the ornamental sector with 7.9 and
4 Source: Statistics Canada, The Daily, Wednesday, May 16th, 2006 Census of Agriculture: Farm operations and operators http://www.statcan.ca/Daily/English/070516/d070516a.htm
5 Please see the Notice to Reader found at the beginning of Section 4’s “Industry Channels Assessment”
6 Source: Agriculture and Agri-food Canada: http://www4.agr.gc.ca/AAFC-AAC/display-afficher.do?id=1184693741065&lang=e
7 Source: Statistics Canada, Greenhouse, Sod and Nursery Industries, 2002-2007 and Statistics Canada farm gate sales Christmas trees
© Deloitte & Touche LLP and affiliated entities. Canadian Ornamental Horticulture Alliance 7
4.6 percent respectively. In the following sections, the market dynamics of the four segments will be described in more detail with a special focus on regional distribution and trends. Figure 1.1: Distribution of ornamental sub-sector farm gate gross receipts (in $million)
Ornamental segment
2002 2003 2004 2005 2006 2007 CAGR
Floriculture 1,378.9 1,424.7 1,335.5 1,363.1 1,424.4 1,411.3 0.5%
Nursery 502.9 543.6 568.9 591.5 597.6 630.0 4.6%
Sod 87.4 103.8 106.0 104.5 126.4 127.8 7.9%
Christmas tree 74.4 68.5 72.9 73.5 73.3 55.4 -5.7%
TOTAL 2,043.76 2,140.6 2,083.3 2,132.6 2,221.7 2,224.5 1.7%
Source: Statistics Canada, Greenhouse, Sod and Nursery Industries, 2002-2007 and Statistics Canada farm gate sales Christmas trees, 2007
According to the Agriculture Census of 2001 and 2006, the number of farms in the ornamental sector is decreasing. The nursery, sod and Christmas tree segment went from 4,530 farms in 2001 to 3,825 farms in 2006, a decrease of 4.1 percent, while the number of farms in the floriculture segment decreased by 2.9 percent from 4,024 to 3,5788. According to Agriculture and Agri-Food Canada, “advances in technology and farming practices have contributed to a consolidation of farms9”. A portion of the decrease may also be attributed to a revised definition of nursery farm and greenhouse introduced by Statistics Canada.
According to Industry Canada data, domestic ornamental exports, which include re-exports10, have declined significantly - approximately $135 million or nearly 30 percent - since 2003 to a current total of $340 million (2007)1112. This trend is dramatically different from 10 years ago, when exports increased by 13 percent from 1998 to 2001 and record trade balances were recorded13. The majority of the export sales were floriculture crops, mainly potted plants, cut flowers and greens14.
With 97.1 percent of exports destined south of the border, the United States is Canada’s main (almost only) export market, followed by the Netherlands (2 percent)15. Ontario is the main exporter and is responsible for 52.1 percent (2007) of all exports, followed by British Columbia and New Brunswick with 23.3 and 10.0 percent respectively16.
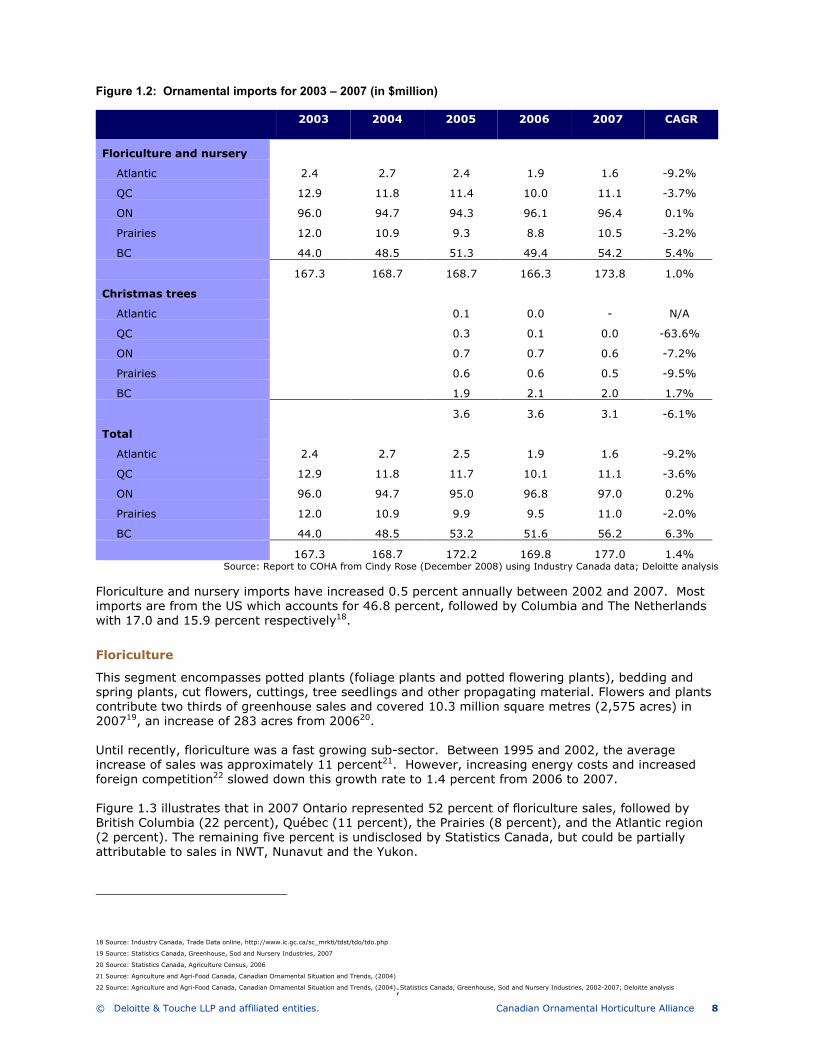
Unlike exports, imports are on the rise, growing by nearly six percent over the past five years to a total of $180 million in 2007 (Figure 1.2)17.
8 Source: Statistics Canada, farm data and farm operator data tables, http://www.statcan.ca/english/freepub/95-629-XIE/2007000/crops.htm
9 Source: Agriculture and Agri-food Canada, 2002/2003 Overview of the Canadian Horticulture Industry, p.2
10 Re-exports refer to goods that are first imported and then subsequently exported without any significant value-added enhancements made to them.
11 Source: Report to COHA from Cindy Rose (December 2008) using Industry Canada data
12 Note: these export figures reflect data from Industry Canada utilizing Harmonized System (HS) Codes. Disaggregation of this export data, with the exception of Christmas trees, is not possible due to
the HS codes used by Industry Canada. HS Code export figures differ materially from those reported in Statistics Canada’s "GH, Sod and Nursery Industries" report (22-202-XIB) which are used for most
of the report’s analyses (HS Code results were only identified at the very end of this report). The 22-202-XIB report states 2007 exports at ~$130 million whereas Industry Canada figures use HS codes
and report a value of ~$340 million (which include re-exports in the amount of $8-10 million).
13 Source: BC Ministry of Agriculture, An Overview of the BC Floriculture Industry (2003), http://www.agf.gov.bc.ca/ornamentals/overview_floriculture.htm
14 Source: BC Ministry of Agriculture, An Overview of the BC Floriculture Industry (2003), http://www.agf.gov.bc.ca/ornamentals/overview_floriculture.htm
15 Source: Industry Canada, Trade Data online, http://www.ic.gc.ca/sc_mrkti/tdst/tdo/tdo.php
16 Source: Industry Canada, Trade Data online, http://www.ic.gc.ca/sc_mrkti/tdst/tdo/tdo.php
17 Source: Report to COHA from Cindy Rose (December 2008) using Industry Canada data; disaggregation of this export data, with the exception of Christmas trees, is not possible due to the HS codes
used by Industry Canada
© Deloitte & Touche LLP and affiliated entities. Canadian Ornamental Horticulture Alliance 8
Figure 1.2: Ornamental imports for 2003 – 2007 (in $million)
2003 2004 2005 2006 2007 CAGR
Floriculture and nursery
Atlantic 2.4 2.7 2.4 1.9 1.6 -9.2%
QC 12.9 11.8 11.4 10.0 11.1 -3.7%
ON 96.0 94.7 94.3 96.1 96.4 0.1%
Prairies 12.0 10.9 9.3 8.8 10.5 -3.2%
BC 44.0 48.5 51.3 49.4 54.2 5.4%
167.3 168.7 168.7 166.3 173.8 1.0%
Christmas trees
Atlantic 0.1 0.0 - N/A
QC 0.3 0.1 0.0 -63.6%
ON 0.7 0.7 0.6 -7.2%
Prairies 0.6 0.6 0.5 -9.5%
BC 1.9 2.1 2.0 1.7%
3.6 3.6 3.1 -6.1%
Total
Atlantic 2.4 2.7 2.5 1.9 1.6 -9.2%
QC 12.9 11.8 11.7 10.1 11.1 -3.6%
ON 96.0 94.7 95.0 96.8 97.0 0.2%
Prairies 12.0 10.9 9.9 9.5 11.0 -2.0%
BC 44.0 48.5 53.2 51.6 56.2 6.3%
167.3 168.7 172.2 169.8 177.0 1.4% Source: Report to COHA from Cindy Rose (December 2008) using Industry Canada data; Deloitte analysis
Floriculture and nursery imports have increased 0.5 percent annually between 2002 and 2007. Most imports are from the US which accounts for 46.8 percent, followed by Columbia and The Netherlands with 17.0 and 15.9 percent respectively18.
Floriculture
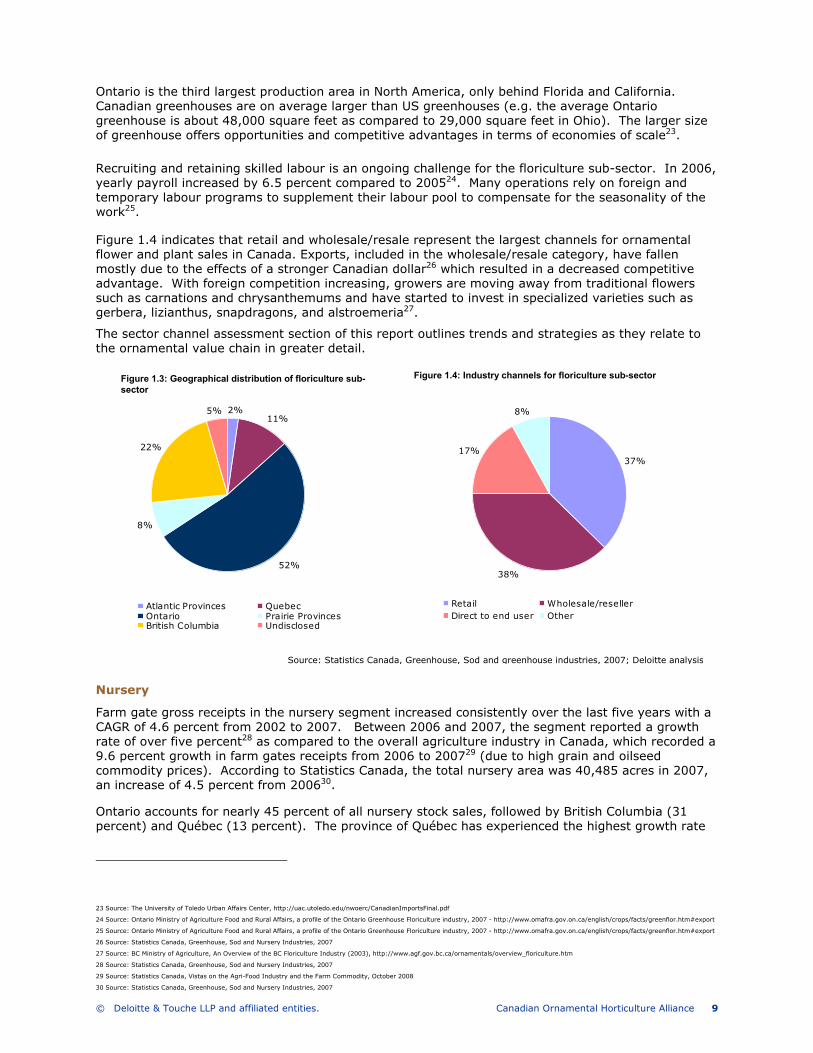
This segment encompasses potted plants (foliage plants and potted flowering plants), bedding and spring plants, cut flowers, cuttings, tree seedlings and other propagating material. Flowers and plants contribute two thirds of greenhouse sales and covered 10.3 million square metres (2,575 acres) in 200719, an increase of 283 acres from 200620. Until recently, floriculture was a fast growing sub-sector. Between 1995 and 2002, the average increase of sales was approximately 11 percent21. However, increasing energy costs and increased foreign competition22 slowed down this growth rate to 1.4 percent from 2006 to 2007. Figure 1.3 illustrates that in 2007 Ontario represented 52 percent of floriculture sales, followed by British Columbia (22 percent), Québec (11 percent), the Prairies (8 percent), and the Atlantic region (2 percent). The remaining five percent is undisclosed by Statistics Canada, but could be partially attributable to sales in NWT, Nunavut and the Yukon.
18 Source: Industry Canada, Trade Data online, http://www.ic.gc.ca/sc_mrkti/tdst/tdo/tdo.php
19 Source: Statistics Canada, Greenhouse, Sod and Nursery Industries, 2007
20 Source: Statistics Canada, Agriculture Census, 2006
21 Source: Agriculture and Agri-Food Canada, Canadian Ornamental Situation and Trends, (2004)
22 Source: Agriculture and Agri-Food Canada, Canadian Ornamental Situation and Trends, (2004);Statistics Canada, Greenhouse, Sod and Nursery Industries, 2002-2007; Deloitte analysis
© Deloitte & Touche LLP and affiliated entities. Canadian Ornamental Horticulture Alliance 9
Ontario is the third largest production area in North America, only behind Florida and California. Canadian greenhouses are on average larger than US greenhouses (e.g. the average Ontario greenhouse is about 48,000 square feet as compared to 29,000 square feet in Ohio). The larger size of greenhouse offers opportunities and competitive advantages in terms of economies of scale23.
Recruiting and retaining skilled labour is an ongoing challenge for the floriculture sub-sector. In 2006, yearly payroll increased by 6.5 percent compared to 200524. Many operations rely on foreign and temporary labour programs to supplement their labour pool to compensate for the seasonality of the work25.
Figure 1.4 indicates that retail and wholesale/resale represent the largest channels for ornamental flower and plant sales in Canada. Exports, included in the wholesale/resale category, have fallen mostly due to the effects of a stronger Canadian dollar26 which resulted in a decreased competitive advantage. With foreign competition increasing, growers are moving away from traditional flowers such as carnations and chrysanthemums and have started to invest in specialized varieties such as gerbera, lizianthus, snapdragons, and alstroemeria27.
The sector channel assessment section of this report outlines trends and strategies as they relate to the ornamental value chain in greater detail.
Nursery
Farm gate gross receipts in the nursery segment increased consistently over the last five years with a CAGR of 4.6 percent from 2002 to 2007. Between 2006 and 2007, the segment reported a growth rate of over five percent28 as compared to the overall agriculture industry in Canada, which recorded a 9.6 percent growth in farm gates receipts from 2006 to 200729 (due to high grain and oilseed commodity prices). According to Statistics Canada, the total nursery area was 40,485 acres in 2007, an increase of 4.5 percent from 200630.
Ontario accounts for nearly 45 percent of all nursery stock sales, followed by British Columbia (31 percent) and Québec (13 percent). The province of Québec has experienced the highest growth rate
23 Source: The University of Toledo Urban Affairs Center, http://uac.utoledo.edu/nwoerc/CanadianImportsFinal.pdf
24 Source: Ontario Ministry of Agriculture Food and Rural Affairs, a profile of the Ontario Greenhouse Floriculture industry, 2007 - http://www.omafra.gov.on.ca/english/crops/facts/greenflor.htm#export
25 Source: Ontario Ministry of Agriculture Food and Rural Affairs, a profile of the Ontario Greenhouse Floriculture industry, 2007 - http://www.omafra.gov.on.ca/english/crops/facts/greenflor.htm#export
26 Source: Statistics Canada, Greenhouse, Sod and Nursery Industries, 2007
27 Source: BC Ministry of Agriculture, An Overview of the BC Floriculture Industry (2003), http://www.agf.gov.bc.ca/ornamentals/overview_floriculture.htm
28 Source: Statistics Canada, Greenhouse, Sod and Nursery Industries, 2007
29 Source: Statistics Canada, Vistas on the Agri-Food Industry and the Farm Commodity, October 2008
30 Source: Statistics Canada, Greenhouse, Sod and Nursery Industries, 2007
Figure 1.3: Geographical distribution of floriculture sub-sector
Figure 1.4: Industry channels for floriculture sub-sector
2%
11%
52%
8%
22%
5%
Atlantic Provinces QuebecOntario Prairie ProvincesBritish Columbia Undisclosed
37%
38%
17%
8%
Retail Wholesale/resellerDirect to end user Other
Source: Statistics Canada, Greenhouse, Sod and greenhouse industries, 2007; Deloitte analysis

© Deloitte & Touche LLP and affiliated entities. Canadian Ornamental Horticulture Alliance 10
of 11.4 percent (CAGR), followed by British Columbia (4.9 percent CAGR) and the Prairie region at 4.6 percent CAGR.
British Columbia is identified as the second largest producer of nursery sales in Canada. According to a report by the BC Ministry of Agriculture, Food & Fisheries, British Columbia is home to 520 commercial nursery businesses that account for 9,500 acres of land in 2002. Due to favourable climates which result in better rates of growth, as well as the availability of water, the Lower Mainland, Vancouver Island and Okanagan regions are the major production areas in British Columbia.
Together, the nursery and sod sub-segments31 employ 8,480 full time employees – an average increase of 10.5 percent (CAGR) since 2002 and the second highest level in the last 10 years.
As illustrated by Figure 1.6, the retail channel is the largest channel for nursery stock sales, accounting for 48.0 percent of total sales32, followed by wholesaler/reseller with 34 percent.
Sod
Overall, total farm gate gross receipts for the sod sub-segment, increased by 7.9 percent (CAGR 2002-2007), led by the Prairies with 19.2 percent of sales and British Columbia with 13.0 percent.
Sod is grown across Canada, except for northern regions where cold climates and long winters are a challenge for sod production33. As Figure 1.7 illustrates, Ontario represents 42 percent of sod sales, followed by the Prairies and Quebec at 22 percent and 21 percent, respectively. Total area owned and used for growing sod amounted to 58,965 acres in 2007, an increase of 1.0 percent from 2006.
Growth of the sod market is partly dependant upon the housing market. However, other uses include golf courses, parks and playing fields.
31 Note: Statistics Canada does not split up nursery and sod sub-segment information for labour and marketing channel
32 Source: Statistics Canada, Greenhouse, Sod and Nursery Industries, 2007
33 Source: Ontario Ministry of Agriculture and Rural Affairs, Sod Production, http://www.omafra.gov.on.ca/english/crops/facts/info_sodprod.htm
Figure 1.6: Industry channels for nursery sub-sector
Figure 1.5: Geographical distribution of nursery sub-sector
2%13%
44%10%
31%
Atlantic Provinces QuebecOntario Prairie ProvincesBritish Columbia
48%
34%
3%
15%
Retail Wholesale/resellerDirect to end user Other
Source: Statistics Canada, Greenhouse, Sod and greenhouse industries, 2007; Deloitte analysis
Figure 1.7: Geographical distribution of sod sub-segment
7%
21%
42%
22%
8%
Atlantic Provinces QuebecOntario Prairie ProvincesBritish Columbia
Source: Statistics Canada, Greenhouse, Sod and greenhouse
industries, 2007; Deloitte analysis
Figure 1.7: Geographical distribution of sod sub-sector
© Deloitte & Touche LLP and affiliated entities. Canadian Ornamental Horticulture Alliance 11
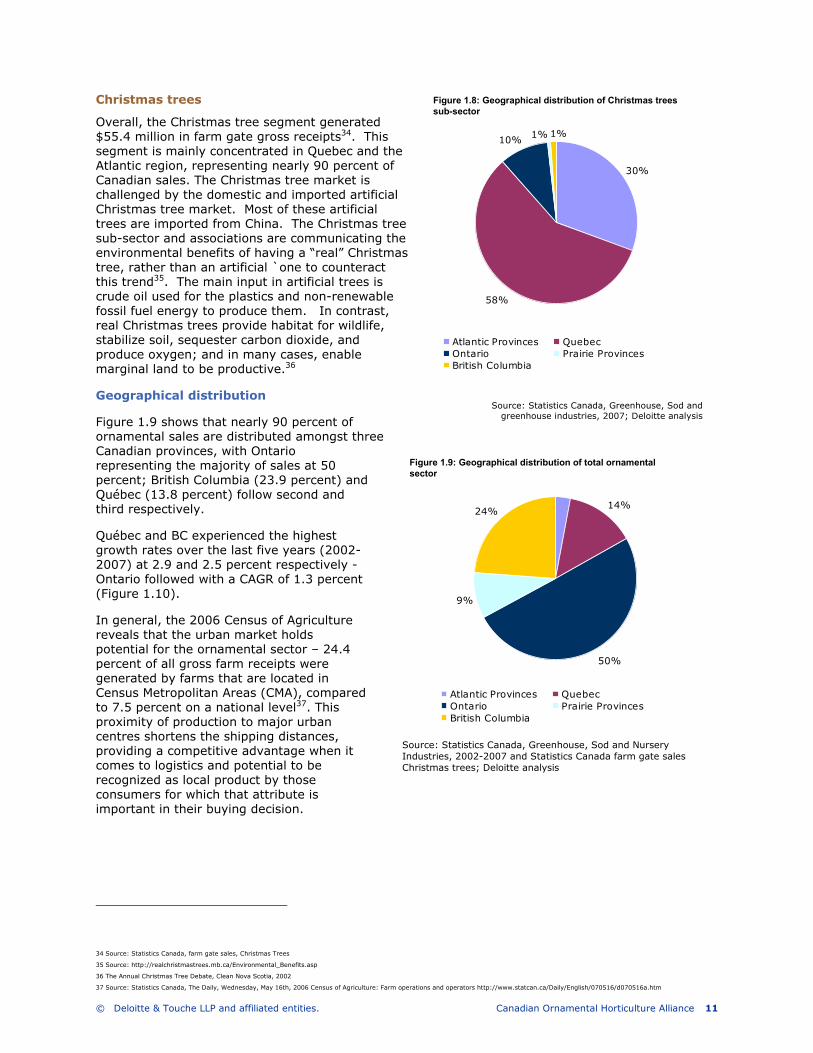
Christmas trees
Overall, the Christmas tree segment generated $55.4 million in farm gate gross receipts34. This segment is mainly concentrated in Quebec and the Atlantic region, representing nearly 90 percent of Canadian sales. The Christmas tree market is challenged by the domestic and imported artificial Christmas tree market. Most of these artificial trees are imported from China. The Christmas tree sub-sector and associations are communicating the environmental benefits of having a “real” Christmas tree, rather than an artificial `one to counteract this trend35. The main input in artificial trees is crude oil used for the plastics and non-renewable fossil fuel energy to produce them. In contrast, real Christmas trees provide habitat for wildlife, stabilize soil, sequester carbon dioxide, and produce oxygen; and in many cases, enable marginal land to be productive.36
Geographical distribution
Figure 1.9 shows that nearly 90 percent of ornamental sales are distributed amongst three Canadian provinces, with Ontario representing the majority of sales at 50 percent; British Columbia (23.9 percent) and Québec (13.8 percent) follow second and third respectively.
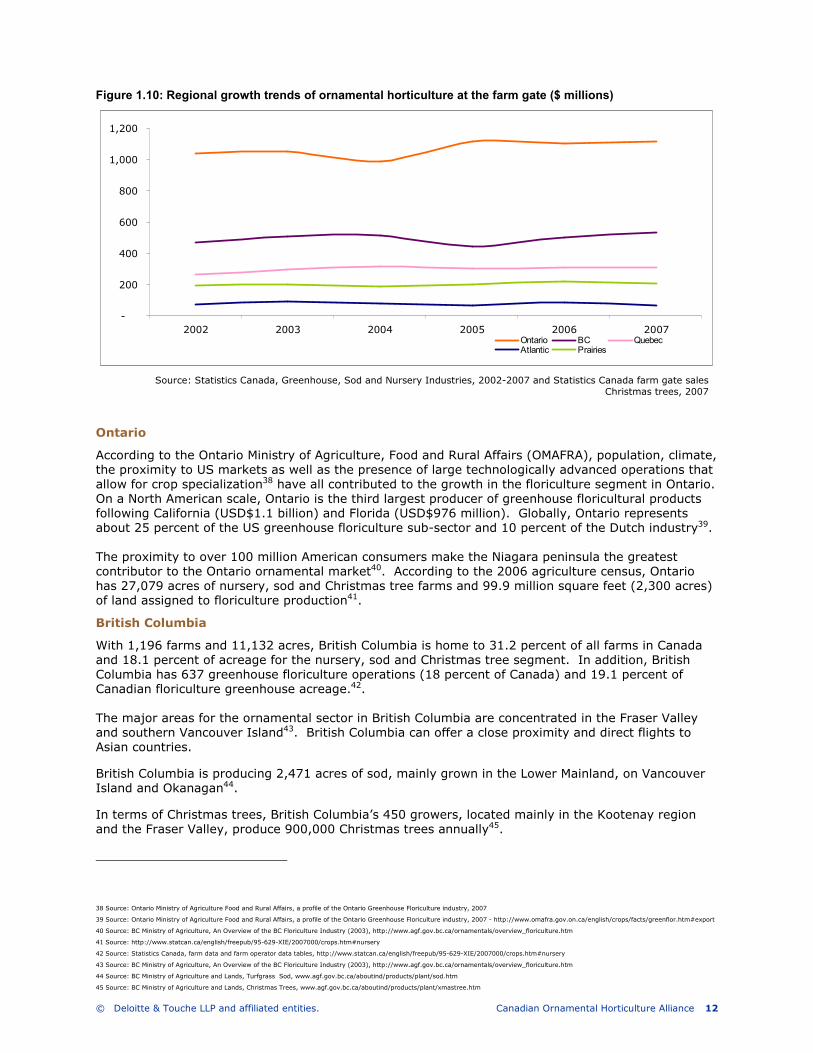
Québec and BC experienced the highest growth rates over the last five years (2002-2007) at 2.9 and 2.5 percent respectively - Ontario followed with a CAGR of 1.3 percent (Figure 1.10).
In general, the 2006 Census of Agriculture reveals that the urban market holds potential for the ornamental sector – 24.4 percent of all gross farm receipts were generated by farms that are located in Census Metropolitan Areas (CMA), compared to 7.5 percent on a national level37. This proximity of production to major urban centres shortens the shipping distances, providing a competitive advantage when it comes to logistics and potential to be recognized as local product by those consumers for which that attribute is important in their buying decision.
34 Source: Statistics Canada, farm gate sales, Christmas Trees
35 Source: http://realchristmastrees.mb.ca/Environmental_Benefits.asp
36 The Annual Christmas Tree Debate, Clean Nova Scotia, 2002
37 Source: Statistics Canada, The Daily, Wednesday, May 16th, 2006 Census of Agriculture: Farm operations and operators http://www.statcan.ca/Daily/English/070516/d070516a.htm
Figure 1.8: Geographical distribution of Christmas trees sub-sector
Source: Statistics Canada, Greenhouse, Sod and greenhouse industries, 2007; Deloitte analysis
30%
58%
10% 1% 1%
Atlantic Provinces QuebecOntario Prairie ProvincesBritish Columbia
Source: Statistics Canada, Greenhouse, Sod and Nursery Industries, 2002-2007 and Statistics Canada farm gate sales Christmas trees; Deloitte analysis
3%
14%
50%
9%
24%
Atlantic Provinces QuebecOntario Prairie ProvincesBritish Columbia
Figure 1.9: Geographical distribution of total ornamental sector
© Deloitte & Touche LLP and affiliated entities. Canadian Ornamental Horticulture Alliance 12
Figure 1.10: Regional growth trends of ornamental horticulture at the farm gate ($ millions)
Ontario
According to the Ontario Ministry of Agriculture, Food and Rural Affairs (OMAFRA), population, climate, the proximity to US markets as well as the presence of large technologically advanced operations that allow for crop specialization38 have all contributed to the growth in the floriculture segment in Ontario. On a North American scale, Ontario is the third largest producer of greenhouse floricultural products following California (USD$1.1 billion) and Florida (USD$976 million). Globally, Ontario represents about 25 percent of the US greenhouse floriculture sub-sector and 10 percent of the Dutch industry39. The proximity to over 100 million American consumers make the Niagara peninsula the greatest contributor to the Ontario ornamental market40. According to the 2006 agriculture census, Ontario has 27,079 acres of nursery, sod and Christmas tree farms and 99.9 million square feet (2,300 acres) of land assigned to floriculture production41.
British Columbia
With 1,196 farms and 11,132 acres, British Columbia is home to 31.2 percent of all farms in Canada and 18.1 percent of acreage for the nursery, sod and Christmas tree segment. In addition, British Columbia has 637 greenhouse floriculture operations (18 percent of Canada) and 19.1 percent of Canadian floriculture greenhouse acreage.42. The major areas for the ornamental sector in British Columbia are concentrated in the Fraser Valley and southern Vancouver Island43. British Columbia can offer a close proximity and direct flights to Asian countries.
British Columbia is producing 2,471 acres of sod, mainly grown in the Lower Mainland, on Vancouver Island and Okanagan44.
In terms of Christmas trees, British Columbia’s 450 growers, located mainly in the Kootenay region and the Fraser Valley, produce 900,000 Christmas trees annually45.
38 Source: Ontario Ministry of Agriculture Food and Rural Affairs, a profile of the Ontario Greenhouse Floriculture industry, 2007
39 Source: Ontario Ministry of Agriculture Food and Rural Affairs, a profile of the Ontario Greenhouse Floriculture industry, 2007 - http://www.omafra.gov.on.ca/english/crops/facts/greenflor.htm#export
40 Source: BC Ministry of Agriculture, An Overview of the BC Floriculture Industry (2003), http://www.agf.gov.bc.ca/ornamentals/overview_floriculture.htm
41 Source: http://www.statcan.ca/english/freepub/95-629-XIE/2007000/crops.htm#nursery
42 Source: Statistics Canada, farm data and farm operator data tables, http://www.statcan.ca/english/freepub/95-629-XIE/2007000/crops.htm#nursery
43 Source: BC Ministry of Agriculture, An Overview of the BC Floriculture Industry (2003), http://www.agf.gov.bc.ca/ornamentals/overview_floriculture.htm
44 Source: BC Ministry of Agriculture and Lands, Turfgrass Sod, www.agf.gov.bc.ca/aboutind/products/plant/sod.htm
45 Source: BC Ministry of Agriculture and Lands, Christmas Trees, www.agf.gov.bc.ca/aboutind/products/plant/xmastree.htm
Source: Statistics Canada, Greenhouse, Sod and Nursery Industries, 2002-2007 and Statistics Canada farm gate sales Christmas trees, 2007
-
200
400
600
800
1,000
1,200
2002 2003 2004 2005 2006 2007Ontario BC QuebecAtlantic Prairies
© Deloitte & Touche LLP and affiliated entities. Canadian Ornamental Horticulture Alliance 13
Québec
In 2007, the Québec market represented nearly 14 percent of all ornamental sales46, third to Ontario and British Columbia. With a growth rate of 2.3 percent, it is the fastest growing region in Canada. This growth is mainly attributed to the growth in the nursery and sod sub-sectors at 7.4 and 7.2 percent, respectively.
Fifty-four percent of Quebec sales are coming from the floriculture sub-segment, 27.0 percent from nurseries, 10.5 percent from Christmas tree growers and 8.8 percent from sod producers.
Quebec’s Federation Interdisciplinary Ornamental Horticulture Québec (FIHOQ) is the trade organization/association representing the ornamental horticulture sector in Québec. FIHOQ has 12 affiliated associations involving more than 2000 companies throughout the province.
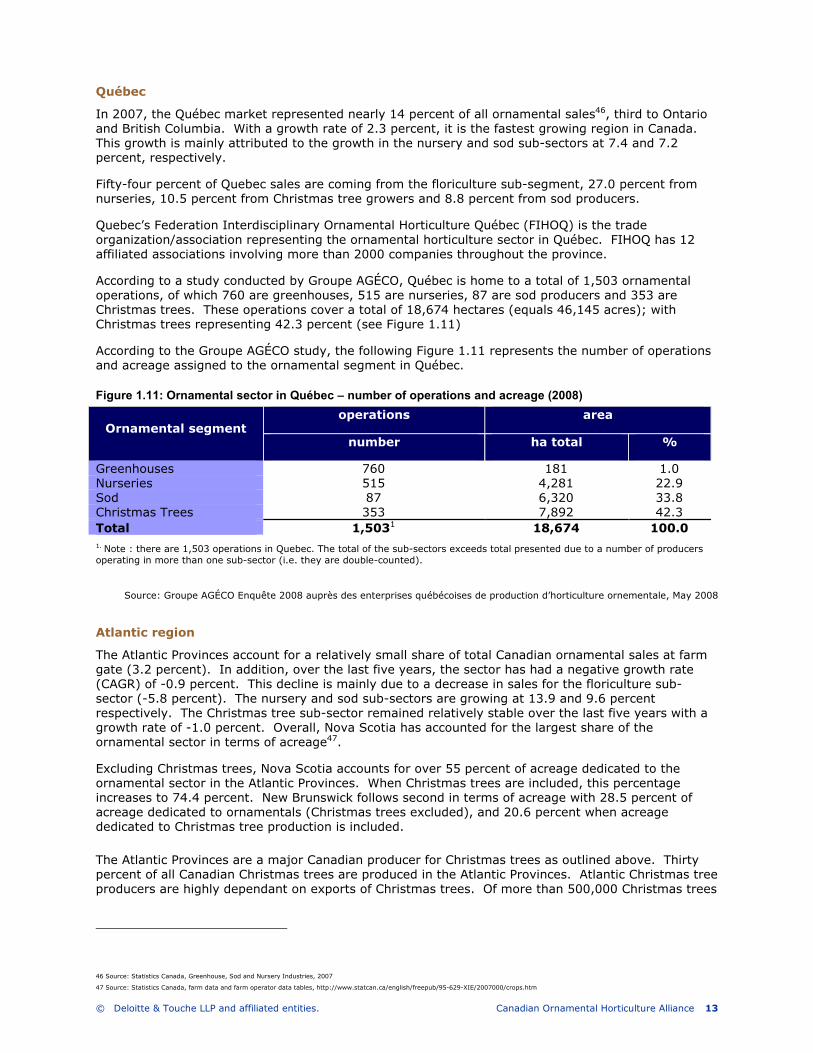
According to a study conducted by Groupe AGÉCO, Québec is home to a total of 1,503 ornamental operations, of which 760 are greenhouses, 515 are nurseries, 87 are sod producers and 353 are Christmas trees. These operations cover a total of 18,674 hectares (equals 46,145 acres); with Christmas trees representing 42.3 percent (see Figure 1.11)
According to the Groupe AGÉCO study, the following Figure 1.11 represents the number of operations and acreage assigned to the ornamental segment in Québec.
Figure 1.11: Ornamental sector in Québec – number of operations and acreage (2008)
Ornamental segment operations area
number ha total %
Greenhouses 760 181 1.0 Nurseries 515 4,281 22.9 Sod 87 6,320 33.8 Christmas Trees 353 7,892 42.3 Total 1,5031 18,674 100.0
1. Note : there are 1,503 operations in Quebec. The total of the sub-sectors exceeds total presented due to a number of producers operating in more than one sub-sector (i.e. they are double-counted).
Source: Groupe AGÉCO Enquête 2008 auprès des enterprises québécoises de production d’horticulture ornementale, May 2008
Atlantic region
The Atlantic Provinces account for a relatively small share of total Canadian ornamental sales at farm gate (3.2 percent). In addition, over the last five years, the sector has had a negative growth rate (CAGR) of -0.9 percent. This decline is mainly due to a decrease in sales for the floriculture sub-sector (-5.8 percent). The nursery and sod sub-sectors are growing at 13.9 and 9.6 percent respectively. The Christmas tree sub-sector remained relatively stable over the last five years with a growth rate of -1.0 percent. Overall, Nova Scotia has accounted for the largest share of the ornamental sector in terms of acreage47.
Excluding Christmas trees, Nova Scotia accounts for over 55 percent of acreage dedicated to the ornamental sector in the Atlantic Provinces. When Christmas trees are included, this percentage increases to 74.4 percent. New Brunswick follows second in terms of acreage with 28.5 percent of acreage dedicated to ornamentals (Christmas trees excluded), and 20.6 percent when acreage dedicated to Christmas tree production is included.
The Atlantic Provinces are a major Canadian producer for Christmas trees as outlined above. Thirty percent of all Canadian Christmas trees are produced in the Atlantic Provinces. Atlantic Christmas tree producers are highly dependant on exports of Christmas trees. Of more than 500,000 Christmas trees
46 Source: Statistics Canada, Greenhouse, Sod and Nursery Industries, 2007
47 Source: Statistics Canada, farm data and farm operator data tables, http://www.statcan.ca/english/freepub/95-629-XIE/2007000/crops.htm

© Deloitte & Touche LLP and affiliated entities. Canadian Ornamental Horticulture Alliance 14
produced every year in New Brunswick, approximately 85 per cent are shipped to the US48. In addition, Nova Scotia exports 80 percent of its Christmas tree production (1.5 to 2.0 million Christmas trees harvested annually)49.
Prairie region
The Prairies account for nearly 10 percent of all ornamental sales50. The region too has experienced modest growth over the last five years, with a 1.1 percent CAGR from 2002 to 2007. In terms of acreage, Alberta represents 67.2 percent of the area dedicated to ornamental production (excluding Christmas trees). Including area dedicated to Christmas trees, the percentage distribution increases to 69.3 percent. Manitoba follows second with 23.8 percent of the acreage (excluding Christmas trees), and 23.1 percent when Christmas trees acreage is included. Saskatchewan ranks third with 9.0 percent of the ornamental acreage (Christmas trees excluded), and 7.6 percent when Christmas tree acreage is included. The Prairies offer a favourable climate for greenhouse production with long sunshine hours in the spring, summer and fall, relatively low humidity and abundant sources of quality water (especially Saskatchewan)51.
48 Source: CBC News, http://www.cbc.ca/consumer/story/2007/11/07/dollar-trees.html, accessed July 23, 2008
49 Source: Christmas Tree Council, Nova Scotia, http://www.ctcns.com/, accessed July 23, 2008
50 Source: Statistics Canada, Greenhouse, Sod and Nursery Industries, 2007
51 Source: Saskatchewan Agrivision Corporation, The Greenhouse Industry, A SAC Inc. State of the Industry Fact Sheet, http://www.agrivision.ca/pdf/factsheets/greenhouse.pdf
© Deloitte & Touche LLP and affiliated entities. Canadian Ornamental Horticulture Alliance 15
2. Economic impact of the Canadian Ornamental
Horticultural Sector
Summary
• Ornamental production, horticultural services, horticultural equipment manufacturing, and trade and distribution sectors are a stimulus to the entire Canadian economy.
• Based on multipliers generated from Statistics Canada Input-Output (“I/O”) tables, total economic contribution of the ornamental horticultural sector to Canada is:
o $14.48 billion, comprised of
� $6.98 billion in output
� $7.5 billion in value added impacts,
• Direct sector employment is 110,750 full-time equivalent positions. Together with indirect employment generated by the sector, the total direct and indirect full-time equivalent employment is 132,776 jobs. With the number of people employed in the sector on a seasonal basis, the actual number of workers is much higher. In addition, the sector induces a significant number of additional jobs through household spending by employees in the sector. It is estimated that for every two jobs in the sector, another job is generated in the economy.
• The sector generates $3.8 billion in employment income and another $850 million in end-user taxes generated (PST and GST). Ornamentals are the only sector of agriculture that attracts GST at the first point of transfer in the value chain, from the producer to the wholesaler, retailer or final consumer. All other agriculture is zero-rated for GST purposes at the point at which the farmer sells to the next stage in the value chain.
Sector structure
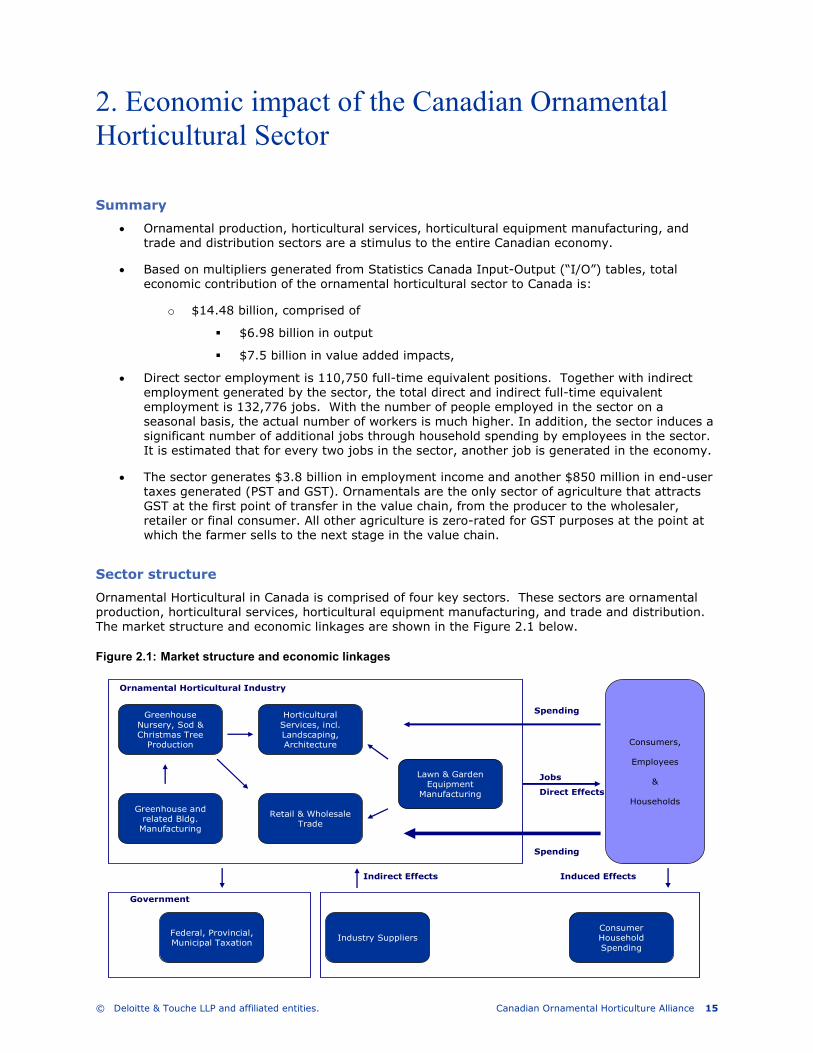
Ornamental Horticultural in Canada is comprised of four key sectors. These sectors are ornamental production, horticultural services, horticultural equipment manufacturing, and trade and distribution. The market structure and economic linkages are shown in the Figure 2.1 below.
Figure 2.1: Market structure and economic linkages
Greenhouse Nursery, Sod & Christmas Tree Production
Greenhouse and related Bldg. Manufacturing
Horticultural Services, incl. Landscaping, Architecture
Retail & Wholesale Trade
Lawn & Garden Equipment
Manufacturing
Consumers,
Employees
&
Households
Federal, Provincial, Municipal Taxation Industry Suppliers
Consumer Household Spending
Spending
Jobs
Direct Effects
Spending
Indirect Effects Induced Effects
Government
Ornamental Horticultural Industry
© Deloitte & Touche LLP and affiliated entities. Canadian Ornamental Horticulture Alliance 16
Ornamental horticultural production, horticultural services, horticultural equipment manufacturing, and the trade and distribution sectors provide the direct output stimulus in the economy. Purchases of inputs such as nutrients, potting and packaging materials, pesticides, energy, etc. create secondary economic activity in other industries, while income earned through employment generated in the ornamental horticultural sector and the secondary industries leads to spending in all sectors of the economy.
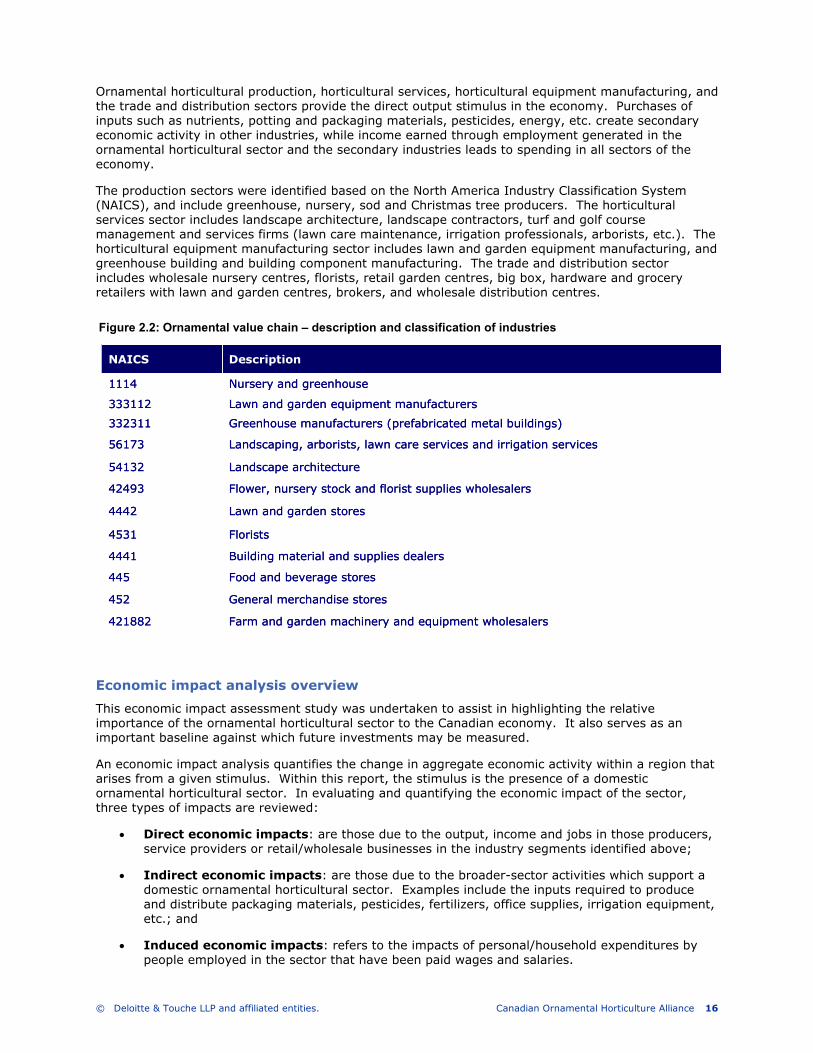
The production sectors were identified based on the North America Industry Classification System (NAICS), and include greenhouse, nursery, sod and Christmas tree producers. The horticultural services sector includes landscape architecture, landscape contractors, turf and golf course management and services firms (lawn care maintenance, irrigation professionals, arborists, etc.). The horticultural equipment manufacturing sector includes lawn and garden equipment manufacturing, and greenhouse building and building component manufacturing. The trade and distribution sector includes wholesale nursery centres, florists, retail garden centres, big box, hardware and grocery retailers with lawn and garden centres, brokers, and wholesale distribution centres.
Economic impact analysis overview
This economic impact assessment study was undertaken to assist in highlighting the relative importance of the ornamental horticultural sector to the Canadian economy. It also serves as an important baseline against which future investments may be measured.
An economic impact analysis quantifies the change in aggregate economic activity within a region that arises from a given stimulus. Within this report, the stimulus is the presence of a domestic ornamental horticultural sector. In evaluating and quantifying the economic impact of the sector, three types of impacts are reviewed:
• Direct economic impacts: are those due to the output, income and jobs in those producers, service providers or retail/wholesale businesses in the industry segments identified above;
• Indirect economic impacts: are those due to the broader-sector activities which support a domestic ornamental horticultural sector. Examples include the inputs required to produce and distribute packaging materials, pesticides, fertilizers, office supplies, irrigation equipment, etc.; and
• Induced economic impacts: refers to the impacts of personal/household expenditures by people employed in the sector that have been paid wages and salaries.
Farm and garden machinery and equipment wholesalers421882
General merchandise stores452
Food and beverage stores445
Building material and supplies dealers4441
Florists4531
Lawn and garden stores4442
Flower, nursery stock and florist supplies wholesalers42493
Landscape architecture54132
Landscaping, arborists, lawn care services and irrigation services 56173
Greenhouse manufacturers (prefabricated metal buildings)332311
Lawn and garden equipment manufacturers333112
Nursery and greenhouse1114
DescriptionNAICS
Figure 2.2: Ornamental value chain – description and classification of industries
© Deloitte & Touche LLP and affiliated entities. Canadian Ornamental Horticulture Alliance 17
Provincial and nation-wide estimates of the economic impact of the ornamental horticultural sector were developed by utilizing the multipliers published in the Statistics Canada Input-Output (“I/O”) tables for direct and indirect economic multipliers, and deriving the induced multipliers from the Statistics Canada make/use and final demand tables.
Economic impacts result from a multiplier effect that begins with expenditures of an enterprise stimulating business-to-business spending, employment, personal income, sales and income tax revenue. Statistics Canada I/O data measure the economic activity that results from expenditures in a specific industrial sector. For example from the Statistics Canada I/O table, multipliers for NAIS code 1114000 (Greenhouse, Nursery and Floriculture Production) for the province of New Brunswick are:
• Direct effect multiplier: 1.0
• Indirect effect multiplier 0.19
As such a $1.00 increase in production revenue results in:
• $1.00 increase in economic output in the greenhouse, nursery and floriculture production sector, and
• $0.19 increase in economic activity, income and employment in other industries with the province
The I/O tables of Canada’s National Accounts capture direct and indirect inter-industry effects (but not the induced impact of spending by people working in these industries). The induced impact is calculated using Statistics Canada provincial-level personal expenditure pattern and provincial-level final demand I/O tables. The induced multiplier calculation depends on the following:
• the salary and wages generated by sector, as determined by primary and secondary research;
• the household expenditure profile within a region, calculated from expenditure patterns by province (Statistics Canada Publication #62-555); and
• the local production coefficients calculated from Statistics Canada Final Demand Input-Output Tables
Induced effects tend to be higher than indirect effects because a portion of spend circulates multiple times. As in the case in calculating the indirect benefits, multipliers are used to identify induced activity. As such, in the case for the Province of New Brunswick, the total economic impact multiplier for the segment “Nursery, Greenhouse, Sod and Christmas Tree production” is 1.527.
Direct = 1.0
Indirect = 0.19
Induced = 0.337
Total = 1.527
© Deloitte & Touche LLP and affiliated entities. Canadian Ornamental Horticulture Alliance 18
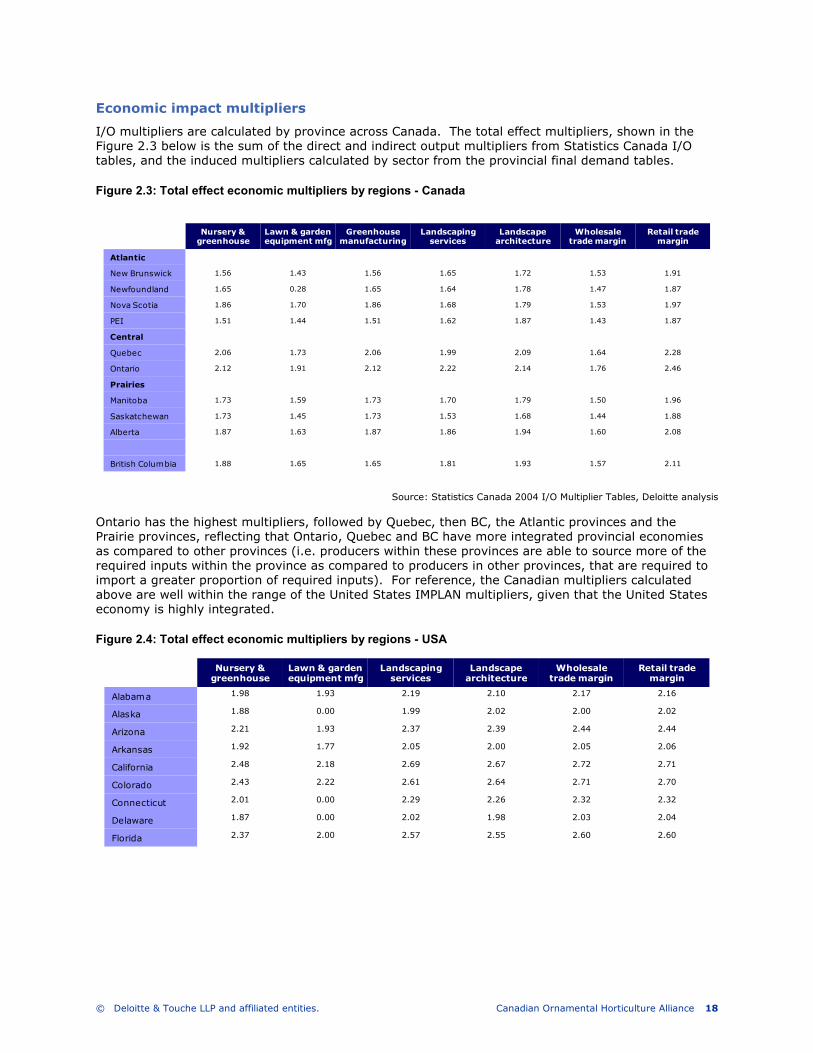
Economic impact multipliers
I/O multipliers are calculated by province across Canada. The total effect multipliers, shown in the Figure 2.3 below is the sum of the direct and indirect output multipliers from Statistics Canada I/O tables, and the induced multipliers calculated by sector from the provincial final demand tables.
Figure 2.3: Total effect economic multipliers by regions - Canada
Nursery & greenhouse
Lawn & garden equipment mfg
Greenhouse manufacturing
Landscaping services
Landscape architecture
Wholesale trade margin
Retail trade margin
Atlantic
New Brunswick 1.56 1.43 1.56 1.65 1.72 1.53 1.91
Newfoundland 1.65 0.28 1.65 1.64 1.78 1.47 1.87
Nova Scotia 1.86 1.70 1.86 1.68 1.79 1.53 1.97
PEI 1.51 1.44 1.51 1.62 1.87 1.43 1.87
Central
Quebec 2.06 1.73 2.06 1.99 2.09 1.64 2.28
Ontario 2.12 1.91 2.12 2.22 2.14 1.76 2.46
Prairies
Manitoba 1.73 1.59 1.73 1.70 1.79 1.50 1.96
Saskatchewan 1.73 1.45 1.73 1.53 1.68 1.44 1.88
Alberta 1.87 1.63 1.87 1.86 1.94 1.60 2.08
British Columbia 1.88 1.65 1.65 1.81 1.93 1.57 2.11
Source: Statistics Canada 2004 I/O Multiplier Tables, Deloitte analysis
Ontario has the highest multipliers, followed by Quebec, then BC, the Atlantic provinces and the Prairie provinces, reflecting that Ontario, Quebec and BC have more integrated provincial economies as compared to other provinces (i.e. producers within these provinces are able to source more of the required inputs within the province as compared to producers in other provinces, that are required to import a greater proportion of required inputs). For reference, the Canadian multipliers calculated above are well within the range of the United States IMPLAN multipliers, given that the United States economy is highly integrated.
Figure 2.4: Total effect economic multipliers by regions - USA
Nursery & greenhouse
Lawn & garden equipment mfg
Landscaping services
Landscape architecture
Wholesale trade margin
Retail trade margin
Alabama 1.98 1.93 2.19 2.10 2.17 2.16
Alaska 1.88 0.00 1.99 2.02 2.00 2.02
Arizona 2.21 1.93 2.37 2.39 2.44 2.44
Arkansas 1.92 1.77 2.05 2.00 2.05 2.06
California 2.48 2.18 2.69 2.67 2.72 2.71
Colorado 2.43 2.22 2.61 2.64 2.71 2.70
Connecticut 2.01 0.00 2.29 2.26 2.32 2.32
Delaware 1.87 0.00 2.02 1.98 2.03 2.04
Florida 2.37 2.00 2.57 2.55 2.60 2.60

© Deloitte & Touche LLP and affiliated entities. Canadian Ornamental Horticulture Alliance 19
Figure 2.4: Total effect economic multipliers by regions – USA (con’t)
Nursery & greenhouse
Lawn & garden equipment mfg
Landscaping services
Landscape architecture
Wholesale trade margin
Retail trade margin
Georgia 2.26 2.16 2.55 2.53 2.58 2.58
Hawaii 2.30 0.00 2.42 2.39 2.39 2.41
Idaho 2.05 0.00 2.19 2.15 2.16 2.18
Illinois 2.39 2.44 2.63 2.64 2.69 2.69
Indiana 2.09 2.10 2.23 2.19 2.26 2.28
Iowa 1.96 1.90 2.12 2.07 2.13 2.12
Kansas 2.12 1.88 2.27 2.22 2.29 2.29
Kentucky 1.92 1.87 2.07 2.02 2.02 2.04
Louisiana 2.06 1.74 2.19 2.18 2.23 2.22
Maine 2.01 1.67 2.13 2.10 2.14 2.12
Maryland 2.39 2.13 2.60 2.63 2.62 2.62
Massachusetts 2.21 2.02 2.42 2.43 2.45 2.45
Michigan 2.14 2.06 2.31 2.27 2.32 2.34
Minnesota 2.32 2.09 2.55 2.55 2.61 2.61
Mississippi 1.91 1.82 2.06 1.99 2.05 2.04
Missouri 2.26 2.18 2.46 2.41 2.50 2.51
Montana 1.89 0.00 2.02 2.04 2.01 2.02
Nebraska 1.98 1.91 2.25 2.24 2.32 2.30
Nevada 2.16 0.00 2.19 2.20 2.19 2.22
New Hampshire 2.15 0.00 2.30 2.25 2.30 2.31
New Jersey 2.00 1.89 2.30 2.26 2.32 2.32
New Mexico 2.08 0.00 2.20 2.19 2.26 2.24
New York 1.98 2.05 2.21 2.24 2.28 2.28
North Carolina 2.10 2.03 2.35 2.27 2.33 2.32
North Dakota 1.77 1.59 1.96 1.93 1.96 1.96
Ohio 2.02 1.86 2.21 2.19 2.16 2.22
Oklahoma 2.28 1.99 2.39 2.30 2.36 2.36
Oregon 2.31 1.93 2.39 2.32 2.32 2.34
Pennsylvania 2.29 2.17 2.48 2.48 2.49 2.51
Rhode Island 1.88 0.00 2.02 1.99 2.00 2.01
South Carolina 1.99 1.87 2.16 2.09 2.13 2.13
South Dakota 1.87 1.80 2.09 2.07 2.13 2.11
Tennessee 2.29 2.09 2.41 2.34 2.39 2.38
Texas 2.49 2.14 2.59 2.53 2.59 2.55
Utah 2.42 2.20 2.60 2.56 2.62 2.62
Vermont 1.99 1.75 2.13 2.11 2.16 2.16
Virginia 2.21 1.93 2.42 2.41 2.46 2.48
Washington 2.16 1.80 2.31 2.25 2.23 2.25
West Virginia 1.92 0.00 1.94 1.88 1.85 1.87
Wisconsin 2.09 2.08 2.25 2.22 2.27 2.28
Wyoming 1.88 0.00 1.94 1.93 1.94 1.94
Source: Economic Impacts of the Green Industry in the United States, June 3, 2005

© Deloitte & Touche LLP and affiliated entities. Canadian Ornamental Horticulture Alliance 20
Economic impacts of the domestic ornamental horticultural sector
Economic impacts for the Ornamental Horticultural sector, are estimated at $14.49 billion, comprised of $6.98 billion in output, 132,776 direct and indirect jobs, $7.5 billion in value added (indirect + induced) impacts, $3.8 billion in employment income generated, and an estimated $820 million in end-user taxes generated through GST and PST on the sector’s $6.3 billion in retail sales for 2007. Through employment in the sector, and in industries that support the sector, a significant amount of additional employment is also induced through household spending by employees.52
Figure 2.5: Economic impact by sector sub-segment, 2007
Source: Deloitte analysis
For the primary production sector, i.e. nursery and greenhouse ornamental horticultural production, estimated direct output impacts in 2007 were $2.22 billion, and direct employment impacts were 22,982 jobs. Value added (indirect + induced) impacts for nursery and greenhouse ornamental horticultural production were $2.27 billion, and indirect employment impacts generated by the sector were 7,559 jobs for a total economic impact of $4.49 billion and employment impact of 30,541 jobs. Induced employment that results from household expenditures, although significant, is not included in this total because it is difficult to reliably estimate.
Figure 2.6: Direct and value-added (indirect and induced) economic impacts by sector ($ billions)
0
1
2
3
4
5
6
Primary Nursery & Greenhouse Horticultural
Production
Horticultural Services Related Equipment Mfg (Greenhouse bldgs, Lawn &
Garden Equipment)
Retail & Wholesale Trade
Direct Value-Added
Source: Deloitte analysis
52 The reader should note that a “job” is one full year of full time employment for one person; i.e. a full time equivalent or FTE. In the industry, one FTE may generate several part-time positions. As
such, the number of people actually employed in the sector may be one and one-half to two times the number of jobs calculated using the Statistics Canada I/O tables.
Industry Group/Sector (NAICS) Output ($Mn) Employment (jobs)
Production and manufacturing
Nursery & greenhouse production (1114) $ 4,491 30,541
Related equipment manufacturing (Greenhouse Bldgs (332311), lawn & garden equipment (333112))
$ 1,351 5,169
Horticultural services
Landscaping architecture (54132), Design and services (56173) $ 3,603 48,332
Wholesale & retail trade
Retail and wholesale lawn and garden products, equipment and plants $ 5,043 48,724
Total all sectors $ 14,489 132,766
© Deloitte & Touche LLP and affiliated entities. Canadian Ornamental Horticulture Alliance 21
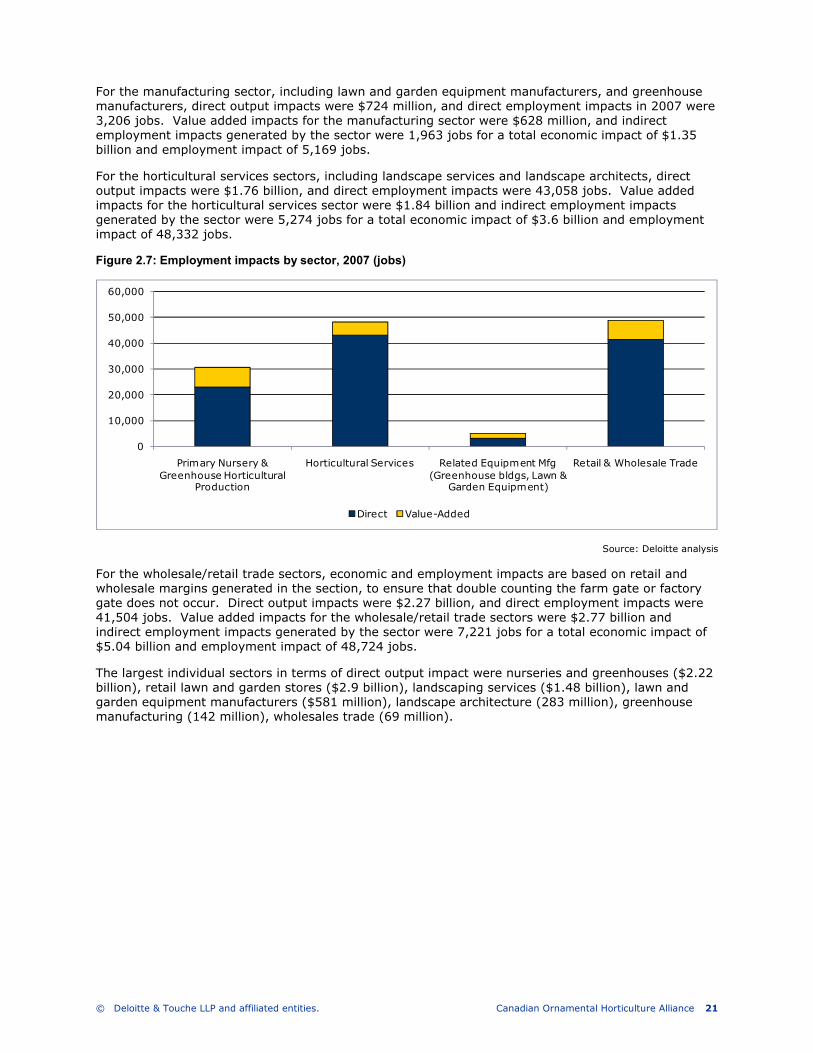
For the manufacturing sector, including lawn and garden equipment manufacturers, and greenhouse manufacturers, direct output impacts were $724 million, and direct employment impacts in 2007 were 3,206 jobs. Value added impacts for the manufacturing sector were $628 million, and indirect employment impacts generated by the sector were 1,963 jobs for a total economic impact of $1.35 billion and employment impact of 5,169 jobs.
For the horticultural services sectors, including landscape services and landscape architects, direct output impacts were $1.76 billion, and direct employment impacts were 43,058 jobs. Value added impacts for the horticultural services sector were $1.84 billion and indirect employment impacts generated by the sector were 5,274 jobs for a total economic impact of $3.6 billion and employment impact of 48,332 jobs.
Figure 2.7: Employment impacts by sector, 2007 (jobs)
0
10,000
20,000
30,000
40,000
50,000
60,000
Primary Nursery & Greenhouse Horticultural
Production
Horticultural Services Related Equipment Mfg (Greenhouse bldgs, Lawn &
Garden Equipment)
Retail & Wholesale Trade
Direct Value-Added
Source: Deloitte analysis
For the wholesale/retail trade sectors, economic and employment impacts are based on retail and wholesale margins generated in the section, to ensure that double counting the farm gate or factory gate does not occur. Direct output impacts were $2.27 billion, and direct employment impacts were 41,504 jobs. Value added impacts for the wholesale/retail trade sectors were $2.77 billion and indirect employment impacts generated by the sector were 7,221 jobs for a total economic impact of $5.04 billion and employment impact of 48,724 jobs.
The largest individual sectors in terms of direct output impact were nurseries and greenhouses ($2.22 billion), retail lawn and garden stores ($2.9 billion), landscaping services ($1.48 billion), lawn and garden equipment manufacturers ($581 million), landscape architecture (283 million), greenhouse manufacturing (142 million), wholesales trade (69 million).
© Deloitte & Touche LLP and affiliated entities. Canadian Ornamental Horticulture Alliance 22
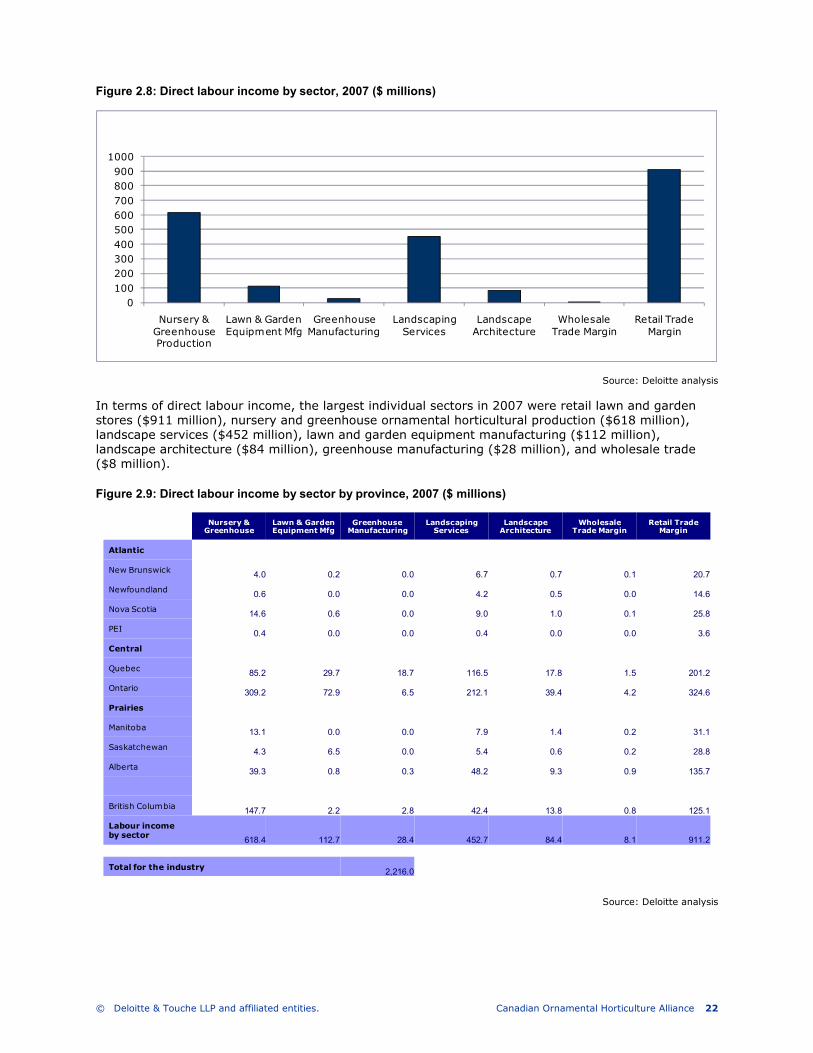
Figure 2.8: Direct labour income by sector, 2007 ($ millions)
0100200300400500600700800900
1000
Nursery & Greenhouse Production
Lawn & Garden Equipment Mfg
Greenhouse Manufacturing
Landscaping Services
Landscape Architecture
Wholesale Trade Margin
Retail Trade Margin
Source: Deloitte analysis
In terms of direct labour income, the largest individual sectors in 2007 were retail lawn and garden stores ($911 million), nursery and greenhouse ornamental horticultural production ($618 million), landscape services ($452 million), lawn and garden equipment manufacturing ($112 million), landscape architecture ($84 million), greenhouse manufacturing ($28 million), and wholesale trade ($8 million).
Figure 2.9: Direct labour income by sector by province, 2007 ($ millions)
Nursery & Greenhouse
Lawn & Garden Equipment Mfg
Greenhouse Manufacturing
Landscaping Services
Landscape Architecture
Wholesale Trade Margin
Retail Trade Margin
Atlantic
New Brunswick4.0 0.2 0.0 6.7 0.7 0.1 20.7
Newfoundland0.6 0.0 0.0 4.2 0.5 0.0 14.6
Nova Scotia14.6 0.6 0.0 9.0 1.0 0.1 25.8
PEI0.4 0.0 0.0 0.4 0.0 0.0 3.6
Central
Quebec85.2 29.7 18.7 116.5 17.8 1.5 201.2
Ontario309.2 72.9 6.5 212.1 39.4 4.2 324.6
Prairies
Manitoba13.1 0.0 0.0 7.9 1.4 0.2 31.1
Saskatchewan4.3 6.5 0.0 5.4 0.6 0.2 28.8
Alberta39.3 0.8 0.3 48.2 9.3 0.9 135.7
British Columbia147.7 2.2 2.8 42.4 13.8 0.8 125.1
Labour income by sector
618.4 112.7 28.4 452.7 84.4 8.1 911.2
Total for the industry2,216.0
Source: Deloitte analysis

© Deloitte & Touche LLP and affiliated entities. Canadian Ornamental Horticulture Alliance 23
Provincial results
Direct output impacts (revenue, and n the case of the retail and wholesale sector, margin) are summarized by province and region for each sector in the figure below. Ontario has the highest sector output, at $3.165 billion, and 45,664 people employed directly in the sector. The total economic impact in the Ontario economy is $6.95 billion, and 73,856 jobs. Québec has the next highest sector output, at $1.493 billion, and 24,759 people employed directly in the sector. The total economic impact in the Québec economy is $3.095 billion and 37,513 jobs.
British Columbia has the third highest output in Canada, at $1.05 billion and 16,282 people employed directly in the sector. The total economic impact in British Columbia is $2.028 billion and 25,065 jobs. The Prairie region, including Alberta, Manitoba and Saskatchewan has the next highest output in Canada, at $965 million, and 16,978 people employed in the sector. The total economic impact within the Prairie Provinces is $1.8 billion and 23,495 jobs. The ornamental horticultural sector is also an important contributor to the Atlantic economy, with $306 million in output and 7,067 employed directly in the sector. The total economic impact in the Atlantic region is $559 million and 9511 jobs.
Figure 2.10: Output impacts by sector by province, 2007 ($ millions)
Nursery & Greenhouse
Lawn & Garden Equipment Mfg
Greenhouse Manufacturing
Landscaping Services
Landscape Architecture
Wholesale Trade Margin
Retail Trade Margin
Atlantic
New Brunswick14.5 0.9 0.0 21.9 2.4 0.7 50.0
Newfoundland2.1 0.0 0.0 13.8 1.6 0.4 35.2
Nova Scotia52.5 3.0 0.0 29.4 3.3 0.9 62.4
PEI1.4 0.0 0.0 1.3 0.0 0.1 8.7
Central
Quebec306.6 153.1 94.1 380.7 59.7 13.2 486.0
Ontario1,112.4 375.7 32.6 693.1 132.1 35.5 784.0
Prairies
Manitoba47.1 0.0 0.0 25.7 4.5 1.7 75.1
Saskatchewan15.5 33.3 0.0 17.6 2.2 2.0 69.6
Alberta141.4 4.0 1.7 157.4 31.3 8.0 327.9
British Columbia531.2 11.1 14.1 138.4 46.2 7.1 302.2
Output by Sector2,224.6 581.1 142.5 1,479.4 283.2 69.5 2,201.0
Industry Direct Economic Impact6,981.4
Industry Value Added Impact (Indirect + Induced)7,507.3
Total Economic Impact 14,488.7
Source: Deloitte analysis
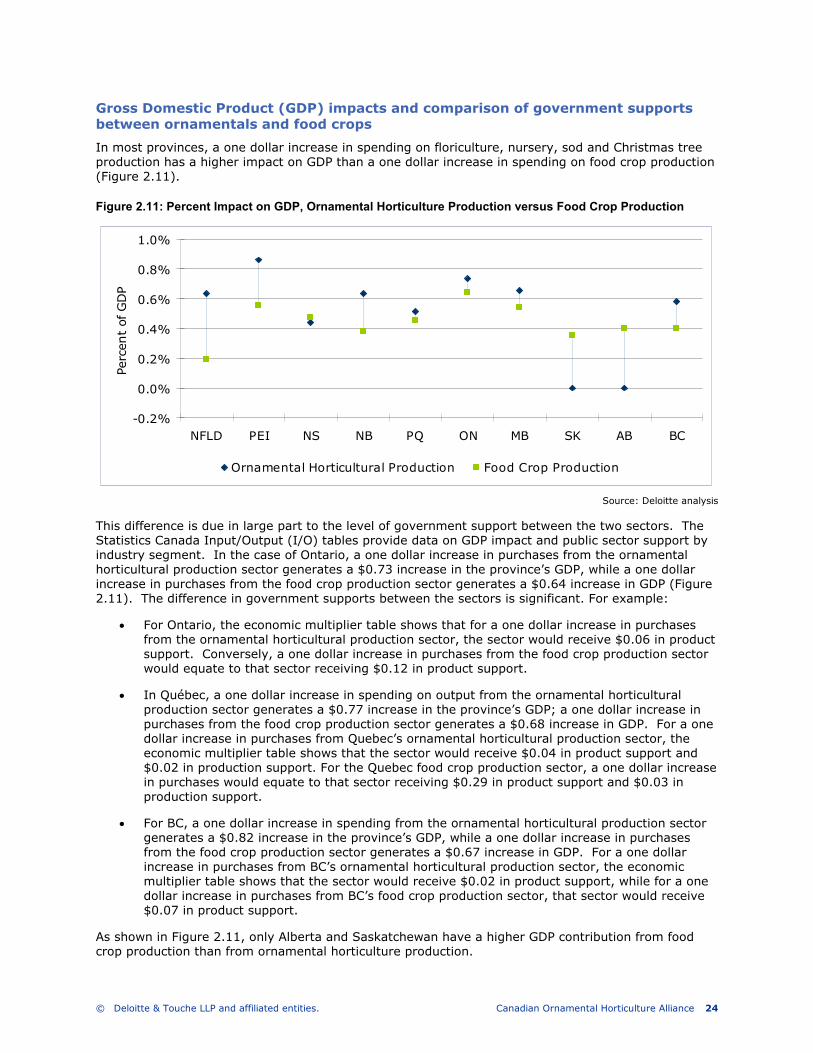
© Deloitte & Touche LLP and affiliated entities. Canadian Ornamental Horticulture Alliance 24
Gross Domestic Product (GDP) impacts and comparison of government supports between ornamentals and food crops
In most provinces, a one dollar increase in spending on floriculture, nursery, sod and Christmas tree production has a higher impact on GDP than a one dollar increase in spending on food crop production (Figure 2.11).
Figure 2.11: Percent Impact on GDP, Ornamental Horticulture Production versus Food Crop Production
-0.2%
0.0%
0.2%
0.4%
0.6%
0.8%
1.0%
NFLD PEI NS NB PQ ON MB SK AB BC
Percen
t of GDP
Ornamental Horticultural Production Food Crop Production
Source: Deloitte analysis
This difference is due in large part to the level of government support between the two sectors. The Statistics Canada Input/Output (I/O) tables provide data on GDP impact and public sector support by industry segment. In the case of Ontario, a one dollar increase in purchases from the ornamental horticultural production sector generates a $0.73 increase in the province’s GDP, while a one dollar increase in purchases from the food crop production sector generates a $0.64 increase in GDP (Figure 2.11). The difference in government supports between the sectors is significant. For example:
• For Ontario, the economic multiplier table shows that for a one dollar increase in purchases from the ornamental horticultural production sector, the sector would receive $0.06 in product support. Conversely, a one dollar increase in purchases from the food crop production sector would equate to that sector receiving $0.12 in product support.
• In Québec, a one dollar increase in spending on output from the ornamental horticultural production sector generates a $0.77 increase in the province’s GDP; a one dollar increase in purchases from the food crop production sector generates a $0.68 increase in GDP. For a one dollar increase in purchases from Quebec’s ornamental horticultural production sector, the economic multiplier table shows that the sector would receive $0.04 in product support and $0.02 in production support. For the Quebec food crop production sector, a one dollar increase in purchases would equate to that sector receiving $0.29 in product support and $0.03 in production support.
• For BC, a one dollar increase in spending from the ornamental horticultural production sector generates a $0.82 increase in the province’s GDP, while a one dollar increase in purchases from the food crop production sector generates a $0.67 increase in GDP. For a one dollar increase in purchases from BC’s ornamental horticultural production sector, the economic multiplier table shows that the sector would receive $0.02 in product support, while for a one dollar increase in purchases from BC’s food crop production sector, that sector would receive $0.07 in product support.
As shown in Figure 2.11, only Alberta and Saskatchewan have a higher GDP contribution from food crop production than from ornamental horticulture production.
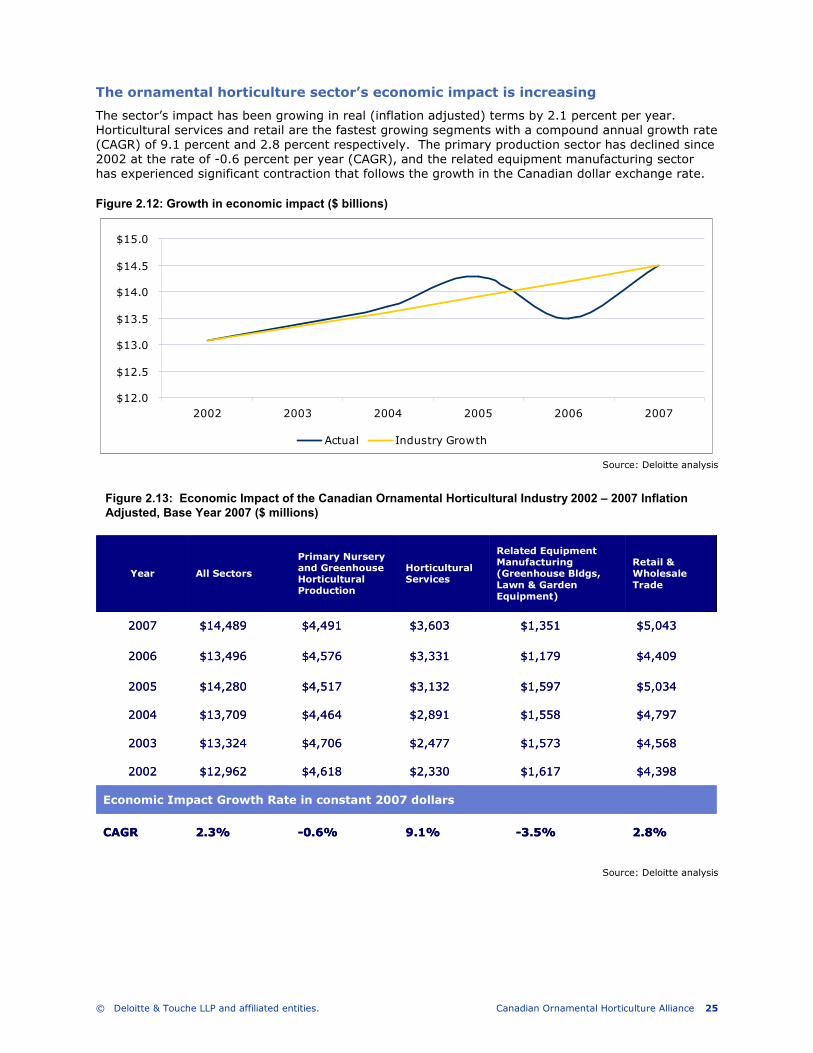
© Deloitte & Touche LLP and affiliated entities. Canadian Ornamental Horticulture Alliance 25
The ornamental horticulture sector’s economic impact is increasing
The sector’s impact has been growing in real (inflation adjusted) terms by 2.1 percent per year. Horticultural services and retail are the fastest growing segments with a compound annual growth rate (CAGR) of 9.1 percent and 2.8 percent respectively. The primary production sector has declined since 2002 at the rate of -0.6 percent per year (CAGR), and the related equipment manufacturing sector has experienced significant contraction that follows the growth in the Canadian dollar exchange rate.
Figure 2.12: Growth in economic impact ($ billions)
Source: Deloitte analysis
Source: Deloitte analysis
Figure 2.13: Economic Impact of the Canadian Ornamental Horticultural Industry 2002 – 2007 Inflation Adjusted, Base Year 2007 ($ millions)
$12.0
$12.5
$13.0
$13.5
$14.0
$14.5
$15.0
2002 2003 2004 2005 2006 2007
Actual Industry Growth
2.8%-3.5%9.1%-0.6%2.3%CAGR
Economic Impact Growth Rate in constant 2007 dollars
$4,398 $1,617 $2,330 $4,618 $12,962 2002
$4,568 $1,573 $2,477 $4,706 $13,324 2003
$4,797 $1,558 $2,891 $4,464 $13,709 2004
$5,034 $1,597 $3,132 $4,517 $14,280 2005
$4,409 $1,179 $3,331 $4,576 $13,496 2006
$5,043 $1,351 $3,603 $4,491 $14,489 2007
Retail &Wholesale Trade
Related Equipment Manufacturing (Greenhouse Bldgs, Lawn & Garden Equipment)
Horticultural Services
Primary Nursery and Greenhouse Horticultural Production
All SectorsYear
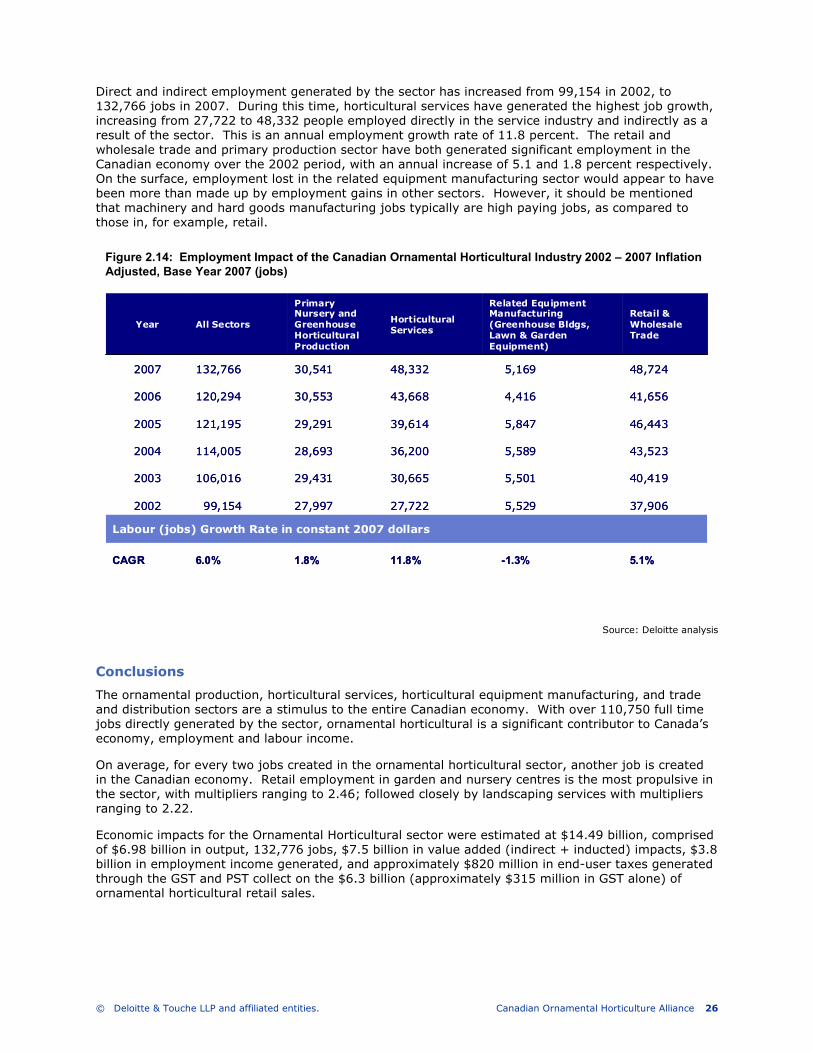
© Deloitte & Touche LLP and affiliated entities. Canadian Ornamental Horticulture Alliance 26
Direct and indirect employment generated by the sector has increased from 99,154 in 2002, to 132,766 jobs in 2007. During this time, horticultural services have generated the highest job growth, increasing from 27,722 to 48,332 people employed directly in the service industry and indirectly as a result of the sector. This is an annual employment growth rate of 11.8 percent. The retail and wholesale trade and primary production sector have both generated significant employment in the Canadian economy over the 2002 period, with an annual increase of 5.1 and 1.8 percent respectively. On the surface, employment lost in the related equipment manufacturing sector would appear to have been more than made up by employment gains in other sectors. However, it should be mentioned that machinery and hard goods manufacturing jobs typically are high paying jobs, as compared to those in, for example, retail.
Source: Deloitte analysis
Conclusions
The ornamental production, horticultural services, horticultural equipment manufacturing, and trade and distribution sectors are a stimulus to the entire Canadian economy. With over 110,750 full time jobs directly generated by the sector, ornamental horticultural is a significant contributor to Canada’s economy, employment and labour income.
On average, for every two jobs created in the ornamental horticultural sector, another job is created in the Canadian economy. Retail employment in garden and nursery centres is the most propulsive in the sector, with multipliers ranging to 2.46; followed closely by landscaping services with multipliers ranging to 2.22.
Economic impacts for the Ornamental Horticultural sector were estimated at $14.49 billion, comprised of $6.98 billion in output, 132,776 jobs, $7.5 billion in value added (indirect + inducted) impacts, $3.8 billion in employment income generated, and approximately $820 million in end-user taxes generated through the GST and PST collect on the $6.3 billion (approximately $315 million in GST alone) of ornamental horticultural retail sales.
5.1%-1.3%11.8%1.8%6.0%CAGR
Labour (jobs) Growth Rate in constant 2007 dollars
37,906 5,529 27,722 27,997 99,154 2002
40,419 5,501 30,665 29,431 106,016 2003
43,523 5,589 36,200 28,693 114,005 2004
46,443 5,847 39,614 29,291 121,195 2005
41,656 4,416 43,668 30,553 120,294 2006
48,724 5,169 48,332 30,541 132,766 2007
Retail & Wholesale Trade
Related Equipment Manufacturing (Greenhouse Bldgs, Lawn & Garden Equipment)
Horticultural Services
Primary Nursery and Greenhouse Horticultural Production
All SectorsYear
Figure 2.14: Employment Impact of the Canadian Ornamental Horticultural Industry 2002 – 2007 Inflation Adjusted, Base Year 2007 (jobs)

© Deloitte & Touche LLP and affiliated entities. Canadian Ornamental Horticulture Alliance 27
3. Key trends impacting the sector
Summary
• Based upon the trends identified, there are three market growth strategies that COHA could employ to grow profitable sales: market penetration, product development and market development. Due to the sector’s current brand gap, a diversification strategy (which heavily leverages a strong brand) is not recommended.
• There are a number of macro trends that are occurring today which position ornamental horticulture in a positive light and demonstrate opportunities for profitable growth. Some of the leading trends include: aging baby boomer cohort which is estimated to spend between $7.8 billion and $14.4 billion annually on garden and garden-related activities during retirement; the plausible return of ‘cocooning’ due to continued interest in renovations and a poor economic outlook; and the rising concern for the environment which encompasses regulatory changes, Gen-Y influences and attitudinal changes towards ‘green’.
• Use of ornamental horticulture presents consumers with a number of natural advantages which address some very relevant challenges of the 21st century (i.e. pollution, the Urban Heat Island Effect, rising heating and cooling costs, etc.).
• Moreover, well-considered investments in ornamentals have also demonstrated financial benefits to homeowners vis-à-vis appreciating resale values. Firms within the sector need to improve upon how they communicate these benefits to consumers, to fully exploit this advantage - especially at consumer key purchase decision points.
• A number of good insights are drawn as to consumer perceptions and preferences. For example, the leading purchase drivers revealed by the consumer research conducted are (i) the appearance of the product and (ii) the ease of maintenance. These factors were found to be of greater importance to the consumers interviewed than were other factors like price, fragrance and plant origin.
• There is a significant opportunity to invest further in innovation. Innovation goes further than the development of new plant specimens and varietals: it includes packaging and ways for expressing customization and personalization. The bottom line is that innovation is a requirement that consumers are seeking and a gap recognized by channel stakeholders.
The key drivers to leverage for profitable growth for the Canadian ornamental horticulture sector are (i) demographics, (ii) housing trends, (iii) innovation and (iv), the growing concern for the environment. These four drivers impact overall demand, the mix of products that will be successful and promotional strategies. Of these trends, the most positive for the ornamental sector is the aging baby boomers. As these consumers transition into (and remain in) retirement, it is expected that they will devote a significant portion of their time and disposable income towards gardening and garden-related activities.
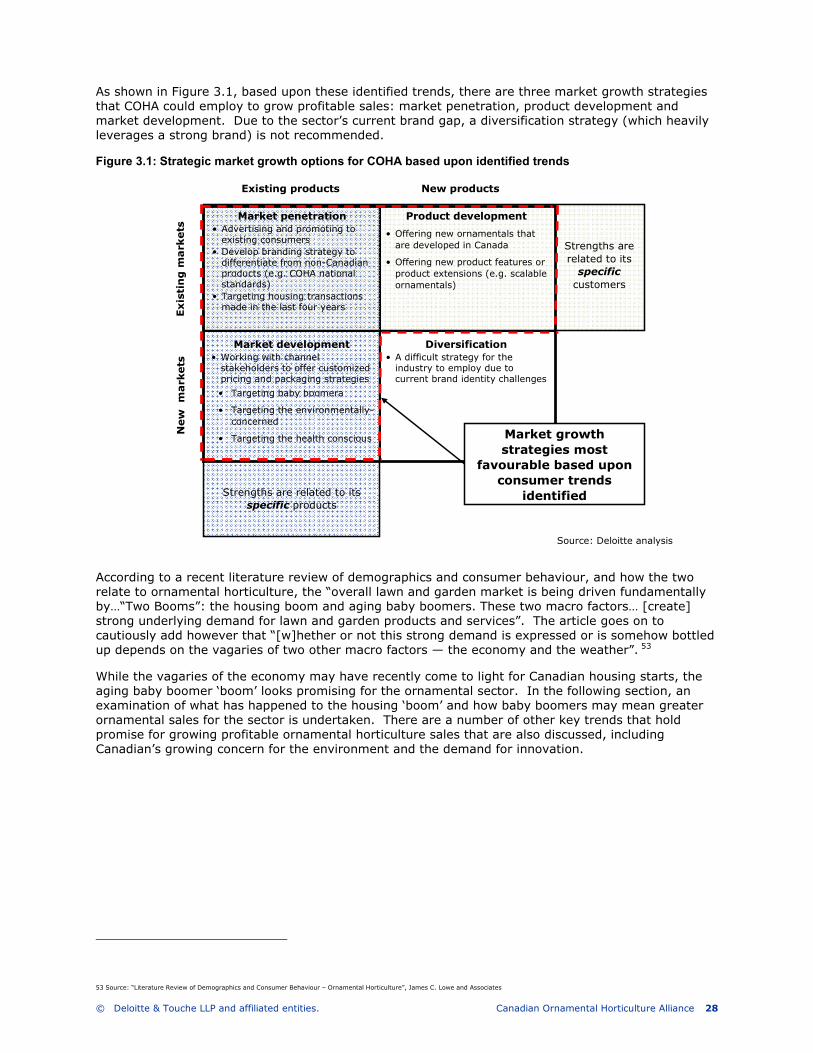
© Deloitte & Touche LLP and affiliated entities. Canadian Ornamental Horticulture Alliance 28
As shown in Figure 3.1, based upon these identified trends, there are three market growth strategies that COHA could employ to grow profitable sales: market penetration, product development and market development. Due to the sector’s current brand gap, a diversification strategy (which heavily leverages a strong brand) is not recommended.
Figure 3.1: Strategic market growth options for COHA based upon identified trends
According to a recent literature review of demographics and consumer behaviour, and how the two relate to ornamental horticulture, the “overall lawn and garden market is being driven fundamentally by…“Two Booms”: the housing boom and aging baby boomers. These two macro factors… [create] strong underlying demand for lawn and garden products and services”. The article goes on to cautiously add however that “[w]hether or not this strong demand is expressed or is somehow bottled up depends on the vagaries of two other macro factors — the economy and the weather”. 53
While the vagaries of the economy may have recently come to light for Canadian housing starts, the aging baby boomer ‘boom’ looks promising for the ornamental sector. In the following section, an examination of what has happened to the housing ‘boom’ and how baby boomers may mean greater ornamental sales for the sector is undertaken. There are a number of other key trends that hold promise for growing profitable ornamental horticulture sales that are also discussed, including Canadian’s growing concern for the environment and the demand for innovation.
53 Source: “Literature Review of Demographics and Consumer Behaviour – Ornamental Horticulture”, James C. Lowe and Associates
Source: Deloitte analysis
Existing products New productsExisting markets
New markets
Market penetration• Advertising and promoting to existing consumers
• Develop branding strategy to differentiate from non-Canadian products (e.g. COHA national standards)
• Targeting housing transactions made in the last four years
Product development
• Offering new ornamentals that are developed in Canada
• Offering new product features or product extensions (e.g. scalable ornamentals)
Market development• Working with channel stakeholders to offer customized pricing and packaging strategies
Strengths are related to its specific
customers
Strengths are related to its specific products
Diversification• A difficult strategy for the industry to employ due to current brand identity challenges
• Targeting baby boomera
• Targeting the environmentally-concerned
• Targeting the health conscious Market growth strategies most
favourable based upon consumer trends
identified
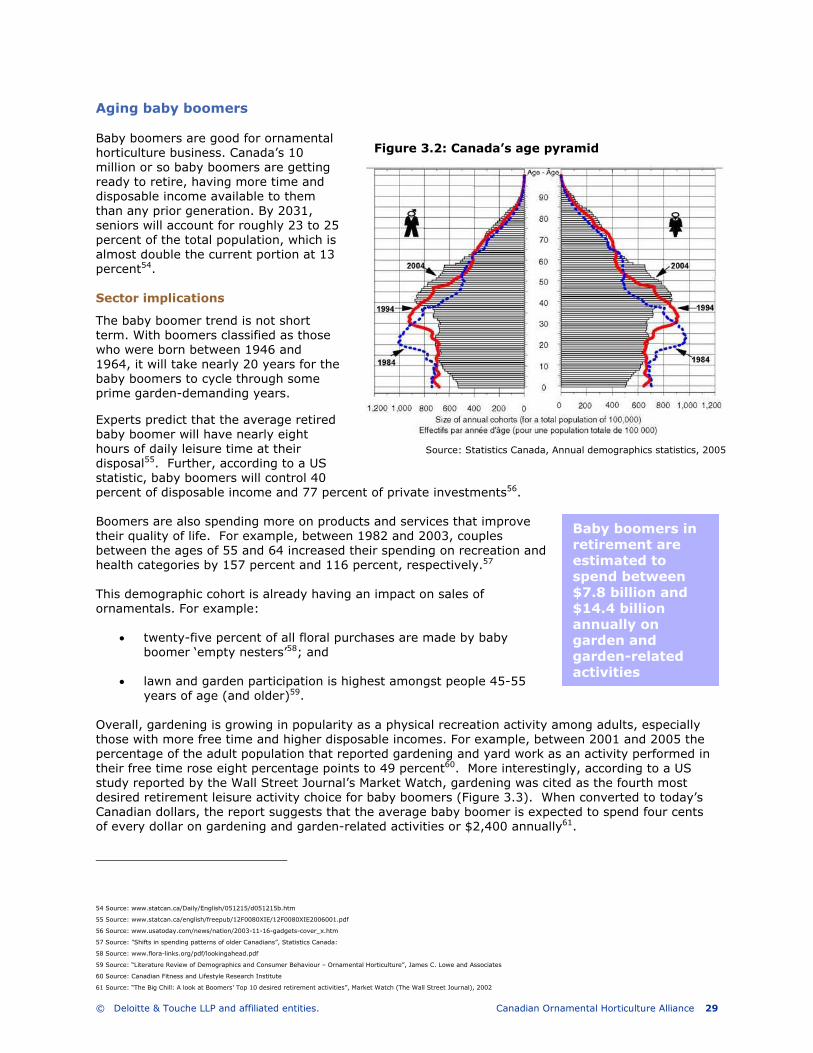
© Deloitte & Touche LLP and affiliated entities. Canadian Ornamental Horticulture Alliance 29
Aging baby boomers
Baby boomers are good for ornamental horticulture business. Canada’s 10 million or so baby boomers are getting ready to retire, having more time and disposable income available to them than any prior generation. By 2031, seniors will account for roughly 23 to 25 percent of the total population, which is almost double the current portion at 13 percent54.
Sector implications
The baby boomer trend is not short term. With boomers classified as those who were born between 1946 and 1964, it will take nearly 20 years for the baby boomers to cycle through some prime garden-demanding years.
Experts predict that the average retired baby boomer will have nearly eight hours of daily leisure time at their disposal55. Further, according to a US statistic, baby boomers will control 40 percent of disposable income and 77 percent of private investments56. Boomers are also spending more on products and services that improve their quality of life. For example, between 1982 and 2003, couples between the ages of 55 and 64 increased their spending on recreation and health categories by 157 percent and 116 percent, respectively.57 This demographic cohort is already having an impact on sales of ornamentals. For example:
• twenty-five percent of all floral purchases are made by baby boomer ‘empty nesters’58; and
• lawn and garden participation is highest amongst people 45-55
years of age (and older)59. Overall, gardening is growing in popularity as a physical recreation activity among adults, especially those with more free time and higher disposable incomes. For example, between 2001 and 2005 the percentage of the adult population that reported gardening and yard work as an activity performed in their free time rose eight percentage points to 49 percent60. More interestingly, according to a US study reported by the Wall Street Journal’s Market Watch, gardening was cited as the fourth most desired retirement leisure activity choice for baby boomers (Figure 3.3). When converted to today’s Canadian dollars, the report suggests that the average baby boomer is expected to spend four cents of every dollar on gardening and garden-related activities or $2,400 annually61.
54 Source: www.statcan.ca/Daily/English/051215/d051215b.htm
55 Source: www.statcan.ca/english/freepub/12F0080XIE/12F0080XIE2006001.pdf
56 Source: www.usatoday.com/news/nation/2003-11-16-gadgets-cover_x.htm
57 Source: "Shifts in spending patterns of older Canadians”, Statistics Canada:
58 Source: www.flora-links.org/pdf/lookingahead.pdf
59 Source: “Literature Review of Demographics and Consumer Behaviour – Ornamental Horticulture”, James C. Lowe and Associates
60 Source: Canadian Fitness and Lifestyle Research Institute
61 Source: “The Big Chill: A look at Boomers' Top 10 desired retirement activities”, Market Watch (The Wall Street Journal), 2002
Source: Statistics Canada, Annual demographics statistics, 2005
Figure 3.2: Canada’s age pyramid
Baby boomers in retirement are estimated to spend between $7.8 billion and $14.4 billion annually on garden and garden-related activities
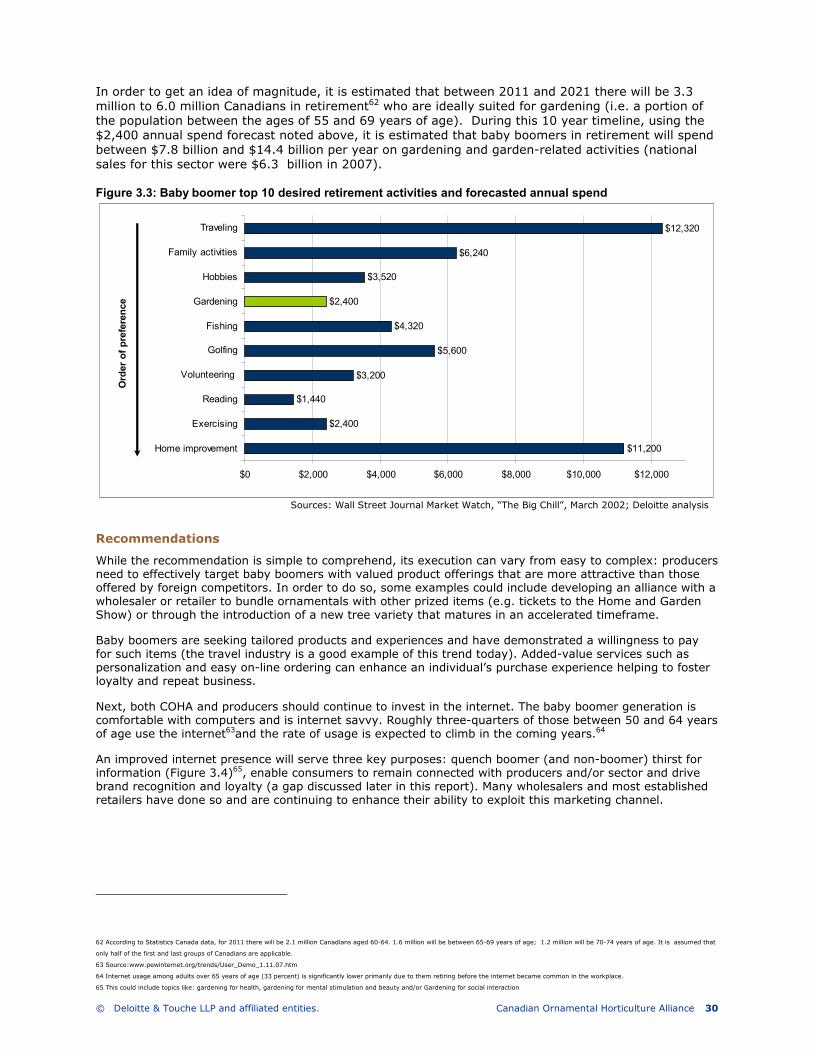
© Deloitte & Touche LLP and affiliated entities. Canadian Ornamental Horticulture Alliance 30
In order to get an idea of magnitude, it is estimated that between 2011 and 2021 there will be 3.3 million to 6.0 million Canadians in retirement62 who are ideally suited for gardening (i.e. a portion of the population between the ages of 55 and 69 years of age). During this 10 year timeline, using the $2,400 annual spend forecast noted above, it is estimated that baby boomers in retirement will spend between $7.8 billion and $14.4 billion per year on gardening and garden-related activities (national sales for this sector were $6.3 billion in 2007). Figure 3.3: Baby boomer top 10 desired retirement activities and forecasted annual spend
Recommendations
While the recommendation is simple to comprehend, its execution can vary from easy to complex: producers need to effectively target baby boomers with valued product offerings that are more attractive than those offered by foreign competitors. In order to do so, some examples could include developing an alliance with a wholesaler or retailer to bundle ornamentals with other prized items (e.g. tickets to the Home and Garden Show) or through the introduction of a new tree variety that matures in an accelerated timeframe.
Baby boomers are seeking tailored products and experiences and have demonstrated a willingness to pay for such items (the travel industry is a good example of this trend today). Added-value services such as personalization and easy on-line ordering can enhance an individual’s purchase experience helping to foster loyalty and repeat business.
Next, both COHA and producers should continue to invest in the internet. The baby boomer generation is comfortable with computers and is internet savvy. Roughly three-quarters of those between 50 and 64 years of age use the internet63and the rate of usage is expected to climb in the coming years.64
An improved internet presence will serve three key purposes: quench boomer (and non-boomer) thirst for information (Figure 3.4)65, enable consumers to remain connected with producers and/or sector and drive brand recognition and loyalty (a gap discussed later in this report). Many wholesalers and most established retailers have done so and are continuing to enhance their ability to exploit this marketing channel.
62 According to Statistics Canada data, for 2011 there will be 2.1 million Canadians aged 60-64. 1.6 million will be between 65-69 years of age; 1.2 million will be 70-74 years of age. It is assumed that
only half of the first and last groups of Canadians are applicable.
63 Source:www.pewinternet.org/trends/User_Demo_1.11.07.htm
64 Internet usage among adults over 65 years of age (33 percent) is significantly lower primarily due to them retiring before the internet became common in the workplace.
65 This could include topics like: gardening for health, gardening for mental stimulation and beauty and/or Gardening for social interaction
Sources: Wall Street Journal Market Watch, “The Big Chill”, March 2002; Deloitte analysis
$11,200
$2,400
$1,440
$3,200
$5,600
$4,320
$2,400
$3,520
$6,240
$12,320
$0 $2,000 $4,000 $6,000 $8,000 $10,000 $12,000
Home improvement
Exercising
Reading
Volunteering
Golfing
Fishing
Gardening
Hobbies
Family activities
Traveling
Order of preference
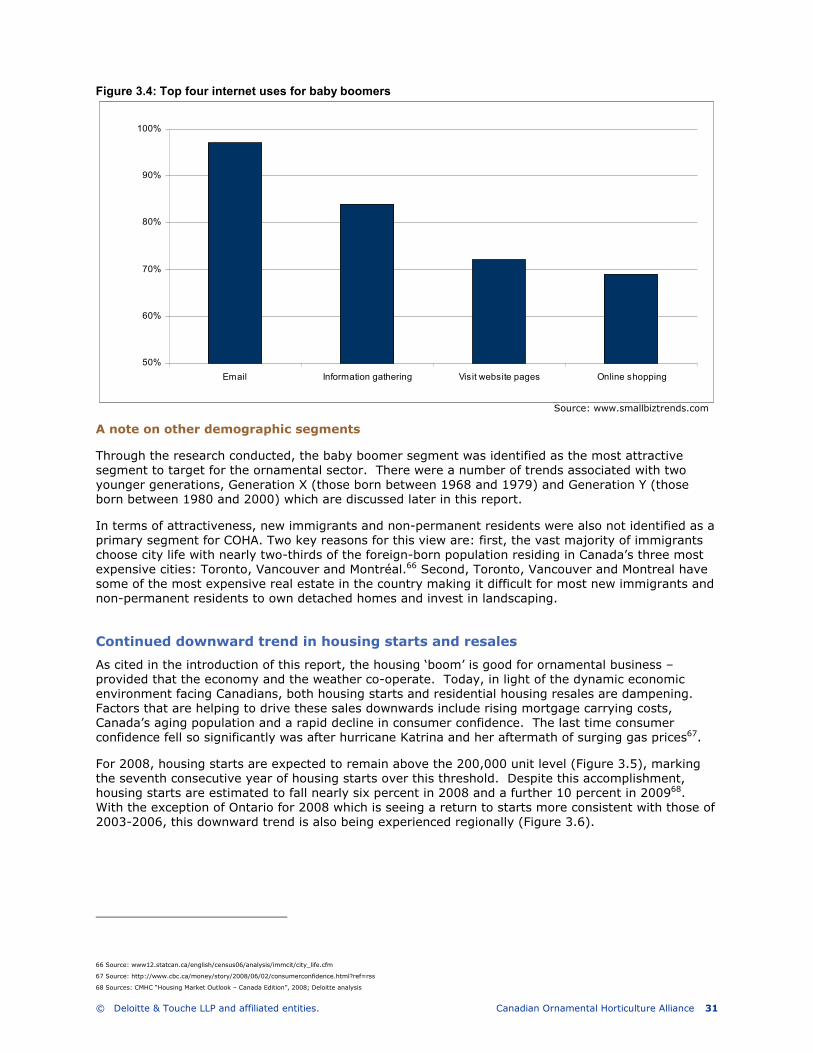
© Deloitte & Touche LLP and affiliated entities. Canadian Ornamental Horticulture Alliance 31
Figure 3.4: Top four internet uses for baby boomers
A note on other demographic segments
Through the research conducted, the baby boomer segment was identified as the most attractive segment to target for the ornamental sector. There were a number of trends associated with two younger generations, Generation X (those born between 1968 and 1979) and Generation Y (those born between 1980 and 2000) which are discussed later in this report.
In terms of attractiveness, new immigrants and non-permanent residents were also not identified as a primary segment for COHA. Two key reasons for this view are: first, the vast majority of immigrants choose city life with nearly two-thirds of the foreign-born population residing in Canada’s three most expensive cities: Toronto, Vancouver and Montréal.66 Second, Toronto, Vancouver and Montreal have some of the most expensive real estate in the country making it difficult for most new immigrants and non-permanent residents to own detached homes and invest in landscaping.
Continued downward trend in housing starts and resales
As cited in the introduction of this report, the housing ‘boom’ is good for ornamental business – provided that the economy and the weather co-operate. Today, in light of the dynamic economic environment facing Canadians, both housing starts and residential housing resales are dampening. Factors that are helping to drive these sales downwards include rising mortgage carrying costs, Canada’s aging population and a rapid decline in consumer confidence. The last time consumer confidence fell so significantly was after hurricane Katrina and her aftermath of surging gas prices67.
For 2008, housing starts are expected to remain above the 200,000 unit level (Figure 3.5), marking the seventh consecutive year of housing starts over this threshold. Despite this accomplishment, housing starts are estimated to fall nearly six percent in 2008 and a further 10 percent in 200968. With the exception of Ontario for 2008 which is seeing a return to starts more consistent with those of 2003-2006, this downward trend is also being experienced regionally (Figure 3.6).
66 Source: www12.statcan.ca/english/census06/analysis/immcit/city_life.cfm
67 Source: http://www.cbc.ca/money/story/2008/06/02/consumerconfidence.html?ref=rss
68 Sources: CMHC “Housing Market Outlook – Canada Edition”, 2008; Deloitte analysis
50%
60%
70%
80%
90%
100%
Email Information gathering Visit website pages Online shopping
Source: www.smallbiztrends.com
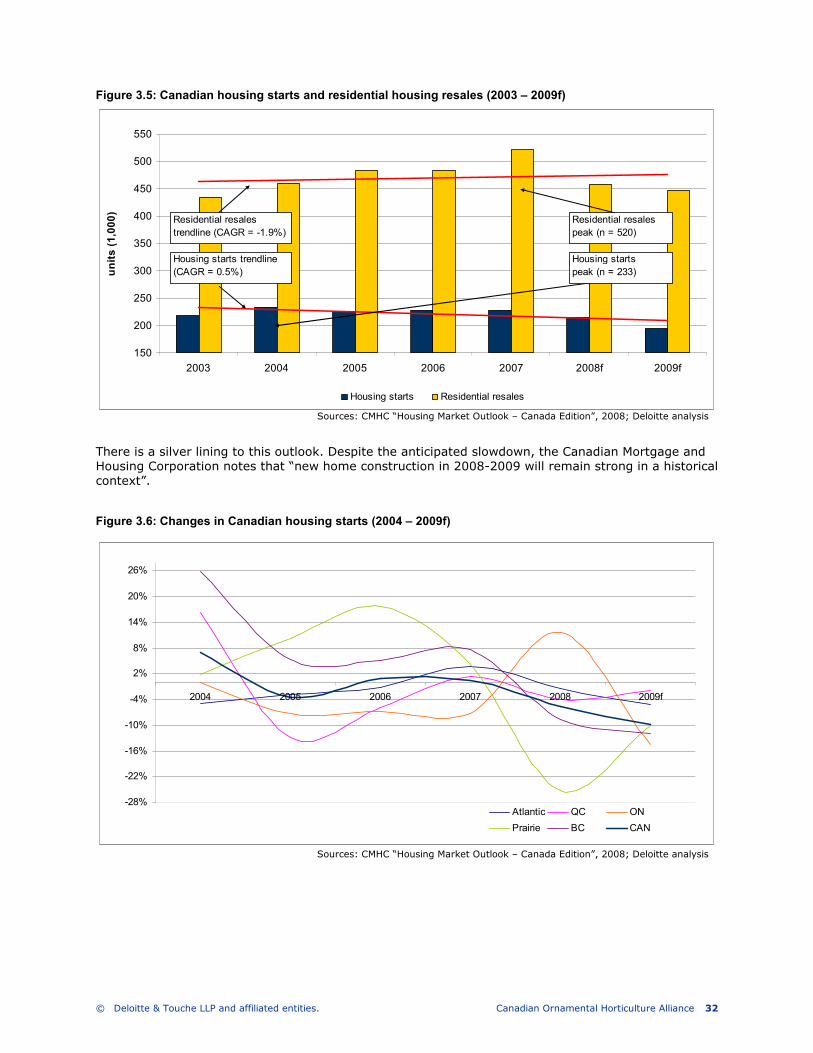
© Deloitte & Touche LLP and affiliated entities. Canadian Ornamental Horticulture Alliance 32
Figure 3.5: Canadian housing starts and residential housing resales (2003 – 2009f)
There is a silver lining to this outlook. Despite the anticipated slowdown, the Canadian Mortgage and Housing Corporation notes that “new home construction in 2008-2009 will remain strong in a historical context”.
Figure 3.6: Changes in Canadian housing starts (2004 – 2009f)
Sources: CMHC “Housing Market Outlook – Canada Edition”, 2008; Deloitte analysis
-28%
-22%
-16%
-10%
-4%
2%
8%
14%
20%
26%
2004 2005 2006 2007 2008 2009f
Atlantic QC ON
Prairie BC CAN
150
200
250
300
350
400
450
500
550
2003 2004 2005 2006 2007 2008f 2009f
units (1,000)
Housing starts Residential resales
Residential resales
trendline (CAGR = -1.9%)
Housing starts trendline
(CAGR = 0.5%)
Residential resales
peak (n = 520)
Housing starts
peak (n = 233)
Sources: CMHC “Housing Market Outlook – Canada Edition”, 2008; Deloitte analysis
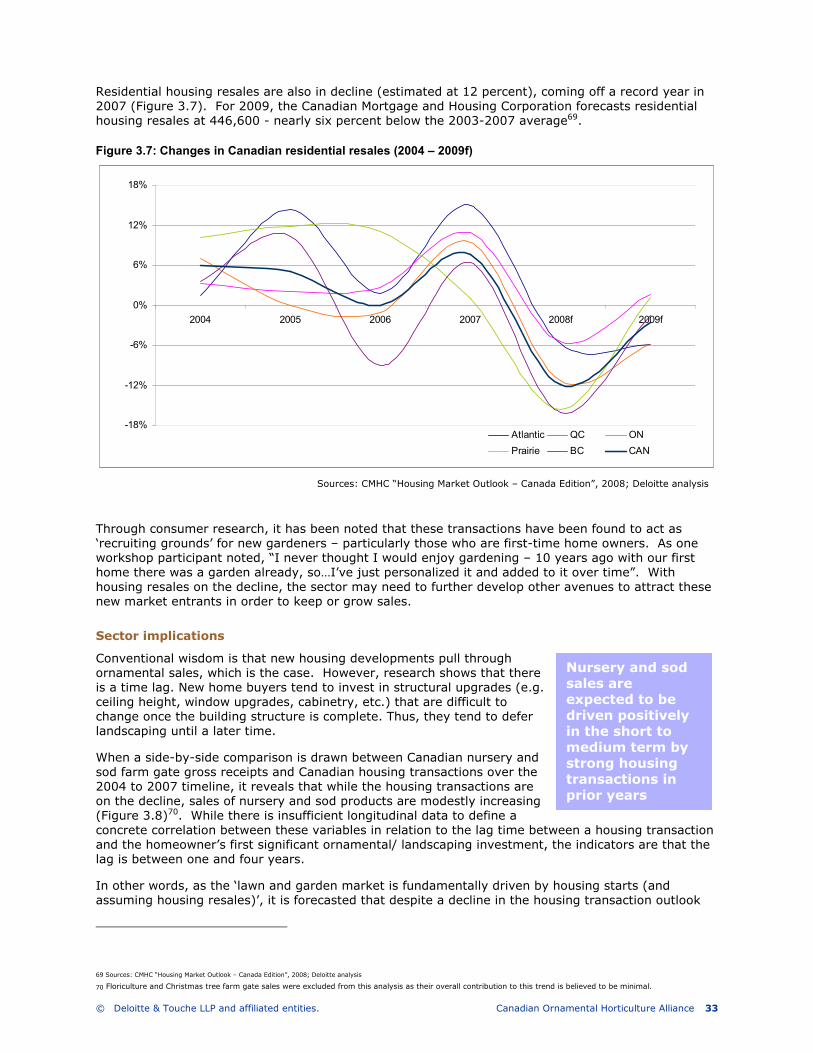
© Deloitte & Touche LLP and affiliated entities. Canadian Ornamental Horticulture Alliance 33
Residential housing resales are also in decline (estimated at 12 percent), coming off a record year in 2007 (Figure 3.7). For 2009, the Canadian Mortgage and Housing Corporation forecasts residential housing resales at 446,600 - nearly six percent below the 2003-2007 average69.
Figure 3.7: Changes in Canadian residential resales (2004 – 2009f)
Through consumer research, it has been noted that these transactions have been found to act as ‘recruiting grounds’ for new gardeners – particularly those who are first-time home owners. As one workshop participant noted, “I never thought I would enjoy gardening – 10 years ago with our first home there was a garden already, so…I’ve just personalized it and added to it over time”. With housing resales on the decline, the sector may need to further develop other avenues to attract these new market entrants in order to keep or grow sales.
Sector implications
Conventional wisdom is that new housing developments pull through ornamental sales, which is the case. However, research shows that there is a time lag. New home buyers tend to invest in structural upgrades (e.g. ceiling height, window upgrades, cabinetry, etc.) that are difficult to change once the building structure is complete. Thus, they tend to defer landscaping until a later time.
When a side-by-side comparison is drawn between Canadian nursery and sod farm gate gross receipts and Canadian housing transactions over the 2004 to 2007 timeline, it reveals that while the housing transactions are on the decline, sales of nursery and sod products are modestly increasing (Figure 3.8)70. While there is insufficient longitudinal data to define a concrete correlation between these variables in relation to the lag time between a housing transaction and the homeowner’s first significant ornamental/ landscaping investment, the indicators are that the lag is between one and four years.
In other words, as the ‘lawn and garden market is fundamentally driven by housing starts (and assuming housing resales)’, it is forecasted that despite a decline in the housing transaction outlook
69 Sources: CMHC “Housing Market Outlook – Canada Edition”, 2008; Deloitte analysis 70 Floriculture and Christmas tree farm gate sales were excluded from this analysis as their overall contribution to this trend is believed to be minimal.
-18%
-12%
-6%
0%
6%
12%
18%
2004 2005 2006 2007 2008f 2009f
Atlantic QC ON
Prairie BC CAN
Nursery and sod sales are expected to be driven positively in the short to medium term by strong housing transactions in prior years
Sources: CMHC “Housing Market Outlook – Canada Edition”, 2008; Deloitte analysis

© Deloitte & Touche LLP and affiliated entities. Canadian Ornamental Horticulture Alliance 34
for 2008 and 2009, sales of nursery and sod products are expected to be driven positively in the short to medium term by the strong housing transactions made in prior years.
Figure 3.8: Canadian housing transactions and Canadian nursery and sod farm gate gross receipts (2004-2007)
Recommendations
According to CMHC, the ‘seller market’ years have ended and “balanced market conditions have become the norm in most centres across Canada”71. In their third quarter 2008 report, they also forecast “strong renovation spending in 2008 and 2009”. In order to effectively compete for these renovation dollars, it is recommended that the sector target consumers with a ‘pull strategy’ which promotes the economic benefits of gardening and landscaping.
For homeowners looking to sell their properties within the coming year(s), investments in ornamentals and landscaping may differentiate their properties which then could lead to premiums for their homes and/or shorter selling times.
Some examples of financial benefits to homeowners vis-à-vis investments in gardening and landscaping include:
1. a well landscaped property can add 20 percent to the value of a home72;
2. Landscaping can bring a recovery value of 100 to 200 percent at selling time (interestingly, a kitchen remodel will achieve a 75 to 125 percent recovery
71 Source: CMHC “Housing Market Outlook – Canada Edition”,
72 Source: www.bobvila.com/HowTo_Library/Landscaping_for_Increased_Property_Value-Home_Selling-A1814.html
0%
2%
4%
6%
8%
2004 2005 2006 2007Annual percentage change: housing starts and resales
Annual percentage change: nursery and sod farm gate sales
Housing transaction
trendline
Nursery and sod farm gate
sales trendline
‘Cocooning’ resurgence in 2009?
Today’s weakened economic outlook may support resurgence in ‘cocooning’ (i.e. a trend in which individuals socialize less and retreat to their home more).
‘Cocooning’ was very recently identified as a top consumer trend for 2009. “Old-fashioned skills such as cooking at home, sewing and gardening will become increasingly popular… With people “cocooning” in their homes to save money, companies will [have to] create better products for… relaxing and entertaining at home”1.
Consequently, by ensuring that there is strong value in the ornamental products offered, this renewed interest in ‘cocooning’ may foster a growing interest in gardening (and consequently help to drive sales).
1 Source: “Mintel Predicts Top Trends for 2009: Five key changes to consumer behavior and how businesses can thrive”, Business Wire, 11
November 2008
Source: Deloitte analysis
© Deloitte & Touche LLP and affiliated entities. Canadian Ornamental Horticulture Alliance 35
rate and a bathroom remodel will return a 20 to 120 percent recovery rate);73
3. the introduction of a hedge to a property can add a four percent premium to a home’s value74;
4. the installation of a patio can add up to a 12 percent premium to the value of a home; and
5. landscaped curbs have been shown to add a 4.4 percent premium to the value of a property.
COHA may also consider recommending an amount homeowners should invest on gardening and landscaping to help drive sales. This approach is already being used by the American Society of Landscape Architects which recommends that homeowners invest 10 percent of the home's value in landscaping75. Providing specific investment targets that are supported by data which demonstrates the financial benefits of gardening and landscaping will help consumers make the decision for such an investment.
Strong demand for innovation
One of the most common and consistent themes that has come out from the research conducted is that of innovation. Both consumers and sector channel stakeholders interviewed put a high value on innovation and are willing to pay for it. For example, due to the decreasing lot sizes being offered with new home developments, both consumers and channel stakeholders are seeking to further develop and diversify today’s scalable ornamental product mix.
Innovation is good for business. In 2004, Deloitte Research conducted an extensive study on the top factors for growth (Figure 3.9) across six industries. The launch of new products and services was the ranked first for all industries, including consumer products which represent ornamental horticulture products. Successful innovations enable businesses to command premiums for their products and/or services offerings that translate into higher revenues and profits.
Research shows that a one percent improvement in pricing can result in a 200 to 350 percent return on investment (ROI) in 12 months and a two to seven percent increase in gross margin73. For example, for every dollar invested towards improving pricing (e.g. through developing innovative products that are valued by consumers, improved pricing strategies, etc.), businesses can increase their sales within a 12 month timeline by up to $3.50 (i.e. 350 percent ROI). They can also improve their gross margins through improved pricing/discounting approaches and higher sales turnover.
Such improvements can also lead to a 12 percent increase in operating profits76 through addressing factors that lead to unnecessary margin erosion (due to high-demand for the innovative products, etc), improving process efficiencies, etc. Finally, pricing improvements typically have three to four times the effect on profitability of equivalent improvements in volume and cost77.
73 Source : www.plantenance.com/documents/articles/Article_1_08292005.pdf
74 Source: Rosiers, Francois Des, “Landscaping and house values: An empirical investigation”, 2002
75 Source: www.bobvila.com/HowTo_Library/Landscaping_for_Increased_Property_Value-Home_Selling-A1814.html
76 Source : ”Activating Your Most Powerful Profit Lever”, Deloitte, 2006
77 Source : “Price Management: Conventional Wisdom is Wrong,” AMR Research Outlook, 2004.
The sector is at risk of losing ground as innovation is mainly driven off-shore
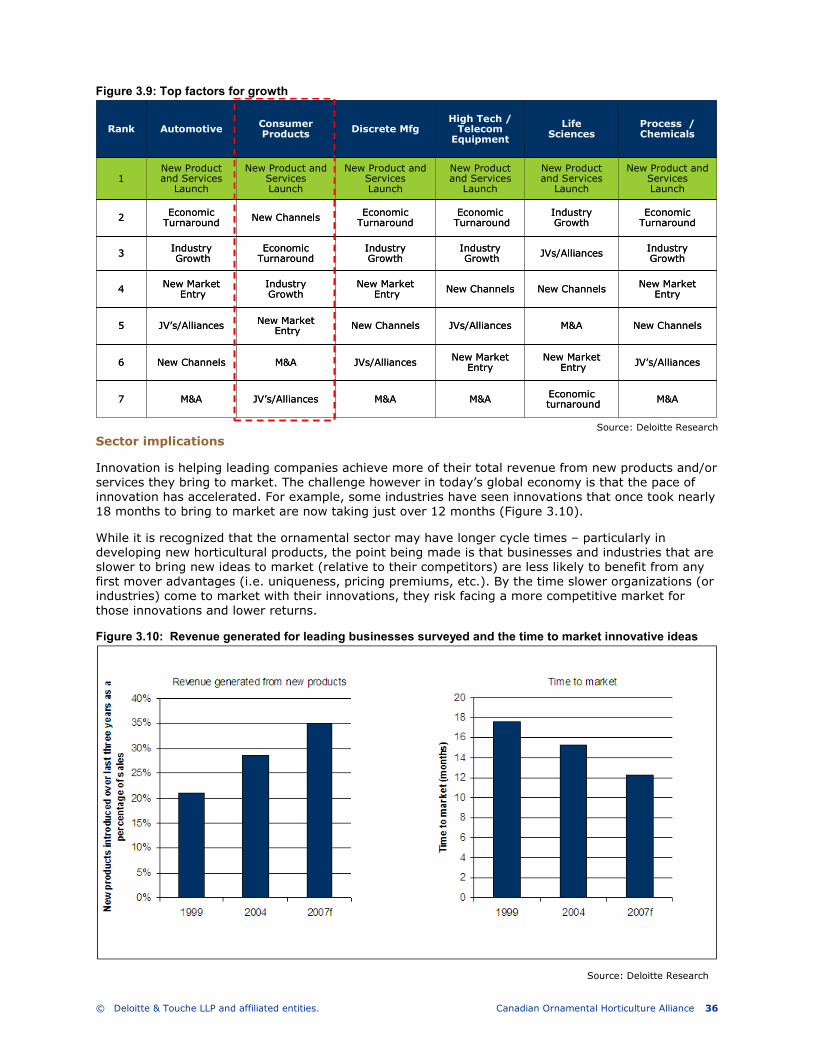
© Deloitte & Touche LLP and affiliated entities. Canadian Ornamental Horticulture Alliance 36
Figure 3.9: Top factors for growth
Sector implications
Innovation is helping leading companies achieve more of their total revenue from new products and/or services they bring to market. The challenge however in today’s global economy is that the pace of innovation has accelerated. For example, some industries have seen innovations that once took nearly 18 months to bring to market are now taking just over 12 months (Figure 3.10).
While it is recognized that the ornamental sector may have longer cycle times – particularly in developing new horticultural products, the point being made is that businesses and industries that are slower to bring new ideas to market (relative to their competitors) are less likely to benefit from any first mover advantages (i.e. uniqueness, pricing premiums, etc.). By the time slower organizations (or industries) come to market with their innovations, they risk facing a more competitive market for those innovations and lower returns.
Figure 3.10: Revenue generated for leading businesses surveyed and the time to market innovative ideas
Source: Deloitte Research
7
6
5
4
3
2
1
Rank
M&AEconomicturnaroundM&AM&AJV’s/AlliancesM&A
JV’s/AlliancesNew MarketEntry
New Market EntryJVs/AlliancesM&ANew Channels
New ChannelsM&AJVs/AlliancesNew ChannelsNew MarketEntryJV’s/Alliances
New MarketEntryNew ChannelsNew ChannelsNew Market
EntryIndustry Growth
New MarketEntry
IndustryGrowthJVs/AlliancesIndustry
GrowthIndustryGrowth
Economic Turnaround
IndustryGrowth
EconomicTurnaround
IndustryGrowth
EconomicTurnaround
EconomicTurnaroundNew ChannelsEconomic
Turnaround
New Product and Services Launch
New Product and Services
Launch
New Product and Services
Launch
New Product and Services Launch
New Product and Services Launch
New Product and Services
Launch
Process / Chemicals
LifeSciences
High Tech / Telecom Equipment
Discrete MfgConsumerProducts
Automotive
Source: Deloitte Research
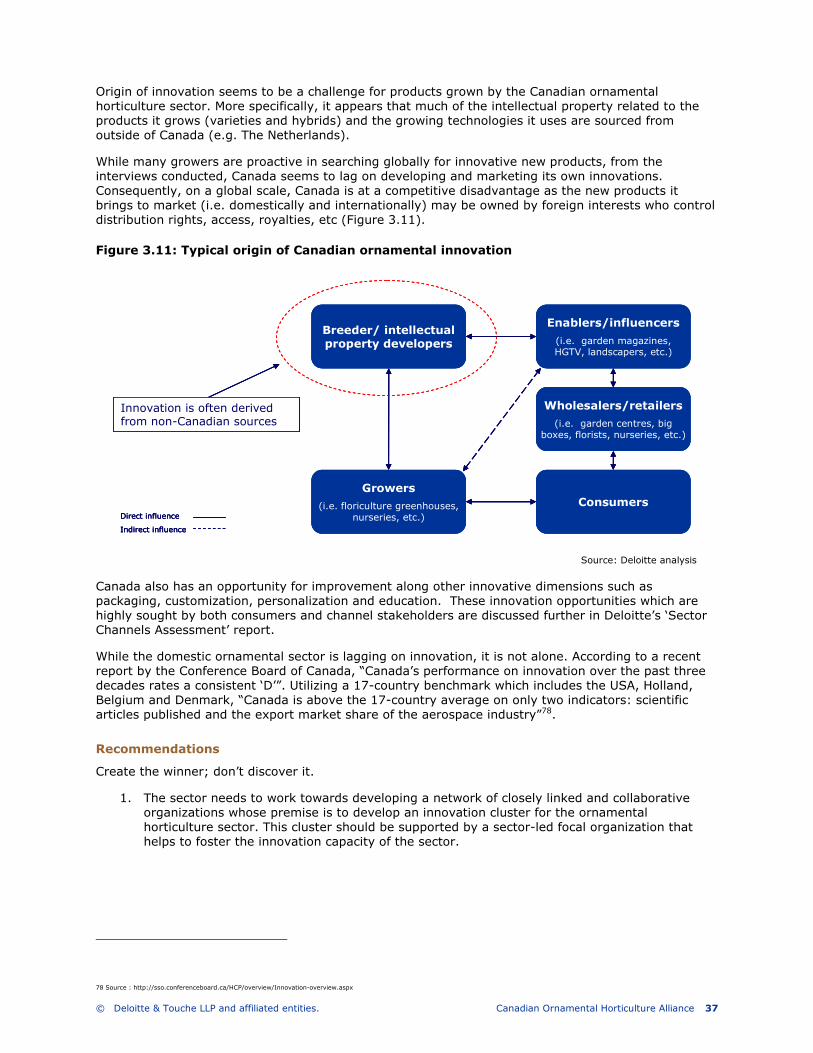
© Deloitte & Touche LLP and affiliated entities. Canadian Ornamental Horticulture Alliance 37
Origin of innovation seems to be a challenge for products grown by the Canadian ornamental horticulture sector. More specifically, it appears that much of the intellectual property related to the products it grows (varieties and hybrids) and the growing technologies it uses are sourced from outside of Canada (e.g. The Netherlands).
While many growers are proactive in searching globally for innovative new products, from the interviews conducted, Canada seems to lag on developing and marketing its own innovations. Consequently, on a global scale, Canada is at a competitive disadvantage as the new products it brings to market (i.e. domestically and internationally) may be owned by foreign interests who control distribution rights, access, royalties, etc (Figure 3.11).
Figure 3.11: Typical origin of Canadian ornamental innovation
Canada also has an opportunity for improvement along other innovative dimensions such as packaging, customization, personalization and education. These innovation opportunities which are highly sought by both consumers and channel stakeholders are discussed further in Deloitte’s ‘Sector Channels Assessment’ report.
While the domestic ornamental sector is lagging on innovation, it is not alone. According to a recent report by the Conference Board of Canada, “Canada’s performance on innovation over the past three decades rates a consistent ‘D’”. Utilizing a 17-country benchmark which includes the USA, Holland, Belgium and Denmark, “Canada is above the 17-country average on only two indicators: scientific articles published and the export market share of the aerospace industry”78.
Recommendations
Create the winner; don’t discover it.
1. The sector needs to work towards developing a network of closely linked and collaborative organizations whose premise is to develop an innovation cluster for the ornamental horticulture sector. This cluster should be supported by a sector-led focal organization that helps to foster the innovation capacity of the sector.
78 Source : http://sso.conferenceboard.ca/HCP/overview/Innovation-overview.aspx
Growers
(i.e. floriculture greenhouses, nurseries, etc.)
Breeder/ intellectual property developers
Enablers/influencers
(i.e. garden magazines, HGTV, landscapers, etc.)
Wholesalers/retailers
(i.e. garden centres, big boxes, florists, nurseries, etc.)
Consumers
Innovation is often derived from non-Canadian sources
Direct influence
Indirect influence
Growers
(i.e. floriculture greenhouses, nurseries, etc.)
Breeder/ intellectual property developers
Enablers/influencers
(i.e. garden magazines, HGTV, landscapers, etc.)
Wholesalers/retailers
(i.e. garden centres, big boxes, florists, nurseries, etc.)
Consumers
Innovation is often derived from non-Canadian sources
Direct influence
Indirect influence
Direct influence
Indirect influence
Source: Deloitte analysis
© Deloitte & Touche LLP and affiliated entities. Canadian Ornamental Horticulture Alliance 38
The Dutch floriculture sector is a benchmark example of such a cluster that links breeding and propagation businesses, producers, auctions, traders and retailers, banks, marketing companies, packaging companies and agro-technical firms, transport agencies and logistical services, knowledge networks, interest groups, research institutes and government agencies into a tight, high-functioning cluster79.
2. Canada has a natural advantage to producing attractive, high quality ‘cool climate’ ornamental crops that are well suited to the various temperate zones across the nation. Domestic producers also have a natural advantage in shipping ornamentals to local markets (particularly with some floriculture products) which do not travel well in shorter times. For example, domestic cut flower producers can offer shorter turnaround times and often ship in water versus having the product dry packed resulting in better vase life.
Producers should look to developing and promoting new products that are aligned to these advantages. By doing so, the benefits of associated with offering unique, aesthetically-pleasing and easy to maintain ornamentals will command price premiums. Such strong offerings can pose a high barrier to entry for distant foreign producers.
3. It is also recommended that the sector improve its awareness of government programs that are designed to support research and development. For example, Scientific Research and Experimental Development (SR&ED) is research and development that qualifies under a federal government incentive program that encourages the development and advancement of Canadian technologies. The program offers tax incentives in the form of refundable and non-refundable tax credits of 20 to 41 percent of qualified expenditures. These incentives for SR&ED in Canada are among the most generous in the world. The SR&ED program provides nearly $1.5 billion in credits annually with 75 percent of the claimants being small to medium size enterprises.
4. The sector should recognize and reward innovation in order to foster the introduction and dissemination of new products, technologies and processes. For example, the German Federal Ministry of Food, Agriculture and Consumer Protection grants an annual innovation award in order to acknowledge and promote innovative practices in the areas of plants, technology and cooperation/enterprise organization. While the German example is supported by government, the sector is also strongly encouraged to take on these initiatives privately.
Producers need to work with channel stakeholders to improve consumer offerings by not only continually bringing new ideas to market, but also through customization and personalization approaches. As referenced above, these innovation opportunities which are highly sought by both consumers and channel stakeholders are further discussed in Deloitte’s ‘Sector Channels Assessment’ report.
Concern for the environment
Concern for the environment is a current trend impacting the Canadian ornamental horticulture sector. Specifically from a consumer point of view, three key areas have been identified that will either negatively or positively influence the sector going forward:
1. Green consumerism: there is a growing segment of the population that is becoming more concerned about the environment and the environmental impact of the products they use. A sub-segment of this group is also willing to pay a premium for such products (nearly one in 10, according to a study done by the Roper Organization80);
79 Source: http://www.vbn.nl/en/cijfers/index.asp
80 Source; http://makower.typepad.com/joel_makower/2007/05/the_many_shades.html
Canada’s SR&ED program is one of the most generous R&D programs globally providing nearly $1.5 billion in tax credits - 75 percent of the claimants are small to medium size enterprises
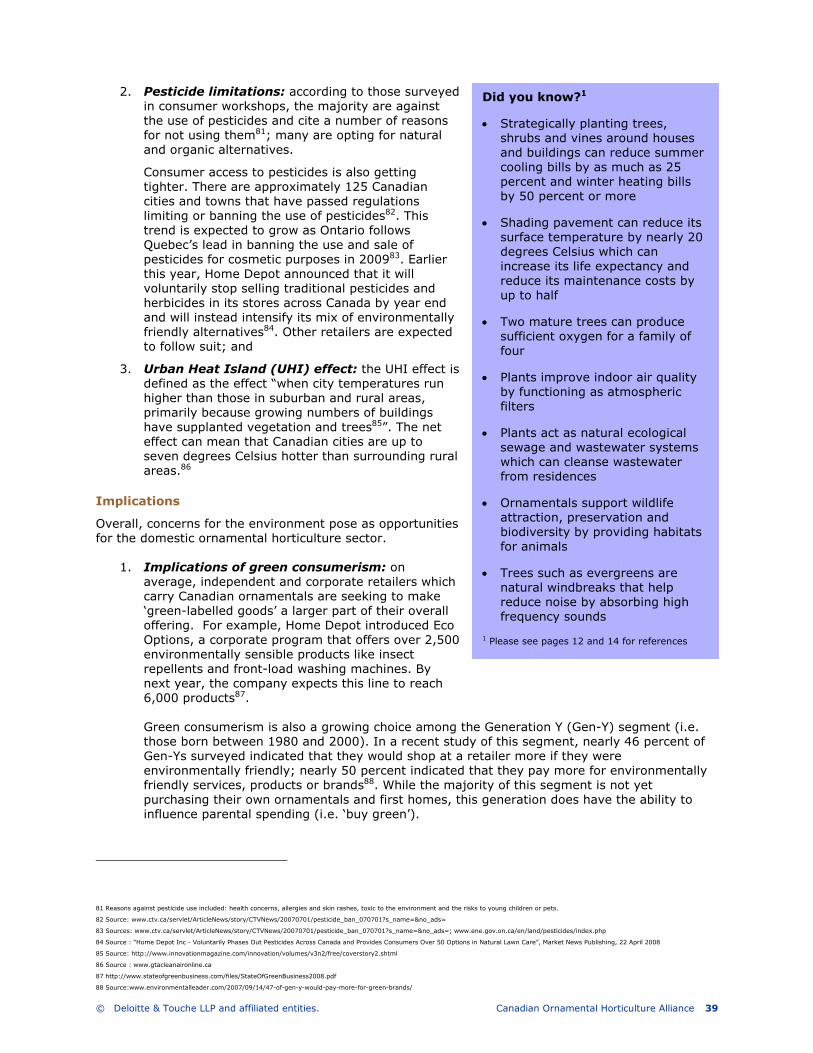
© Deloitte & Touche LLP and affiliated entities. Canadian Ornamental Horticulture Alliance 39
2. Pesticide limitations: according to those surveyed in consumer workshops, the majority are against the use of pesticides and cite a number of reasons for not using them81; many are opting for natural and organic alternatives.
Consumer access to pesticides is also getting tighter. There are approximately 125 Canadian cities and towns that have passed regulations limiting or banning the use of pesticides82. This trend is expected to grow as Ontario follows Quebec’s lead in banning the use and sale of pesticides for cosmetic purposes in 200983. Earlier this year, Home Depot announced that it will voluntarily stop selling traditional pesticides and herbicides in its stores across Canada by year end and will instead intensify its mix of environmentally friendly alternatives84. Other retailers are expected to follow suit; and
3. Urban Heat Island (UHI) effect: the UHI effect is defined as the effect “when city temperatures run higher than those in suburban and rural areas, primarily because growing numbers of buildings have supplanted vegetation and trees85”. The net effect can mean that Canadian cities are up to seven degrees Celsius hotter than surrounding rural areas.86
Implications
Overall, concerns for the environment pose as opportunities for the domestic ornamental horticulture sector.
1. Implications of green consumerism: on average, independent and corporate retailers which carry Canadian ornamentals are seeking to make ‘green-labelled goods’ a larger part of their overall offering. For example, Home Depot introduced Eco Options, a corporate program that offers over 2,500 environmentally sensible products like insect repellents and front-load washing machines. By next year, the company expects this line to reach 6,000 products87.
Green consumerism is also a growing choice among the Generation Y (Gen-Y) segment (i.e. those born between 1980 and 2000). In a recent study of this segment, nearly 46 percent of Gen-Ys surveyed indicated that they would shop at a retailer more if they were environmentally friendly; nearly 50 percent indicated that they pay more for environmentally friendly services, products or brands88. While the majority of this segment is not yet purchasing their own ornamentals and first homes, this generation does have the ability to influence parental spending (i.e. ‘buy green’).
81 Reasons against pesticide use included: health concerns, allergies and skin rashes, toxic to the environment and the risks to young children or pets.
82 Source: www.ctv.ca/servlet/ArticleNews/story/CTVNews/20070701/pesticide_ban_070701?s_name=&no_ads=
83 Sources: www.ctv.ca/servlet/ArticleNews/story/CTVNews/20070701/pesticide_ban_070701?s_name=&no_ads=; www.ene.gov.on.ca/en/land/pesticides/index.php
84 Source : “Home Depot Inc - Voluntarily Phases Out Pesticides Across Canada and Provides Consumers Over 50 Options in Natural Lawn Care”, Market News Publishing, 22 April 2008
85 Source: http://www.innovationmagazine.com/innovation/volumes/v3n2/free/coverstory2.shtml
86 Source : www.gtacleanaironline.ca 87 http://www.stateofgreenbusiness.com/files/StateOfGreenBusiness2008.pdf
88 Source:www.environmentalleader.com/2007/09/14/47-of-gen-y-would-pay-more-for-green-brands/
Did you know?1
• Strategically planting trees, shrubs and vines around houses and buildings can reduce summer cooling bills by as much as 25 percent and winter heating bills by 50 percent or more
• Shading pavement can reduce its surface temperature by nearly 20 degrees Celsius which can increase its life expectancy and reduce its maintenance costs by up to half
• Two mature trees can produce sufficient oxygen for a family of four
• Plants improve indoor air quality by functioning as atmospheric filters
• Plants act as natural ecological sewage and wastewater systems which can cleanse wastewater from residences
• Ornamentals support wildlife attraction, preservation and biodiversity by providing habitats for animals
• Trees such as evergreens are natural windbreaks that help reduce noise by absorbing high frequency sounds
1 Please see pages 12 and 14 for references
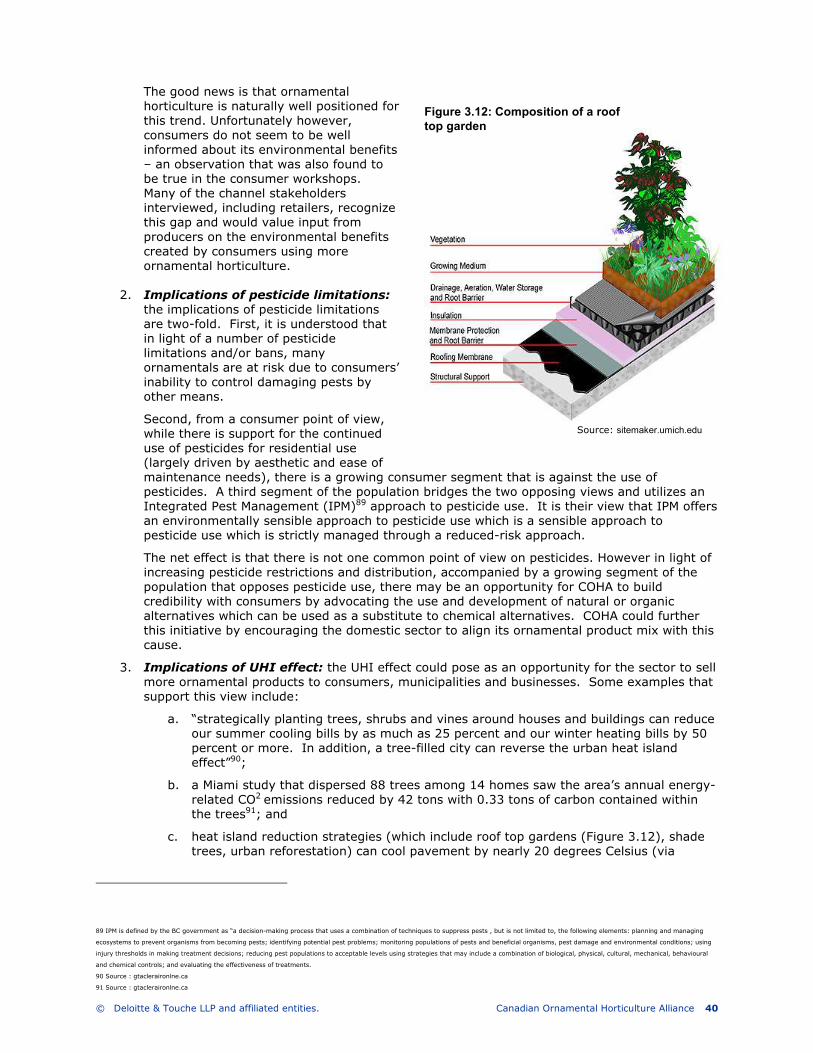
© Deloitte & Touche LLP and affiliated entities. Canadian Ornamental Horticulture Alliance 40
The good news is that ornamental horticulture is naturally well positioned for this trend. Unfortunately however, consumers do not seem to be well informed about its environmental benefits – an observation that was also found to be true in the consumer workshops. Many of the channel stakeholders interviewed, including retailers, recognize this gap and would value input from producers on the environmental benefits created by consumers using more ornamental horticulture.
2. Implications of pesticide limitations: the implications of pesticide limitations are two-fold. First, it is understood that in light of a number of pesticide limitations and/or bans, many ornamentals are at risk due to consumers’ inability to control damaging pests by other means.
Second, from a consumer point of view, while there is support for the continued use of pesticides for residential use (largely driven by aesthetic and ease of maintenance needs), there is a growing consumer segment that is against the use of pesticides. A third segment of the population bridges the two opposing views and utilizes an Integrated Pest Management (IPM)89 approach to pesticide use. It is their view that IPM offers an environmentally sensible approach to pesticide use which is a sensible approach to pesticide use which is strictly managed through a reduced-risk approach.
The net effect is that there is not one common point of view on pesticides. However in light of increasing pesticide restrictions and distribution, accompanied by a growing segment of the population that opposes pesticide use, there may be an opportunity for COHA to build credibility with consumers by advocating the use and development of natural or organic alternatives which can be used as a substitute to chemical alternatives. COHA could further this initiative by encouraging the domestic sector to align its ornamental product mix with this cause.
3. Implications of UHI effect: the UHI effect could pose as an opportunity for the sector to sell more ornamental products to consumers, municipalities and businesses. Some examples that support this view include:
a. “strategically planting trees, shrubs and vines around houses and buildings can reduce our summer cooling bills by as much as 25 percent and our winter heating bills by 50 percent or more. In addition, a tree-filled city can reverse the urban heat island effect”90;
b. a Miami study that dispersed 88 trees among 14 homes saw the area’s annual energy-related CO2 emissions reduced by 42 tons with 0.33 tons of carbon contained within the trees91; and
c. heat island reduction strategies (which include roof top gardens (Figure 3.12), shade trees, urban reforestation) can cool pavement by nearly 20 degrees Celsius (via
89 IPM is defined by the BC government as “a decision-making process that uses a combination of techniques to suppress pests , but is not limited to, the following elements: planning and managing
ecosystems to prevent organisms from becoming pests; identifying potential pest problems; monitoring populations of pests and beneficial organisms, pest damage and environmental conditions; using
injury thresholds in making treatment decisions; reducing pest populations to acceptable levels using strategies that may include a combination of biological, physical, cultural, mechanical, behavioural
and chemical controls; and evaluating the effectiveness of treatments.
90 Source : gtacleraironlne.ca
91 Source : gtacleraironlne.ca
Source: sitemaker.umich.edu
Figure 3.12: Composition of a roof top garden
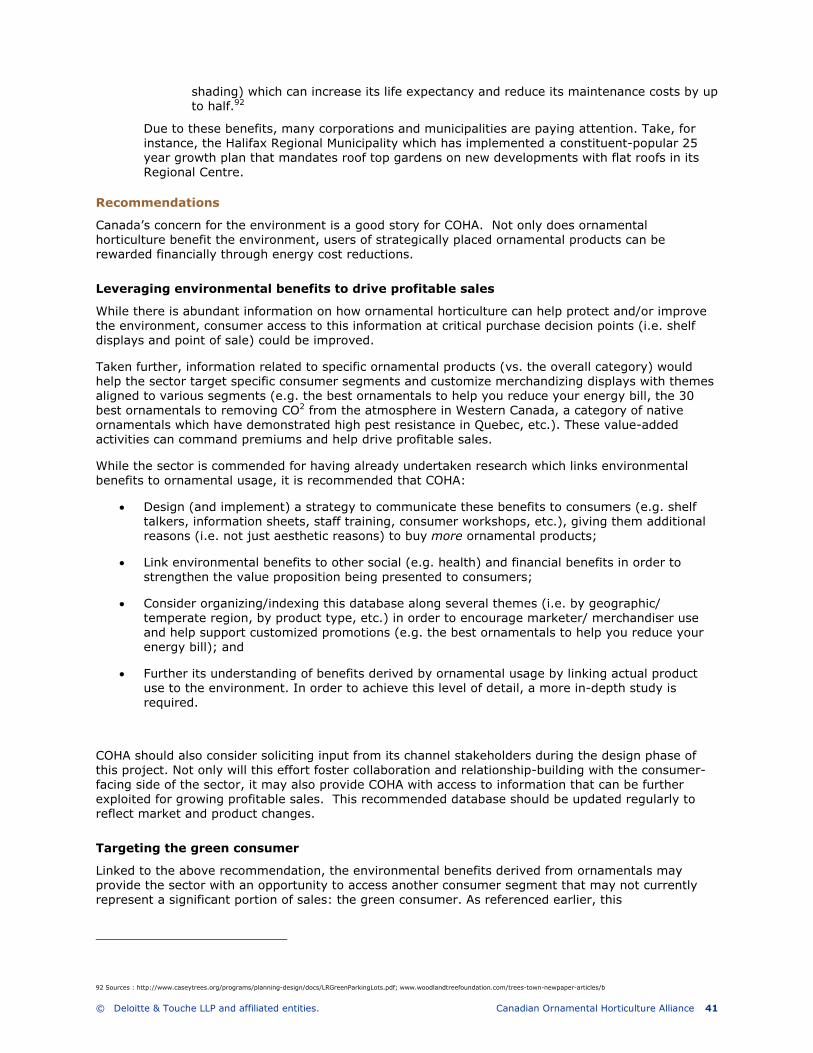
© Deloitte & Touche LLP and affiliated entities. Canadian Ornamental Horticulture Alliance 41
shading) which can increase its life expectancy and reduce its maintenance costs by up to half.92
Due to these benefits, many corporations and municipalities are paying attention. Take, for instance, the Halifax Regional Municipality which has implemented a constituent-popular 25 year growth plan that mandates roof top gardens on new developments with flat roofs in its Regional Centre.
Recommendations
Canada’s concern for the environment is a good story for COHA. Not only does ornamental horticulture benefit the environment, users of strategically placed ornamental products can be rewarded financially through energy cost reductions.
Leveraging environmental benefits to drive profitable sales
While there is abundant information on how ornamental horticulture can help protect and/or improve the environment, consumer access to this information at critical purchase decision points (i.e. shelf displays and point of sale) could be improved.
Taken further, information related to specific ornamental products (vs. the overall category) would help the sector target specific consumer segments and customize merchandizing displays with themes aligned to various segments (e.g. the best ornamentals to help you reduce your energy bill, the 30 best ornamentals to removing CO2 from the atmosphere in Western Canada, a category of native ornamentals which have demonstrated high pest resistance in Quebec, etc.). These value-added activities can command premiums and help drive profitable sales.
While the sector is commended for having already undertaken research which links environmental benefits to ornamental usage, it is recommended that COHA:
• Design (and implement) a strategy to communicate these benefits to consumers (e.g. shelf talkers, information sheets, staff training, consumer workshops, etc.), giving them additional reasons (i.e. not just aesthetic reasons) to buy more ornamental products;
• Link environmental benefits to other social (e.g. health) and financial benefits in order to strengthen the value proposition being presented to consumers;
• Consider organizing/indexing this database along several themes (i.e. by geographic/ temperate region, by product type, etc.) in order to encourage marketer/ merchandiser use and help support customized promotions (e.g. the best ornamentals to help you reduce your energy bill); and
• Further its understanding of benefits derived by ornamental usage by linking actual product use to the environment. In order to achieve this level of detail, a more in-depth study is required.
COHA should also consider soliciting input from its channel stakeholders during the design phase of this project. Not only will this effort foster collaboration and relationship-building with the consumer-facing side of the sector, it may also provide COHA with access to information that can be further exploited for growing profitable sales. This recommended database should be updated regularly to reflect market and product changes.
Targeting the green consumer
Linked to the above recommendation, the environmental benefits derived from ornamentals may provide the sector with an opportunity to access another consumer segment that may not currently represent a significant portion of sales: the green consumer. As referenced earlier, this
92 Sources : http://www.caseytrees.org/programs/planning-design/docs/LRGreenParkingLots.pdf; www.woodlandtreefoundation.com/trees-town-newpaper-articles/b

© Deloitte & Touche LLP and affiliated entities. Canadian Ornamental Horticulture Alliance 42
environmentally-conscience segment is growing in size and may offer a premium for goods and services if the environmental benefit is clear.
According to the International Institute for Sustainable Development, the following can assist COHA and the sector in targeting this consumer segment. In general, the green consumer:
1. doesn’t expect perfection from companies, only substantive effort and commitment to change;
2. has a growing commitment to green living and wants an integrated lifestyle where chores are made easier and more efficient;
3. tends to distrust environmental claims that are not independently verified;
4. lacks environmental knowledge but is eager to learn;
5. wants an easy solution that doesn’t entail significant effort or funds;
6. tends to overstate their green behaviour; and
7. is more likely to be a woman, higher income individual or teenager that can influence his/her parents.
There are a number of other environmental benefits that were identified in the research conducted which can be of assistance to COHA and the sector vis-à-vis awareness and promotion campaigns.
• a tree can produce 260 pounds of oxygen per year;
• two mature trees can produce sufficient oxygen for a family of four;
• plants improve indoor air quality by functioning as atmospheric filters;
• plants act as natural ecological sewage and wastewater systems which can cleanse wastewater from residences;
• ornamentals support wildlife attraction, preservation and biodiversity by providing habitats for animals; and
• trees such as evergreens are natural windbreaks that help reduce noise by absorbing high frequency sounds93.
Leveraging Gen-Y
There is an opportunity for the sector to leverage a portion of the Gen-Y segment which demonstrates environmental concern and is willing to pay a premium for such benefits to drive sales. More specifically, the sector could engage ‘pull’ marketing strategies that are designed to indirectly drive sales through older generations vis-à-vis the influence of Gen-Y. By proactively informing the Gen-Y segment of the environmental benefits derived from ornamentals, Gen-Ys will in-turn encourage/influence their parents and relatives and encourage further use of ornamentals with the Gen-Y segment. These efforts will also help to drive awareness, loyalty and later, direct consumption as this segment matures.
Key consumer perceptions and preferences
As part of the research process undertaken, four consumer workshops were conducted that targeted amateur and enthusiastic gardeners/consumers94 in an effort to better understand some of the commonly held perceptions and preferences of this group. The outcomes of these workshops have provided a number of insights to this project. The commentary below is based upon workshop
93 Source : “Literature Review of Documented Health and Environmental Benefits Derived from Ornamental Horticulture Products”, George Morris Centre. 94 Four consumer groups were conducted in the Fall of 2008 in BC and QC. Discussion group participants were segmented (“Amateur gardeners” and “Enthusiastic gardeners”) along a series of criterion:
own or rent a detached home, a semi-detached home, or a town/row house; have a garden that requires care for garden themselves; responsible for maintenance of garden, on a scale of 1-5, all must
rate themselves a ‘4’ or ‘5’ in terms of their own enjoyment of gardening and purchased at least one of plants, flowers, trees or shrubs in the past 12 months.

© Deloitte & Touche LLP and affiliated entities. Canadian Ornamental Horticulture Alliance 43
findings and interviews with nearly 30 channel stakeholders (i.e. retailers, wholesalers, landscapers, etc.) across Canada.
1. Indoor gardening ≠ outdoor gardening: according to workshop participants, gardeners primarily associate ‘gardening’ with outdoor greenery (i.e. plants, trees, flowers, shrubs, lawn, fruit, vegetables, herbs, weeds). Outdoor gardening is viewed to be enjoyable and a great source of pride. Conversely, indoor gardening does not have same appeal as most surveyed view indoor gardening as a “chore” and it ultimately provides considerably less enjoyment (vs. outdoor).
2. Appearance and ease of maintenance key sales drivers: pricing and origin do not seem to be primary factors considered when making purchasing decisions. As long as consumers feel that they are getting comparable prices, pricing was not identified as a major purchasing criterion.
Unlike indoor ornamentals, the origin of outdoor ornamentals does not seem to be of concern to gardeners as most of those surveyed assumed that all outdoor ornamentals are grown domestically. That said, it should also be noted that there seems to be a degree of scepticism as to where products labelled “Product of Canada” are grown. Many consumers are seeking assurances that their purchases are actually “grown” in Canada.
Origin is an issue for indoor ornamentals as most are thought to be tropical and therefore not ideally suited for indoor climates and/or may present the risk of pest infestations. By contrast, the origin of outdoor ornamentals is top of mind for various channel stakeholders who seek out regional products that are well suited to regional climates.
Consumers place appearance (which includes colour, shape and maturity size and is often used interchangeably with quality) and ease of maintenance as the two leading factors in determining their purchase decision. Fragrance and environmental benefits were not revealed as key purchasing considerations.
3. Water restrictions and drought-resistant products may not be top of mind for some regions: according to consumers interviewed in BC and Quebec, there is little to no concern surrounding water restrictions. Consequently, most did not value drought resistant ornamentals, primarily because they had difficulty conceptualizing the need in light of recent weather patterns. These attitudes may however be localized and not representative of the broader Canada.
According to a survey conducted by the University of Illinois, supported by some channel stakeholders, drought-resistant ornamentals are viewed as an emerging trend which plays well with consumer demands for care-free/low-maintenance landscapes.95
4. Gardeners sceptical of grading standards: the Canadian ornamental horticulture sector does not currently have any formal quality standards – either regionally or nationally.
While COHA may have some support for introducing standards, it would have to address a number of challenges prior to implementing any such program. For instance, some consumers surveyed do not see the merit in a program of this nature, adding that such grades would be viewed as secondary to the physical appearance of an ornamental product. It was also mentioned that purchases from some retailers (e.g. garden centres, nurseries) typically come with a guarantee, making quality grading unnecessary. Finally, others expressed a considerable degree of skepticism about how the grading process would work and the criteria used to determine quality grades.
Implications
1. Implications of indoor gardening ≠ outdoor gardening: two potential implications have been identified which may result from consumers viewing indoor and outdoor gardening differently. First, indoor plants may be less attractive to consumers than outdoor plants. Consequently, both the prices realized and the product volume sold may be lower than
95 Source: Extension, http://www.extension.org/pages/Report+Reveals+Environmental+Trends+in+Illinois+Green+Industry, Released April 19, 2007
© Deloitte & Touche LLP and affiliated entities. Canadian Ornamental Horticulture Alliance 44
expected. Second, the marketing strategies applied to drive outdoor ornamental sales may not apply to indoor ornamentals. Consequently, promotional campaigns designed to grow domestic ornamental sales may require a segmented approach: outdoor and indoor.
2. Implications of appearance and ease of maintenance key sales drivers: as appearance and ease of maintenance are the two key factors sought by consumers today, these factors will also be key mechanisms from which the sector can grow profitably. COHA also has an opportunity to demonstrate other advantages consumers can derive from ornamental products including health and environmental benefits to drive profitable sales.
3. Implications of water restrictions and drought-resistant products may not be top of mind for some regions: water restrictions and drought-resistant products were not top of mind issues for the consumers surveyed in BC and Quebec. Consequently, the marketability of drought-resistant ornamentals to consumers may be weaker than in regions that have more restricted access to water.
4. Implications of gardeners sceptical of grading standards: the void of regulated and recognized grading standards may have a significant opportunity cost to the sector in the form of lost sales.
Currently, a significant gap to promoting domestic ornamental products lies in the sector’s inability to effectively brand its products. This gap has two consequences. First, many products are homogenized/ commoditized which leaves consumers confused as to product origin (i.e. they would purchase Canadian if given the choice). Second, as appearance is the leading sales driver, grower investments in product quality are not always rewarded. Consumers struggle to justify premiums when visual differentiation is difficult.
The lack of a recognized grading standard may also be compromising exports, particularly for the floriculture sub-sector which exports nearly 10 percent of its product annually. If product quality is inconsistent from region to region, foreign buyers may seek other jurisdictions to source product.
COHA too lacks identity and brand credibility. The introduction of a Canadian brand standard (segmented regionally) may help to bridge the aforementioned gaps and provide the consumer an opportunity to become brand loyal (i.e. buy Canadian products quality assured by COHA).
Finally, consideration should also be given to the signalling shown in the consumer workshops: if consumers do not perceive value in grading standards they will unlikely pay more for products with quality standards. Thus, increasing prices to offset the costs of implementing national standards may consequently decrease consumption and/or market share. If such a program were to be implemented, the sector may be ultimately responsible for its costs.
Recommendations
The following recommendations are made in reflection upon the discussion above:
1. Promotional campaigns designed to grow domestic ornamental sales may require a segmented approach. More specifically, strategies employed to sell outdoor and indoor ornamentals may need to be customized to the individual categories. Prior to adopting a segmented approach, COHA should first validate the assumption that consumers view indoor ornamentals differently than outdoor ornamentals. Alternatively, COHA could trial this assumption through a pilot program.
2. A feasibility study should be conducted to review the cost-benefit of implementing a regulated grading standard program. An examination of international comparables should be included as part of this study.
3. Appearance and ease of maintenance benefits are well aligned to today’s Generation X. These individuals, born between 1968 and 1979, are in prime child-rearing years and are generally faced with a shortage of leisure time that can be allocated to activities like gardening. This segment also values the appearance of a well-landscaped yard. As one retailer surveyed indicated, this segment is interested in ‘outdoor decorating, not outdoor gardening’.
© Deloitte & Touche LLP and affiliated entities. Canadian Ornamental Horticulture Alliance 45
COHA may consider addressing this segment through mainstream sources of media like HGTV, Home and Garden, Canadian Living and Chatelaine. Through these sources, encourage consumption through the promotion of ornamentals that are highly attractive and easy to maintain. As a value added service, consider linking these promotions to a COHA website which offers free ‘canned designs’ outlining proven landscape designs (including information as to which ornamentals to purchase/plant) for a variety of lot sizes and under a variety of zone/sun conditions.
4. For drought-resistant products, by correlating Canada’s largest cities to their average annual precipitation (Figure 3.13), insights may be drawn as to where these products could be marketed and their premiums justified.
Figure 3.13: Canada’s largest cities to their average annual precipitation
Source: Environment Canada, Statistics Canada; Deloitte analysis
5. Further, the benefits of drought-resistant ornamentals should also be marketed to channel stakeholders. The leading reason cited for shrinkage by these stakeholders was improper watering. By demonstrating (i.e. cost/benefit) the increased ease of maintenance (i.e. lower labour costs), improved survivability and improved shelf appearance, producers may be able to seek higher margins from channel stakeholders – even within regions where consumers see little to no value in these products.
6. Further consumer analytics (outside the scope of this engagement) should be conducted to determine the relative size and growth trends of target consumer segments. In doing so, the sector can become better informed of existing consumer segments and target those segments accordingly.
7. Promote the health benefits of gardening - especially to the baby boomer segment. As discussed in a prior section, improving consumer access to this information at critical purchase decision points (i.e. shelf displays and point of sale) will help drive sales. For example:
a. working in the garden for 45 minutes can burn the same number of calories as 30 minutes of aerobics or jogging96;
b. The Heart and Stroke Foundation endorses gardening as a physical activity that can help prolong health and life – especially for the senior population97;
c. the presence of plants help people reduce stress and increase productivity98. In addition, a view of a natural scene through a window can improve recovery rates in hospitals and reduce prisoner stress in prisons99; and
96 Source: Public Health Agency of Canada, http://www.phac-aspc.gc.ca/pau-uap/paguide/gardening.html
97 Source: Heart and Stroke Foundation, http://www.heartandstroke.com/site/c.ikIQLcMWJtE/b.3484257/
-
1
2
3
4
5
6
-2004006008001,0001,200
Average annual precipitation (mm)
Population (millions)
Montreal
Vancouver
Quebec City WinnipegHamiltonLondon KW
Toronto
Most attractive CDN cities to target drought-resistant ornamentals
Ottaw a CalgaryEdmonton

© Deloitte & Touche LLP and affiliated entities. Canadian Ornamental Horticulture Alliance 46
d. Horticulture therapy (a formalized therapy) has been shown to reduce physical pain, improve memory and concentration, ease emotional pain from bereavement or abuse and encourage social interaction100.
98 Source: George Morris Centre: literature review of documented health and environmental benefits derived from ornamental horticulture products, page 27
99 Source: George Morris Centre: literature review of documented health and environmental benefits derived from ornamental horticulture products, page 30
100 Source : University of Florida, IFAS extension: http://edis.ifas.ufl.edu/EP145

© Deloitte & Touche LLP and affiliated entities. Canadian Ornamental Horticulture Alliance 47
4. Sector channel assessment
Summary
• There are four main channels of distribution used by the sector today: retail, wholesale and resale, direct and other. The retail channel is the sector’s most significant channel today (40 percent), followed by the wholesale and resale channel (37 percent). Direct sales and other sales follow at 13 percent and 10 percent, respectively.
• Sector exports, which include re-exports101, have declined significantly (approximately $135 million or 28 percent) since 2003 to a current total of $340 million (2007)102103.
Floriculture exports represent about 10 percent of their overall farm gate gross receipts. As the Canadian dollar has appreciated in value vis-à-vis the US dollar over the past three years, floriculture exports have declined each year.
• Nursery and garden centre outlets are on the rise and their growth has outpaced that of key mass merchant, big box and large format retailers. Today, it is estimated that there are over 9,000 retail outlets (including florists), across Canada that carry ornamental products.
• A number of producer challenges are identified and discussed in this report; including some support illustrating regional producers being adversely impacted by centralized buying practices.
• Perspectives of several channel stakeholders are also examined along a number of key considerations or “value drivers”. A number of gaps are identified and prioritized with key insights drawn.
• Finally, a series of leading growth opportunities were identified through discussions with a number of channel stakeholders from across Canada and are outlined in this report. The report then concludes with a number of recommended options for COHA to consider, including: further emphasis as to the sector’s need for innovation; why national standards are worth exploring further, improving account management to generate profitable sales and an opportunity for producers to work with buyers to improve their margins through enhancing their “value proposition” in ways unrelated to pricing.
Notice to reader
The export figures used in this report are from Statistics Canada’s "GH, Sod and Nursery Industries" report (22-202-XIB). New data was identified during the final stages of this report that the reader should be aware of. Statistics Canada’s 22-202-XIB reports only floriculture exports for 2007 which are valued at approximately ~$130 million (Figure 4.4 below); export figures for nursery, sod and Christmas trees were not reported (nursery exports are now believed to be aggregated under an ‘other’ category). By contrast, a December 2008 report commissioned by COHA which utilizes Harmonized System (HS) codes from Industry Canada reveals exports in excess of $330 million. This figure is believed to be more reflective of sector exports as it is driven by actual cross-border traffic.
Disaggregation of the HS code export data, with the exception of Christmas trees ($27.7 million in 2007), is not possible due to the nature of the codes used by Industry Canada. Due to the lack of clarity as to what both the Statistics Canada’s 22-202-XIB report and Industry Canada data are comprised of, nursery estimates were not derived from simply subtracting the floriculture export data (22-202-XIB report) from the sector data (HS code data).
101 Re-exports refer to goods that are first imported and then subsequently exported without any significant value-added enhancements made to them.
102 Source: Report to COHA from Cindy Rose (December 2008) using Industry Canada data
103 Note: these export figures reflect data from Industry Canada utilizing Harmonized System (HS) Codes. Disaggregation of this export data, with the exception of Christmas trees, is not possible due
to the HS codes used by Industry Canada.
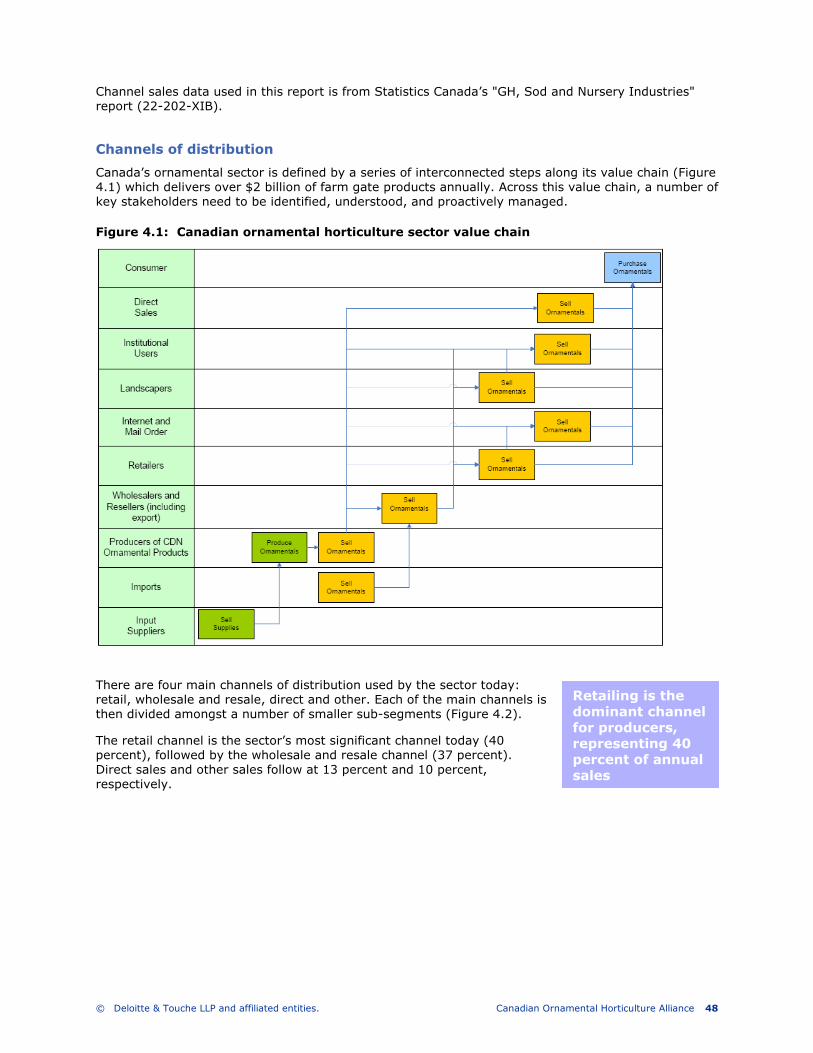
© Deloitte & Touche LLP and affiliated entities. Canadian Ornamental Horticulture Alliance 48
Channel sales data used in this report is from Statistics Canada’s "GH, Sod and Nursery Industries" report (22-202-XIB).
Channels of distribution
Canada’s ornamental sector is defined by a series of interconnected steps along its value chain (Figure 4.1) which delivers over $2 billion of farm gate products annually. Across this value chain, a number of key stakeholders need to be identified, understood, and proactively managed.
Figure 4.1: Canadian ornamental horticulture sector value chain
There are four main channels of distribution used by the sector today: retail, wholesale and resale, direct and other. Each of the main channels is then divided amongst a number of smaller sub-segments (Figure 4.2).
The retail channel is the sector’s most significant channel today (40 percent), followed by the wholesale and resale channel (37 percent). Direct sales and other sales follow at 13 percent and 10 percent, respectively.
Retailing is the dominant channel for producers, representing 40 percent of annual sales
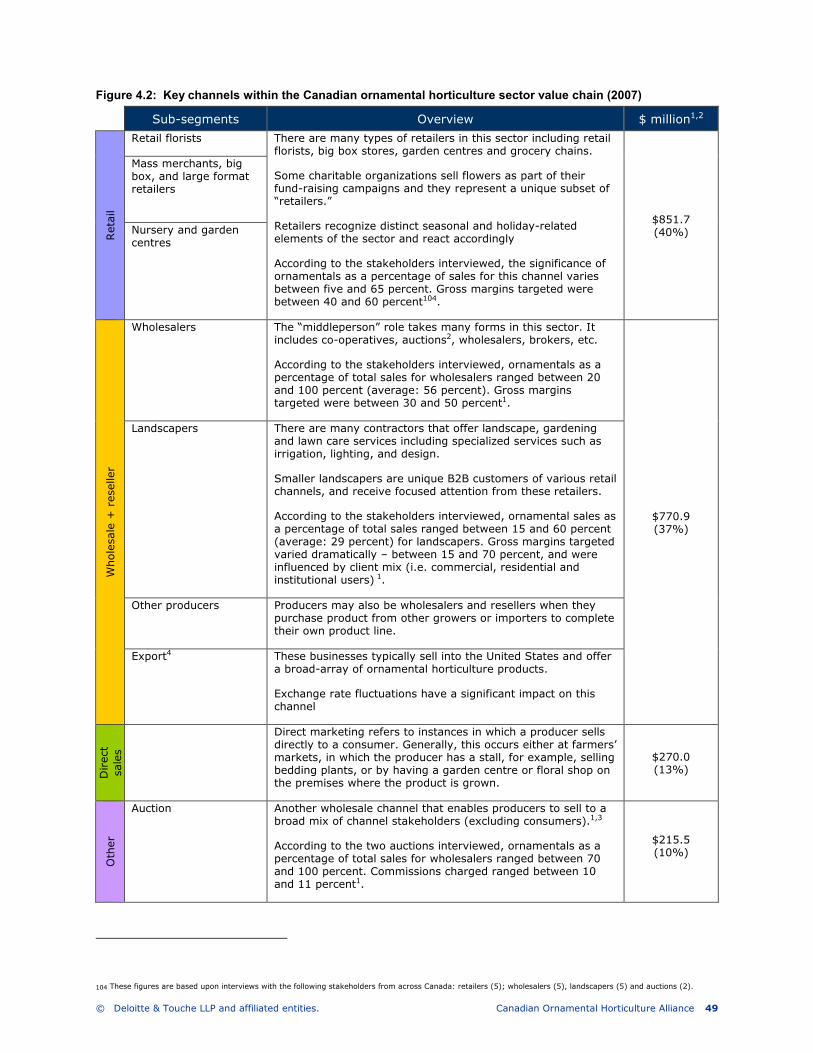
© Deloitte & Touche LLP and affiliated entities. Canadian Ornamental Horticulture Alliance 49
Figure 4.2: Key channels within the Canadian ornamental horticulture sector value chain (2007)
Sub-segments Overview $ million1,2 Retail
Retail florists There are many types of retailers in this sector including retail florists, big box stores, garden centres and grocery chains.
Some charitable organizations sell flowers as part of their fund-raising campaigns and they represent a unique subset of “retailers.”
Retailers recognize distinct seasonal and holiday-related elements of the sector and react accordingly
According to the stakeholders interviewed, the significance of ornamentals as a percentage of sales for this channel varies between five and 65 percent. Gross margins targeted were between 40 and 60 percent104.
$851.7 (40%)
Mass merchants, big box, and large format retailers
Nursery and garden centres
Wholesale + reseller
Wholesalers The “middleperson” role takes many forms in this sector. It includes co-operatives, auctions2, wholesalers, brokers, etc.
According to the stakeholders interviewed, ornamentals as a percentage of total sales for wholesalers ranged between 20 and 100 percent (average: 56 percent). Gross margins targeted were between 30 and 50 percent1.
$770.9 (37%)
Landscapers There are many contractors that offer landscape, gardening and lawn care services including specialized services such as irrigation, lighting, and design.
Smaller landscapers are unique B2B customers of various retail channels, and receive focused attention from these retailers.
According to the stakeholders interviewed, ornamental sales as a percentage of total sales ranged between 15 and 60 percent (average: 29 percent) for landscapers. Gross margins targeted varied dramatically – between 15 and 70 percent, and were influenced by client mix (i.e. commercial, residential and institutional users) 1.
Other producers Producers may also be wholesalers and resellers when they purchase product from other growers or importers to complete their own product line.
Export4 These businesses typically sell into the United States and offer a broad-array of ornamental horticulture products.
Exchange rate fluctuations have a significant impact on this channel
Direct
sales
Direct marketing refers to instances in which a producer sells directly to a consumer. Generally, this occurs either at farmers’ markets, in which the producer has a stall, for example, selling bedding plants, or by having a garden centre or floral shop on the premises where the product is grown.
$270.0 (13%)
Other
Auction Another wholesale channel that enables producers to sell to a broad mix of channel stakeholders (excluding consumers).1,3
According to the two auctions interviewed, ornamentals as a percentage of total sales for wholesalers ranged between 70 and 100 percent. Commissions charged ranged between 10 and 11 percent1.
$215.5 (10%)
104 These figures are based upon interviews with the following stakeholders from across Canada: retailers (5); wholesalers (5), landscapers (5) and auctions (2).
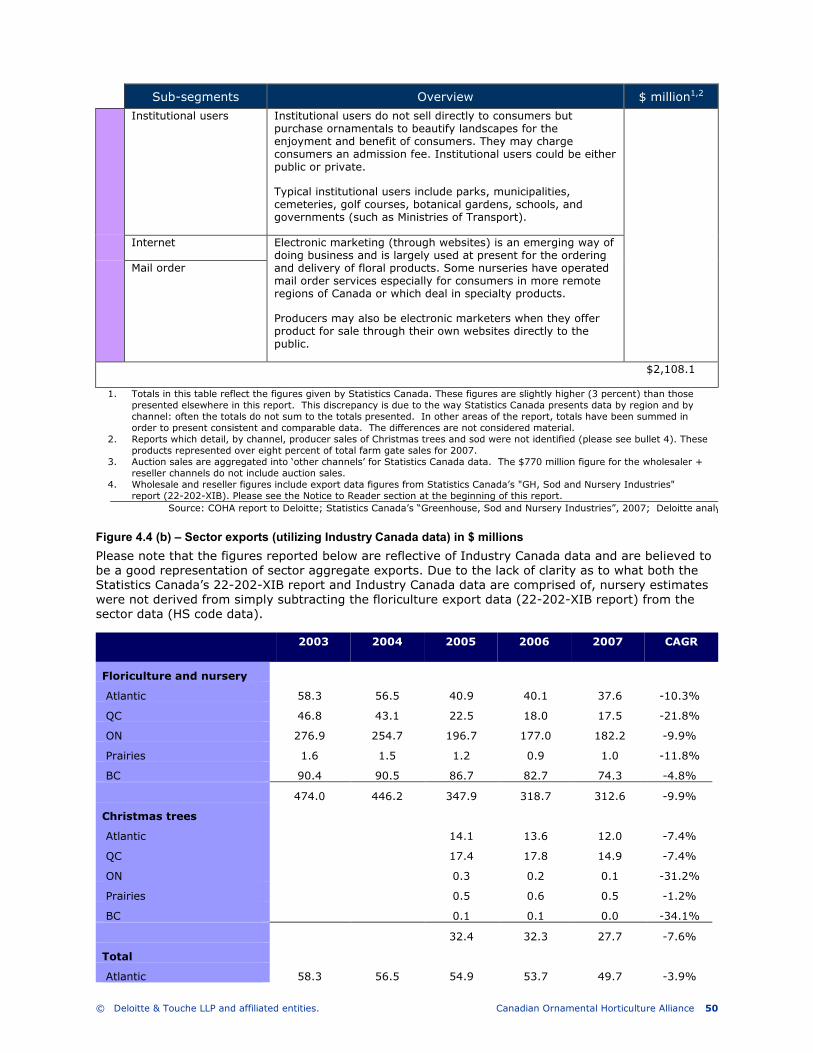
© Deloitte & Touche LLP and affiliated entities. Canadian Ornamental Horticulture Alliance 50
Sub-segments Overview $ million1,2
Institutional users Institutional users do not sell directly to consumers but purchase ornamentals to beautify landscapes for the enjoyment and benefit of consumers. They may charge consumers an admission fee. Institutional users could be either public or private.
Typical institutional users include parks, municipalities, cemeteries, golf courses, botanical gardens, schools, and governments (such as Ministries of Transport).
Internet Electronic marketing (through websites) is an emerging way of doing business and is largely used at present for the ordering and delivery of floral products. Some nurseries have operated mail order services especially for consumers in more remote regions of Canada or which deal in specialty products.
Producers may also be electronic marketers when they offer product for sale through their own websites directly to the public.
Mail order
$2,108.1
1. Totals in this table reflect the figures given by Statistics Canada. These figures are slightly higher (3 percent) than those presented elsewhere in this report. This discrepancy is due to the way Statistics Canada presents data by region and by channel: often the totals do not sum to the totals presented. In other areas of the report, totals have been summed in order to present consistent and comparable data. The differences are not considered material.
2. Reports which detail, by channel, producer sales of Christmas trees and sod were not identified (please see bullet 4). These products represented over eight percent of total farm gate sales for 2007.
3. Auction sales are aggregated into ‘other channels’ for Statistics Canada data. The $770 million figure for the wholesaler + reseller channels do not include auction sales.
4. Wholesale and reseller figures include export data figures from Statistics Canada’s "GH, Sod and Nursery Industries" report (22-202-XIB). Please see the Notice to Reader section at the beginning of this report.
Source: COHA report to Deloitte; Statistics Canada’s “Greenhouse, Sod and Nursery Industries”, 2007; Deloitte analysis
Figure 4.4 (b) – Sector exports (utilizing Industry Canada data) in $ millions
Please note that the figures reported below are reflective of Industry Canada data and are believed to be a good representation of sector aggregate exports. Due to the lack of clarity as to what both the Statistics Canada’s 22-202-XIB report and Industry Canada data are comprised of, nursery estimates were not derived from simply subtracting the floriculture export data (22-202-XIB report) from the sector data (HS code data).
2003 2004 2005 2006 2007 CAGR
Floriculture and nursery
Atlantic 58.3 56.5 40.9 40.1 37.6 -10.3%
QC 46.8 43.1 22.5 18.0 17.5 -21.8%
ON 276.9 254.7 196.7 177.0 182.2 -9.9%
Prairies 1.6 1.5 1.2 0.9 1.0 -11.8%
BC 90.4 90.5 86.7 82.7 74.3 -4.8%
474.0 446.2 347.9 318.7 312.6 -9.9%
Christmas trees
Atlantic 14.1 13.6 12.0 -7.4%
QC 17.4 17.8 14.9 -7.4%
ON 0.3 0.2 0.1 -31.2%
Prairies 0.5 0.6 0.5 -1.2%
BC 0.1 0.1 0.0 -34.1%
32.4 32.3 27.7 -7.6%
Total
Atlantic 58.3 56.5 54.9 53.7 49.7 -3.9%
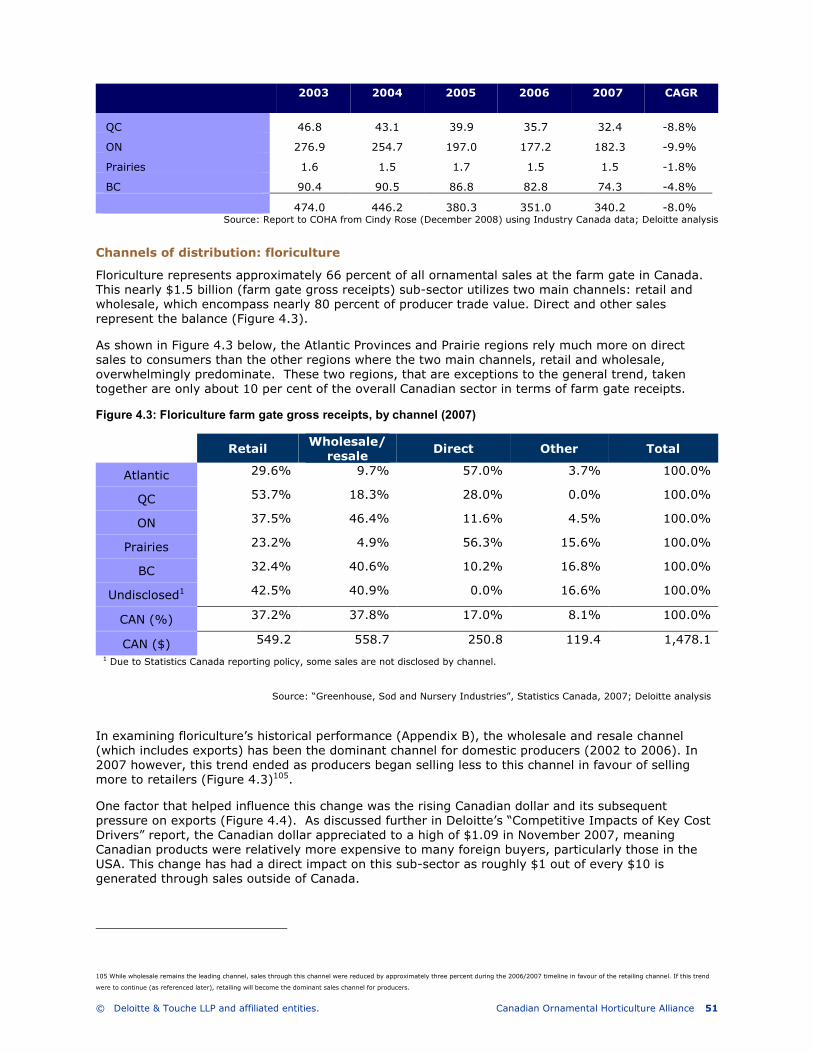
© Deloitte & Touche LLP and affiliated entities. Canadian Ornamental Horticulture Alliance 51
2003 2004 2005 2006 2007 CAGR
QC 46.8 43.1 39.9 35.7 32.4 -8.8%
ON 276.9 254.7 197.0 177.2 182.3 -9.9%
Prairies 1.6 1.5 1.7 1.5 1.5 -1.8%
BC 90.4 90.5 86.8 82.8 74.3 -4.8%
474.0 446.2 380.3 351.0 340.2 -8.0% Source: Report to COHA from Cindy Rose (December 2008) using Industry Canada data; Deloitte analysis
Channels of distribution: floriculture
Floriculture represents approximately 66 percent of all ornamental sales at the farm gate in Canada. This nearly $1.5 billion (farm gate gross receipts) sub-sector utilizes two main channels: retail and wholesale, which encompass nearly 80 percent of producer trade value. Direct and other sales represent the balance (Figure 4.3).
As shown in Figure 4.3 below, the Atlantic Provinces and Prairie regions rely much more on direct sales to consumers than the other regions where the two main channels, retail and wholesale, overwhelmingly predominate. These two regions, that are exceptions to the general trend, taken together are only about 10 per cent of the overall Canadian sector in terms of farm gate receipts.
Figure 4.3: Floriculture farm gate gross receipts, by channel (2007)
Retail Wholesale/ resale
Direct Other Total
Atlantic 29.6% 9.7% 57.0% 3.7% 100.0%
QC 53.7% 18.3% 28.0% 0.0% 100.0%
ON 37.5% 46.4% 11.6% 4.5% 100.0%
Prairies 23.2% 4.9% 56.3% 15.6% 100.0%
BC 32.4% 40.6% 10.2% 16.8% 100.0%
Undisclosed1 42.5% 40.9% 0.0% 16.6% 100.0%
CAN (%) 37.2% 37.8% 17.0% 8.1% 100.0%
CAN ($) 549.2 558.7 250.8 119.4 1,478.1 1 Due to Statistics Canada reporting policy, some sales are not disclosed by channel.
Source: “Greenhouse, Sod and Nursery Industries”, Statistics Canada, 2007; Deloitte analysis
In examining floriculture’s historical performance (Appendix B), the wholesale and resale channel (which includes exports) has been the dominant channel for domestic producers (2002 to 2006). In 2007 however, this trend ended as producers began selling less to this channel in favour of selling more to retailers (Figure 4.3)105.
One factor that helped influence this change was the rising Canadian dollar and its subsequent pressure on exports (Figure 4.4). As discussed further in Deloitte’s “Competitive Impacts of Key Cost Drivers” report, the Canadian dollar appreciated to a high of $1.09 in November 2007, meaning Canadian products were relatively more expensive to many foreign buyers, particularly those in the USA. This change has had a direct impact on this sub-sector as roughly $1 out of every $10 is generated through sales outside of Canada.
105 While wholesale remains the leading channel, sales through this channel were reduced by approximately three percent during the 2006/2007 timeline in favour of the retailing channel. If this trend
were to continue (as referenced later), retailing will become the dominant sales channel for producers.
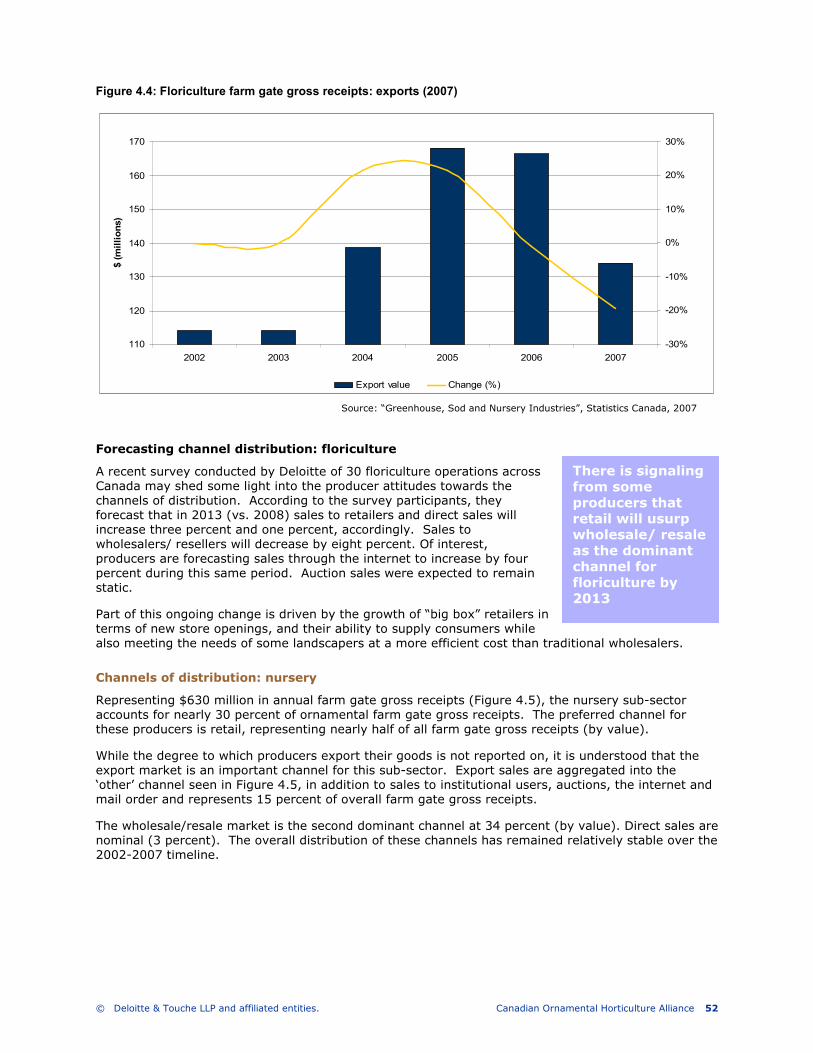
© Deloitte & Touche LLP and affiliated entities. Canadian Ornamental Horticulture Alliance 52
Figure 4.4: Floriculture farm gate gross receipts: exports (2007)
Forecasting channel distribution: floriculture
A recent survey conducted by Deloitte of 30 floriculture operations across Canada may shed some light into the producer attitudes towards the channels of distribution. According to the survey participants, they forecast that in 2013 (vs. 2008) sales to retailers and direct sales will increase three percent and one percent, accordingly. Sales to wholesalers/ resellers will decrease by eight percent. Of interest, producers are forecasting sales through the internet to increase by four percent during this same period. Auction sales were expected to remain static.
Part of this ongoing change is driven by the growth of “big box” retailers in terms of new store openings, and their ability to supply consumers while also meeting the needs of some landscapers at a more efficient cost than traditional wholesalers.
Channels of distribution: nursery
Representing $630 million in annual farm gate gross receipts (Figure 4.5), the nursery sub-sector accounts for nearly 30 percent of ornamental farm gate gross receipts. The preferred channel for these producers is retail, representing nearly half of all farm gate gross receipts (by value).
While the degree to which producers export their goods is not reported on, it is understood that the export market is an important channel for this sub-sector. Export sales are aggregated into the ‘other’ channel seen in Figure 4.5, in addition to sales to institutional users, auctions, the internet and mail order and represents 15 percent of overall farm gate gross receipts.
The wholesale/resale market is the second dominant channel at 34 percent (by value). Direct sales are nominal (3 percent). The overall distribution of these channels has remained relatively stable over the 2002-2007 timeline.
110
120
130
140
150
160
170
2002 2003 2004 2005 2006 2007
$ (millions)
-30%
-20%
-10%
0%
10%
20%
30%
Export value Change (%)
Source: “Greenhouse, Sod and Nursery Industries”, Statistics Canada, 2007
There is signaling from some producers that retail will usurp wholesale/ resale as the dominant channel for floriculture by 2013
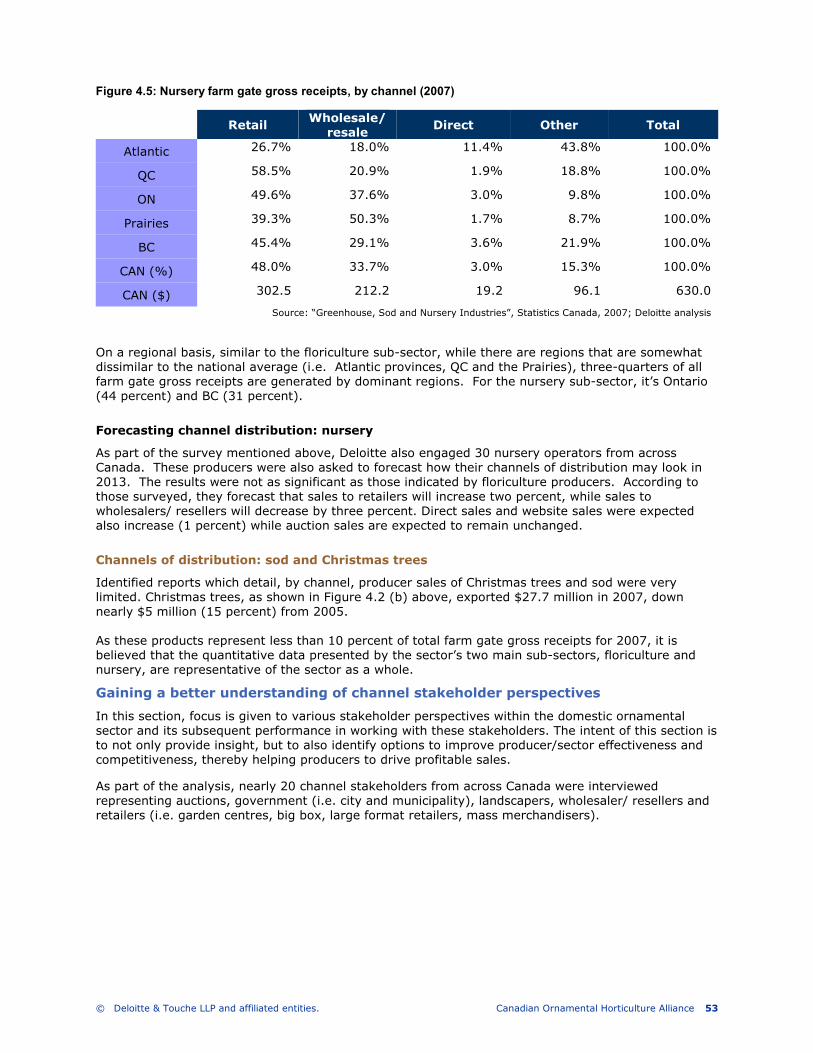
© Deloitte & Touche LLP and affiliated entities. Canadian Ornamental Horticulture Alliance 53
Figure 4.5: Nursery farm gate gross receipts, by channel (2007)
Retail Wholesale/ resale
Direct Other Total
Atlantic 26.7% 18.0% 11.4% 43.8% 100.0%
QC 58.5% 20.9% 1.9% 18.8% 100.0%
ON 49.6% 37.6% 3.0% 9.8% 100.0%
Prairies 39.3% 50.3% 1.7% 8.7% 100.0%
BC 45.4% 29.1% 3.6% 21.9% 100.0%
CAN (%) 48.0% 33.7% 3.0% 15.3% 100.0%
CAN ($) 302.5 212.2 19.2 96.1 630.0
Source: “Greenhouse, Sod and Nursery Industries”, Statistics Canada, 2007; Deloitte analysis
On a regional basis, similar to the floriculture sub-sector, while there are regions that are somewhat dissimilar to the national average (i.e. Atlantic provinces, QC and the Prairies), three-quarters of all farm gate gross receipts are generated by dominant regions. For the nursery sub-sector, it’s Ontario (44 percent) and BC (31 percent).
Forecasting channel distribution: nursery
As part of the survey mentioned above, Deloitte also engaged 30 nursery operators from across Canada. These producers were also asked to forecast how their channels of distribution may look in 2013. The results were not as significant as those indicated by floriculture producers. According to those surveyed, they forecast that sales to retailers will increase two percent, while sales to wholesalers/ resellers will decrease by three percent. Direct sales and website sales were expected also increase (1 percent) while auction sales are expected to remain unchanged.
Channels of distribution: sod and Christmas trees
Identified reports which detail, by channel, producer sales of Christmas trees and sod were very limited. Christmas trees, as shown in Figure 4.2 (b) above, exported $27.7 million in 2007, down nearly $5 million (15 percent) from 2005. As these products represent less than 10 percent of total farm gate gross receipts for 2007, it is believed that the quantitative data presented by the sector’s two main sub-sectors, floriculture and nursery, are representative of the sector as a whole.
Gaining a better understanding of channel stakeholder perspectives
In this section, focus is given to various stakeholder perspectives within the domestic ornamental sector and its subsequent performance in working with these stakeholders. The intent of this section is to not only provide insight, but to also identify options to improve producer/sector effectiveness and competitiveness, thereby helping producers to drive profitable sales.
As part of the analysis, nearly 20 channel stakeholders from across Canada were interviewed representing auctions, government (i.e. city and municipality), landscapers, wholesaler/ resellers and retailers (i.e. garden centres, big box, large format retailers, mass merchandisers).
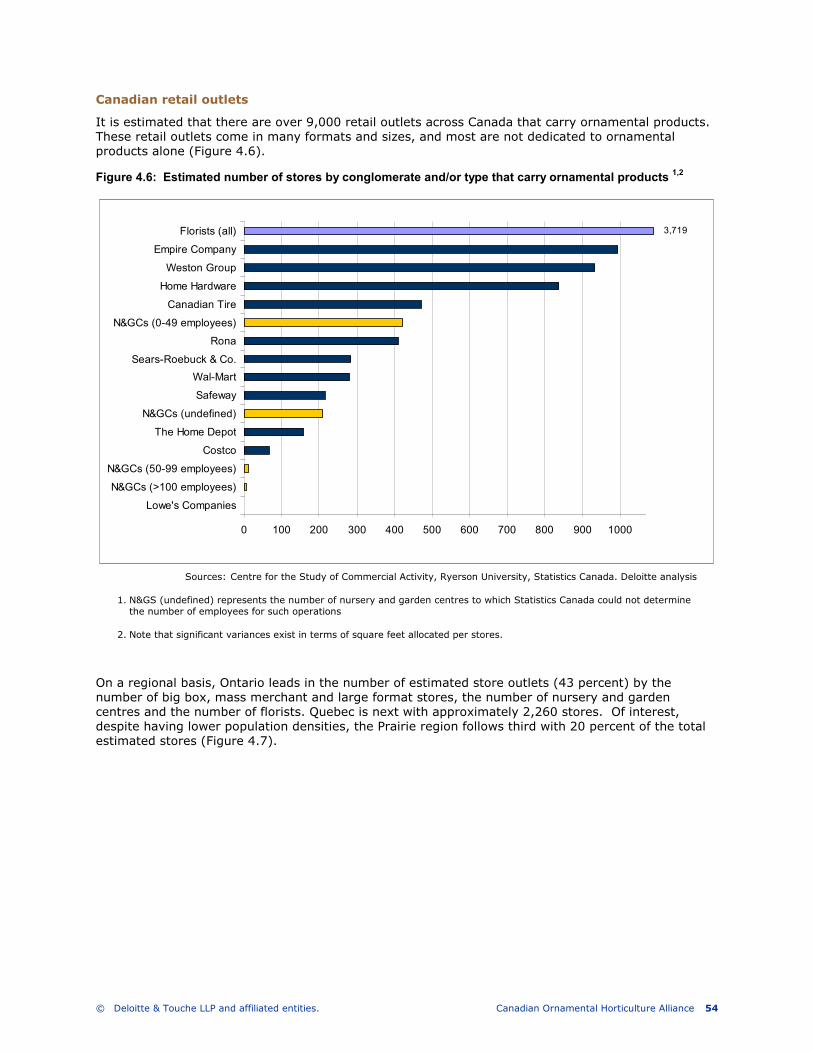
© Deloitte & Touche LLP and affiliated entities. Canadian Ornamental Horticulture Alliance 54
Canadian retail outlets
It is estimated that there are over 9,000 retail outlets across Canada that carry ornamental products. These retail outlets come in many formats and sizes, and most are not dedicated to ornamental products alone (Figure 4.6).
Figure 4.6: Estimated number of stores by conglomerate and/or type that carry ornamental products 1,2
On a regional basis, Ontario leads in the number of estimated store outlets (43 percent) by the number of big box, mass merchant and large format stores, the number of nursery and garden centres and the number of florists. Quebec is next with approximately 2,260 stores. Of interest, despite having lower population densities, the Prairie region follows third with 20 percent of the total estimated stores (Figure 4.7).
0 100 200 300 400 500 600 700 800 900 1000 1100
Lowe's Companies
N&GCs (>100 employees)
N&GCs (50-99 employees)
Costco
The Home Depot
N&GCs (undefined)
Safeway
Wal-Mart
Sears-Roebuck & Co.
Rona
N&GCs (0-49 employees)
Canadian Tire
Home Hardware
Weston Group
Empire Company
Florists (all) 3,719
Sources: Centre for the Study of Commercial Activity, Ryerson University, Statistics Canada. Deloitte analysis
1. N&GS (undefined) represents the number of nursery and garden centres to which Statistics Canada could not determine the number of employees for such operations
2. Note that significant variances exist in terms of square feet allocated per stores.
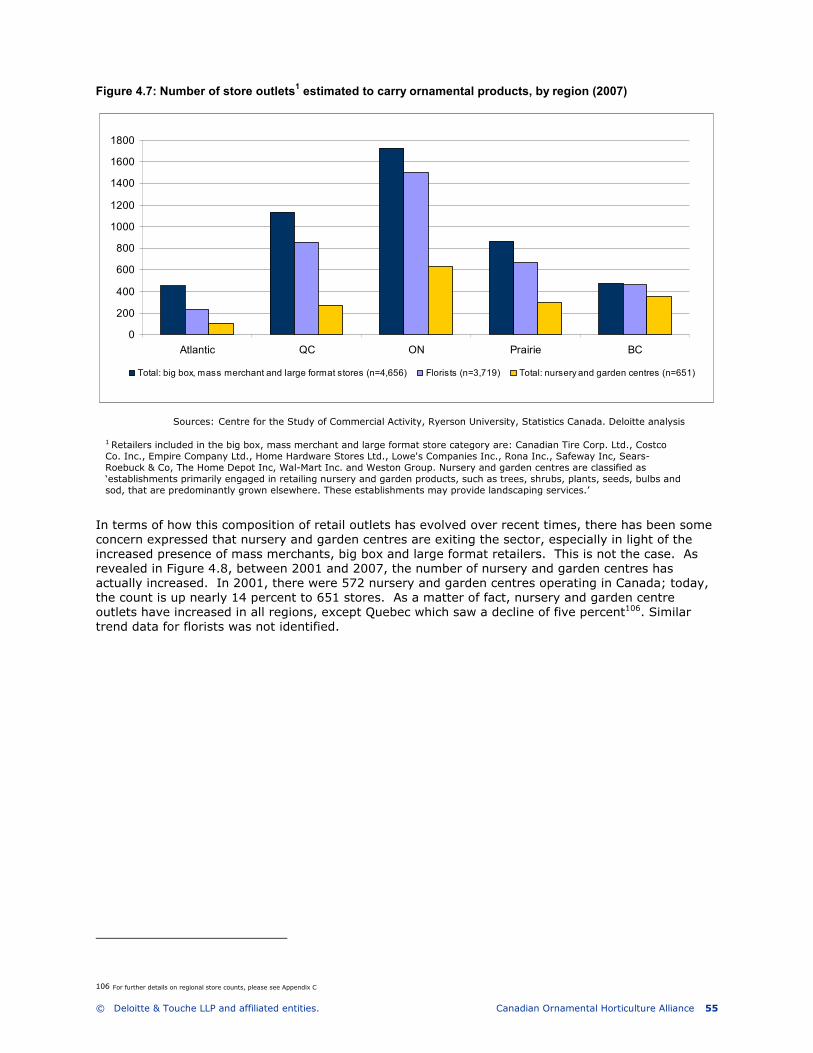
© Deloitte & Touche LLP and affiliated entities. Canadian Ornamental Horticulture Alliance 55
Figure 4.7: Number of store outlets1 estimated to carry ornamental products, by region (2007)
In terms of how this composition of retail outlets has evolved over recent times, there has been some concern expressed that nursery and garden centres are exiting the sector, especially in light of the increased presence of mass merchants, big box and large format retailers. This is not the case. As revealed in Figure 4.8, between 2001 and 2007, the number of nursery and garden centres has actually increased. In 2001, there were 572 nursery and garden centres operating in Canada; today, the count is up nearly 14 percent to 651 stores. As a matter of fact, nursery and garden centre outlets have increased in all regions, except Quebec which saw a decline of five percent106. Similar trend data for florists was not identified.
106 For further details on regional store counts, please see Appendix C
Sources: Centre for the Study of Commercial Activity, Ryerson University, Statistics Canada. Deloitte analysis
1 Retailers included in the big box, mass merchant and large format store category are: Canadian Tire Corp. Ltd., Costco Co. Inc., Empire Company Ltd., Home Hardware Stores Ltd., Lowe's Companies Inc., Rona Inc., Safeway Inc, Sears-Roebuck & Co, The Home Depot Inc, Wal-Mart Inc. and Weston Group. Nursery and garden centres are classified as ‘establishments primarily engaged in retailing nursery and garden products, such as trees, shrubs, plants, seeds, bulbs and sod, that are predominantly grown elsewhere. These establishments may provide landscaping services.’
0
200
400
600
800
1000
1200
1400
1600
1800
Atlantic QC ON Prairie BC
Total: big box, mass merchant and large format stores (n=4,656) Florists (n=3,719) Total: nursery and garden centres (n=651)

© Deloitte & Touche LLP and affiliated entities. Canadian Ornamental Horticulture Alliance 56
Figure 4.8: 2001/2007 change in the number of stores by conglomerate1 and/or type estimated to carry
ornamental products, by region
It is however true that the mass merchant, big box and large format stores examined are also on the increase (Figure 4.8). During the same 2001 to 2007 time frame, these retailers are estimated to have grown their outlets across all regions to over 4,600 stores across Canada107. Of interest however, their rate of growth (7.3 percent), was not as high as what was achieved by nursery and garden centres.
Challenges producers are facing when dealing with channel stakeholders
According to COHA, centralized buying practices are having an impact on producers today. In order to better understand this impact (which can be defined by the sum of a number of considerations), amongst others, Deloitte and COHA collaboratively designed a detailed survey along a series of retailing dimensions in order to provide a view as to how producers are being impacted on these considerations (Figure 4.9). This survey was rolled out to over 60 producers from across Canada. While the evaluations below are qualitative in nature, it is believed that the insights reported are directionally valid.
107 For further details on regional store counts, please see Appendix C.
Sources: Centre for the Study of Commercial Activity, Ryerson University, Statistics Canada. Deloitte analysis
1 Retailers included in the big box, mass merchant and large format store category are: Canadian Tire Corp. Ltd., Costco Co. Inc., Empire Company Ltd., Home Hardware Stores Ltd., Lowe's Companies Inc., Rona Inc., Safeway Inc, Sears-Roebuck & Co, The Home Depot Inc, Wal-Mart Inc. and Weston Group. Nursery and garden centres are classified as ‘establishments primarily engaged in retailing nursery and garden products, such as trees, shrubs, plants, seeds, bulbs and sod, that are predominantly grown elsewhere. These establishments may provide landscaping services. Similar trend data for florists was not identified.
-8%
-4%
0%
4%
8%
12%
16%
20%
Atlantic QC ON Prairie BC CAN
Total: big box, mass merchant and large format stores Total: nursery and garden centres
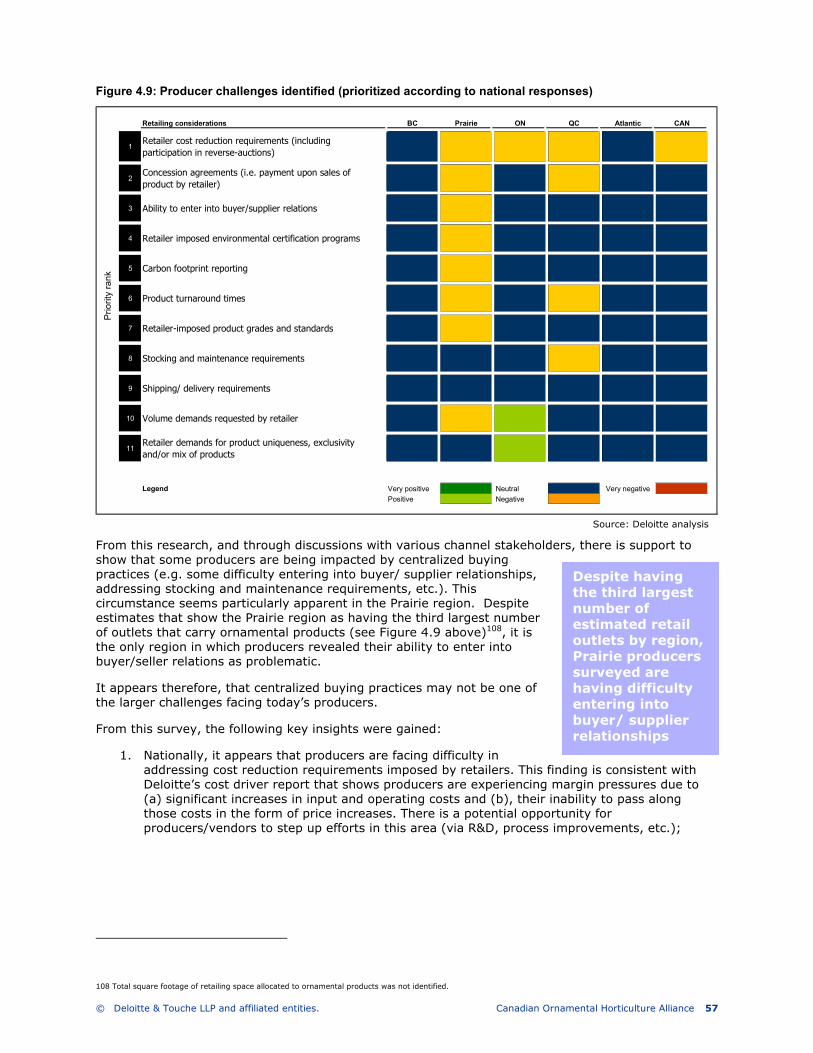
© Deloitte & Touche LLP and affiliated entities. Canadian Ornamental Horticulture Alliance 57
Figure 4.9: Producer challenges identified (prioritized according to national responses)
From this research, and through discussions with various channel stakeholders, there is support to show that some producers are being impacted by centralized buying practices (e.g. some difficulty entering into buyer/ supplier relationships, addressing stocking and maintenance requirements, etc.). This circumstance seems particularly apparent in the Prairie region. Despite estimates that show the Prairie region as having the third largest number of outlets that carry ornamental products (see Figure 4.9 above)108, it is the only region in which producers revealed their ability to enter into buyer/seller relations as problematic.
It appears therefore, that centralized buying practices may not be one of the larger challenges facing today’s producers.
From this survey, the following key insights were gained:
1. Nationally, it appears that producers are facing difficulty in addressing cost reduction requirements imposed by retailers. This finding is consistent with Deloitte’s cost driver report that shows producers are experiencing margin pressures due to (a) significant increases in input and operating costs and (b), their inability to pass along those costs in the form of price increases. There is a potential opportunity for producers/vendors to step up efforts in this area (via R&D, process improvements, etc.);
108 Total square footage of retailing space allocated to ornamental products was not identified.
Source: Deloitte analysis
Retailing considerations BC Prairie ON QC Atlantic CAN
1Retailer cost reduction requirements (including
participation in reverse-auctions)
2Concession agreements (i.e. payment upon sales of
product by retailer)
3 Ability to enter into buyer/supplier relations
4 Retailer imposed environmental certification programs
5 Carbon footprint reporting
6 Product turnaround times
7 Retailer-imposed product grades and standards
8 Stocking and maintenance requirements
9 Shipping/ delivery requirements
10 Volume demands requested by retailer
11Retailer demands for product uniqueness, exclusivity
and/or mix of products
Legend Very positive Neutral Very negative
Positive Negative
Priority rank
Despite having the third largest number of estimated retail outlets by region, Prairie producers surveyed are having difficulty entering into buyer/ supplier relationships
© Deloitte & Touche LLP and affiliated entities. Canadian Ornamental Horticulture Alliance 58
2. Ontario producers surveyed feel that they are responding well to volume demands and product uniqueness requirements that are requested by retailers; this is contrasted by some of the other regions which are relatively neutral to these considerations and the Prairie region which identifies retailer volume demands as problematic.
3. Consignment agreements are negatively impacting producers surveyed in Quebec and the Prairie region. Such terms can limit producer flexibility in terms of cash flow and their ability to raise capital. These are fair concerns, especially in light of today’s economic circumstance. Moreover, producers are at risk of retailers not selling through all product shipped and the opportunity cost of such arrangements can also be high (e.g. product could be sold elsewhere for cash);
4. Prairie producers surveyed are showing relative concern for a number of other retailing considerations including, retailer imposed environmental certification programs; carbon footprint reporting; product turnaround times; and retailer imposed product grades and standards.
These results may be due to a number of considerations which include a lagging level of business investment/re-investment (vs. other regions) and the size and scale of Prairie producer operations (e.g. they may be too relatively small to meet retailer needs because of the high costs to offer such considerations);
5. Responses from Quebec producers indicate some additional challenges around product turnaround times and stocking and maintenance requirements. This result could be due to resource constraints vis-à-vis producers taking on large number of smaller retailers (vs. driving higher volumes through fewer outlets) and/or producers taking on larger national retailers (e.g. RONA) and having higher account management demands placed on them;
6. BC and Atlantic producers surveyed are relatively neutral to the retailing considerations presented.
Comparing producer performance to channel stakeholder expectations
Research was also conducted to gain perspectives from a number of channel stakeholders representing retailers, wholesalers/ resellers and landscapers. Questions were asked along 11 “considerations” or value drivers that are important to stakeholders. Similar to the above findings, while the evaluations below are qualitative in nature, it is believed that the insights reported are directionally valid.
For each value driver, participants were asked to first indicate how important this value driver was to their business. Next, they were asked to gauge how well their domestic ornamental suppliers were performing in relation to that value driver. The results of this research are found in Figure10.
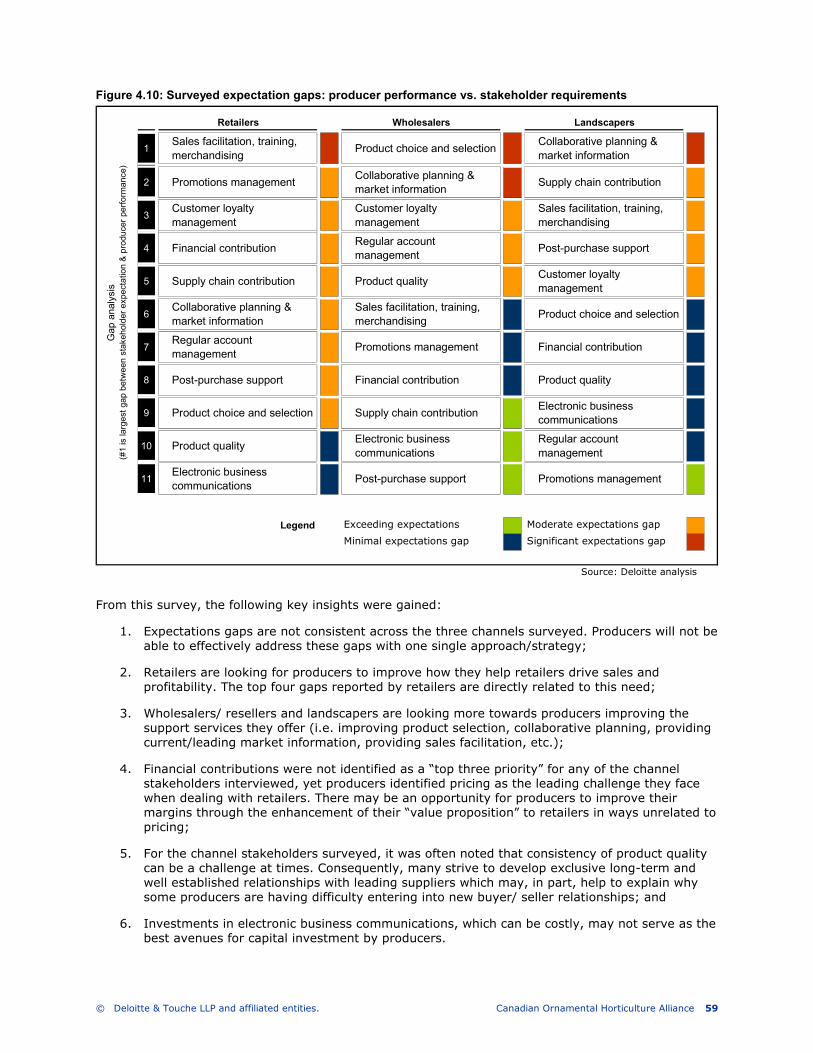
© Deloitte & Touche LLP and affiliated entities. Canadian Ornamental Horticulture Alliance 59
Figure 4.10: Surveyed expectation gaps: producer performance vs. stakeholder requirements
From this survey, the following key insights were gained:
1. Expectations gaps are not consistent across the three channels surveyed. Producers will not be able to effectively address these gaps with one single approach/strategy;
2. Retailers are looking for producers to improve how they help retailers drive sales and profitability. The top four gaps reported by retailers are directly related to this need;
3. Wholesalers/ resellers and landscapers are looking more towards producers improving the support services they offer (i.e. improving product selection, collaborative planning, providing current/leading market information, providing sales facilitation, etc.);
4. Financial contributions were not identified as a “top three priority” for any of the channel stakeholders interviewed, yet producers identified pricing as the leading challenge they face when dealing with retailers. There may be an opportunity for producers to improve their margins through the enhancement of their “value proposition” to retailers in ways unrelated to pricing;
5. For the channel stakeholders surveyed, it was often noted that consistency of product quality can be a challenge at times. Consequently, many strive to develop exclusive long-term and well established relationships with leading suppliers which may, in part, help to explain why some producers are having difficulty entering into new buyer/ seller relationships; and
6. Investments in electronic business communications, which can be costly, may not serve as the best avenues for capital investment by producers.
Source: Deloitte analysis
Retailers Wholesalers Landscapers
1Sales facilitation, training,
merchandisingProduct choice and selection
Collaborative planning &
market information
2 Promotions managementCollaborative planning &
market informationSupply chain contribution
3Customer loyalty
management
Customer loyalty
management
Sales facilitation, training,
merchandising
4 Financial contributionRegular account
managementPost-purchase support
5 Supply chain contribution Product qualityCustomer loyalty
management
6Collaborative planning &
market information
Sales facilitation, training,
merchandisingProduct choice and selection
7Regular account
managementPromotions management Financial contribution
8 Post-purchase support Financial contribution Product quality
9 Product choice and selection Supply chain contributionElectronic business
communications
10 Product qualityElectronic business
communications
Regular account
management
11Electronic business
communicationsPost-purchase support Promotions management
Legend Exceeding expectations Moderate expectations gap
Minimal expectations gap Significant expectations gap
Gap analysis
(#1 is largest gap between stakeholder expectation & producer perform
ance)
© Deloitte & Touche LLP and affiliated entities. Canadian Ornamental Horticulture Alliance 60
Top growth opportunities for producers, as identified by channel stakeholders
In order to provide COHA with some context as to where the greatest growth opportunities reside for the sector across its distribution channels, channel stakeholders interviewed were asked to identify the most significant areas ornamental suppliers could improve upon in order to drive sales through their channels. Not surprisingly, many of the same opportunities were identified through consumer research and documentation reviews.
1. Product Innovation: by far the largest opportunity identified, the term ‘innovation’ was defined as producers offering new introductions or valued enhancements along the dimensions of product offering, product mix, packaging and marketing. Part of this expectation has been set by vendors in other sectors (e.g. consumer packaged goods firms like 3M, GE and Proctor & Gamble), who have over the past five years placed significant efforts on innovation through value added product and packaging features that can build loyalty with end users and enhanced margins for retailers.
2. Consistent availability of quality products: it is widely recognized that domestic producers are capable of producing world-class ornamentals. Some stakeholders however are concerned with the consistency of product quality and suggest that the sector look to improving this situation through such initiatives as adopting/ enforcing quality standards and investments in new equipment and technologies.
3. Improving account management: there were a number of components that went into this category:
a. Customising product offering and promotions to the needs of specific channel types: producers need to cater to the unique needs and requirements of the various channel stakeholders to whom they sell109;
b. Proactively providing current market and product information: it is commonly viewed that producers are reactive to information requests. Instead, a proactive approach to information sharing (i.e. information designed to educate staff and consumers as to the benefits of ornamentals) is recommended; and
c. Improving communications and access to products being marketed: for some nurseries, garden centres and landscapers, it was felt that producer and wholesalers could improve their coordination of marketing efforts with product access and product availability in an effort to grow sales.
4. Other: there were two other opportunities suggested by individual channel stakeholders, but are worth mentioning:
a. Improving/maintaining price competitiveness: as is discussed in Deloitte’s cost driver report, producers are under intense margin pressures in light of surging input costs and their practice of not passing along these cost increases in the form of higher prices to their buyers.
The reason why it is felt that price competitiveness is worth mentioning is that not only was pricing not a “top three” expectations gap (as referenced above), pricing was not indicated as a top “growth” priority (i.e. cut costs to drive more volume and profit) for the vast majority of stakeholders interviewed. Consequently, as long as there is strong value in the products that are offered to channel stakeholders, producers should be able to protect their margins – or at a minimum, pass along some of the cost increases to their buyers; and
109 Target price points were not raised as key issues faced by retailers in the interviews conducted.
Product innovation is recognized as the leading growth opportunity for producers by channel stakeholders interviewed
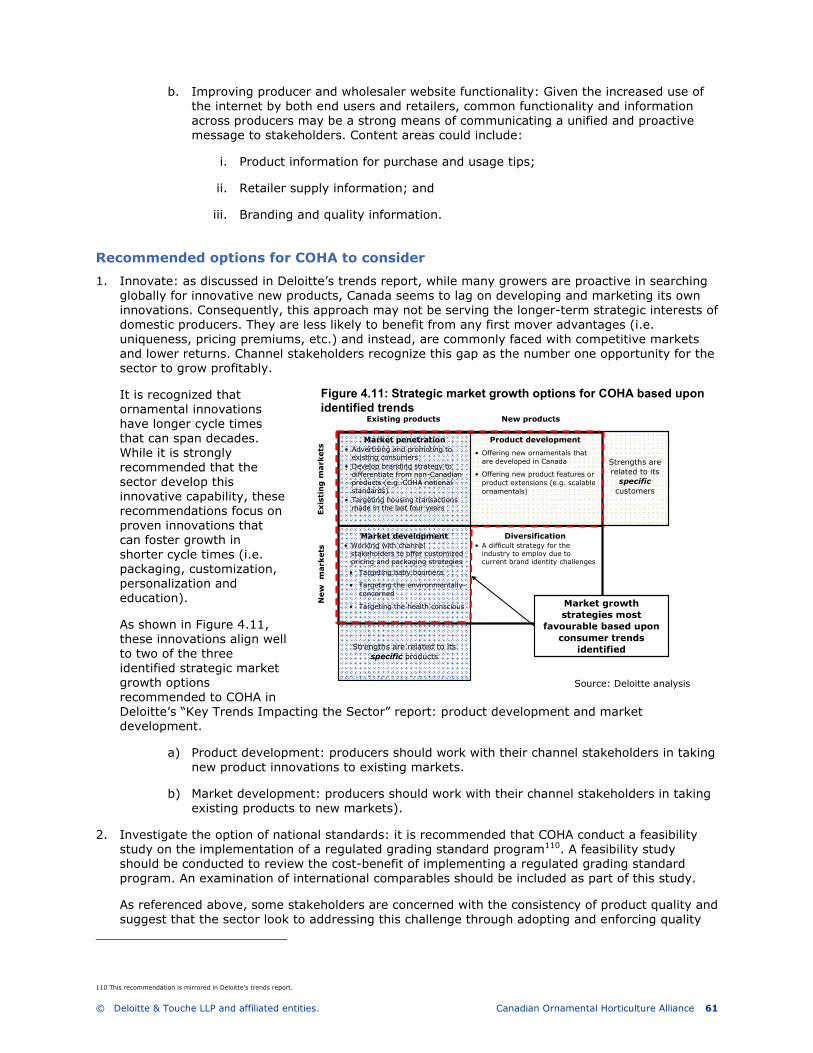
© Deloitte & Touche LLP and affiliated entities. Canadian Ornamental Horticulture Alliance 61
b. Improving producer and wholesaler website functionality: Given the increased use of the internet by both end users and retailers, common functionality and information across producers may be a strong means of communicating a unified and proactive message to stakeholders. Content areas could include:
i. Product information for purchase and usage tips;
ii. Retailer supply information; and
iii. Branding and quality information.
Recommended options for COHA to consider
1. Innovate: as discussed in Deloitte’s trends report, while many growers are proactive in searching globally for innovative new products, Canada seems to lag on developing and marketing its own innovations. Consequently, this approach may not be serving the longer-term strategic interests of domestic producers. They are less likely to benefit from any first mover advantages (i.e. uniqueness, pricing premiums, etc.) and instead, are commonly faced with competitive markets and lower returns. Channel stakeholders recognize this gap as the number one opportunity for the sector to grow profitably.
It is recognized that ornamental innovations have longer cycle times that can span decades. While it is strongly recommended that the sector develop this innovative capability, these recommendations focus on proven innovations that can foster growth in shorter cycle times (i.e. packaging, customization, personalization and education).
As shown in Figure 4.11, these innovations align well to two of the three identified strategic market growth options recommended to COHA in Deloitte’s “Key Trends Impacting the Sector” report: product development and market development.
a) Product development: producers should work with their channel stakeholders in taking new product innovations to existing markets.
b) Market development: producers should work with their channel stakeholders in taking existing products to new markets).
2. Investigate the option of national standards: it is recommended that COHA conduct a feasibility study on the implementation of a regulated grading standard program110. A feasibility study should be conducted to review the cost-benefit of implementing a regulated grading standard program. An examination of international comparables should be included as part of this study.
As referenced above, some stakeholders are concerned with the consistency of product quality and suggest that the sector look to addressing this challenge through adopting and enforcing quality
110 This recommendation is mirrored in Deloitte’s trends report.
Existing products New products
Existing markets
New markets
Market penetration• Advertising and promoting to existing consumers
• Develop branding strategy to differentiate from non-Canadian products (e.g. COHA national standards)
• Targeting housing transactions made in the last four years
Product development
• Offering new ornamentals that are developed in Canada
• Offering new product features or product extensions (e.g. scalable ornamentals)
Market development• Working with channel stakeholders to offer customized pricing and packaging strategies
Strengths are related to its specific
customers
Strengths are related to its specific products
Diversification• A difficult strategy for the industry to employ due to current brand identity challenges
• Targeting baby boomera
• Targeting the environmentally-concerned
• Targeting the health conscious Market growth strategies most
favourable based upon
consumer trends identified
Figure 4.11: Strategic market growth options for COHA based upon identified trends
Source: Deloitte analysis
© Deloitte & Touche LLP and affiliated entities. Canadian Ornamental Horticulture Alliance 62
standards. This challenge is believed to be potentially related to perception and not necessarily reality; the sector therefore has a great opportunity to proactively address quality assurance and brand image111.
3. Improve account management: improving account management aligns well to the third identified strategic market growth options (Figure 4.11) recommended to COHA in Deloitte’s trends report: market penetration. These initiatives are designed to help COHA grow market share in existing markets, using existing products.
a) Improve market segmentation: catering to the individual needs of each channel buyer is costly and likely out of reach for most producers who sell to many buyers. Instead, it is recommended that producers design strategies that are aligned to the specific requirements of each “channel” or “sub-segment” they sell to (i.e. nursery and garden centres, big boxes, florists, wholesalers, etc.).
This segmented approach allows for producers to still customize how they serve their accounts, however in a manner that is more cost-effective. According to AMR Research, customer segmentation strategies result in six percent improvement in win rate and a 35 to 60 percent decrease in costs associated with lead generation.
What this approach entails is having tailored account management plans that address the specific needs of each channel or channel sub-segment served. For example, for ‘sales facilitation, training and merchandizing’ requirements, large format retailers may be looking for merchandizing information and shelf talkers (by season and/or climatic zone) to promote ornamental usage; conversely, garden centres may be seeking two-hour in-house store demonstrations every Saturday during June on a key topic of interest related to the ornamentals the suppliers are selling; florists may not be seeking any support in this area.
To provide an example as a possible framework for developing these approaches, sellers could incorporate the 11 value drivers indicated in Figure 4.10 above. Moreover, by incorporating these 11 value drivers into an account management approach, it will also help suppliers address the performance gaps retailers revealed regarding their suppliers. It should be noted however that the priority and weighting of value drivers may not be consistent across all channels and channel sub-segmetns (e.g. retailers tend to put more emphasis on promotions than do landscapers).
There is a credibility-building opportunity for COHA here as well, from an sector perspective. COHA can assist producers in designing such strategies by offering on-line templates, market information and seminars.
b) Improve account management (access to information): it is also recommended that sellers provide buyers with timely information that supports buyer sales efforts. This information should be pushed out to buyers proactively; not sellers reacting to buyer requests. This information should be offered in a fashion that is easily used and accessed by buyers and their staff. This value-added service also presents sellers with an opportunity to brand the information forwarded and foster loyalty amongst their buyers.
c) Improve account management (communications): a relatively straightforward recommendation, producers and wholesalers need to work towards improving their coordination of marketing efforts and availability/access to product with their buyers in an effort to grow sales.
111 From Deloitte’s trends report: “Currently, a significant gap to promoting domestic ornamental products lies in the industry’s inability to effectively brand its products. This gap has two consequences.
First, many products are homogenized/ commoditized which leaves consumers confused as to product origin (i.e. they would purchase Canadian if given the choice). Second, as appearance is the leading
sales driver, grower investments in product quality are not always rewarded. Consumers struggle to justify premiums when visual differentiation is difficult. … COHA too lacks identity and brand
credibility. The introduction of a Canadian brand standard (segmented regionally) may help to [heighten awareness of COHA] and provide the consumer an opportunity to become brand loyal (i.e. buy
Canadian products quality assured by COHA)”.
© Deloitte & Touche LLP and affiliated entities. Canadian Ornamental Horticulture Alliance 63
4. Consider ‘sales co-opting’: it is recognized that one of the largest hurdles to improving account management for producers, especially small producers, is resourcing. More specifically, the high financial commitment to hiring dedicated sales staff, marketing and promotion, etc. can make the achievement of this capability difficult.
Conversely, there is an opportunity cost associated with not having an effective program in place for growing profitable sales through a producer’s various sales channels.
For some businesses, there may be an opportunity for them to still have this capability, however at a lower investment cost. Businesses have the opportunity to partner with other entities (ideally with businesses that offer complementary product lines) and cost-share the investments required to have their own account management and promotion capabilities. The level of investment each stakeholder invests could be determined by the volume of product flows through the co-op, among others.
5. “Trade up” for improved pricing: there appears to be an opportunity for producers to work with buyers to improve their margins through enhancing their “value proposition” in ways unrelated to pricing. As shown in Figure 4.10, financial contributions were not identified as a “top three priority” in terms of where producer performance can improve.
More specifically, producers may be able to attain improved pricing by “trading” or offering buyers improved sales facilitation, staff training and/or promotions. A couple of points for consideration:
a) Stakeholders value things differently. For example, the $0.25 concession (increase) a producer receives for the 100,000 six-inch poinsettias sold to Big Box Inc. (totaling $25,000) may cost less than the amount given up to obtain the concession (e.g. five one-hour staff training sessions and 2,500 shelf-talkers to promote these same poinsettias; and
b) Key to this “trade” will be ensuring that what producers are willing to offer is valued (by the buyers) at, at a minimum, the pricing concessions being asked for.
UK cut flower success story
In 1997, the UK reported a relatively low per capita consumption of cut flowers of ~$26 per person. In only five years per capita consumption was doubled to over $53. This result was achieved through two initiatives: (1) advertising campaigns that focus on increased personal use and (2), strict quality control regulations.
Themes used in the campaign were:
So simple. So try it: this campaign was adopted by the UK Flowers and Plants Association, to encourage people to buy flowers more frequently for their homes. It featured simple ideas like how flowers can complement various rooms in a home as well as encouraged consumption on everyday occasions such as the changing of the seasons and parties. It also suggested flowers for non-traditional segments, like children.
This campaign continues on in the UK and is supported by a dedicated website (www.tryflowers.org.uk) designed to encourage consumption.
Buy some flowers for yourself: this campaign targeted women and encouraged them to buy flowers they wanted themselves vs. waiting for their significant other to do so. They chose this approach in accordance to research conducted by the Flower Council of Holland (FCoH). The FCoH found that women under the age of 35 tended to not buy flowers for themselves and that once an individual was accustomed to buying flowers for themselves, they will, on average, buy twenty bunches of flowers for themselves every year.
The implementation of strict quality control systems has been key to helping drive sales – especially for grocers like Tesco. These companies source flowers from international farms where product quality is pre-determined and sell-by dates are registered. Temperature and humidity are controlled and monitored throughout the ‘cold chain’ en route to the stores with products routinely tested upon arrival.
Sources: “How can we sell more flowers?”. M.Reid, U.C. Cooperative. Extension, Davis, California; www.tryflowers.org.uk/

© Deloitte & Touche LLP and affiliated entities. Canadian Ornamental Horticulture Alliance 64
6. Promote the benefits of ornamentals: in Deloitte’s “Key Trends Impacting the Sector” report, numerous benefits derived from using ornamental plants were identified that can be used to target different consumer segments: baby boomers, homeowners, green consumers, etc. When doing so, ensure that these promotional efforts are coordinated with channel stakeholders in an integrated fashion so that the opportunity for sales is maximized. The UK cut flower success store illustrated to the left is a prime example of what can be accomplished by an effective promotional campaign.

© Deloitte & Touche LLP and affiliated entities. Canadian Ornamental Horticulture Alliance 65
5. Competitive impacts of key cost drivers
Summary
• Ontario, followed closely by British Columbia, is host to the largest ornamental horticulture producers in Canada. In 2006, the average total operating revenue for a farm within these two provinces was $1.4 million and $1.1 million, respectively. The Prairie region, Quebec and the Atlantic region followed with their average producers generating $0.6 million, $0.5 million and $0.3 million in sales (i.e. predominantly farm gate gross receipts; however can include miscellaneous sales from other categories), accordingly.
• In terms of profitability, between 2002 and 2006 the average net operating margin for a Canadian ornamental producer was 9.5 percent. On a regional basis, the Prairie region led with an average net operating margin of 11.9 percent, followed closely by Quebec (10.7 percent). BC and Ontario averaged 9.1 percent and nine percent, respectively, while the Atlantic region attained the lowest profitability score of 7.1 percent.
• 2007 was a volatile year that saw many input costs skyrocket which had a dramatic effect on ornamental businesses. To complicate matters, the strong majority of producers surveyed indicate that they are having difficulty transferring these increases onto buyers. Profitability is suffering as a result.
• It is cautiously estimated (please see report for details on estimating methodology) that profitability will decrease by four percent for the average Canadian ornamental farmer in 2007. 2007 ornamental profitability and expenditure figures (per Statistics Canada Catalogue No. 21-208-X1B) are yet to be released in order for these estimates to be validated.
• Key cost drivers which have the greatest potential impact to producer profitability are examined and discussed in this report. These include labour, foreign exchange, inputs (seeds and plants, utility expenses, fertilizer and lime expenses and pesticide expense), interest and energy (utilities and fuel).
Data gaps and limitations
A data source that explicitly covered the Canadian ornamental sector was not identified. Instead, Statistics Canada’s “Statistics on Revenues and Expenses of Farms” reports for 2002 through 2006 (preliminary) using NAICS code 1114 (greenhouse, nursery and floriculture production) was utilized. Due to the data aggregation presented in these sources, data presented in this report is limited to the ornamental sector as a whole versus being presented by sub-sector. Consequently, some cost driver data reported may not be representative of all sub-sectors (e.g. utility costs for the nursery sub-sector).
Three limitations of this data source are acknowledged: first, NAICS 1114 contains crops not identified as ornamental (e.g. bell peppers, etc.); second, similar reports for sod and Christmas tree production were not identified during the course of the report’s analysis and third, 2006 data is classified as ‘preliminary’ by Statistics Canada.
While 2002-2006 data from Statistics Canada was sourced for this assignment, the 2007 data set is not expected to be released until December 2008. 2007 marked a dynamic period of change that included the Canadian dollar exceeding parity with the US dollar and rapidly escalating commodity prices. In light of these circumstances, 2007 costs were estimated, where possible, by utilizing farm data from the USDA’s National Agricultural Statistical Service (NASS).
© Deloitte & Touche LLP and affiliated entities. Canadian Ornamental Horticulture Alliance 66
The reader is cautioned to use discretion when using the 2007 estimates. Canadians who sourced US product in 2007 did so under a stronger dollar which may have provided them with a hedge against rising US prices (i.e. the net effect is unknown). Moreover, 2007 NASS data is representative of all US farming. Consequently, some costs (i.e. seeds and plants) include a ‘food’ component (i.e. corn) that may have influenced the net results for that line item.
Finally, as part of the research undertaken, a survey of 63 ornamental producers from across Canada was conducted to glean additional insight on how key cost drivers are impacting ornamental profitability. While this data is not representative of the entire domestic sector, it does provide another basis for comparison and inference.
Data considerations, going forward
The information that Statistics Canada provides on the Canadian Ornamental Horticulture sector is valuable and often helps to form a basis for recommendations on improvement. It provides a broad-array of reliable, credible and topical information; moreover, the quality and quantity of information on the Canadian Ornamental Horticulture sector is not always provided elsewhere. In order to bridge the identified data gaps mentioned above, there are a number of changes that Statistics Canada could consider in an effort to provide the sector with better information:
1. Improved specificity of reports: many of the reports used in this study utilized NAICS 1114 as a proxy for the Canadian ornamental sector. NAICS 1114 does however include other non-sector specific data which distort the true picture of the sector (e.g. bell peppers). By filtering out these non-sector items, data more representative of the ornamental sector will result. Further, data presented by both the sector as a whole, and by sub-sector, would also result in data that is more meaningful to the sector. It is recognized that some aggregation may be required to protect producer confidentiality, however consider doing so on a regional basis versus by sub-sector.
2. Timely access to data: during the time of this report (October 2008), many of the Statistics Canada reports had not yet released 2007 data. Especially during times of uncertainty and significant market dynamics, as were experienced in 2007, earlier access to data would help to arm the sector with information necessary to make informed decisions.
Ornamental profitability
Ontario, followed closely by British Columbia, is host to the largest ornamental horticulture producers in Canada. In 2006, the average total operating revenue for a farm within these two provinces was $1.4 million and $1.1 million, respectively. The Prairie region, Quebec and the Atlantic region followed with their average producers generating $0.6 million, $0.5 million and $0.3 million in sales, accordingly112.
In terms of profitability, between 2002 and 2006 the average net operating margin for a Canadian ornamental producer was 9.5 percent (Figure 5.1). On a regional basis, the Prairie region led with an average net operating margin of 11.9 percent, followed closely by Quebec (10.7 percent). BC and Ontario averaged 9.1 percent and nine percent, respectively, while the Atlantic region attained the lowest profitability score of 7.1 percent113.
112 Source: “Statistics on Revenues and Expenses of Farms (Catalogue No. 21-208-X)”, Statistics Canada (2002-2006 preliminary)
113 Source: “Statistics on Revenues and Expenses of Farms (Catalogue No. 21-208-X)”, Statistics Canada (2002-2006 preliminary)
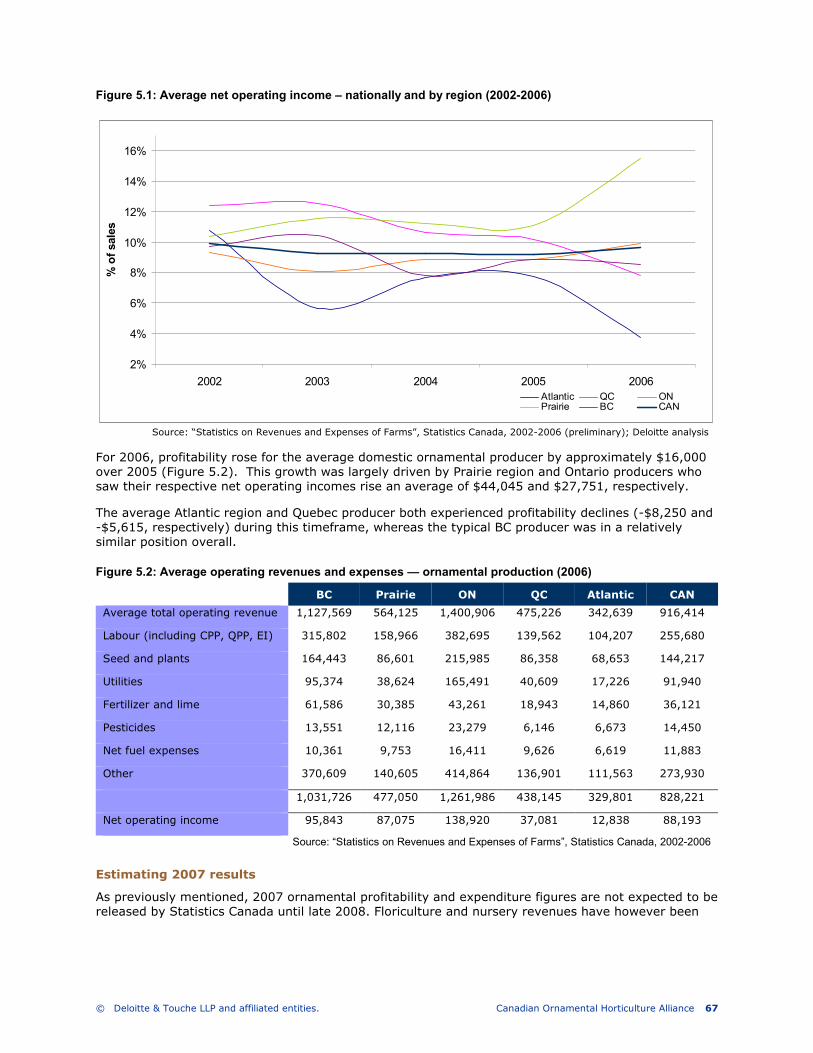
© Deloitte & Touche LLP and affiliated entities. Canadian Ornamental Horticulture Alliance 67
Figure 5.1: Average net operating income – nationally and by region (2002-2006)
For 2006, profitability rose for the average domestic ornamental producer by approximately $16,000 over 2005 (Figure 5.2). This growth was largely driven by Prairie region and Ontario producers who saw their respective net operating incomes rise an average of $44,045 and $27,751, respectively.
The average Atlantic region and Quebec producer both experienced profitability declines (-$8,250 and -$5,615, respectively) during this timeframe, whereas the typical BC producer was in a relatively similar position overall.
Figure 5.2: Average operating revenues and expenses — ornamental production (2006)
BC Prairie ON QC Atlantic CAN
Average total operating revenue 1,127,569 564,125 1,400,906 475,226 342,639 916,414
Labour (including CPP, QPP, EI) 315,802 158,966 382,695 139,562 104,207 255,680
Seed and plants 164,443 86,601 215,985 86,358 68,653 144,217
Utilities 95,374 38,624 165,491 40,609 17,226 91,940
Fertilizer and lime 61,586 30,385 43,261 18,943 14,860 36,121
Pesticides 13,551 12,116 23,279 6,146 6,673 14,450
Net fuel expenses 10,361 9,753 16,411 9,626 6,619 11,883
Other 370,609 140,605 414,864 136,901 111,563 273,930
1,031,726 477,050 1,261,986 438,145 329,801 828,221
Net operating income 95,843 87,075 138,920 37,081 12,838 88,193
Source: “Statistics on Revenues and Expenses of Farms”, Statistics Canada, 2002-2006
Estimating 2007 results
As previously mentioned, 2007 ornamental profitability and expenditure figures are not expected to be released by Statistics Canada until late 2008. Floriculture and nursery revenues have however been
2%
4%
6%
8%
10%
12%
14%
16%
2002 2003 2004 2005 2006
% of sales
Atlantic QC ONPrairie BC CAN
Source: “Statistics on Revenues and Expenses of Farms”, Statistics Canada, 2002-2006 (preliminary); Deloitte analysis
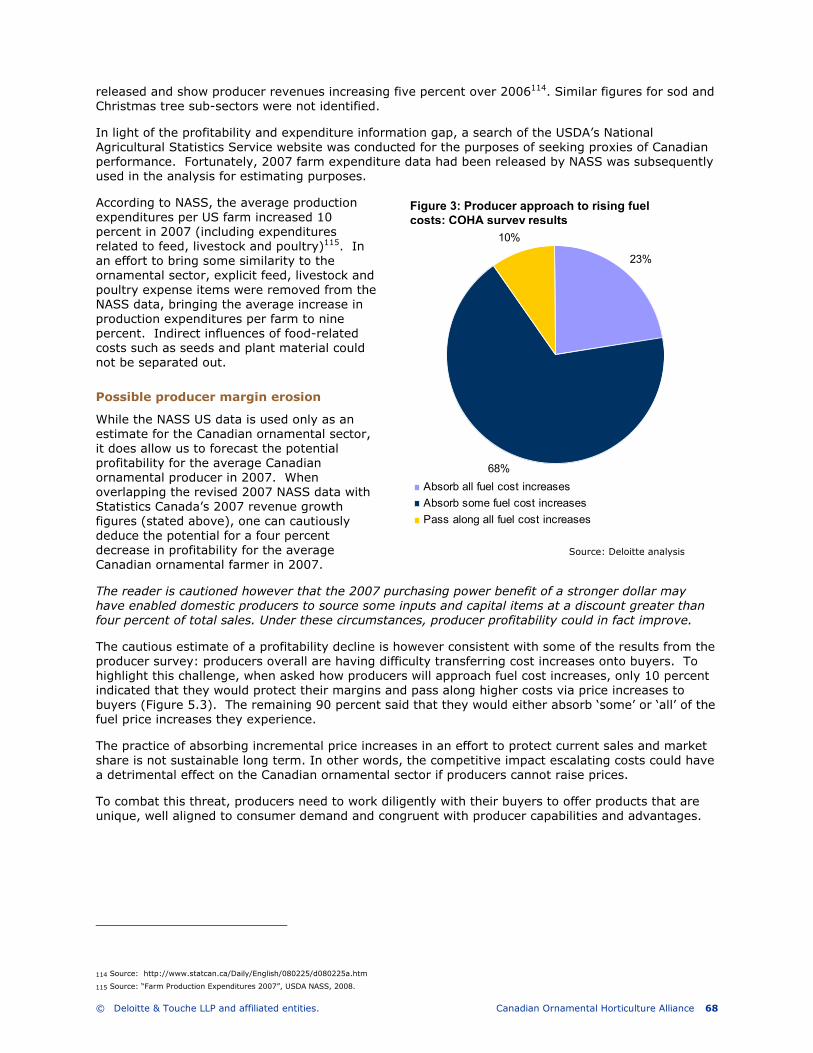
© Deloitte & Touche LLP and affiliated entities. Canadian Ornamental Horticulture Alliance 68
released and show producer revenues increasing five percent over 2006114. Similar figures for sod and Christmas tree sub-sectors were not identified.
In light of the profitability and expenditure information gap, a search of the USDA’s National Agricultural Statistics Service website was conducted for the purposes of seeking proxies of Canadian performance. Fortunately, 2007 farm expenditure data had been released by NASS was subsequently used in the analysis for estimating purposes.
According to NASS, the average production expenditures per US farm increased 10 percent in 2007 (including expenditures related to feed, livestock and poultry)115. In an effort to bring some similarity to the ornamental sector, explicit feed, livestock and poultry expense items were removed from the NASS data, bringing the average increase in production expenditures per farm to nine percent. Indirect influences of food-related costs such as seeds and plant material could not be separated out.
Possible producer margin erosion
While the NASS US data is used only as an estimate for the Canadian ornamental sector, it does allow us to forecast the potential profitability for the average Canadian ornamental producer in 2007. When overlapping the revised 2007 NASS data with Statistics Canada’s 2007 revenue growth figures (stated above), one can cautiously deduce the potential for a four percent decrease in profitability for the average Canadian ornamental farmer in 2007.
The reader is cautioned however that the 2007 purchasing power benefit of a stronger dollar may
have enabled domestic producers to source some inputs and capital items at a discount greater than
four percent of total sales. Under these circumstances, producer profitability could in fact improve.
The cautious estimate of a profitability decline is however consistent with some of the results from the producer survey: producers overall are having difficulty transferring cost increases onto buyers. To highlight this challenge, when asked how producers will approach fuel cost increases, only 10 percent indicated that they would protect their margins and pass along higher costs via price increases to buyers (Figure 5.3). The remaining 90 percent said that they would either absorb ‘some’ or ‘all’ of the fuel price increases they experience.
The practice of absorbing incremental price increases in an effort to protect current sales and market share is not sustainable long term. In other words, the competitive impact escalating costs could have a detrimental effect on the Canadian ornamental sector if producers cannot raise prices.
To combat this threat, producers need to work diligently with their buyers to offer products that are unique, well aligned to consumer demand and congruent with producer capabilities and advantages.
114 Source: http://www.statcan.ca/Daily/English/080225/d080225a.htm
115 Source: “Farm Production Expenditures 2007”, USDA NASS, 2008.
23%
10%
68%
Absorb all fuel cost increases
Absorb some fuel cost increases
Pass along all fuel cost increases
Figure 3: Producer approach to rising fuel costs: COHA survey results
Source: Deloitte analysis
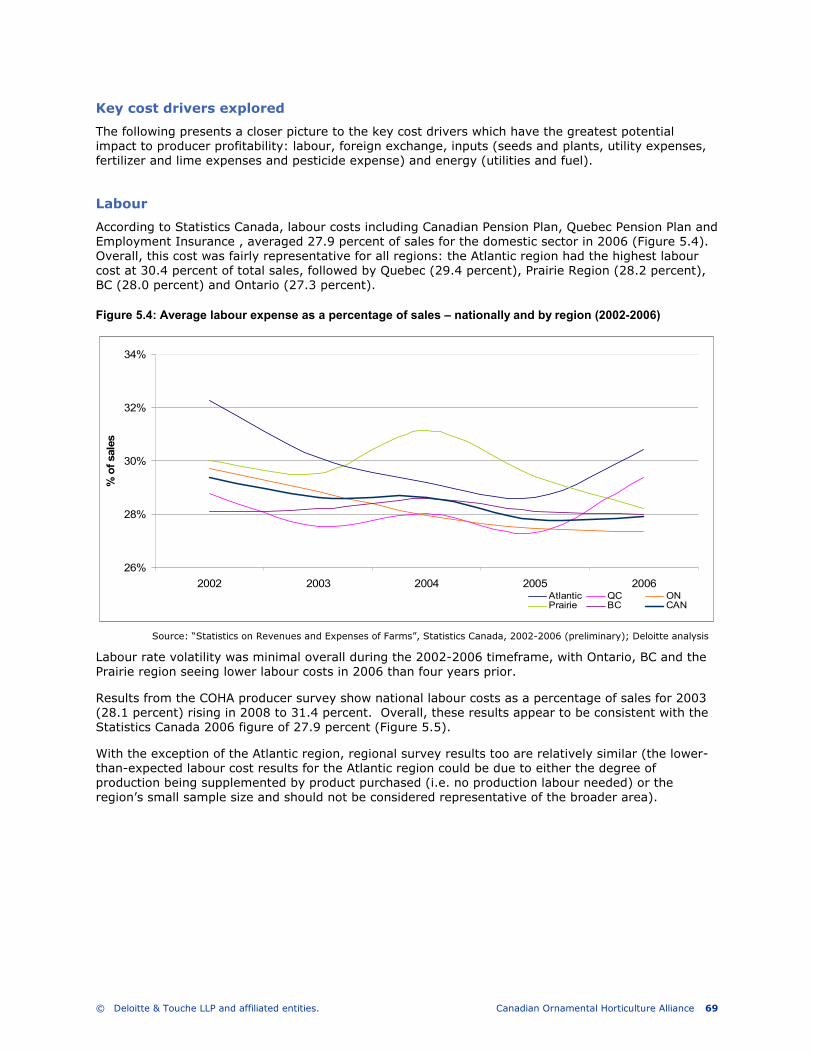
© Deloitte & Touche LLP and affiliated entities. Canadian Ornamental Horticulture Alliance 69
Key cost drivers explored
The following presents a closer picture to the key cost drivers which have the greatest potential impact to producer profitability: labour, foreign exchange, inputs (seeds and plants, utility expenses, fertilizer and lime expenses and pesticide expense) and energy (utilities and fuel).
Labour
According to Statistics Canada, labour costs including Canadian Pension Plan, Quebec Pension Plan and Employment Insurance , averaged 27.9 percent of sales for the domestic sector in 2006 (Figure 5.4). Overall, this cost was fairly representative for all regions: the Atlantic region had the highest labour cost at 30.4 percent of total sales, followed by Quebec (29.4 percent), Prairie Region (28.2 percent), BC (28.0 percent) and Ontario (27.3 percent).
Figure 5.4: Average labour expense as a percentage of sales – nationally and by region (2002-2006)
Labour rate volatility was minimal overall during the 2002-2006 timeframe, with Ontario, BC and the Prairie region seeing lower labour costs in 2006 than four years prior.
Results from the COHA producer survey show national labour costs as a percentage of sales for 2003 (28.1 percent) rising in 2008 to 31.4 percent. Overall, these results appear to be consistent with the Statistics Canada 2006 figure of 27.9 percent (Figure 5.5).
With the exception of the Atlantic region, regional survey results too are relatively similar (the lower-than-expected labour cost results for the Atlantic region could be due to either the degree of production being supplemented by product purchased (i.e. no production labour needed) or the region’s small sample size and should not be considered representative of the broader area).
26%
28%
30%
32%
34%
2002 2003 2004 2005 2006
% of sales
Atlantic QC ONPrairie BC CAN
Source: “Statistics on Revenues and Expenses of Farms”, Statistics Canada, 2002-2006 (preliminary); Deloitte analysis
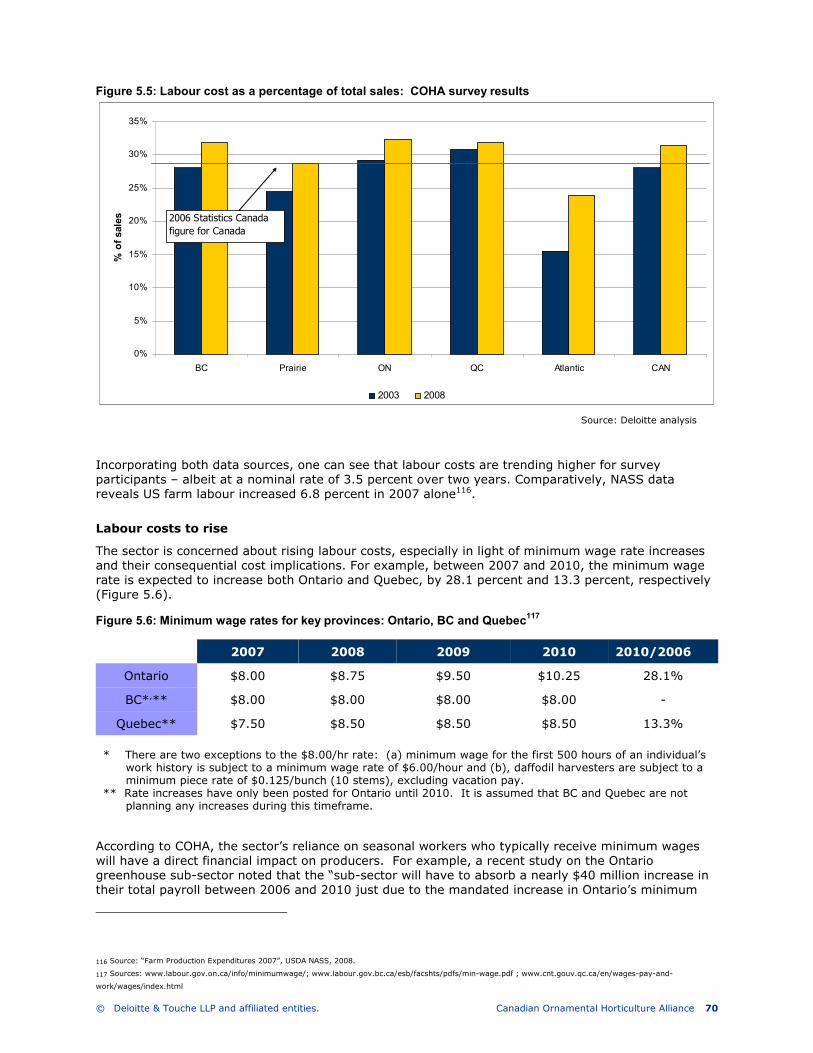
© Deloitte & Touche LLP and affiliated entities. Canadian Ornamental Horticulture Alliance 70
Figure 5.5: Labour cost as a percentage of total sales: COHA survey results
Incorporating both data sources, one can see that labour costs are trending higher for survey participants – albeit at a nominal rate of 3.5 percent over two years. Comparatively, NASS data reveals US farm labour increased 6.8 percent in 2007 alone116.
Labour costs to rise
The sector is concerned about rising labour costs, especially in light of minimum wage rate increases and their consequential cost implications. For example, between 2007 and 2010, the minimum wage rate is expected to increase both Ontario and Quebec, by 28.1 percent and 13.3 percent, respectively (Figure 5.6).
Figure 5.6: Minimum wage rates for key provinces: Ontario, BC and Quebec117
2007 2008 2009 2010 2010/2006
Ontario $8.00 $8.75 $9.50 $10.25 28.1%
BC*,** $8.00 $8.00 $8.00 $8.00 -
Quebec** $7.50 $8.50 $8.50 $8.50 13.3% * There are two exceptions to the $8.00/hr rate: (a) minimum wage for the first 500 hours of an individual’s
work history is subject to a minimum wage rate of $6.00/hour and (b), daffodil harvesters are subject to a minimum piece rate of $0.125/bunch (10 stems), excluding vacation pay.
** Rate increases have only been posted for Ontario until 2010. It is assumed that BC and Quebec are not planning any increases during this timeframe.
According to COHA, the sector’s reliance on seasonal workers who typically receive minimum wages will have a direct financial impact on producers. For example, a recent study on the Ontario greenhouse sub-sector noted that the “sub-sector will have to absorb a nearly $40 million increase in their total payroll between 2006 and 2010 just due to the mandated increase in Ontario’s minimum
116 Source: “Farm Production Expenditures 2007”, USDA NASS, 2008.
117 Sources: www.labour.gov.on.ca/info/minimumwage/; www.labour.gov.bc.ca/esb/facshts/pdfs/min-wage.pdf ; www.cnt.gouv.qc.ca/en/wages-pay-and-
work/wages/index.html
0%
5%
10%
15%
20%
25%
30%
35%
BC Prairie ON QC Atlantic CAN
% of sales
2003 2008
2006 Statistics Canada
figure for Canada
Source: Deloitte analysis

© Deloitte & Touche LLP and affiliated entities. Canadian Ornamental Horticulture Alliance 71
wage. This [increase] represents a nearly 14 percent overall increase in payroll. In contrast, the impact on all other industries in Ontario is less than ¼ the size”118.
Other pressures are also at play which place additional pressure on labour costs. By 2008, the first members of the baby boom generation will turn 62, the average retirement age of developed regions like North America. Experts are forecasting staggering skills gaps as skilled retirees are not being replaced by skilled successors at a uniform rate.
In addition to skills gaps, an aging workforce is driving a rising trend in absenteeism rates amongst Canadian employees. This is contributing to higher labour costs. According to Statistics Canada, there has been a rising trend in absenteeism rates amongst Canadian employees since 1996.
The possibility of unionization, a possible reality for parts of the ornamental sector, is another factor to consider when looking at rising labour costs. According to Statistics Canada, Unionized employees that are covered by collective agreements report almost twice as many missed workdays as non-unionized employees (13.6 days versus 7.9 days).
Foreign exchange
The Canadian dollar appreciated significantly against the US dollar over the past five years to a high of $1.09 in November 2007 (Figure 5.7). As of October 3, 2008, the Canadian dollar represented $0.92 USD. According to COHA, and supplemented by the results of the producer survey and export data from Statistics Canada, this appreciation – particularly in relation to the US dollar, has not had a favourable impact on the sector.
Figure 5.7: Canadian dollar appreciation against US dollar (2002 – October 2008)
While the sector aggregate ‘gain’ or ‘loss’ on buying/selling US currency was not determined in this study, the research does show that exports have declined in recent years (Figure 5.8). For example, 2006 marked a turning point for flower and plant exports119 where the $0.85+ USD Canadian dollar
118 Source: “The Impact of Ontario’s Minimum Wager on the Greenhouse Industry”, e-Conomics Consulting, 2008. 119 Export data for sod, nursery and Christmas trees was not identified. According to COHA however, floriculture and potted plants represent the vast majority of
ornamental exports.
0.5
0.6
0.7
0.8
0.9
1
1.1
1.2
USD$
2002 2003 2004 2005 2006 2007 2008
Source: Bank of Canada (website), 10-year currency converter; Deloitte analysis
Aging of the workforce and unionization are driving increased labour costs across Canada
The rising Canadian dollar has cut deeply into ornamental exports
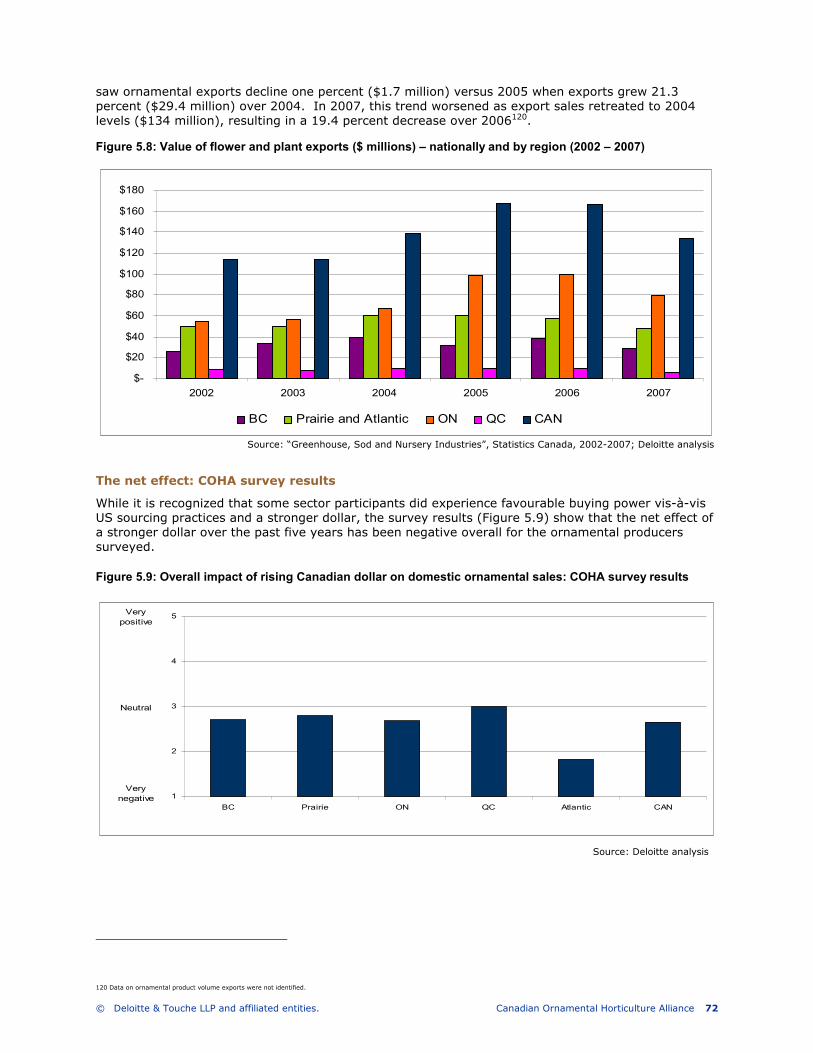
© Deloitte & Touche LLP and affiliated entities. Canadian Ornamental Horticulture Alliance 72
saw ornamental exports decline one percent ($1.7 million) versus 2005 when exports grew 21.3 percent ($29.4 million) over 2004. In 2007, this trend worsened as export sales retreated to 2004 levels ($134 million), resulting in a 19.4 percent decrease over 2006120.
Figure 5.8: Value of flower and plant exports ($ millions) – nationally and by region (2002 – 2007)
The net effect: COHA survey results
While it is recognized that some sector participants did experience favourable buying power vis-à-vis US sourcing practices and a stronger dollar, the survey results (Figure 5.9) show that the net effect of a stronger dollar over the past five years has been negative overall for the ornamental producers surveyed.
Figure 5.9: Overall impact of rising Canadian dollar on domestic ornamental sales: COHA survey results
120 Data on ornamental product volume exports were not identified.
1
2
3
4
5
BC Prairie ON QC Atlantic CAN
Very
negative
Neutral
Very
positive
Source: Deloitte analysis
$-
$20
$40
$60
$80
$100
$120
$140
$160
$180
2002 2003 2004 2005 2006 2007
BC Prairie and Atlantic ON QC CAN
Source: “Greenhouse, Sod and Nursery Industries”, Statistics Canada, 2002-2007; Deloitte analysis
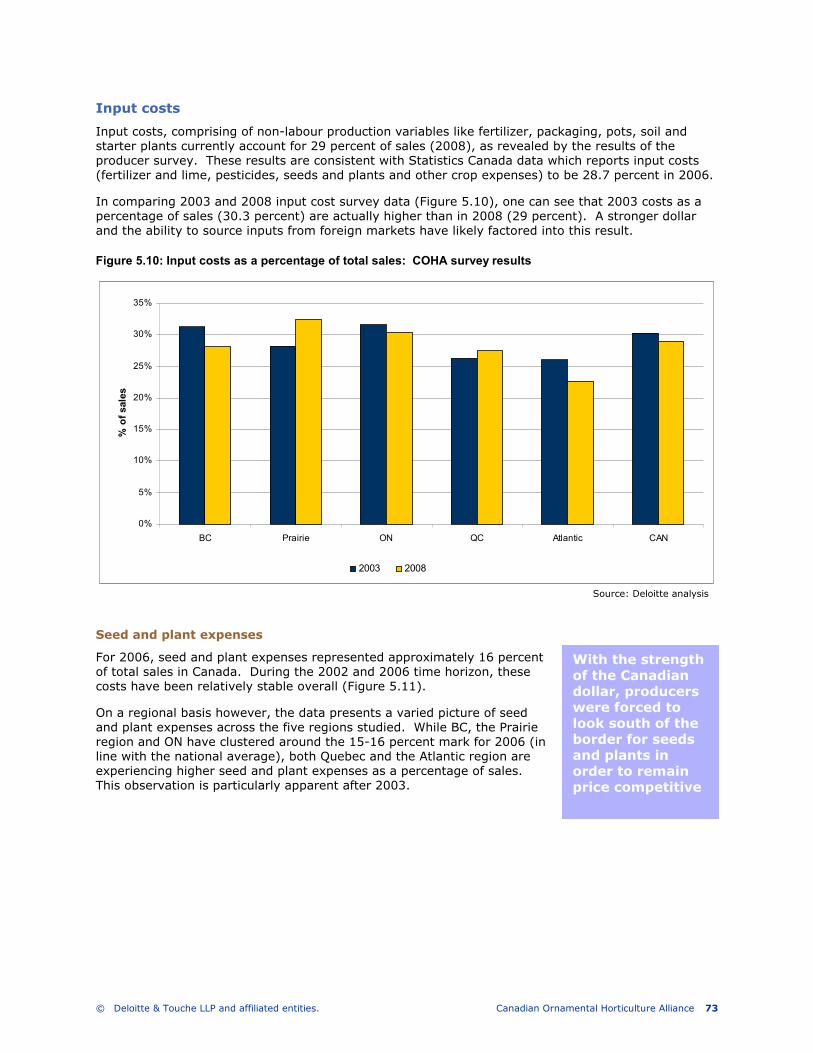
© Deloitte & Touche LLP and affiliated entities. Canadian Ornamental Horticulture Alliance 73
Input costs
Input costs, comprising of non-labour production variables like fertilizer, packaging, pots, soil and starter plants currently account for 29 percent of sales (2008), as revealed by the results of the producer survey. These results are consistent with Statistics Canada data which reports input costs (fertilizer and lime, pesticides, seeds and plants and other crop expenses) to be 28.7 percent in 2006.
In comparing 2003 and 2008 input cost survey data (Figure 5.10), one can see that 2003 costs as a percentage of sales (30.3 percent) are actually higher than in 2008 (29 percent). A stronger dollar and the ability to source inputs from foreign markets have likely factored into this result.
Figure 5.10: Input costs as a percentage of total sales: COHA survey results
Seed and plant expenses
For 2006, seed and plant expenses represented approximately 16 percent of total sales in Canada. During the 2002 and 2006 time horizon, these costs have been relatively stable overall (Figure 5.11).
On a regional basis however, the data presents a varied picture of seed and plant expenses across the five regions studied. While BC, the Prairie region and ON have clustered around the 15-16 percent mark for 2006 (in line with the national average), both Quebec and the Atlantic region are experiencing higher seed and plant expenses as a percentage of sales. This observation is particularly apparent after 2003.
Source: Deloitte analysis
0%
5%
10%
15%
20%
25%
30%
35%
BC Prairie ON QC Atlantic CAN
% of sales
2003 2008
With the strength of the Canadian dollar, producers were forced to look south of the border for seeds and plants in order to remain price competitive
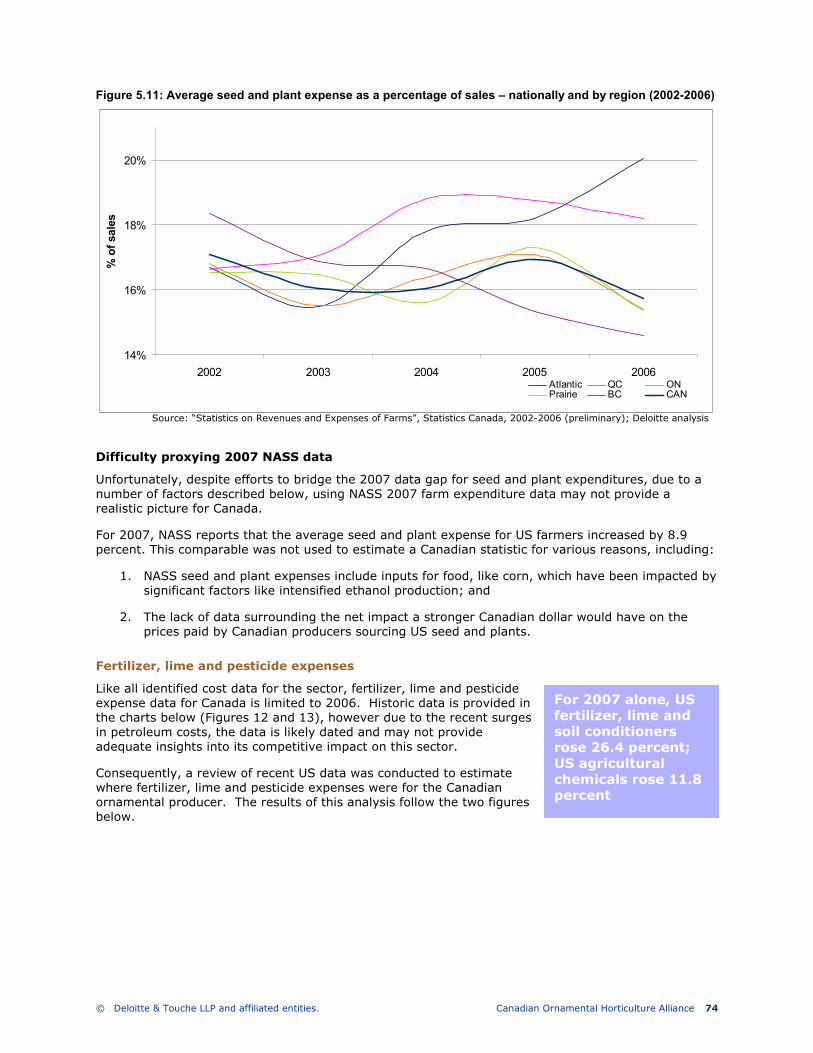
© Deloitte & Touche LLP and affiliated entities. Canadian Ornamental Horticulture Alliance 74
Figure 5.11: Average seed and plant expense as a percentage of sales – nationally and by region (2002-2006)
Difficulty proxying 2007 NASS data
Unfortunately, despite efforts to bridge the 2007 data gap for seed and plant expenditures, due to a number of factors described below, using NASS 2007 farm expenditure data may not provide a realistic picture for Canada.
For 2007, NASS reports that the average seed and plant expense for US farmers increased by 8.9 percent. This comparable was not used to estimate a Canadian statistic for various reasons, including:
1. NASS seed and plant expenses include inputs for food, like corn, which have been impacted by significant factors like intensified ethanol production; and
2. The lack of data surrounding the net impact a stronger Canadian dollar would have on the prices paid by Canadian producers sourcing US seed and plants.
Fertilizer, lime and pesticide expenses
Like all identified cost data for the sector, fertilizer, lime and pesticide expense data for Canada is limited to 2006. Historic data is provided in the charts below (Figures 12 and 13), however due to the recent surges in petroleum costs, the data is likely dated and may not provide adequate insights into its competitive impact on this sector.
Consequently, a review of recent US data was conducted to estimate where fertilizer, lime and pesticide expenses were for the Canadian ornamental producer. The results of this analysis follow the two figures below.
14%
16%
18%
20%
2002 2003 2004 2005 2006
% of sales
Atlantic QC ONPrairie BC CAN
For 2007 alone, US fertilizer, lime and soil conditioners rose 26.4 percent; US agricultural chemicals rose 11.8 percent
Source: “Statistics on Revenues and Expenses of Farms”, Statistics Canada, 2002-2006 (preliminary); Deloitte analysis
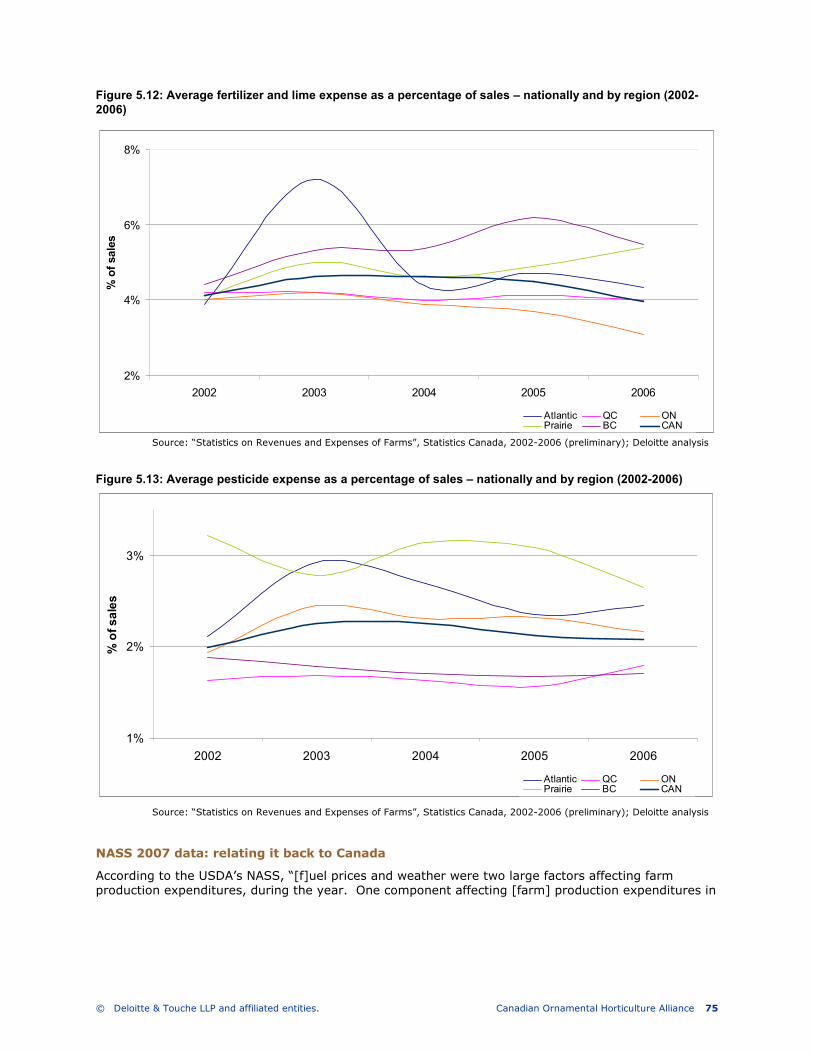
© Deloitte & Touche LLP and affiliated entities. Canadian Ornamental Horticulture Alliance 75
Figure 5.12: Average fertilizer and lime expense as a percentage of sales – nationally and by region (2002-2006)
Figure 5.13: Average pesticide expense as a percentage of sales – nationally and by region (2002-2006)
NASS 2007 data: relating it back to Canada
According to the USDA’s NASS, “[f]uel prices and weather were two large factors affecting farm production expenditures, during the year. One component affecting [farm] production expenditures in
2%
4%
6%
8%
2002 2003 2004 2005 2006
% of sales
Atlantic QC ONPrairie BC CAN
Source: “Statistics on Revenues and Expenses of Farms”, Statistics Canada, 2002-2006 (preliminary); Deloitte analysis
1%
2%
3%
2002 2003 2004 2005 2006
% of sales
Atlantic QC ONPrairie BC CAN
Source: “Statistics on Revenues and Expenses of Farms”, Statistics Canada, 2002-2006 (preliminary); Deloitte analysis
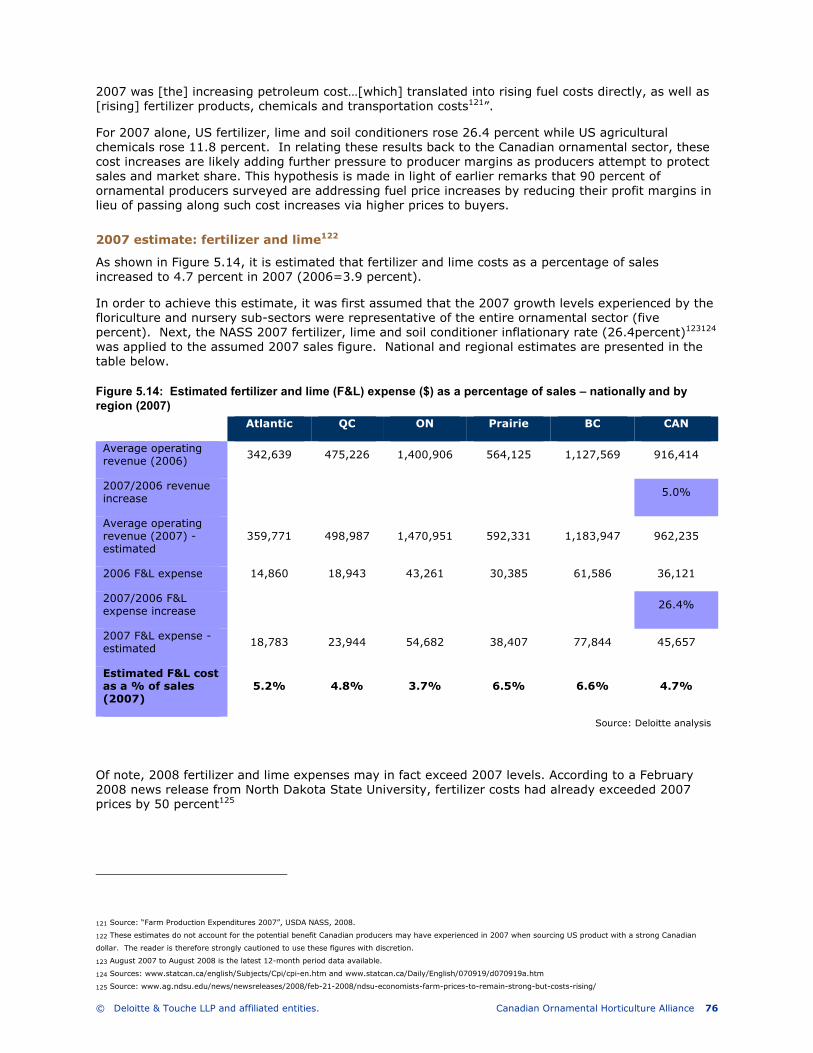
© Deloitte & Touche LLP and affiliated entities. Canadian Ornamental Horticulture Alliance 76
2007 was [the] increasing petroleum cost…[which] translated into rising fuel costs directly, as well as [rising] fertilizer products, chemicals and transportation costs121”.
For 2007 alone, US fertilizer, lime and soil conditioners rose 26.4 percent while US agricultural chemicals rose 11.8 percent. In relating these results back to the Canadian ornamental sector, these cost increases are likely adding further pressure to producer margins as producers attempt to protect sales and market share. This hypothesis is made in light of earlier remarks that 90 percent of ornamental producers surveyed are addressing fuel price increases by reducing their profit margins in lieu of passing along such cost increases via higher prices to buyers.
2007 estimate: fertilizer and lime122
As shown in Figure 5.14, it is estimated that fertilizer and lime costs as a percentage of sales increased to 4.7 percent in 2007 (2006=3.9 percent).
In order to achieve this estimate, it was first assumed that the 2007 growth levels experienced by the floriculture and nursery sub-sectors were representative of the entire ornamental sector (five percent). Next, the NASS 2007 fertilizer, lime and soil conditioner inflationary rate (26.4percent)123124 was applied to the assumed 2007 sales figure. National and regional estimates are presented in the table below.
Figure 5.14: Estimated fertilizer and lime (F&L) expense ($) as a percentage of sales – nationally and by region (2007)
Atlantic QC ON Prairie BC CAN
Average operating revenue (2006) 342,639 475,226 1,400,906 564,125 1,127,569 916,414
2007/2006 revenue increase 5.0%
Average operating revenue (2007) - estimated
359,771 498,987 1,470,951 592,331 1,183,947 962,235
2006 F&L expense 14,860 18,943 43,261 30,385 61,586 36,121
2007/2006 F&L expense increase 26.4%
2007 F&L expense - estimated 18,783 23,944 54,682 38,407 77,844 45,657
Estimated F&L cost as a % of sales (2007)
5.2% 4.8% 3.7% 6.5% 6.6% 4.7%
Source: Deloitte analysis
Of note, 2008 fertilizer and lime expenses may in fact exceed 2007 levels. According to a February 2008 news release from North Dakota State University, fertilizer costs had already exceeded 2007 prices by 50 percent125
121 Source: “Farm Production Expenditures 2007”, USDA NASS, 2008.
122 These estimates do not account for the potential benefit Canadian producers may have experienced in 2007 when sourcing US product with a strong Canadian
dollar. The reader is therefore strongly cautioned to use these figures with discretion.
123 August 2007 to August 2008 is the latest 12-month period data available.
124 Sources: www.statcan.ca/english/Subjects/Cpi/cpi-en.htm and www.statcan.ca/Daily/English/070919/d070919a.htm
125 Source: www.ag.ndsu.edu/news/newsreleases/2008/feb-21-2008/ndsu-economists-farm-prices-to-remain-strong-but-costs-rising/
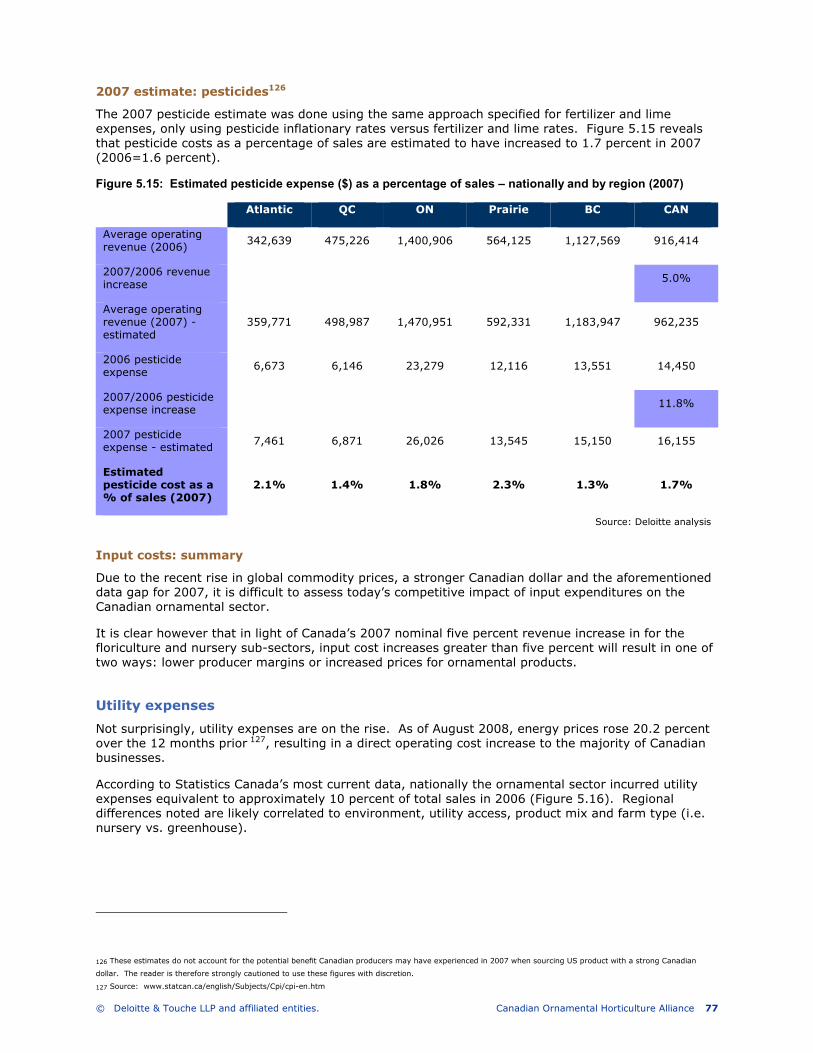
© Deloitte & Touche LLP and affiliated entities. Canadian Ornamental Horticulture Alliance 77
2007 estimate: pesticides126
The 2007 pesticide estimate was done using the same approach specified for fertilizer and lime expenses, only using pesticide inflationary rates versus fertilizer and lime rates. Figure 5.15 reveals that pesticide costs as a percentage of sales are estimated to have increased to 1.7 percent in 2007 (2006=1.6 percent).
Figure 5.15: Estimated pesticide expense ($) as a percentage of sales – nationally and by region (2007)
Atlantic QC ON Prairie BC CAN
Average operating revenue (2006) 342,639 475,226 1,400,906 564,125 1,127,569 916,414
2007/2006 revenue increase 5.0%
Average operating revenue (2007) - estimated
359,771 498,987 1,470,951 592,331 1,183,947 962,235
2006 pesticide expense 6,673 6,146 23,279 12,116 13,551 14,450
2007/2006 pesticide expense increase 11.8%
2007 pesticide expense - estimated 7,461 6,871 26,026 13,545 15,150 16,155
Estimated pesticide cost as a % of sales (2007)
2.1% 1.4% 1.8% 2.3% 1.3% 1.7%
Source: Deloitte analysis
Input costs: summary
Due to the recent rise in global commodity prices, a stronger Canadian dollar and the aforementioned data gap for 2007, it is difficult to assess today’s competitive impact of input expenditures on the Canadian ornamental sector.
It is clear however that in light of Canada’s 2007 nominal five percent revenue increase in for the floriculture and nursery sub-sectors, input cost increases greater than five percent will result in one of two ways: lower producer margins or increased prices for ornamental products.
Utility expenses
Not surprisingly, utility expenses are on the rise. As of August 2008, energy prices rose 20.2 percent over the 12 months prior 127, resulting in a direct operating cost increase to the majority of Canadian businesses.
According to Statistics Canada’s most current data, nationally the ornamental sector incurred utility expenses equivalent to approximately 10 percent of total sales in 2006 (Figure 5.16). Regional differences noted are likely correlated to environment, utility access, product mix and farm type (i.e. nursery vs. greenhouse).
126 These estimates do not account for the potential benefit Canadian producers may have experienced in 2007 when sourcing US product with a strong Canadian
dollar. The reader is therefore strongly cautioned to use these figures with discretion.
127 Source: www.statcan.ca/english/Subjects/Cpi/cpi-en.htm
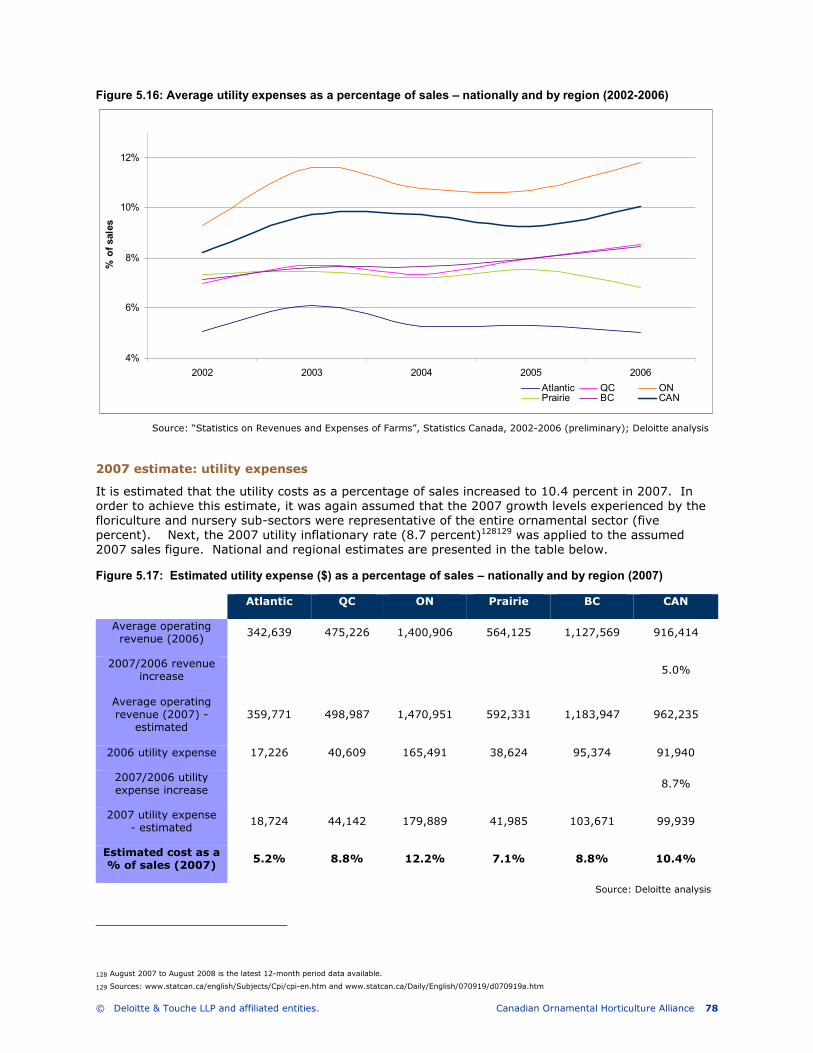
© Deloitte & Touche LLP and affiliated entities. Canadian Ornamental Horticulture Alliance 78
Figure 5.16: Average utility expenses as a percentage of sales – nationally and by region (2002-2006)
2007 estimate: utility expenses
It is estimated that the utility costs as a percentage of sales increased to 10.4 percent in 2007. In order to achieve this estimate, it was again assumed that the 2007 growth levels experienced by the floriculture and nursery sub-sectors were representative of the entire ornamental sector (five percent). Next, the 2007 utility inflationary rate (8.7 percent)128129 was applied to the assumed 2007 sales figure. National and regional estimates are presented in the table below.
Figure 5.17: Estimated utility expense ($) as a percentage of sales – nationally and by region (2007)
Atlantic QC ON Prairie BC CAN
Average operating revenue (2006) 342,639 475,226 1,400,906 564,125 1,127,569 916,414
2007/2006 revenue increase 5.0%
Average operating revenue (2007) -
estimated 359,771 498,987 1,470,951 592,331 1,183,947 962,235
2006 utility expense 17,226 40,609 165,491 38,624 95,374 91,940
2007/2006 utility expense increase 8.7%
2007 utility expense - estimated 18,724 44,142 179,889 41,985 103,671 99,939
Estimated cost as a % of sales (2007)
5.2% 8.8% 12.2% 7.1% 8.8% 10.4%
Source: Deloitte analysis
128 August 2007 to August 2008 is the latest 12-month period data available.
129 Sources: www.statcan.ca/english/Subjects/Cpi/cpi-en.htm and www.statcan.ca/Daily/English/070919/d070919a.htm
4%
6%
8%
10%
12%
2002 2003 2004 2005 2006
% of sales
Atlantic QC ONPrairie BC CAN
Source: “Statistics on Revenues and Expenses of Farms”, Statistics Canada, 2002-2006 (preliminary); Deloitte analysis
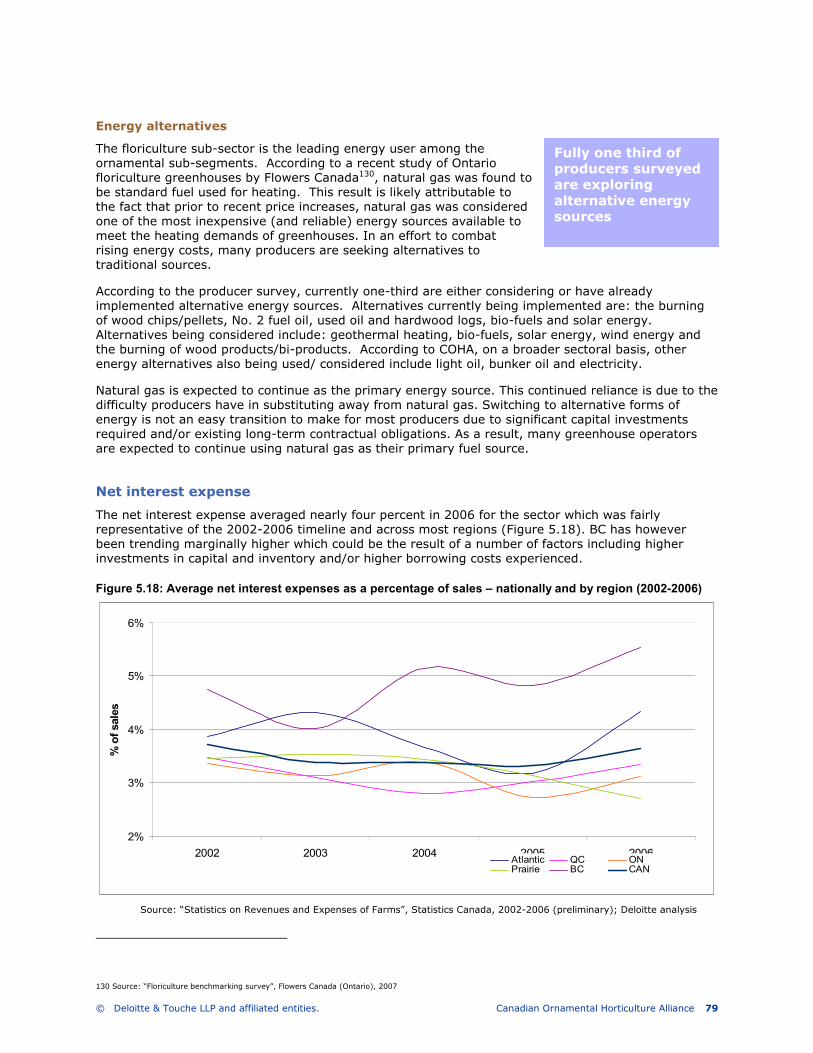
© Deloitte & Touche LLP and affiliated entities. Canadian Ornamental Horticulture Alliance 79
Energy alternatives
The floriculture sub-sector is the leading energy user among the ornamental sub-segments. According to a recent study of Ontario floriculture greenhouses by Flowers Canada130, natural gas was found to be standard fuel used for heating. This result is likely attributable to the fact that prior to recent price increases, natural gas was considered one of the most inexpensive (and reliable) energy sources available to meet the heating demands of greenhouses. In an effort to combat rising energy costs, many producers are seeking alternatives to traditional sources.
According to the producer survey, currently one-third are either considering or have already implemented alternative energy sources. Alternatives currently being implemented are: the burning of wood chips/pellets, No. 2 fuel oil, used oil and hardwood logs, bio-fuels and solar energy. Alternatives being considered include: geothermal heating, bio-fuels, solar energy, wind energy and the burning of wood products/bi-products. According to COHA, on a broader sectoral basis, other energy alternatives also being used/ considered include light oil, bunker oil and electricity.
Natural gas is expected to continue as the primary energy source. This continued reliance is due to the difficulty producers have in substituting away from natural gas. Switching to alternative forms of energy is not an easy transition to make for most producers due to significant capital investments required and/or existing long-term contractual obligations. As a result, many greenhouse operators are expected to continue using natural gas as their primary fuel source.
Net interest expense
The net interest expense averaged nearly four percent in 2006 for the sector which was fairly representative of the 2002-2006 timeline and across most regions (Figure 5.18). BC has however been trending marginally higher which could be the result of a number of factors including higher investments in capital and inventory and/or higher borrowing costs experienced.
Figure 5.18: Average net interest expenses as a percentage of sales – nationally and by region (2002-2006)
130 Source: “Floriculture benchmarking survey”, Flowers Canada (Ontario), 2007
Source: “Statistics on Revenues and Expenses of Farms”, Statistics Canada, 2002-2006 (preliminary); Deloitte analysis
2%
3%
4%
5%
6%
2002 2003 2004 2005 2006
% of sales
Atlantic QC ONPrairie BC CAN
Fully one third of producers surveyed are exploring alternative energy sources
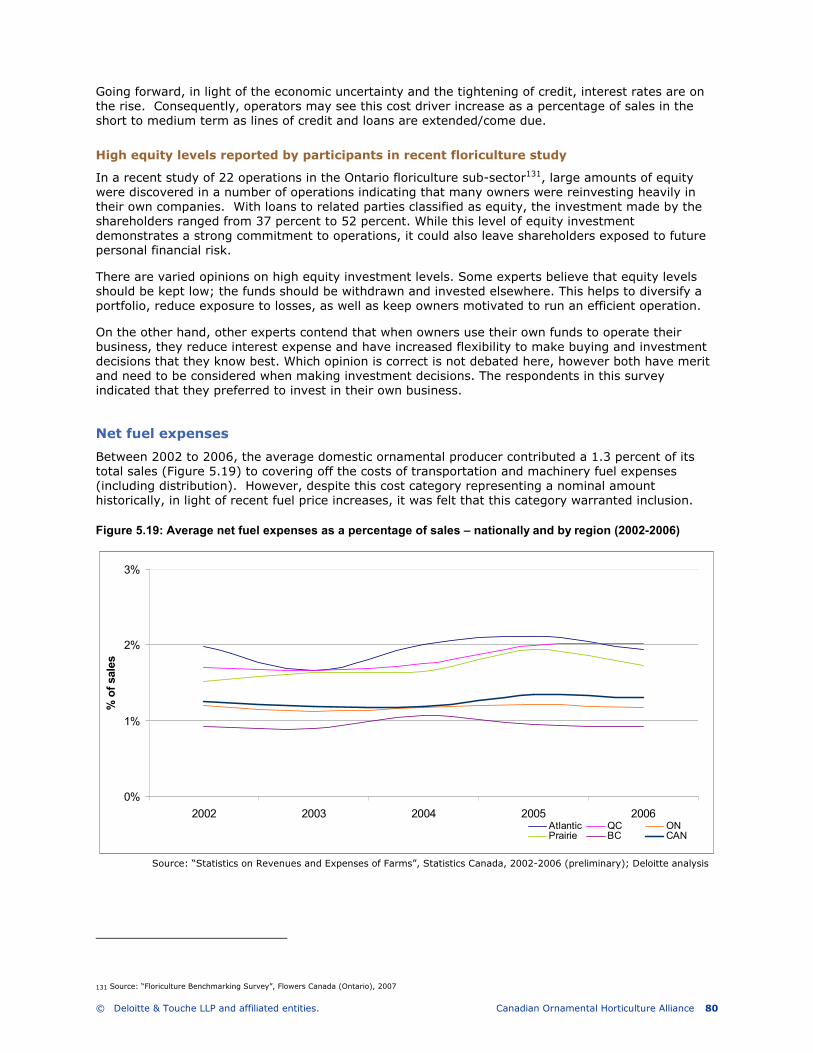
© Deloitte & Touche LLP and affiliated entities. Canadian Ornamental Horticulture Alliance 80
Going forward, in light of the economic uncertainty and the tightening of credit, interest rates are on the rise. Consequently, operators may see this cost driver increase as a percentage of sales in the short to medium term as lines of credit and loans are extended/come due.
High equity levels reported by participants in recent floriculture study
In a recent study of 22 operations in the Ontario floriculture sub-sector131, large amounts of equity were discovered in a number of operations indicating that many owners were reinvesting heavily in their own companies. With loans to related parties classified as equity, the investment made by the shareholders ranged from 37 percent to 52 percent. While this level of equity investment demonstrates a strong commitment to operations, it could also leave shareholders exposed to future personal financial risk.
There are varied opinions on high equity investment levels. Some experts believe that equity levels should be kept low; the funds should be withdrawn and invested elsewhere. This helps to diversify a portfolio, reduce exposure to losses, as well as keep owners motivated to run an efficient operation.
On the other hand, other experts contend that when owners use their own funds to operate their business, they reduce interest expense and have increased flexibility to make buying and investment decisions that they know best. Which opinion is correct is not debated here, however both have merit and need to be considered when making investment decisions. The respondents in this survey indicated that they preferred to invest in their own business.
Net fuel expenses
Between 2002 to 2006, the average domestic ornamental producer contributed a 1.3 percent of its total sales (Figure 5.19) to covering off the costs of transportation and machinery fuel expenses (including distribution). However, despite this cost category representing a nominal amount historically, in light of recent fuel price increases, it was felt that this category warranted inclusion.
Figure 5.19: Average net fuel expenses as a percentage of sales – nationally and by region (2002-2006)
131 Source: “Floriculture Benchmarking Survey”, Flowers Canada (Ontario), 2007
0%
1%
2%
3%
2002 2003 2004 2005 2006
% of sales
Atlantic QC ONPrairie BC CAN
Source: “Statistics on Revenues and Expenses of Farms”, Statistics Canada, 2002-2006 (preliminary); Deloitte analysis
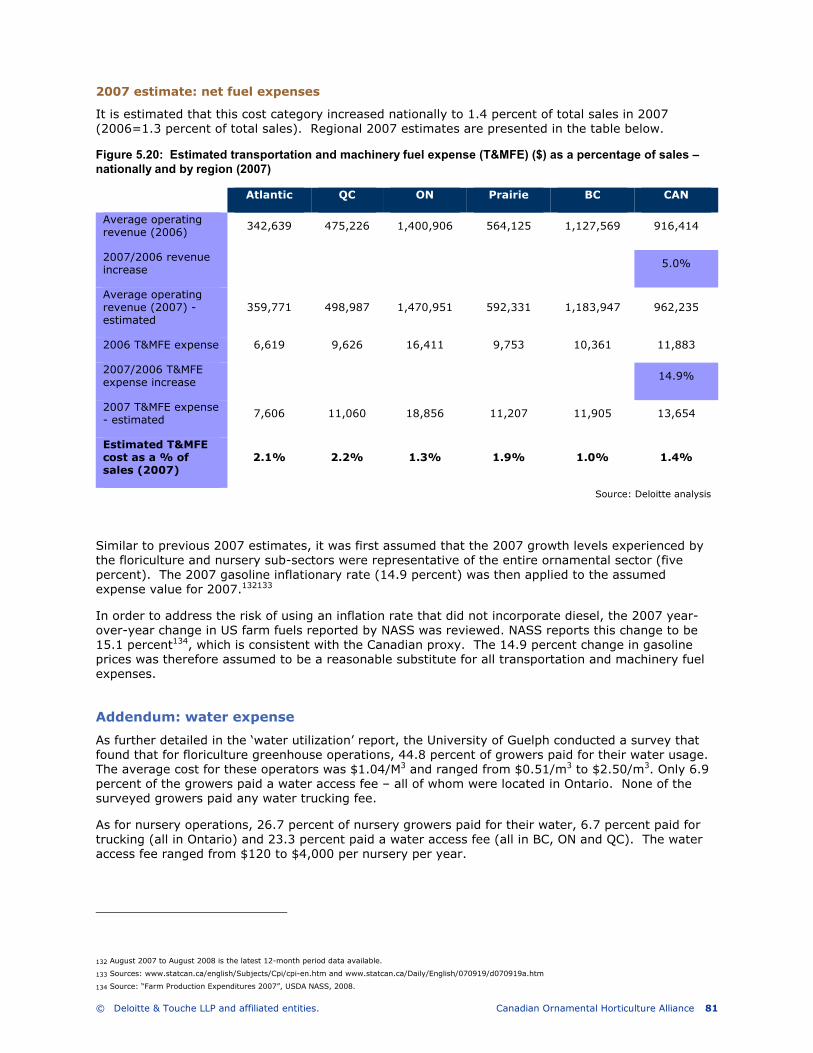
© Deloitte & Touche LLP and affiliated entities. Canadian Ornamental Horticulture Alliance 81
2007 estimate: net fuel expenses
It is estimated that this cost category increased nationally to 1.4 percent of total sales in 2007 (2006=1.3 percent of total sales). Regional 2007 estimates are presented in the table below.
Figure 5.20: Estimated transportation and machinery fuel expense (T&MFE) ($) as a percentage of sales – nationally and by region (2007)
Atlantic QC ON Prairie BC CAN
Average operating revenue (2006) 342,639 475,226 1,400,906 564,125 1,127,569 916,414
2007/2006 revenue increase 5.0%
Average operating revenue (2007) - estimated
359,771 498,987 1,470,951 592,331 1,183,947 962,235
2006 T&MFE expense 6,619 9,626 16,411 9,753 10,361 11,883
2007/2006 T&MFE expense increase 14.9%
2007 T&MFE expense - estimated 7,606 11,060 18,856 11,207 11,905 13,654
Estimated T&MFE cost as a % of sales (2007)
2.1% 2.2% 1.3% 1.9% 1.0% 1.4%
Source: Deloitte analysis
Similar to previous 2007 estimates, it was first assumed that the 2007 growth levels experienced by the floriculture and nursery sub-sectors were representative of the entire ornamental sector (five percent). The 2007 gasoline inflationary rate (14.9 percent) was then applied to the assumed expense value for 2007.132133
In order to address the risk of using an inflation rate that did not incorporate diesel, the 2007 year-over-year change in US farm fuels reported by NASS was reviewed. NASS reports this change to be 15.1 percent134, which is consistent with the Canadian proxy. The 14.9 percent change in gasoline prices was therefore assumed to be a reasonable substitute for all transportation and machinery fuel expenses.
Addendum: water expense
As further detailed in the ‘water utilization’ report, the University of Guelph conducted a survey that found that for floriculture greenhouse operations, 44.8 percent of growers paid for their water usage. The average cost for these operators was $1.04/M3 and ranged from $0.51/m3 to $2.50/m3. Only 6.9 percent of the growers paid a water access fee – all of whom were located in Ontario. None of the surveyed growers paid any water trucking fee.
As for nursery operations, 26.7 percent of nursery growers paid for their water, 6.7 percent paid for trucking (all in Ontario) and 23.3 percent paid a water access fee (all in BC, ON and QC). The water access fee ranged from $120 to $4,000 per nursery per year.
132 August 2007 to August 2008 is the latest 12-month period data available.
133 Sources: www.statcan.ca/english/Subjects/Cpi/cpi-en.htm and www.statcan.ca/Daily/English/070919/d070919a.htm
134 Source: “Farm Production Expenditures 2007”, USDA NASS, 2008.
© Deloitte & Touche LLP and affiliated entities. Canadian Ornamental Horticulture Alliance 82
6. Sector use of water
Summary
• It is estimated that the Canadian ornamental production sector’s annual water usage is nearly 187 million m3 with the vast majority of water used being attributable to nursery operations (96.3 percent). Annual water usage for greenhouse and sod operations is estimated to be 6.6 million m3 (3.5 percent) and 0.4 million m3 (0.2 percent), respectively. On average, nursery production uses 8,361 m3/ha/year (in outdoor growing conditions); floriculture greenhouse production uses much less water at 657 m3/ha/year.
• The sector’s water intake represents about 3.9 percent of the total water intake in Canadian agriculture. Put differently, for every cubic metre of water intake the Canadian ornamental horticulture sector generates $21.94 in farm gate receipts. Comparatively, the broader agriculture industry is not as efficient, generating $3.73 less ($18.20/m3 of water intake) for every cubic metre of water intake135.
• It is estimated that approximately 15 percent of water used in greenhouses is attributable to the ornamental sector.
• A survey of 60 producers found that for floriculture greenhouse operations, 44.8 percent of growers paid for their water usage. The average cost for these operators was $1.04/m3 and ranged from $0.51/m3 to $2.50/m3. Only 6.9 percent of the growers paid a water access fee – all of whom were located in Ontario. None of the surveyed growers paid any water trucking fee.
• As for nursery operations, 26.7 percent of nursery growers paid for their water, 6.7 percent paid for trucking (all in Ontario) and 23.3 percent paid a water access fee (all in BC, ON and Quebec). The water access fee ranged from $120 to $4,000 per nursery per year. Since the data collected on water cost varied greatly it is not possible to calculate a reliable average cost. Surveyed growers were not able to provide us the amount of trucking fees paid.
• The majority of nursery and floriculture greenhouse growers surveyed are not recycling their water and lack knowledge regarding water treatment technologies. Moreover, most do not use water treatment technologies and lack sufficient knowledge about the technologies available.
• The University of Guelph offers a number of recommendations to improving water utilization within the ornamental sector, including that:
o the federal and provincial governments should invest more heavily in research and development activities related to water conservation and treatment technologies;
o government extension agents or specialists should work closely with universities and other research institutes to conduct research and demonstration projects in water conservation and treatment technologies;
o additional research in the nursery sub-sector should be conducted to assess water management protocols, recycling protocols and distribution systems.
• An inventory and summary overview of commonly used irrigation water treatment technologies was conducted by the University of Guelph and is contained in the report.
135 According to Statistics Canada, the domestic agriculture industry generated $40.5 billion in farm gate sales for 2007; it took in 4,098 million m3 of water. The
ornamental horticulture sector earned $2.2 billion in farm gate sales that same year and took in 187 million m3 of water. The ratios stated above are calculated by
dividing farm gate sales into water intake.
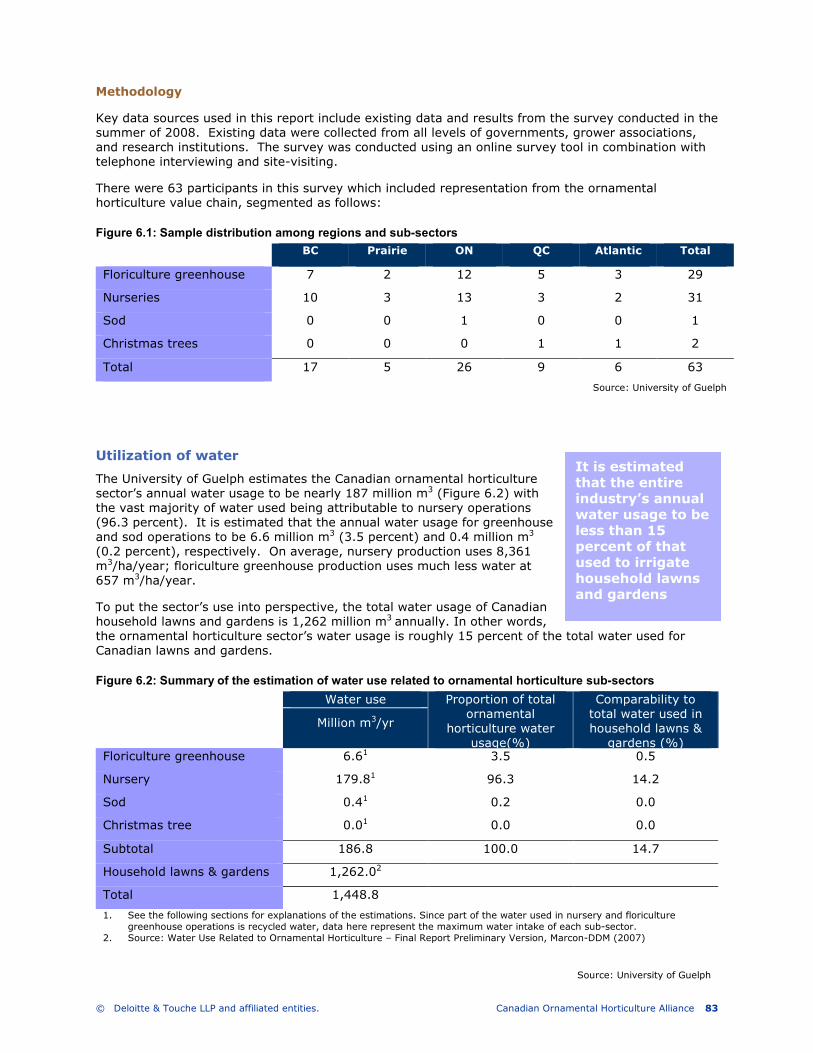
© Deloitte & Touche LLP and affiliated entities. Canadian Ornamental Horticulture Alliance 83
Methodology
Key data sources used in this report include existing data and results from the survey conducted in the summer of 2008. Existing data were collected from all levels of governments, grower associations, and research institutions. The survey was conducted using an online survey tool in combination with telephone interviewing and site-visiting.
There were 63 participants in this survey which included representation from the ornamental horticulture value chain, segmented as follows:
Figure 6.1: Sample distribution among regions and sub-sectors
BC Prairie ON QC Atlantic Total
Floriculture greenhouse 7 2 12 5 3 29
Nurseries 10 3 13 3 2 31
Sod 0 0 1 0 0 1
Christmas trees 0 0 0 1 1 2
Total 17 5 26 9 6 63
Source: University of Guelph
Utilization of water
The University of Guelph estimates the Canadian ornamental horticulture sector’s annual water usage to be nearly 187 million m3 (Figure 6.2) with the vast majority of water used being attributable to nursery operations (96.3 percent). It is estimated that the annual water usage for greenhouse and sod operations to be 6.6 million m3 (3.5 percent) and 0.4 million m3 (0.2 percent), respectively. On average, nursery production uses 8,361 m3/ha/year; floriculture greenhouse production uses much less water at 657 m3/ha/year.
To put the sector’s use into perspective, the total water usage of Canadian household lawns and gardens is 1,262 million m3 annually. In other words, the ornamental horticulture sector’s water usage is roughly 15 percent of the total water used for Canadian lawns and gardens.
Figure 6.2: Summary of the estimation of water use related to ornamental horticulture sub-sectors
Water use Proportion of total ornamental
horticulture water usage(%)
Comparability to total water used in household lawns &
gardens (%)
Million m3/yr
Floriculture greenhouse 6.61 3.5 0.5
Nursery 179.81 96.3 14.2
Sod 0.41 0.2 0.0
Christmas tree 0.01 0.0 0.0
Subtotal 186.8 100.0 14.7
Household lawns & gardens 1,262.02
Total 1,448.8
1. See the following sections for explanations of the estimations. Since part of the water used in nursery and floriculture greenhouse operations is recycled water, data here represent the maximum water intake of each sub-sector.
2. Source: Water Use Related to Ornamental Horticulture – Final Report Preliminary Version, Marcon-DDM (2007)
Source: University of Guelph
It is estimated that the entire industry’s annual water usage to be less than 15 percent of that used to irrigate household lawns and gardens
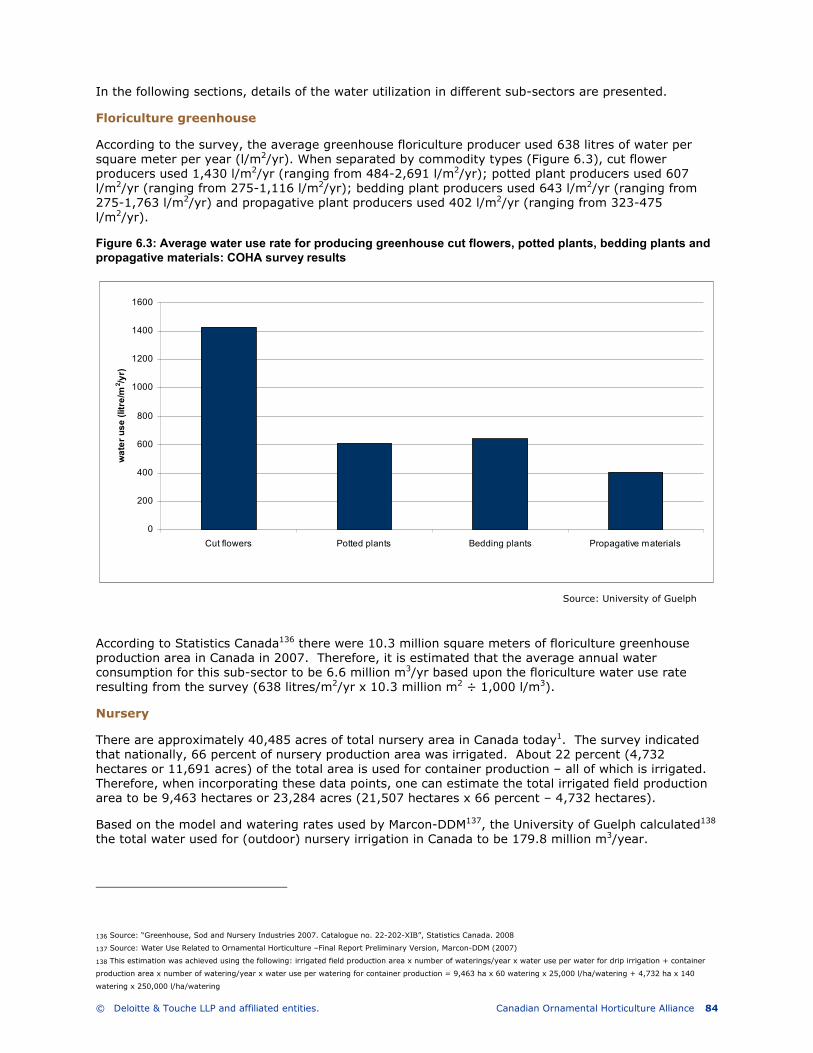
© Deloitte & Touche LLP and affiliated entities. Canadian Ornamental Horticulture Alliance 84
In the following sections, details of the water utilization in different sub-sectors are presented.
Floriculture greenhouse
According to the survey, the average greenhouse floriculture producer used 638 litres of water per square meter per year (l/m2/yr). When separated by commodity types (Figure 6.3), cut flower producers used 1,430 l/m2/yr (ranging from 484-2,691 l/m2/yr); potted plant producers used 607 l/m2/yr (ranging from 275-1,116 l/m2/yr); bedding plant producers used 643 l/m2/yr (ranging from 275-1,763 l/m2/yr) and propagative plant producers used 402 l/m2/yr (ranging from 323-475 l/m2/yr).
Figure 6.3: Average water use rate for producing greenhouse cut flowers, potted plants, bedding plants and propagative materials: COHA survey results
According to Statistics Canada136 there were 10.3 million square meters of floriculture greenhouse production area in Canada in 2007. Therefore, it is estimated that the average annual water consumption for this sub-sector to be 6.6 million m3/yr based upon the floriculture water use rate resulting from the survey (638 litres/m2/yr x 10.3 million m2 ÷ 1,000 l/m3).
Nursery
There are approximately 40,485 acres of total nursery area in Canada today1. The survey indicated that nationally, 66 percent of nursery production area was irrigated. About 22 percent (4,732 hectares or 11,691 acres) of the total area is used for container production – all of which is irrigated. Therefore, when incorporating these data points, one can estimate the total irrigated field production area to be 9,463 hectares or 23,284 acres (21,507 hectares x 66 percent – 4,732 hectares).
Based on the model and watering rates used by Marcon-DDM137, the University of Guelph calculated138 the total water used for (outdoor) nursery irrigation in Canada to be 179.8 million m3/year.
136 Source: “Greenhouse, Sod and Nursery Industries 2007. Catalogue no. 22-202-XIB”, Statistics Canada. 2008
137 Source: Water Use Related to Ornamental Horticulture –Final Report Preliminary Version, Marcon-DDM (2007)
138 This estimation was achieved using the following: irrigated field production area x number of waterings/year x water use per water for drip irrigation + container
production area x number of watering/year x water use per watering for container production = 9,463 ha x 60 watering x 25,000 l/ha/watering + 4,732 ha x 140
watering x 250,000 l/ha/watering
0
200
400
600
800
1000
1200
1400
1600
Cut flowers Potted plants Bedding plants Propagative materials
water use (litre/m
2/yr)
Source: University of Guelph
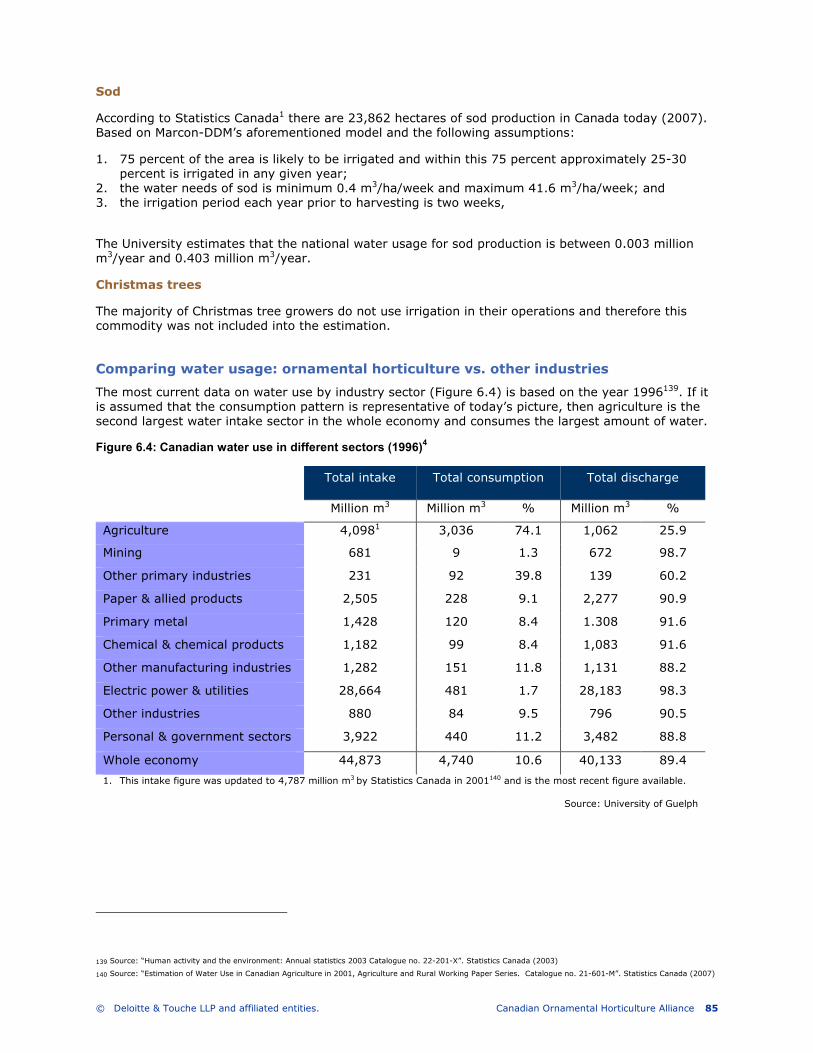
© Deloitte & Touche LLP and affiliated entities. Canadian Ornamental Horticulture Alliance 85
Sod
According to Statistics Canada1 there are 23,862 hectares of sod production in Canada today (2007). Based on Marcon-DDM’s aforementioned model and the following assumptions:
1. 75 percent of the area is likely to be irrigated and within this 75 percent approximately 25-30 percent is irrigated in any given year;
2. the water needs of sod is minimum 0.4 m3/ha/week and maximum 41.6 m3/ha/week; and 3. the irrigation period each year prior to harvesting is two weeks,
The University estimates that the national water usage for sod production is between 0.003 million m3/year and 0.403 million m3/year.
Christmas trees
The majority of Christmas tree growers do not use irrigation in their operations and therefore this commodity was not included into the estimation.
Comparing water usage: ornamental horticulture vs. other industries
The most current data on water use by industry sector (Figure 6.4) is based on the year 1996139. If it is assumed that the consumption pattern is representative of today’s picture, then agriculture is the second largest water intake sector in the whole economy and consumes the largest amount of water.
Figure 6.4: Canadian water use in different sectors (1996)4
Total intake Total consumption Total discharge
Million m3 Million m3 % Million m3 %
Agriculture 4,0981 3,036 74.1 1,062 25.9
Mining 681 9 1.3 672 98.7
Other primary industries 231 92 39.8 139 60.2
Paper & allied products 2,505 228 9.1 2,277 90.9
Primary metal 1,428 120 8.4 1.308 91.6
Chemical & chemical products 1,182 99 8.4 1,083 91.6
Other manufacturing industries 1,282 151 11.8 1,131 88.2
Electric power & utilities 28,664 481 1.7 28,183 98.3
Other industries 880 84 9.5 796 90.5
Personal & government sectors 3,922 440 11.2 3,482 88.8
Whole economy 44,873 4,740 10.6 40,133 89.4
1. This intake figure was updated to 4,787 million m3 by Statistics Canada in 2001140 and is the most recent figure available.
Source: University of Guelph
139 Source: “Human activity and the environment: Annual statistics 2003 Catalogue no. 22-201-X”. Statistics Canada (2003)
140 Source: “Estimation of Water Use in Canadian Agriculture in 2001, Agriculture and Rural Working Paper Series. Catalogue no. 21-601-M”. Statistics Canada (2007)
© Deloitte & Touche LLP and affiliated entities. Canadian Ornamental Horticulture Alliance 86
Based on the survey and resulting estimates, the total water use in the Canadian ornamental sector is approximately 186.8 million m3 per year (Figure 6.2). Some of this water includes recycled water; therefore this figure represents the maximum water intake of the sector.
The University of Guelph estimates that the Canadian ornamental sector’s water intake represents about 3.9 percent of the total water intake in Canadian agriculture. Put differently, for every cubic metre of water intake the Canadian ornamental horticulture sector generates $21.94 in farm gate receipts. Comparatively, the broader agriculture industry is not as efficient, generating $3.73 less ($18.20/m3 of water intake) for every cubic metre of water intake141.
Comparing floriculture greenhouse water use to vegetable greenhouse water use
Statistics Canada currently estimates that water use for greenhouse operations (both ornamental and vegetable greenhouses) is 44.9 million m3, representing about one percent of the total water used (4,507 million m3) for crop production in 20015.
Taking this analysis one step further, when incorporating the earlier estimation of annual ornamental water use in greenhouses (6.6 million m3), one can infer that only 14.7 percent of water used in greenhouses is attributable to the ornamental sector.
Sources of water for the ornamental horticulture sector
To assess the current water sources used by the ornamental horticulture sector, a national survey was conducted. The following are the results for floriculture greenhouse and nursery industries. Since the number of sod and Christmas tree producers covered by this survey was not large enough to draw any reliable conclusion, and, as mentioned above, the majority of Christmas tree producers do not irrigate, the University did not address water sources used by sod and Christmas tree production.
Floriculture greenhouse
Whether based on grower numbers (Figure 6.5) or by production area (Figure 6.6), the predominant water source for floriculture greenhouses, nationally, was city water, followed by collected rain water or well water.
141 According to Statistics Canada, the domestic agriculture industry generated $40.5 billion in farm gate sales for 2007; it took in 4,098 million m3 of water. The
ornamental horticulture sector earned $2.2 billion in farm gate sales that same year and took in 187 million m3 of water. The ratios stated above are calculated by
dividing farm gate sales into water intake.
Ornamental horticulture represents only four percent of total agriculture water intake
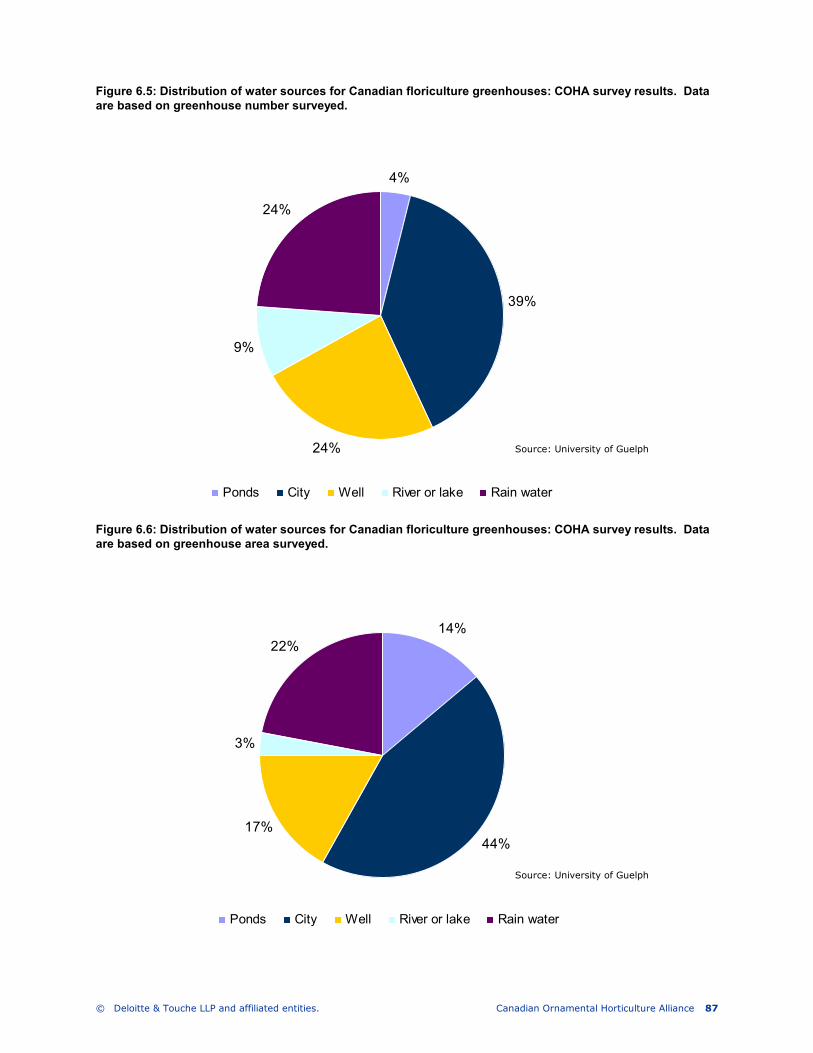
© Deloitte & Touche LLP and affiliated entities. Canadian Ornamental Horticulture Alliance 87
Figure 6.5: Distribution of water sources for Canadian floriculture greenhouses: COHA survey results. Data are based on greenhouse number surveyed.
Figure 6.6: Distribution of water sources for Canadian floriculture greenhouses: COHA survey results. Data are based on greenhouse area surveyed.
4%
24%
9%
24%
39%
Ponds City Well River or lake Rain water
Source: University of Guelph
14%
17%
3%
22%
44%
Ponds City Well River or lake Rain water
Source: University of Guelph
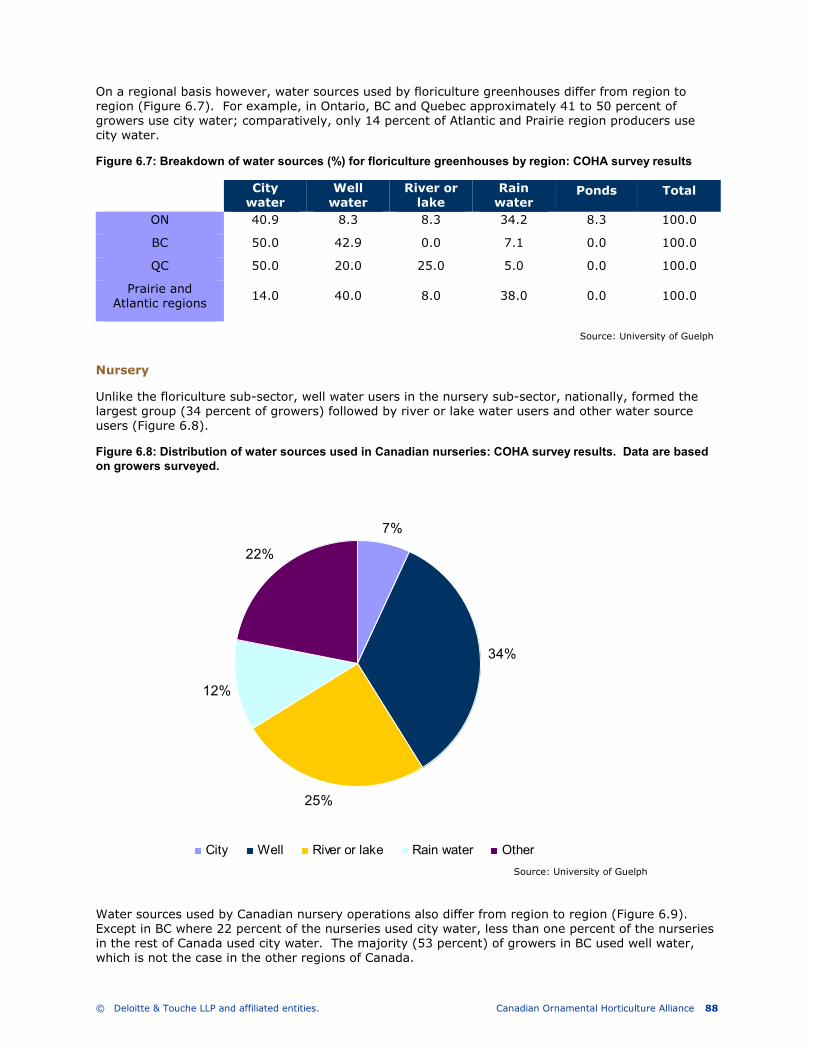
© Deloitte & Touche LLP and affiliated entities. Canadian Ornamental Horticulture Alliance 88
On a regional basis however, water sources used by floriculture greenhouses differ from region to region (Figure 6.7). For example, in Ontario, BC and Quebec approximately 41 to 50 percent of growers use city water; comparatively, only 14 percent of Atlantic and Prairie region producers use city water.
Figure 6.7: Breakdown of water sources (%) for floriculture greenhouses by region: COHA survey results
City water
Well water
River or lake
Rain water
Ponds Total
ON 40.9 8.3 8.3 34.2 8.3 100.0
BC 50.0 42.9 0.0 7.1 0.0 100.0
QC 50.0 20.0 25.0 5.0 0.0 100.0
Prairie and Atlantic regions
14.0 40.0 8.0 38.0 0.0 100.0
Source: University of Guelph
Nursery
Unlike the floriculture sub-sector, well water users in the nursery sub-sector, nationally, formed the largest group (34 percent of growers) followed by river or lake water users and other water source users (Figure 6.8).
Figure 6.8: Distribution of water sources used in Canadian nurseries: COHA survey results. Data are based on growers surveyed.
Water sources used by Canadian nursery operations also differ from region to region (Figure 6.9). Except in BC where 22 percent of the nurseries used city water, less than one percent of the nurseries in the rest of Canada used city water. The majority (53 percent) of growers in BC used well water, which is not the case in the other regions of Canada.
7%
25%
12%
22%
34%
City Well River or lake Rain water Other
Source: University of Guelph
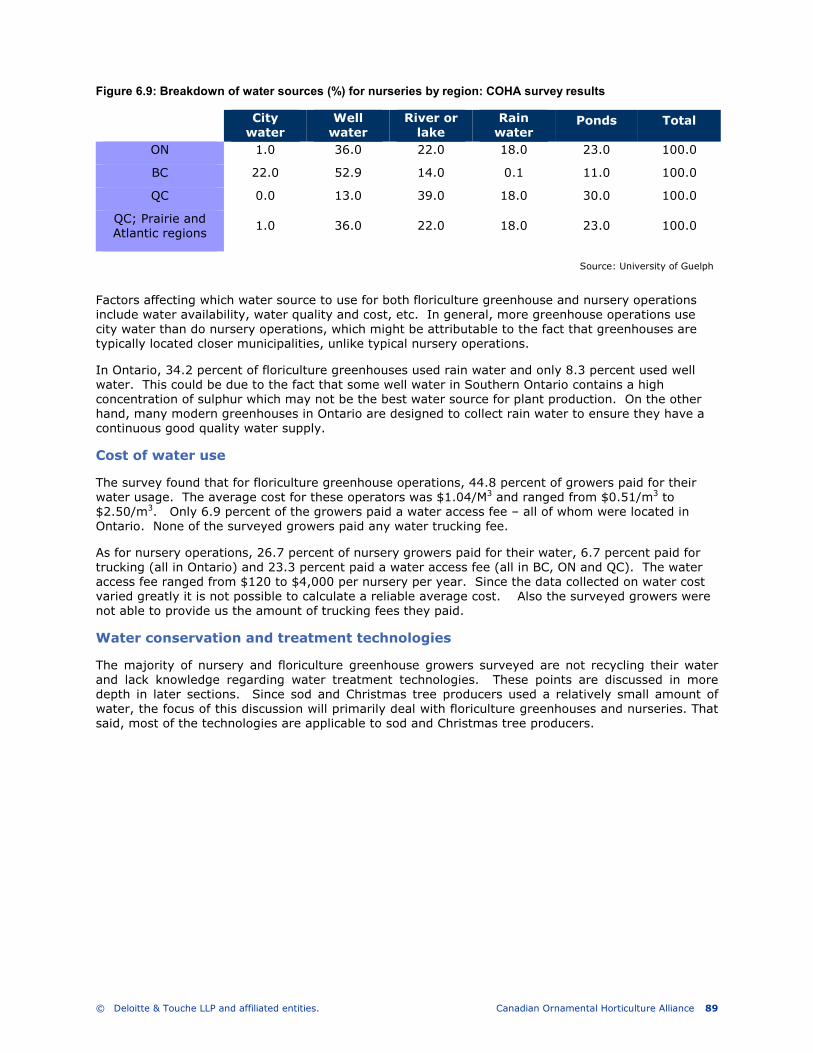
© Deloitte & Touche LLP and affiliated entities. Canadian Ornamental Horticulture Alliance 89
Figure 6.9: Breakdown of water sources (%) for nurseries by region: COHA survey results
City water
Well water
River or lake
Rain water
Ponds Total
ON 1.0 36.0 22.0 18.0 23.0 100.0
BC 22.0 52.9 14.0 0.1 11.0 100.0
QC 0.0 13.0 39.0 18.0 30.0 100.0
QC; Prairie and Atlantic regions
1.0 36.0 22.0 18.0 23.0 100.0
Source: University of Guelph
Factors affecting which water source to use for both floriculture greenhouse and nursery operations include water availability, water quality and cost, etc. In general, more greenhouse operations use city water than do nursery operations, which might be attributable to the fact that greenhouses are typically located closer municipalities, unlike typical nursery operations.
In Ontario, 34.2 percent of floriculture greenhouses used rain water and only 8.3 percent used well water. This could be due to the fact that some well water in Southern Ontario contains a high concentration of sulphur which may not be the best water source for plant production. On the other hand, many modern greenhouses in Ontario are designed to collect rain water to ensure they have a continuous good quality water supply.
Cost of water use
The survey found that for floriculture greenhouse operations, 44.8 percent of growers paid for their water usage. The average cost for these operators was $1.04/M3 and ranged from $0.51/m3 to $2.50/m3. Only 6.9 percent of the growers paid a water access fee – all of whom were located in Ontario. None of the surveyed growers paid any water trucking fee.
As for nursery operations, 26.7 percent of nursery growers paid for their water, 6.7 percent paid for trucking (all in Ontario) and 23.3 percent paid a water access fee (all in BC, ON and QC). The water access fee ranged from $120 to $4,000 per nursery per year. Since the data collected on water cost varied greatly it is not possible to calculate a reliable average cost. Also the surveyed growers were not able to provide us the amount of trucking fees they paid.
Water conservation and treatment technologies
The majority of nursery and floriculture greenhouse growers surveyed are not recycling their water and lack knowledge regarding water treatment technologies. These points are discussed in more depth in later sections. Since sod and Christmas tree producers used a relatively small amount of water, the focus of this discussion will primarily deal with floriculture greenhouses and nurseries. That said, most of the technologies are applicable to sod and Christmas tree producers.
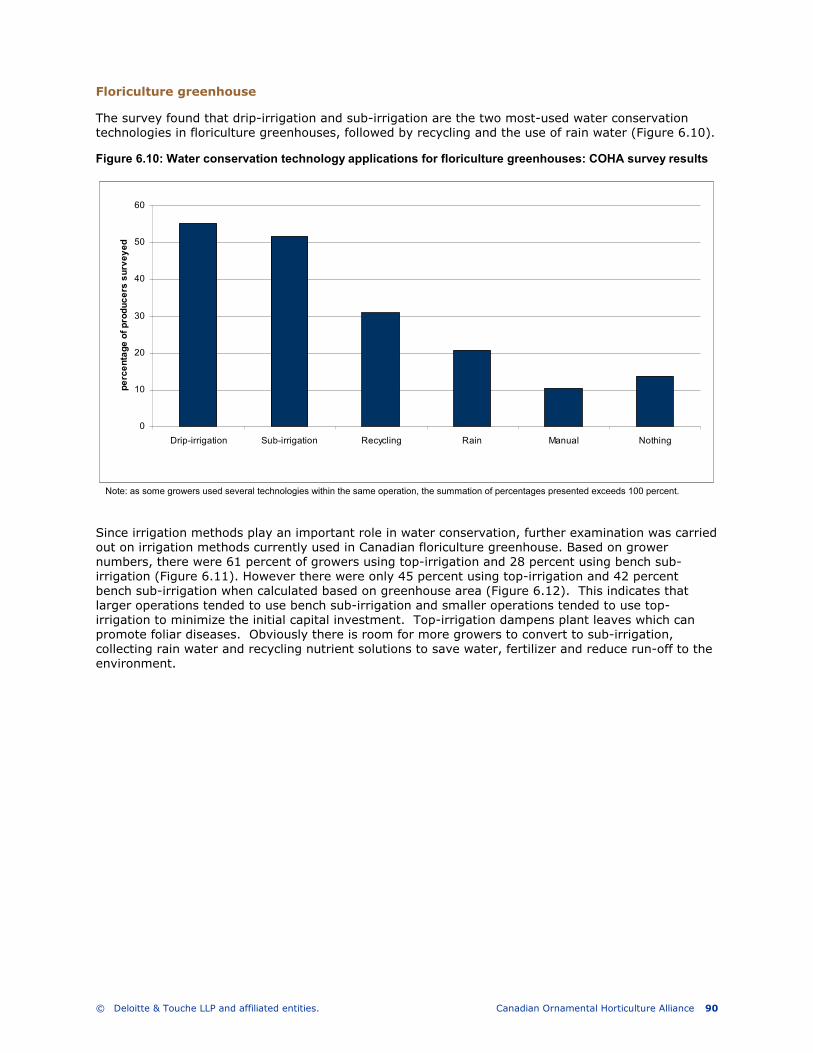
© Deloitte & Touche LLP and affiliated entities. Canadian Ornamental Horticulture Alliance 90
Floriculture greenhouse
The survey found that drip-irrigation and sub-irrigation are the two most-used water conservation technologies in floriculture greenhouses, followed by recycling and the use of rain water (Figure 6.10).
Figure 6.10: Water conservation technology applications for floriculture greenhouses: COHA survey results
Since irrigation methods play an important role in water conservation, further examination was carried out on irrigation methods currently used in Canadian floriculture greenhouse. Based on grower numbers, there were 61 percent of growers using top-irrigation and 28 percent using bench sub-irrigation (Figure 6.11). However there were only 45 percent using top-irrigation and 42 percent bench sub-irrigation when calculated based on greenhouse area (Figure 6.12). This indicates that larger operations tended to use bench sub-irrigation and smaller operations tended to use top-irrigation to minimize the initial capital investment. Top-irrigation dampens plant leaves which can promote foliar diseases. Obviously there is room for more growers to convert to sub-irrigation, collecting rain water and recycling nutrient solutions to save water, fertilizer and reduce run-off to the environment.
0
10
20
30
40
50
60
Drip-irrigation Sub-irrigation Recycling Rain Manual Nothing
percentage of producers surveyed
Note: as some growers used several technologies within the same operation, the summation of percentages presented exceeds 100 percent.
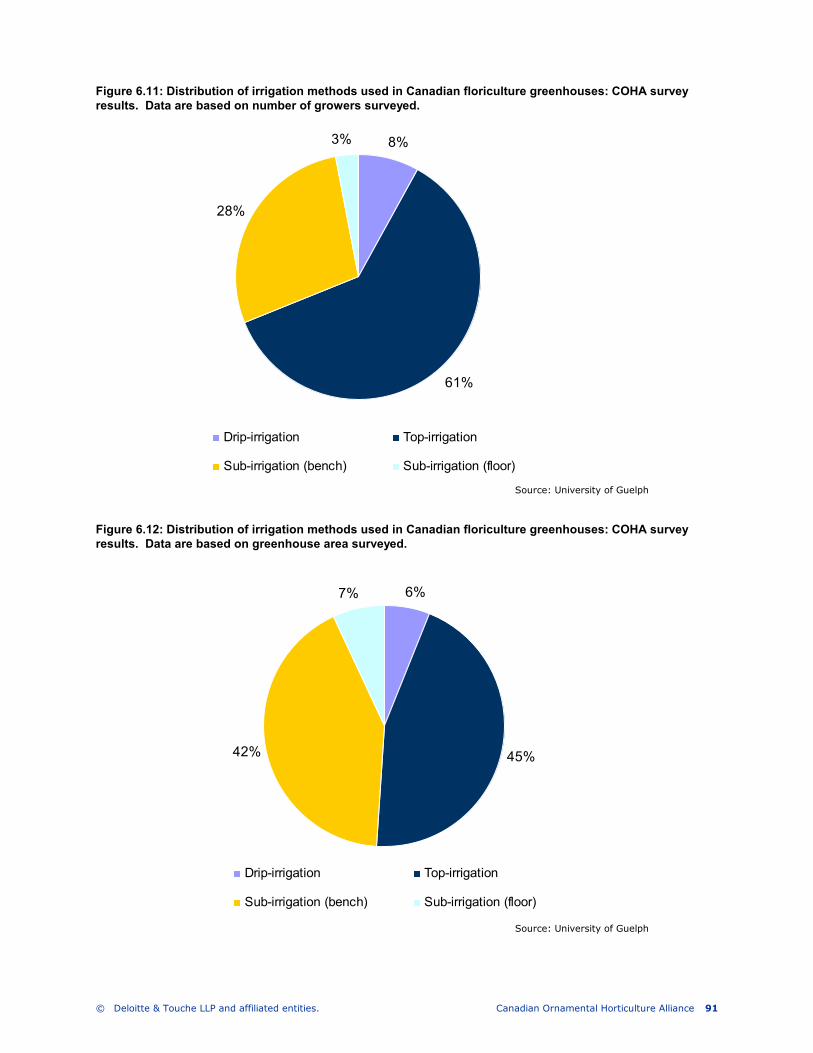
© Deloitte & Touche LLP and affiliated entities. Canadian Ornamental Horticulture Alliance 91
Figure 6.11: Distribution of irrigation methods used in Canadian floriculture greenhouses: COHA survey results. Data are based on number of growers surveyed.
Figure 6.12: Distribution of irrigation methods used in Canadian floriculture greenhouses: COHA survey results. Data are based on greenhouse area surveyed.
6%
42%
7%
45%
Drip-irrigation Top-irrigation
Sub-irrigation (bench) Sub-irrigation (floor)
8%
28%
3%
61%
Drip-irrigation Top-irrigation
Sub-irrigation (bench) Sub-irrigation (floor)
Source: University of Guelph
Source: University of Guelph
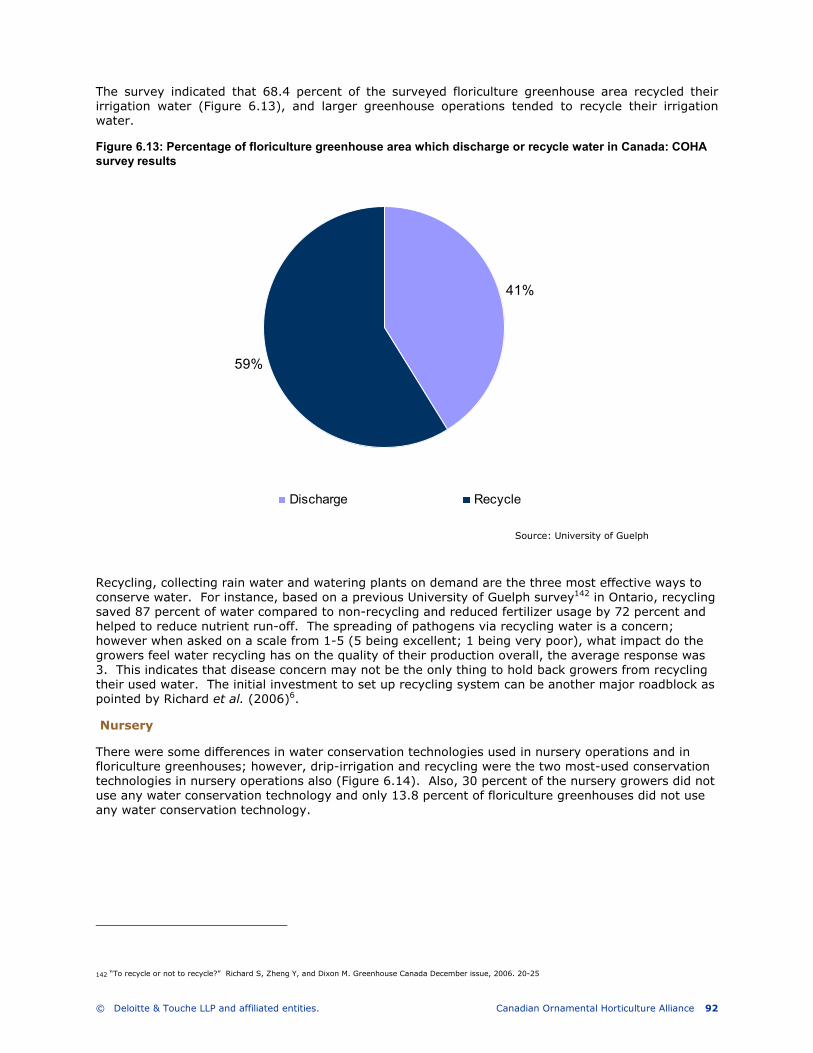
© Deloitte & Touche LLP and affiliated entities. Canadian Ornamental Horticulture Alliance 92
The survey indicated that 68.4 percent of the surveyed floriculture greenhouse area recycled their irrigation water (Figure 6.13), and larger greenhouse operations tended to recycle their irrigation water.
Figure 6.13: Percentage of floriculture greenhouse area which discharge or recycle water in Canada: COHA survey results
Recycling, collecting rain water and watering plants on demand are the three most effective ways to conserve water. For instance, based on a previous University of Guelph survey142 in Ontario, recycling saved 87 percent of water compared to non-recycling and reduced fertilizer usage by 72 percent and helped to reduce nutrient run-off. The spreading of pathogens via recycling water is a concern; however when asked on a scale from 1-5 (5 being excellent; 1 being very poor), what impact do the growers feel water recycling has on the quality of their production overall, the average response was 3. This indicates that disease concern may not be the only thing to hold back growers from recycling their used water. The initial investment to set up recycling system can be another major roadblock as pointed by Richard et al. (2006)6.
Nursery
There were some differences in water conservation technologies used in nursery operations and in floriculture greenhouses; however, drip-irrigation and recycling were the two most-used conservation technologies in nursery operations also (Figure 6.14). Also, 30 percent of the nursery growers did not use any water conservation technology and only 13.8 percent of floriculture greenhouses did not use any water conservation technology.
142 “To recycle or not to recycle?” Richard S, Zheng Y, and Dixon M. Greenhouse Canada December issue, 2006. 20-25
41%
59%
Discharge Recycle
Source: University of Guelph
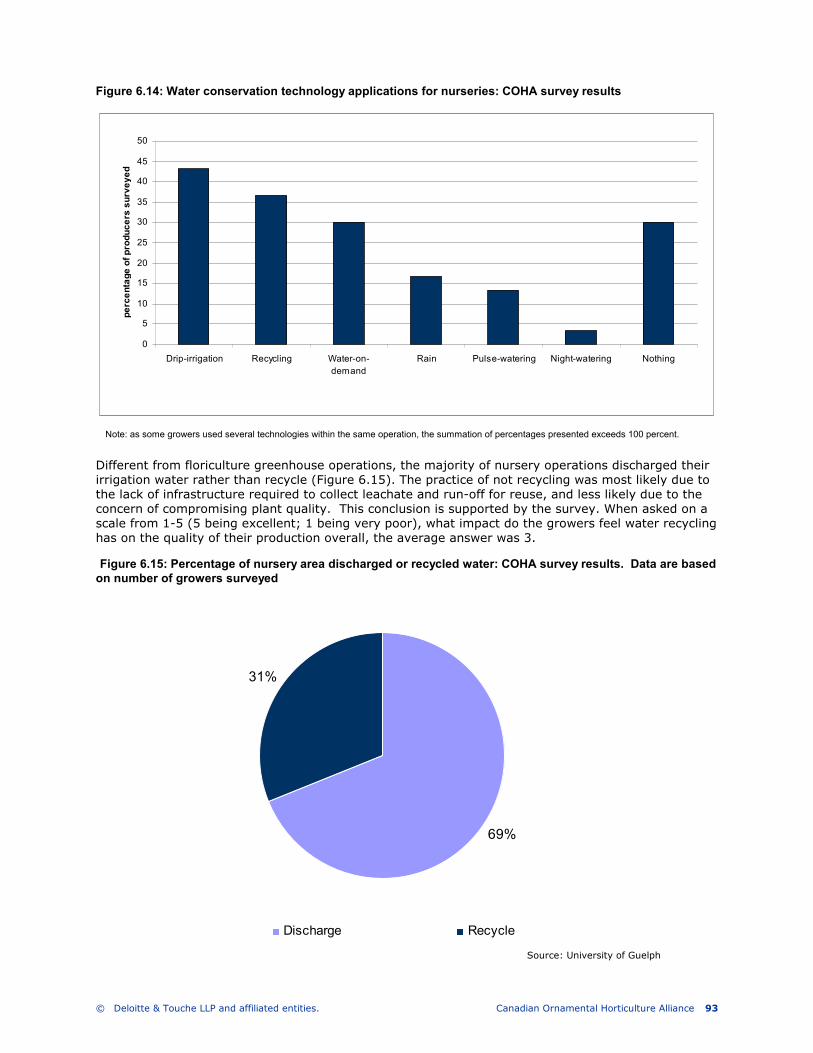
© Deloitte & Touche LLP and affiliated entities. Canadian Ornamental Horticulture Alliance 93
Figure 6.14: Water conservation technology applications for nurseries: COHA survey results
Different from floriculture greenhouse operations, the majority of nursery operations discharged their irrigation water rather than recycle (Figure 6.15). The practice of not recycling was most likely due to the lack of infrastructure required to collect leachate and run-off for reuse, and less likely due to the concern of compromising plant quality. This conclusion is supported by the survey. When asked on a scale from 1-5 (5 being excellent; 1 being very poor), what impact do the growers feel water recycling has on the quality of their production overall, the average answer was 3.
Figure 6.15: Percentage of nursery area discharged or recycled water: COHA survey results. Data are based on number of growers surveyed
0
5
10
15
20
25
30
35
40
45
50
Drip-irrigation Recycling Water-on-
demand
Rain Pulse-watering Night-watering Nothing
percentage of producers surveyed
69%
31%
Discharge Recycle
Note: as some growers used several technologies within the same operation, the summation of percentages presented exceeds 100 percent.
Source: University of Guelph
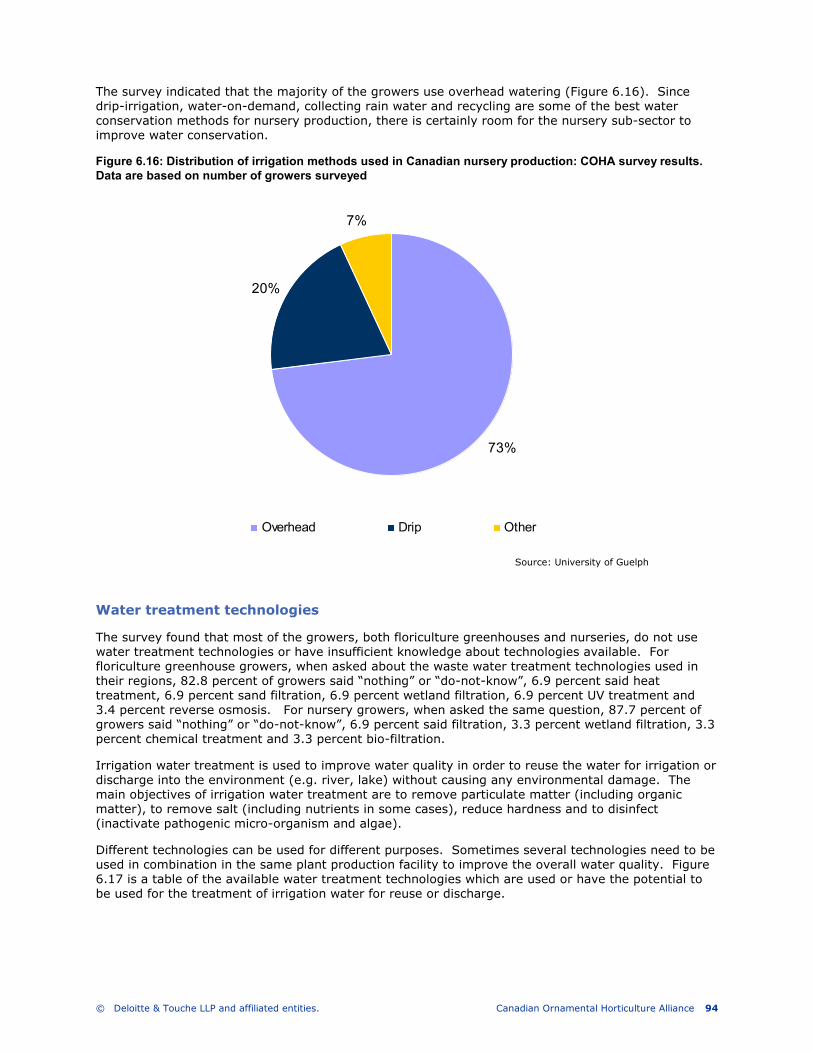
© Deloitte & Touche LLP and affiliated entities. Canadian Ornamental Horticulture Alliance 94
The survey indicated that the majority of the growers use overhead watering (Figure 6.16). Since drip-irrigation, water-on-demand, collecting rain water and recycling are some of the best water conservation methods for nursery production, there is certainly room for the nursery sub-sector to improve water conservation.
Figure 6.16: Distribution of irrigation methods used in Canadian nursery production: COHA survey results. Data are based on number of growers surveyed
Water treatment technologies
The survey found that most of the growers, both floriculture greenhouses and nurseries, do not use water treatment technologies or have insufficient knowledge about technologies available. For floriculture greenhouse growers, when asked about the waste water treatment technologies used in their regions, 82.8 percent of growers said “nothing” or “do-not-know”, 6.9 percent said heat treatment, 6.9 percent sand filtration, 6.9 percent wetland filtration, 6.9 percent UV treatment and 3.4 percent reverse osmosis. For nursery growers, when asked the same question, 87.7 percent of growers said “nothing” or “do-not-know”, 6.9 percent said filtration, 3.3 percent wetland filtration, 3.3 percent chemical treatment and 3.3 percent bio-filtration.
Irrigation water treatment is used to improve water quality in order to reuse the water for irrigation or discharge into the environment (e.g. river, lake) without causing any environmental damage. The main objectives of irrigation water treatment are to remove particulate matter (including organic matter), to remove salt (including nutrients in some cases), reduce hardness and to disinfect (inactivate pathogenic micro-organism and algae).
Different technologies can be used for different purposes. Sometimes several technologies need to be used in combination in the same plant production facility to improve the overall water quality. Figure 6.17 is a table of the available water treatment technologies which are used or have the potential to be used for the treatment of irrigation water for reuse or discharge.
73%
7%
20%
Overhead Drip Other
Source: University of Guelph
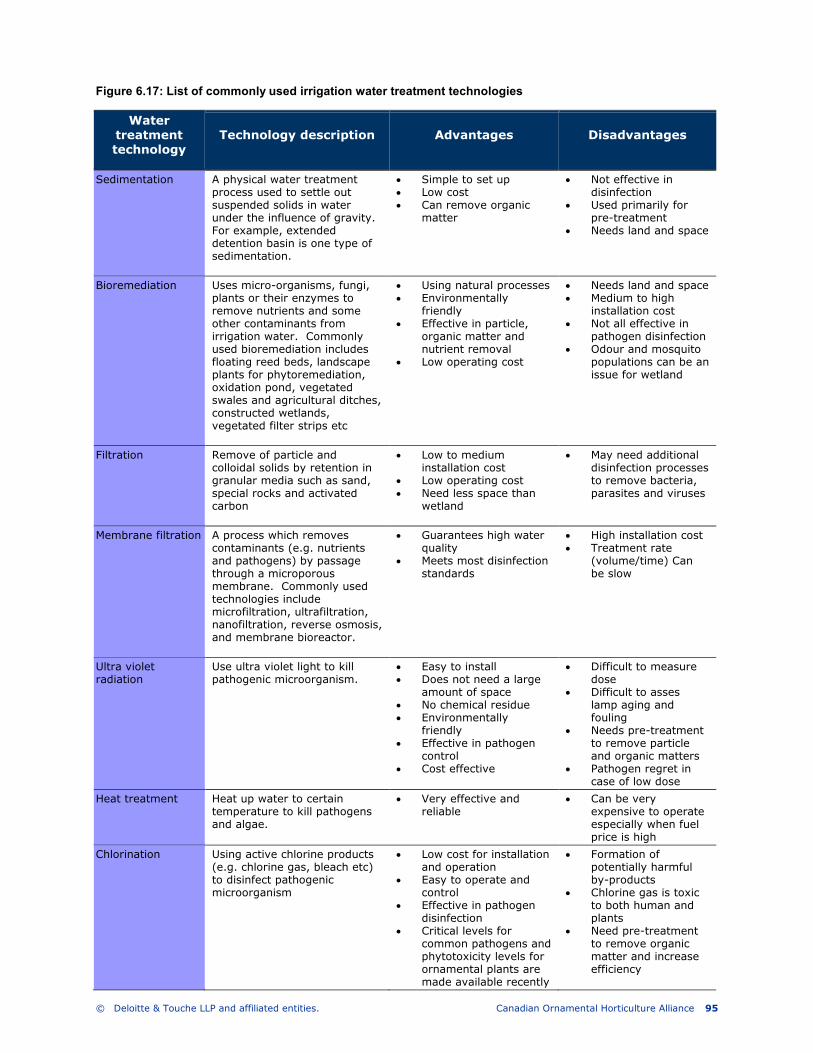
© Deloitte & Touche LLP and affiliated entities. Canadian Ornamental Horticulture Alliance 95
Figure 6.17: List of commonly used irrigation water treatment technologies
Water treatment technology
Technology description Advantages Disadvantages
Sedimentation A physical water treatment process used to settle out suspended solids in water under the influence of gravity. For example, extended detention basin is one type of sedimentation.
• Simple to set up • Low cost • Can remove organic
matter
• Not effective in disinfection
• Used primarily for pre-treatment
• Needs land and space
Bioremediation Uses micro-organisms, fungi, plants or their enzymes to remove nutrients and some other contaminants from irrigation water. Commonly used bioremediation includes floating reed beds, landscape plants for phytoremediation, oxidation pond, vegetated swales and agricultural ditches, constructed wetlands, vegetated filter strips etc
• Using natural processes • Environmentally
friendly • Effective in particle,
organic matter and nutrient removal
• Low operating cost
• Needs land and space • Medium to high
installation cost • Not all effective in
pathogen disinfection • Odour and mosquito
populations can be an issue for wetland
Filtration Remove of particle and colloidal solids by retention in granular media such as sand, special rocks and activated carbon
• Low to medium installation cost
• Low operating cost • Need less space than
wetland
• May need additional disinfection processes to remove bacteria, parasites and viruses
Membrane filtration A process which removes contaminants (e.g. nutrients and pathogens) by passage through a microporous membrane. Commonly used technologies include microfiltration, ultrafiltration, nanofiltration, reverse osmosis, and membrane bioreactor.
• Guarantees high water quality
• Meets most disinfection standards
• High installation cost • Treatment rate
(volume/time) Can be slow
Ultra violet radiation
Use ultra violet light to kill pathogenic microorganism.
• Easy to install • Does not need a large
amount of space • No chemical residue • Environmentally
friendly • Effective in pathogen
control • Cost effective
• Difficult to measure dose
• Difficult to asses lamp aging and fouling
• Needs pre-treatment to remove particle and organic matters
• Pathogen regret in case of low dose
Heat treatment Heat up water to certain temperature to kill pathogens and algae.
• Very effective and reliable
• Can be very expensive to operate especially when fuel price is high
Chlorination Using active chlorine products (e.g. chlorine gas, bleach etc) to disinfect pathogenic microorganism
• Low cost for installation and operation
• Easy to operate and control
• Effective in pathogen disinfection
• Critical levels for common pathogens and phytotoxicity levels for ornamental plants are made available recently
• Formation of potentially harmful by-products
• Chlorine gas is toxic to both human and plants
• Need pre-treatment to remove organic matter and increase efficiency
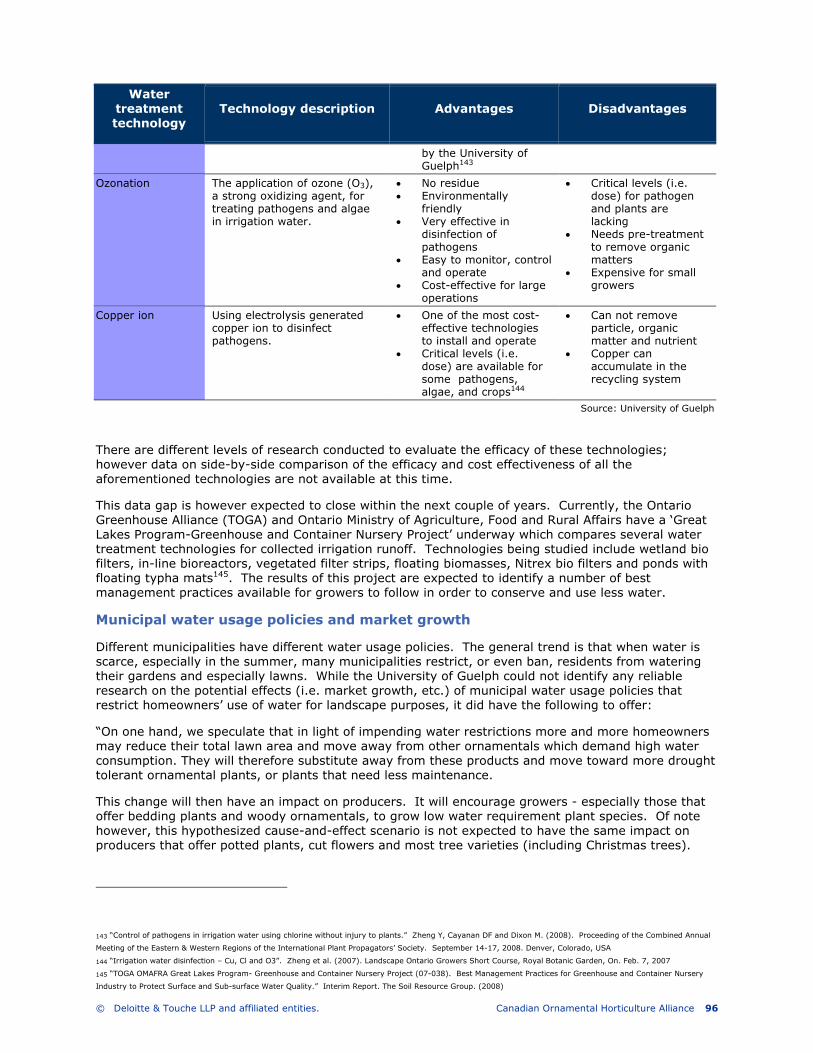
© Deloitte & Touche LLP and affiliated entities. Canadian Ornamental Horticulture Alliance 96
Water treatment technology
Technology description Advantages Disadvantages
by the University of Guelph143
Ozonation The application of ozone (O3), a strong oxidizing agent, for treating pathogens and algae in irrigation water.
• No residue • Environmentally
friendly • Very effective in
disinfection of pathogens
• Easy to monitor, control and operate
• Cost-effective for large operations
• Critical levels (i.e. dose) for pathogen and plants are lacking
• Needs pre-treatment to remove organic matters
• Expensive for small growers
Copper ion Using electrolysis generated copper ion to disinfect pathogens.
• One of the most cost-effective technologies to install and operate
• Critical levels (i.e. dose) are available for some pathogens, algae, and crops144
• Can not remove particle, organic matter and nutrient
• Copper can accumulate in the recycling system
Source: University of Guelph
There are different levels of research conducted to evaluate the efficacy of these technologies; however data on side-by-side comparison of the efficacy and cost effectiveness of all the aforementioned technologies are not available at this time.
This data gap is however expected to close within the next couple of years. Currently, the Ontario Greenhouse Alliance (TOGA) and Ontario Ministry of Agriculture, Food and Rural Affairs have a ‘Great Lakes Program-Greenhouse and Container Nursery Project’ underway which compares several water treatment technologies for collected irrigation runoff. Technologies being studied include wetland bio filters, in-line bioreactors, vegetated filter strips, floating biomasses, Nitrex bio filters and ponds with floating typha mats145. The results of this project are expected to identify a number of best management practices available for growers to follow in order to conserve and use less water.
Municipal water usage policies and market growth
Different municipalities have different water usage policies. The general trend is that when water is scarce, especially in the summer, many municipalities restrict, or even ban, residents from watering their gardens and especially lawns. While the University of Guelph could not identify any reliable research on the potential effects (i.e. market growth, etc.) of municipal water usage policies that restrict homeowners’ use of water for landscape purposes, it did have the following to offer:
“On one hand, we speculate that in light of impending water restrictions more and more homeowners may reduce their total lawn area and move away from other ornamentals which demand high water consumption. They will therefore substitute away from these products and move toward more drought tolerant ornamental plants, or plants that need less maintenance.
This change will then have an impact on producers. It will encourage growers - especially those that offer bedding plants and woody ornamentals, to grow low water requirement plant species. Of note however, this hypothesized cause-and-effect scenario is not expected to have the same impact on producers that offer potted plants, cut flowers and most tree varieties (including Christmas trees).
143 “Control of pathogens in irrigation water using chlorine without injury to plants.” Zheng Y, Cayanan DF and Dixon M. (2008). Proceeding of the Combined Annual
Meeting of the Eastern & Western Regions of the International Plant Propagators’ Society. September 14-17, 2008. Denver, Colorado, USA
144 “Irrigation water disinfection – Cu, Cl and O3”. Zheng et al. (2007). Landscape Ontario Growers Short Course, Royal Botanic Garden, On. Feb. 7, 2007
145 “TOGA OMAFRA Great Lakes Program- Greenhouse and Container Nursery Project (07-038). Best Management Practices for Greenhouse and Container Nursery
Industry to Protect Surface and Sub-surface Water Quality.” Interim Report. The Soil Resource Group. (2008)

© Deloitte & Touche LLP and affiliated entities. Canadian Ornamental Horticulture Alliance 97
This is because 1) most potted plants are for indoor use; 2) trees do not need to be watered continuously when planted in the garden or in the landscaped area.
On the other hand, in general, municipal water usage restrictions may affect operations which use city water. For example, about 44 percent of the floriculture greenhouse area surveyed use city water. These operations are potentially at risk in the event water shortages force municipalities to ration supplies. Further, while only seven percent of nursery growers use city water, they tend to use significantly more water as shown above. Therefore these growers too should be prepared to seek alternative water sources.
Summary of recommendations
To ensure the continuous growth of the Canadian ornamental horticulture value chain without limitations of future water shortage, the University of Guelph provides the following water-related recommendations:
1. The federal and provincial governments should invest more money in research and development of water conservation and treatment technologies;
2. Governments’ extension agents or specialists should work closely with universities and other research institutes to conduct research and demonstration projects in water conservation and treatment technologies;
3. Grower associations should have some educational programs to promote the need for producer water conservation. This would also serve to inform producers about water conservation and the feasibility of various treatment technologies;
4. Governments should also provide more programs to support growers financially to invest into water conservation facilities;
5. Producers should explore and utilize all available government support programs in order to actively participate in water conservation;
6. To conserve water, producers should consider employing conservation strategies such as watering on demand, recycling water and nutrient solutions, and collection of rain water and water run-off;
7. In light of the municipalities’ water use restriction polices, growers should stay informed on changing consumer preferences and reflect these changes in their product inventories accordingly. For example, a water restriction or watering ban in dry seasons can drive consumers to buy drought tolerant plant species and eliminate or reduce lawn area;
8. Growers currently using city water for irrigation should be prepared to find and use alternative water sources; and
9. Additional research is recommended within the nursery sub-sector to assess water management protocols, recycling protocols and distribution systems.
© Deloitte & Touche LLP and affiliated entities. Canadian Ornamental Horticulture Alliance 98
7. Policy Strategy
• Canada’s ornamental horticulture sector has a major economic impact in Canada and significant potential to develop and expand. The sector needs to work with governments at all levels on strategies to achieve growth
• Innovation is fundamental to the future of the sector, and steering a greater proportion of
agricultural industry research funding toward ornamental horticulture should be among the top priorities of COHA and the federal and provincial governments
• There is a vast range of regulations impacting the ornamental horticultural sector, including
• Trade agreements, trade barriers & import restrictions
• Patents, royalties & copyrights
• Environmental protection
• Pesticide and other chemical regulations
• Labour code, including farm labour collective bargaining rights; etc.
• Producer survey results indicate that the sector faces high compliance costs, and that a
mismatch in the fabric of regulatory enforcement, particularly in connection with quarantine events or the elimination of trade tariffs can have a catastrophic consequence for a producer
• Results of interviews with Federal and Provincial government contacts indicate that:
• COHA’s ability to shape and influence public policy is underdeveloped relative to the economic size and activity of its constituent members; and
• COHA’s desired public policy participation and influence level exceeds its current level of political currency
• Because the sector has no marketing boards, quota systems, or quality/grading standards to protect Canada’s producers against highly competitive U.S., South American, or international growers, strong sector association representation and cohesive messaging at both the Federal and Provincial levels is needed to represent the interests of Canadian producers
Regulatory framework
The ornamental horticultural sector is subject to a wide array of international, federal, provincial and local government regulations. Internationally, several conventions can have an impact on the sector. Examples include the:
• World Trade Organisation Agreement on the Application of Sanitary and Phytosanitary Measures;
• International Plant Protection Convention (IPPC); and
• Convention on International Trade in Endangered Species of Wild Flora and Fauna (CITES).
Canada is a signatory to these conventions, and others, and ratifies them through federal legislation, e.g. The Wild Animal and Plant Protection and Regulation of International and Interprovincial Trade Act (WAPPRIITA) (1996), and Wild Animal and Plant Trade Regulations (1996), which is the domestic legislation for implementation of the CITE Convention in Canada, and is enforced by Environment Canada.
The following is an example of the roles various levels of government play in the regulatory framework.
© Deloitte & Touche LLP and affiliated entities. Canadian Ornamental Horticulture Alliance 99
Pesticides imported into, or sold or used in Canada are regulated nationally under the Pest Control Products Act (PCP Act) and Regulations. The Pest Management Regulatory Agency (PMRA) is responsible for administering this legislation, registering pest control products, re-evaluating registered products and setting maximum residue limits under the Food and Drugs Act (FDA).146
The distribution of responsibilities between the various levels of government is the following:
• Federal
o Pest Control Products Act, (PCP Act) and Regulations
o Pesticide registration and re-evaluation
o Human health and safety
o Environmental impact
o Value assessment (including efficacy)
o Alternative strategies
o Compliance and enforcement
• Provincial
o Transportation, sale, use,
o Storage and disposal
o Training, certification and
o Licensing of applicators and vendors
o Spills and accidents
o Permits and use restrictions
o Compliance and enforcement
• Local/Municipal
o Bylaws for municipal (and, in some cases, private and residential) lands
Regulatory implications for the sector and potential policy focus areas
As part of this study, a survey of 62 growers across Canada was conducted to identify “points of pain” with respect to legislative and regulatory components. Producer survey results indicate that the sector faces high compliance costs, and that a mismatch in the fabric of regulatory enforcement, particularly in connection with quarantine events or the elimination of trade tariffs can have a catastrophic consequence for a producer. The survey methodology was a computer assisted telephone interview (CATI) technique across the following stratified distribution.
146 Heath Canada, PMRA Fact Sheet, March, 2003.
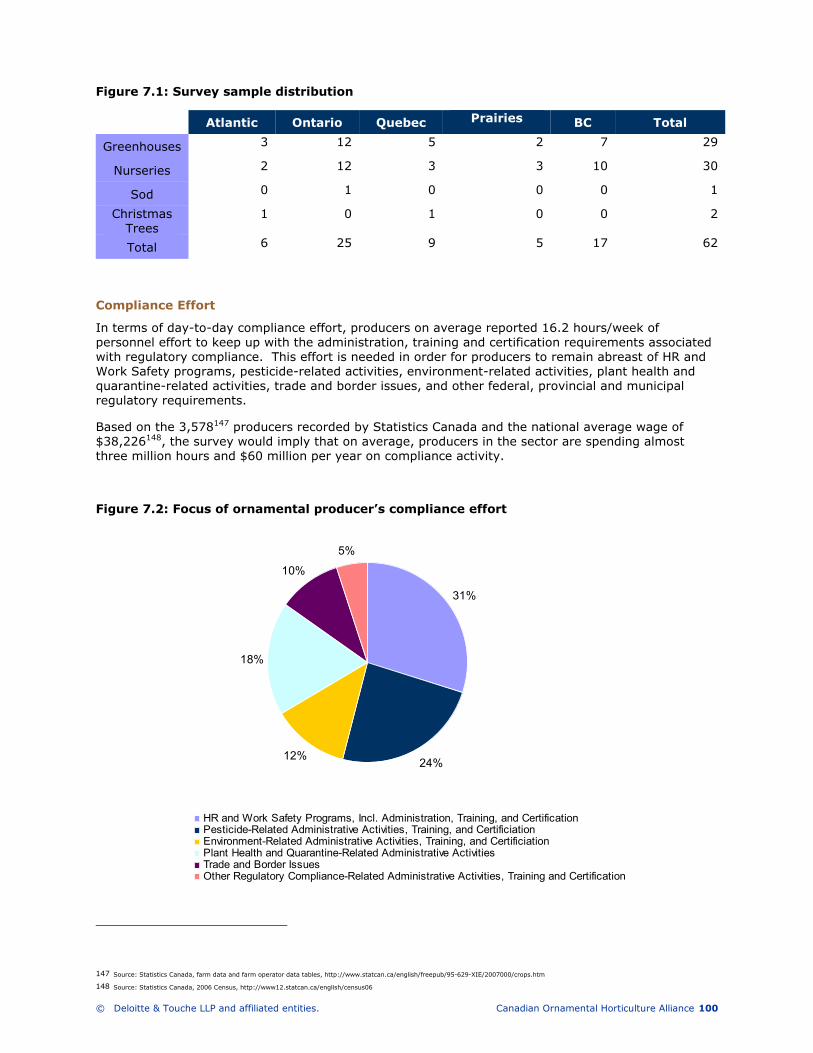
© Deloitte & Touche LLP and affiliated entities. Canadian Ornamental Horticulture Alliance 100
Figure 7.1: Survey sample distribution
Atlantic Ontario Quebec Prairies BC Total
Greenhouses 3 12 5 2 7 29
Nurseries 2 12 3 3 10 30
Sod 0 1 0 0 0 1
Christmas Trees
1 0 1 0 0 2
Total 6 25 9 5 17 62
Compliance Effort
In terms of day-to-day compliance effort, producers on average reported 16.2 hours/week of personnel effort to keep up with the administration, training and certification requirements associated with regulatory compliance. This effort is needed in order for producers to remain abreast of HR and Work Safety programs, pesticide-related activities, environment-related activities, plant health and quarantine-related activities, trade and border issues, and other federal, provincial and municipal regulatory requirements.
Based on the 3,578147 producers recorded by Statistics Canada and the national average wage of $38,226148, the survey would imply that on average, producers in the sector are spending almost three million hours and $60 million per year on compliance activity.
Figure 7.2: Focus of ornamental producer’s compliance effort
31%
12%
18%
10%
5%
24%
24%
HR and Work Safety Programs, Incl. Administration, Training, and CertificationPesticide-Related Administrative Activities, Training, and CertificiationEnvironment-Related Administrative Activities, Training, and CertificiationPlant Health and Quarantine-Related Administrative ActivitiesTrade and Border Issues Other Regulatory Compliance-Related Administrative Activities, Training and Certification
147 Source: Statistics Canada, farm data and farm operator data tables, http://www.statcan.ca/english/freepub/95-629-XIE/2007000/crops.htm 148 Source: Statistics Canada, 2006 Census, http://www12.statcan.ca/english/census06
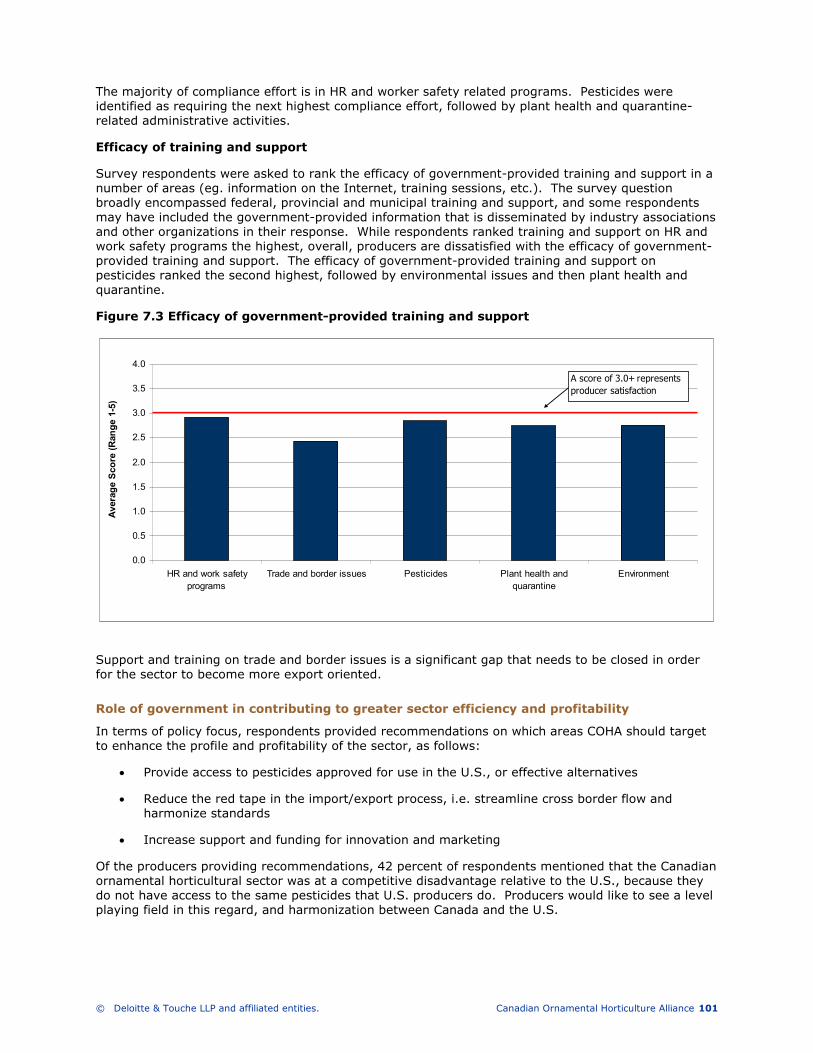
© Deloitte & Touche LLP and affiliated entities. Canadian Ornamental Horticulture Alliance 101
The majority of compliance effort is in HR and worker safety related programs. Pesticides were identified as requiring the next highest compliance effort, followed by plant health and quarantine-related administrative activities.
Efficacy of training and support
Survey respondents were asked to rank the efficacy of government-provided training and support in a number of areas (eg. information on the Internet, training sessions, etc.). The survey question broadly encompassed federal, provincial and municipal training and support, and some respondents may have included the government-provided information that is disseminated by industry associations and other organizations in their response. While respondents ranked training and support on HR and work safety programs the highest, overall, producers are dissatisfied with the efficacy of government-provided training and support. The efficacy of government-provided training and support on pesticides ranked the second highest, followed by environmental issues and then plant health and quarantine.
Figure 7.3 Efficacy of government-provided training and support
Support and training on trade and border issues is a significant gap that needs to be closed in order for the sector to become more export oriented.
Role of government in contributing to greater sector efficiency and profitability
In terms of policy focus, respondents provided recommendations on which areas COHA should target to enhance the profile and profitability of the sector, as follows:
• Provide access to pesticides approved for use in the U.S., or effective alternatives
• Reduce the red tape in the import/export process, i.e. streamline cross border flow and harmonize standards
• Increase support and funding for innovation and marketing
Of the producers providing recommendations, 42 percent of respondents mentioned that the Canadian ornamental horticultural sector was at a competitive disadvantage relative to the U.S., because they do not have access to the same pesticides that U.S. producers do. Producers would like to see a level playing field in this regard, and harmonization between Canada and the U.S.
0.0
0.5
1.0
1.5
2.0
2.5
3.0
3.5
4.0
HR and work safety
programs
Trade and border issues Pesticides Plant health and
quarantine
Environment
Average Score (Range 1-5)
A score of 3.0+ represents
producer satisfaction
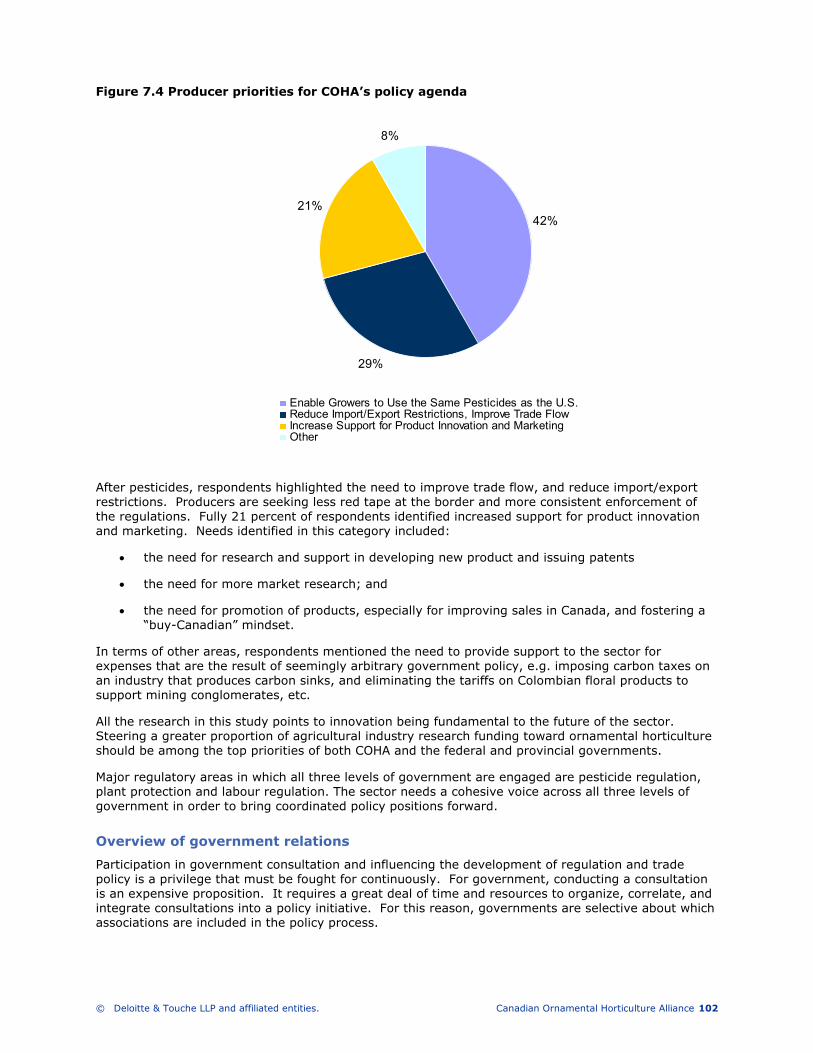
© Deloitte & Touche LLP and affiliated entities. Canadian Ornamental Horticulture Alliance 102
Figure 7.4 Producer priorities for COHA’s policy agenda
42%21%
8%
29%
Enable Growers to Use the Same Pesticides as the U.S. Reduce Import/Export Restrictions, Improve Trade FlowIncrease Support for Product Innovation and MarketingOther
After pesticides, respondents highlighted the need to improve trade flow, and reduce import/export restrictions. Producers are seeking less red tape at the border and more consistent enforcement of the regulations. Fully 21 percent of respondents identified increased support for product innovation and marketing. Needs identified in this category included:
• the need for research and support in developing new product and issuing patents
• the need for more market research; and
• the need for promotion of products, especially for improving sales in Canada, and fostering a “buy-Canadian” mindset.
In terms of other areas, respondents mentioned the need to provide support to the sector for expenses that are the result of seemingly arbitrary government policy, e.g. imposing carbon taxes on an industry that produces carbon sinks, and eliminating the tariffs on Colombian floral products to support mining conglomerates, etc.
All the research in this study points to innovation being fundamental to the future of the sector. Steering a greater proportion of agricultural industry research funding toward ornamental horticulture should be among the top priorities of both COHA and the federal and provincial governments.
Major regulatory areas in which all three levels of government are engaged are pesticide regulation, plant protection and labour regulation. The sector needs a cohesive voice across all three levels of government in order to bring coordinated policy positions forward.
Overview of government relations
Participation in government consultation and influencing the development of regulation and trade policy is a privilege that must be fought for continuously. For government, conducting a consultation is an expensive proposition. It requires a great deal of time and resources to organize, correlate, and integrate consultations into a policy initiative. For this reason, governments are selective about which associations are included in the policy process.

© Deloitte & Touche LLP and affiliated entities. Canadian Ornamental Horticulture Alliance 103
Characteristics of a successful association that COHA should develop
Listed below are three sets of characteristics that COHA should consider when defining its association within the context of government lobbying. The most powerful and successful associations in the public policy arena are those that have:
1. A relative organizational position:
− What is the economic size and impact of the association? − What is the social standing of the association within its sector and with the public-at-large? − What stage of institutional development is the association at?
2. An established organizational structure:
− Is the association’s membership made up of individuals or other associations? − Is the association a “leading” association? − Is the association geographically representative? − Does the association represent the francophone elements of its sector? − Is the association’s membership comprehensive or are major actors or important sub-
associations absent?
3. Effective organizational management:
− Does the association have a mandate to speak for its membership? − By what method does the association develop policy positions? − Does the association’s Board of Directors represent the views of the membership? − Is the association capable of demanding the compliance of its members? − Does the association possess the ability to filter competing and conflicting membership goals
and philosophies? The most powerful and successful associations in the public policy arena are those that:
− are economically significant and financially capable; − are perceived to carry broad public support or sympathy; − are institutional (mature) in structure; − possess full or nearly complete sector representation; − are geographically, and if relevant, linguistically representative; − develop policy positions democratically and filter competing interests; and − can command compliance from members even for unpopular decisions.
Implications for associations
An association’s relative organizational position is difficult to change. While this may seem to be a challenge, comfort may be taken in that only a handful of associations dominate their sector, as far as the level of influence they have, relative to other associations within their sector or industry; examples include the agricultural, pharmaceutical and automotive industries. As a consequence, some associations attempt to overcome their shortcomings by forming strategic alliances with more powerful associations, the coat-tails approach; or by entering coalitions with related associations, the strength-in-numbers approach. Structure and management are the critical factors that determine an association’s public policy success or failure. This is difficult for associations to accept. Most do not relish dealing with, not to mention solving the problems caused by, splinter factions, dictatorial board-of-directors, internal power struggles, personality conflicts, established vested interests, or rival or competitive associations. If these issues were easy to resolve they would have been dealt with long ago. The problem is that most associations fail to appreciate that internal conflicts follow them into the public policy arena, resulting in significant loss of prestige, influence and credibility.

© Deloitte & Touche LLP and affiliated entities. Canadian Ornamental Horticulture Alliance 104
Establish public policy goals that are attainable
Public policy consultations can be broken down into two types:
1) narrow issues that directly and immediately affect the interests of an association’s membership; and
2) broad issues that indirectly impact on the interests of the association’s membership (the introduction of a general tax law would fall into this category).
In the first category, well established associations are generally contacted by the bureaucracy for input and commentary. However, even here, the method of consultation (i.e. request for a written brief, personal interview, participation in multi-stakeholder negotiation sessions) an association is able to achieve, indicates its relative standing in the policy community.
In the second category, only the most economically powerful or socially important associations are able to influence government policy. Even then, their ability to change a government’s favoured policy option is highly limited, and almost impossible if the government is truly committed. Many associations attempt to participate in policy fields for which they have no standing. Like any other business activity, participation in the public policy arena is a finite activity. Associations must pick their policy fields very carefully. The average association should only pursue those issues that directly impact on its mandate and for which a clear interest can be demonstrated.
A willingness to commit resources
Successful participation in the public policy arena also requires a willingness to dedicate, on a continuous basis, financial, human, and institutional resources. An on-again, off-again approach to government relations usually results in:
1) late awareness of government initiatives; 2) poor quality submissions, whether written or verbal, to government; 3) crisis management of issues; 4) a reactive rather than a proactive posture; and 5) a general inability to protect the core interests of the association.
A long-term commitment to the policy process
Successful associations understand that public policy development is a very long process. The time frame between conception of a policy initiative to the passage of new legislation and eventual program implementation can be as long as 10 years. In order to influence the policy process, an association must be continuously present and unfailingly consistent throughout. The policy arena is not the place for short-term players.
Associations motivation for participating in the policy process
The government relations objective of an association bears reviewing. It can be summarized as any actions that attempt to advance, promote or represent the interests of its members to government bodies specifically, the legislature, ministries, agencies, boards, commissions or tribunals. It is a self-serving activity pursued solely for the benefit of the membership. The association aggregates the views and interests of its members and then communicates those interests to government, the media, other associations, and the general public. The focus in this section of the report is on the government communications function. Communicating with the government is achieved either pro-actively or defensively. Proactive: Actively pursuing and often initiating legislative, regulatory or administrative initiatives within the legislature, bureaucracy, agencies, boards or commissions. Defensive: Efforts directed at maintaining the status quo by attempting to negate a legislative, regulatory, or administrative initiative stemming from the legislature, bureaucracy, agency, board, commission or rival association or pressure group.

© Deloitte & Touche LLP and affiliated entities. Canadian Ornamental Horticulture Alliance 105
Most associations limit their legislative activities to policy areas that directly affect their members. Commonly referred to as sectoral or narrow public policy, this is usually the area in which associations experience the greatest success. Associations which attempt to influence items of broad public policy often find the exercise more problematic. As a general rule, the more narrow and specialized a piece of public policy, the more willing government is to defer policy development and formulation to the bureaucracy and relevant associations.
Why COHA needs to target Canadian bureaucracy
Many associations make the mistake of thinking that the way to achieve their public policy goals is by courting favour with elected representatives. This is an error. Many confuse the Canadian and American political systems. Consider a survey of 1,000 associations in Canada and the United States that were questioned about who they target to influence in their respective political systems. In Canada 40 percent of those surveyed targeted the bureaucracy, and only twenty percent targeted back-benchers; in the United States, the inverse is true – only 21 percent targeted the bureaucracy and 41 percent targeted back-benchers. Moving down the list, in Canada 19 percent targeted Cabinet and only seven percent targeted the legislative committees; however, in the United States only four percent targeted Cabinet and 19 percent targeted the legislative committees. As illustrated by the above, in the Canadian political system the bureaucracy is the central body in which policy is developed, due to:
− technical nature of policy; − desire to consult; − time limitations in the Legislature and its Committees; and − the presence of a strong political party system.
Why Canadian bureaucracy is motivated to consult associations like COHA
There are three factors that account for the historical increase in consultation of associations:
1) the growth of government; 2) the diffusion of power; and 3) the search for legitimating institutions.
During the 1960’s, governments at all levels in Canada expanded their legislative and regulatory activities as a result of economic expansion and the institutionalization of the modern ‘welfare state’. Government needed to regulate the private, economic, and business activities of society in greater detail than ever before. This required a high degree of technical expertise. An expertise that elected representatives neither possessed nor were likely to acquire. Additionally, the limited time available in the House to consider any particular piece of legislation, coupled with the demands placed on members by caucus, party, riding association and constituencies, meant that in practice little if any time could be devoted to the technical matters of a policy proposal or bill. As a result, elected representatives looked increasingly to the bureaucracy to draft and administer regulations. Initially, the bureaucracy looked to associations for technical expertise, sectoral information, and input. In this relationship, the bureaucracy dominated and the association played the secondary role. These processes resulted in the diffusion of power. Over time, this relationship became institutionalized: the bureaucracy became the handmaiden to the legislature and associations became the handmaiden to the handmaiden. A problem surfaced. In the 1970’s, the public perceived that the bureaucracy was running out of control. It was believed that the bureaucracy, a body without political legitimacy, was in de facto control over legislation and regulations. The legislature, the body with the political legitimacy, was effectively relegated to a ‘rubber stamping’ institution. Sensitive to this criticism, the bureaucracy created its own political legitimacy to counter the political legitimacy held by the legislature. The bureaucracy developed its legitimacy by consulting on matters of policy with those interests, namely associations that were directly affected by new legislation and regulations. These associations were ‘stakeholders’.
© Deloitte & Touche LLP and affiliated entities. Canadian Ornamental Horticulture Alliance 106
Consider the dilemma the bureaucracy’s action caused for elected representatives if, on any particular piece of legislation, the lead ministry brokered a consensus amongst the affected policy community (i.e. all relevant stakeholders) before the introduction of a bill for First Reading. How can an elected representative credibly introduce extensive amendments to a bill and risk upsetting or potentially unraveling a delicately negotiated consensus? This dilemma continues in the present political system.
Five functions the bureaucracy looks to associations to fulfill
The bureaucracy looks to associations to fulfill five functions, specifically, interest promotion, communication, legitimating, regulation and administration.
1) Interest promotion - to aggregate, broker and prioritize the public policy objectives and
interests of its members and to communicate them to the political system; 2) Communications - to communicate:
a. the association’s position(s) to the Ministry b. the Ministry’s position(s) to the members c. (and defend) the Ministry position(s) and preferences to legislative committees,
opposition parties, rival ministries and other governments and their agencies. The last point is especially important when a policy sparks inter-ministry conflict.
The association’s ability to fulfill this unique role stems from its freedom to move between all levels of the political system, unlike ministries that are limited in their activities and actions due to formal chain-of-command restrictions.
3) Legitimization - the process of participating in the development, formulation, and implementation of public policy, in other words, taking ownership of the policy, is by far the most important function associations provide to the bureaucracy; and
4) Regulation and 5) administration - often associations are given regulatory powers over their members and may be asked to administer specific sectoral programs that are funded by the government. The advantage for government is that such an arrangement:
a. reduces regulation policing and compliance costs; b. reduces the need for expanding bureaucratic staffing for program delivery; c. simplifies future program termination; and d. frees resources for other programs.
This function is critical during a period of fiscal restraint.
Types of government consultations COHA should be aware of
Formal protocols for consultation do not exist in the government structure. The method utilized for consultation will substantially vary between ministries and even within a ministry. However, there are eight key generalizations about the various levels of consultation that can be made. A ministry will utilize all eight categories listed below in any given consultation; the higher the category of consultation, the greater the influence of the association. At higher levels, consultation changes from issue specific consultation to agenda setting.
Category one: commentary on position documents (issue)
Influence level: Very low
Characteristics:
• A Ministry requests commentary from the association and the public-at-large on a document
or proposal that was generated by others. • This exercise is purely a formality and commentary received is usually dismissed as
unworkable or undesirable.
© Deloitte & Touche LLP and affiliated entities. Canadian Ornamental Horticulture Alliance 107
Category two: request for written commentary (issue)
Influence Level: Low
Characteristics:
• A Ministry defines a problem and invites special audiences and the interested public to submit recommendations on methods for dealing with the problem.
• The influence level in this category is generally low. The association must determine if this is the only level of consultation utilized. If it is, the influence level can be very high and greatly depends on the quality of the written submission. More often than not, this method is utilized by ministries wishing to limit the number of key actors at higher consultation levels, while allowing limited consultation with smaller actors. Some refer to this as a public relations exercise.
Category three: meetings with junior/intermediate civil servants (issue)
Influence Level: Moderate
Characteristics:
• These are typically private and personal meeting(s) with junior or intermediate level civil servants on a specific bill, regulation, or proposal. If arguments are reasoned and well designed, the association’s position(s) may be incorporated by the civil servant conducting the interview.
Category four: ministry – multi-stakeholder consultations (issue)
Influence Level: Moderate
Characteristics:
• Multi-stakeholder consultations are essentially organized by ministry officials to encourage various stakeholders to build consensus on outstanding and contentious issues. Depending on the association’s status within the policy community, the potential for influence can be quite high. However, as a rule, influence levels are generally moderate.
Category five: participation on working and action groups (issue)
Influence Level: Moderate/high
Characteristics:
• These consultations are typically defined as working and action groups that are made up of civil servants and representatives from various stakeholders. They are charged with formulating policy guidelines, principles, and at times, detailed recommendations on particular issues. Once completed, the findings of the group are circulated among the broader policy community.
Category six: regular briefing meetings with senior civil servants (agenda)
Influence Level: high
Characteristics:
• Senior civil servants are defined as assistant deputy ministers and deputy ministers. Regular briefing meetings are granted to important client associations of a ministry. Items of discussion usually include general activities, and at times, specific ministry policies or programs, and their impact on the association. The association’s relations with junior staff may also be touched upon. Associations attempt to influence the policy agenda of the ministry by courting favour.
© Deloitte & Touche LLP and affiliated entities. Canadian Ornamental Horticulture Alliance 108
Category seven: formal memorandum-of-understanding (agenda)
Influence Level: Very high
Characteristics:
• A Memorandum-of-Understanding (MOU) is a document signed between a ministry and an association that serves to formalize a consultative relationship. It represents a high degree of commitment between the parties that is publicly evident. Depending on the terms of the MOU, policy matters raised under the MOU receive exceptionally high consideration by the Ministry. Often associations can get the commitment of the ministry to resolve minor administrative matters without delay. Finally, the MOU virtually guarantees the association a seat at the table for all relevant policy matters.
Category eight: regular briefings to cabinet or committees of cabinet (agenda)
Influence Level: Extremely high
Characteristics:
• Cabinet is the central public policy decision-making body. An association that achieves this level of policy consultation is not limited to sectoral matters but can exert influence on matters of broad public policy.
Understanding the role of government relations staff (in-house, external)
Associations desiring to have an effective presence with government require individuals with a superior technical knowledge in the policy area(s) of focus as well as individuals with a strong understanding of the public policy process. The association is often the best at determining who has the technical expertise required.
On the policy front, COHA should retain an individual with a sound background and understanding of:
1) constitutional division of powers (federal, provincial, municipal); 2) systemic structure:
− cabinet & executive support agencies − the bureaucracy, its function and structure; − the bureaucratic process, management, policy making, and control − intergovernmental relations; − formal procedures of the legislature and its committees;
3) system-environmental linkages:
− the structure, policies, ideology, and function of political parties; − the electoral process; − the structure, function, and impact of supranational bodies; and
4) extensive and continuous contact with civil servants at all levels Successful and influential associations almost always have an in-house government relations department. It is difficult to match the power of a well organized and effective in-house team. Unfortunately, most associations possess limited resources and face stiff competition for staff time vis-à-vis other services demanded by the membership. COHA may experience this challenge. A common problem is that the general membership does not appreciate the need for a comprehensive government relations program. Moreover, the long timeframes that are characteristic of public policy development often frustrate the membership which is used to ‘instant results’. The inevitable problem is that when a critical issue does surface, the association is unprepared to effectively deal with the situation. At this point, a demand surfaces for a “high-priced” lobbyist to rescue the association from its own negligence. Disappointment and disbelief can follow if the lobbyist cannot deliver.

© Deloitte & Touche LLP and affiliated entities. Canadian Ornamental Horticulture Alliance 109
If the association cannot afford an in-house government relations department or officer, than outside help must be considered. The government relations firm should only be utilized to supplement existing staff. The firm can provide strategic, tactical and technical advice and support. From the perspective of government, the staff of the association must still appear to be the primary policy actors or participants. The services of the firm must be on-going throughout the legislative season. Experience has shown that this type of approach often prevents the need for crisis management of policy issues.
Guidelines for COHA to consider when approaching a ministry
The most important factor for COHA to remember when attempting to influence policy at the bureaucratic level is that policy formulation and development is diffuse by nature. Policy is not developed by a single person, branch or ministry. Rather it is a dynamic enterprise simultaneously taking place at multiple levels and departments. The artful association understands this and attempts to exploit it. The greater the number of access points for policy influence, the greater the probability that a relatively small or weaker association can exert some influence in the process.
The Ministry’s interest
Many associations approach consultations with the attitude of “What can the ministry do for us today?” This approach results in the association interpreting the policy issue solely from its perspective. This is a mistake. A successful association will attempt to determine what the ministry’s interests or goals are in the policy arena. It will then try to marry its interests as close as possible to the ministry’s goals and objectives.
Developing a policy position
Associations, like COHA, must never lose sight of the fact that they are working in a broader policy community. All policy positions must be formulated within this framework. Whether the policy position is expressed verbally or in print, the following questions must be answered:
1) Does the position serve the broader public interest? 2) How does the position mesh with other policies or programs of the ministry? Are they
compatible? 3) Does the position require new legislation, or can it be achieved by an administrative change or
the introduction of a new regulation? 4) How have other political jurisdictions dealt with the policy issue in question? Does the
association’s position support a similar kind of action? 5) Can the association’s position be supported by other stakeholders in the policy community? 6) What are the costs of designing, implementing, enforcing, delivering and communicating the
association’s position? Who will pay these costs, government or the private sector? 7) Does the government have the constitutional power to implement the association’s
recommendations? These are some of the most basic questions that must be answered by the association before it communicates a specific policy position to the bureaucracy or any other level of government.
The Quid Pro Quo of support
Associations often lose sight of the fact that adoption of a favourable policy position by a ministry is not the end of the policy process. The association must be prepared to provide overt support for the policy initiative. This would include writing letters of support to the minister, opposition critics, and cabinet members in the affected policy committee. Issuing a press release is another approach. The association should clearly outline the benefits of the policy ‘adopted’, as well as praise the open and fair consultative approach utilized by the ministry. If the proposal is one of a package, defend the package as a whole even if all aspects are not agreeable.
Cooperation vs. competition
If COHA experiences difficulty in a policy issue, it should avoid bumping the matter up to the political realm for resolution. A policy dispute between major associations that must be resolved at the political level has for all purposes left the control of the associations involved. The majority of associations have no control and little influence at the political level. In like manner, successful associations recognize the position and status of their major competitors. Such associations try to reach stable and workable compromises; this is what is meant by a policy

© Deloitte & Touche LLP and affiliated entities. Canadian Ornamental Horticulture Alliance 110
philosophy of cooperation not competition. It is also the first step in becoming a policy participant as opposed to a policy advocate.
Policy advocacy vs. policy participation
In this section, reference is being made to the lobbying or government relations style of an association. Those associations that are Policy Advocates attempt to influence:
1) what will or will not be a matter of public policy; 2) the contents of policy as they are being made; and 3) the way in which policy is implemented once agreed to by the government and the
legislature. Associations subscribing to the Policy Participants school attempt to play an active role in formulating and implementing policy, this includes:
1) formulating the guiding principles of policy; 2) formulating the actual text or bill or directive; 3) administration and implementation of policy; and 4) enforcing regulations.
Policy Participants have greater influence than Policy Advocates. To become a Policy Participant the association must develop significant autonomy from its members. It requires a broader vision, and an ability to see beyond the short-term with an eye to long-term objectives and interests.
Implementing the policy strategy: recommendations and rationale
In summary, the government relations audit undertaken by Deloitte on behalf of COHA has uncovered a significant gap on two fronts:
1) COHA’s ability to shape and influence public policy is underdeveloped relative to the economic size and activity of its constituent members; and
2) COHA’s desired public policy participation and influence level exceeds its current level of political currency.
This principal finding must be contextualized and tempered by two additional factors. First, COHA is a newly constituted association and as such has not benefited from a long corporate history on which to draw upon for the exercise of public policy influence. Secondly, assuming a high level of support, coordination and cooperation from its constituent members, COHA does possess the fundamental characteristics that if effectively deployed can transform COHA, over time, into an influential public policy participant. This latter point is premised on the assumption that COHA intends to create and fund a full time associational secretariat.
To that end, it must be underscored that successful government advocacy programs are built over time, are incremental in nature, and are based on realistic objectives in terms of the influence that can be brought to bear and the public policy issue(s) that is the target. The prior section of this report entitled, “Characteristics of successful and influential associations” should be utilized by the leadership of COHA as a reference and filter for establishing its government relations objectives and programs on a go-forward basis. The recommendations that follow should be contextualized within that framework. Additionally, the recommendations incorporate the general commentary from the interviews conducted by members of the civil service.
© Deloitte & Touche LLP and affiliated entities. Canadian Ornamental Horticulture Alliance 111
Recommendation 1:
It is recommended that COHA consider the creation of an in-house government relations unit, staffed by professional government relations practitioners, as part of its future full time staff complement.
Rationale:
As previously outlined, within the Canadian context, the advancement of public policy objectives by industry associations is largely conducted at the bureaucratic or civil service level. This is in stark contrast to the US Congressional system of government where public policy advocacy principally targets the elected representatives of the House of Representatives, Senate, or the Executive Branch of government. It is the centres of public policy power that dictate the form and structure associations should adopt in their pursuit of advocacy activities.
In other words, successful industry advocacy requires associations to tailor their methods and tactics in keeping with the needs, biases and preferences of their target audience. In this respect bureaucratic institutions show a marked preference for industry associations that demonstrate: 1) stability; 2) consistency of contact; 3) confidentiality and discretion; 4) frankness rooted and tempered by industry political intelligence; 5) non-partisanship; 6) political realism; 7) comprehensive expertise, policy analysis and the proffering of meaningful options; 8) alignment with government policy; 9) solutions based approaches that take into consideration the entire direct and indirect stakeholder community;10) willingness to compromise; and 11) an aversion to public direct action protests.
Regrettably, civil servants have had a mixed experience in dealing with non-staff representatives of industry associations. As a consequence, there is a general guardedness on the part of many civil servants when dealing with the ‘political representatives’ of industry associations. From a practical standpoint, civil servants often view industry political representatives as transitory, motivated by political rather than public policy objectives, and not possessing the organizational or ‘issue file’ histories necessary to successfully navigate the complexities and subtleness of public policy development.
The utilization of in-house government relations practitioners by industry associations is critical in order to negate the natural guardedness of the civil service, while building on the characteristics most valued by civil servants. In-house practitioners provide alternative, often back door, channels of communications to the policy process; they complement the communications elected industry representatives have with public officeholders.
Recommendation 2:
It is recommended that COHA develop a public policy agenda and concurrent strategy that reflects its present level of political influence and is manageable within its organizational resources.
Rationale:
COHA is a new industry association. In keeping with its status, it has not yet had the opportunity to establish its credentials with government in the broadest terms and the various ministries of agriculture specifically. From the civil service perspective it is an unknown entity. As noted in the interview section of this report, there was a great deal of confusion and questioning as to who COHA is, who it represents, what its mandate is, why it has been created at this point in time (the underlying question being whether it is a splinter group), what has motivated its creation, and will it have institutional staying power, or will it dissolve in short order. These are important questions from a civil servant’s perspective. Civil servants must constantly judge the relative power position and influence that those wishing to access the public policy mechanism actually possess, compared to the amount of power and influence claimed by such persons or entities. The greater the power and influence the greater and more privileged the access.
At this juncture, COHA, as stated, is an unknown entity. However, COHA has already garnered some credibility from those industry members that are associated with it. As such, COHA’s initial foray into the government structure by virtue of the inquiries made by Deloitte have been reasonably well received. Nevertheless the result has been mixed. In Quebec and Ontario interviews were garnered with the respective Deputy Ministers responsible for agriculture. In British Columbia, the interview was delegated downward into lower rungs of the bureaucracy.
© Deloitte & Touche LLP and affiliated entities. Canadian Ornamental Horticulture Alliance 112
While it is acknowledged by the researchers and authors of this report that COHA is affected by a plethora of municipal, provincial, national, and international treaties, statutes, regulations and by-laws; COHA’s newness and its uncertain standing in the minds of policymakers will significantly limit its ability to directly influence higher levels of public policies. Therefore, it is recommended that COHA delay direct forays into these public policy environments until it has created a sufficient baseline of activity and has built up a level of political currency and influence. It is likely that COHA will find the greatest level of success in lower order public policy initiatives. The level of engagement will also be defined by COHA’s resources. Caution is advised in the early days of COHA’s venture into the policy sphere so as to prevent overreaching in terms of resources required for policy development participation.
Recommendation 3:
It is recommended that COHA develop a clear public policy mandate within the context of the sector. This mandate should be publicly acknowledged by other provincial and national associational bodies that may have an overlapping “jurisdiction”. Once this mandate is established it should be communicated to government officials in order to establish clarity of COHA’s public policy sphere of responsibility.
Rationale:
COHA’s success and effectiveness in the public policy environment greatly depends on policymakers clearly viewing COHA as ‘the’, or at least one of the, principal sectoral authorities or stakeholders to credibly participate in the specific policy issue at hand or in question. This is not a simple matter. Often competing industry associations will jockey for influence with the civil service. It is not uncommon for civil servants that are mandated with a particular policy file to find competing associations claiming to represent the interests of the same membership base while providing divergent or even contradictory policy advice. Not only does this lead to confusion, it erodes the credibility of those associations that are making these erroneous claims. Once this type of credibility loss has occurred, it becomes extremely hard to recover from and damages future public policy initiatives. While difficult, it is best to prevent these kinds of overlapping representational claims before initiating an advocacy campaign. Given that COHA is a new association it must credibly carry out its sphere of public policy responsibility. At a minimum this should be conducted amongst its founding associational members (Canadian Nursery Landscape Association (Association Canadienne des Pépiniéristes et des Paysagistes), Flowers Canada Growers, Fédération Interdisciplinaire de l’Horticulture Ornementale du Québec). Ideally, if other potential competitor associations exist, they too should be contacted to broker a division of responsibility. Most importantly, once such an agreement has been brokered it must be adhered to and communicated to the relevant government policymakers.
Recommendation 4:
It is recommended that COHA review its public policy agenda to determine those matters of public policy that are of concern and interest to its constituency but which at this junction fall beyond its ability to influence in a meaningful manner. Once determined, it is further recommended that COHA actively seek out other powerful and influential associations (utilizing the criteria previously outlined) that do have credibility on those specific public policy issues. Once identified, COHA should “co-opt” those associations to advocate its interests.
Rationale:
Even the most successful associations do not directly cover all public policy initiatives that may affect their constituency members. The challenge is threefold: 1) scarcity of government relations resources; 2) absence of credibility to speak authoritatively on a specific piece of public policy; and/or 3) the association is a marginal stakeholder relative to the matter of public policy consideration. Notwithstanding these three limiting factors, associations often come under membership pressure to address such public policy initiatives. In such circumstances it is advisable to channel the association’s interests through a more powerful and influential association. In essence, this becomes an exercise in advocacy by proxy. However, many of the same techniques that would apply to traditional government relations advocacy also apply to the assertion of influence with other associations.
By way of example, many of the statutes or even treaties (i.e. NAFTA), that are listed in the previous section are for all practical purposes beyond the scope of COHA to influence in a meaningful manner.

© Deloitte & Touche LLP and affiliated entities. Canadian Ornamental Horticulture Alliance 113
However, it is possible for other associations such as the Canadian Federation of Agriculture, to champion policy changes more effectively in those policy realms. More importantly, these types of associations frequently welcome other less influential associations to ‘ride their coattails’ since doing so increases their influence and political currency in the process. For COHA, the challenge with executing such a strategy will be to ensure that their viewpoint does not become unacceptably diluted in the interest aggregation process.
Recommendation 5:
It is recommended that COHA include a government relations effort at the provincial levels of government, as part of coordinating consistent messaging – particularly in policy areas where the regulatory jurisdictions overlap, e.g. pesticides, plant protection, and human resources.
Rationale:
As a general rule, stakeholder and policymaker relations and interactions become more formalized and structured as one moves from lower levels of government to higher levels of government. This is particularly the case in the Canadian political environment. As a new association COHA will find it difficult to advance its policy agenda on the Federal level until it becomes more established and implements some of the previous recommendations. In the interim, it is recommended that COHA work at the provincial level of government, where its member organizations already have an established presence. This provides two immediate benefits. First, it allows COHA to piggyback on the reputation of its members. Secondly, it will allow for the immediate pursuit of a public policy advocacy plan, while at the same time providing for the possibility that COHA can convince the various provincial governments to advance COHA’s interests at the national level. The interviews conducted support at least a willingness to entertain this possibility - on the part of Ontario and Quebec - if the policy position is sound and viable. This is a significant opportunity for COHA, and should be capitalized upon.
Recommendation 6:
It is recommended that COHA should consider concentrating its efforts at the bureaucratic (civil service) level rather than the political (elected representative) level.
Rationale:
As previously demonstrated, the overwhelming majority of successful public advocacy campaigns are conducted at the bureaucratic level. Notwithstanding this pattern of success, associations often experience significant pressures from their elected leadership to target the political levels of government. While there is a time and a place for such elected representative (association) to elected representative (public office holder) communications, they are best kept limited and only utilized after a solid level of support has been pre-cultivated with the civil service of the particular ministry targeted. As a new association, with limited resources, COHA should target the civil service, build multi-level relationships, softly test policy options, collect political intelligence which includes ministerial and governmental priorities, and then formulate its public policy advocacy approach with this information in mind.
Recommendation 7:
It is recommended that COHA seek annual “state of the industry” briefing meetings with the respective Ministers and Deputy Ministers responsible for agriculture in the provinces of British Columbia, Ontario and Quebec.
Rationale:
Notwithstanding the general direction of recommendation 6, COHA should strive to seek an annual “state of the industry” briefing meeting with the Minister and Deputy Minister for agriculture in the target provinces. Such a meeting allows for two critical events to transpire. First, it provides for the communication of key information to the public officeholder (the Minister). It should be recognized that the information provided should not come as something new to the Deputy Minister, assuming that COHA’s government relations work in the previous year was effective. Such information should have been regularly funnelled up to the Deputy Minister by his policy functionaries and Assistant Deputy Ministers. The most important purpose of these meetings is to build personal relationships, not

© Deloitte & Touche LLP and affiliated entities. Canadian Ornamental Horticulture Alliance 114
to make a “political ask”. The meeting will allow COHA’s political leadership to openly support the Deputy Minister to his/her political master, and vice-versa. These are extremely important interactions that effectively provide the political and bureaucratic grease that will advance COHA’s public policy agenda. This is the political currency COHA will need to stockpile and utilize to advance its more contentious public policy issues.
Recommendation 8:
It is recommended that COHA embark on a strategy of leveraging publicly available funds for the purpose of developing public policy “points of view” position papers that can serve as an underlying tool for the advancement of its public policy objectives.
Rationale:
One of the critical functions industry associations perform in the public policy process is furnishing of industry expertise or technical information. Larger industry associations tend to have their own in-house research departments and staff that are dedicated to fulfilling this function; COHA’s resource challenges require a different approach. By leveraging public funds or those funds dedicated to the agricultural sector, COHA can effectively ‘contract out’ or at a minimum significantly reduce its public policy research costs. This also carries the benefit of decoupling the hidden baggage that industry driven research sometimes carries. In other words the degree of suspicion that civil servants often have about such information, given that industry associations too have political agendas and are attempting to assert influence. Third party research therefore becomes a cost effective and viable alternative for COHA. Additionally, such research engaged early on can help to formulate COHA’s government relations strategy as well as provide it with an informational arsenal for future use.
Recommendation 9:
It is recommended that COHA develop a three year government relations business and implementation plan before it initiates any public policy advocacy program.
Rationale:
The public policy advocacy process is part of a normal business function, particularly for associations, and as such should be approached with strong business discipline, including resource allocation and quantification, and end results measurement. It must be recognized that there will always been more public policy initiatives to pursue than human and financial resources permit. Moreover, government relations is an endeavour that requires a consistent approach rather than an on-again, off-again strategy. Public policy advocacy success requires a planned long-term focused approach that is systematic, integrated (with the operations of the association), and adequately resourced.
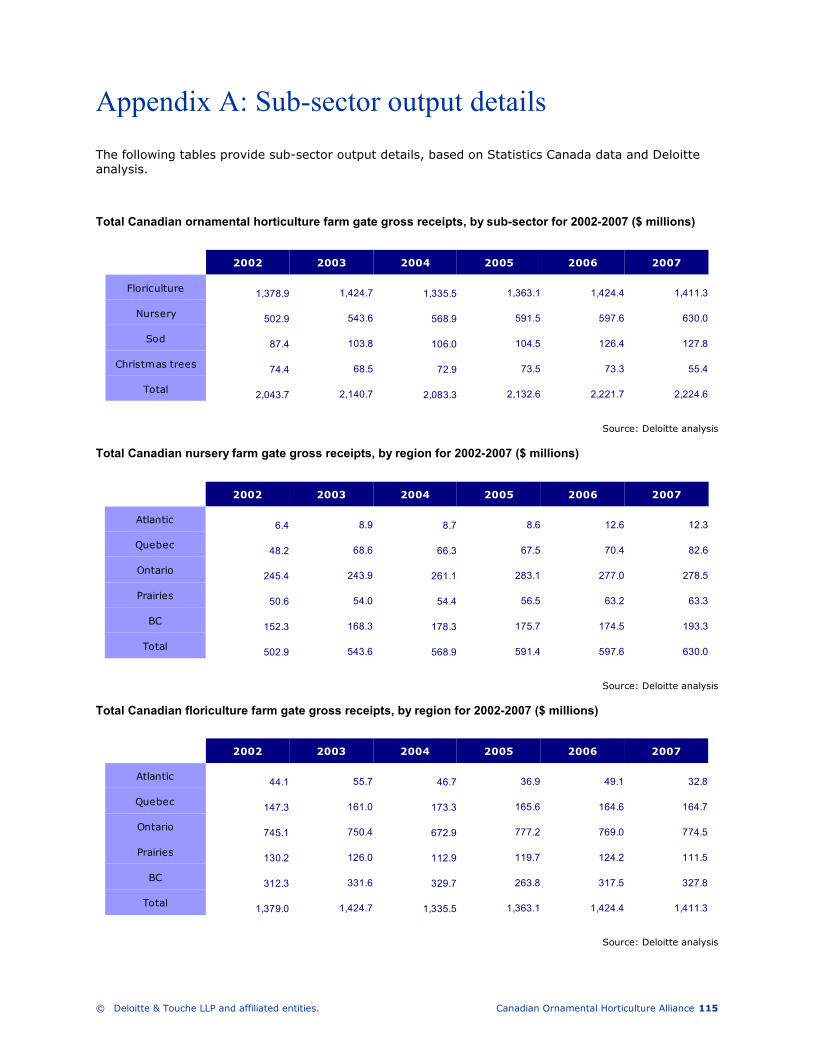
© Deloitte & Touche LLP and affiliated entities. Canadian Ornamental Horticulture Alliance 115
Appendix A: Sub-sector output details
The following tables provide sub-sector output details, based on Statistics Canada data and Deloitte analysis.
Total Canadian ornamental horticulture farm gate gross receipts, by sub-sector for 2002-2007 ($ millions)
2002 2003 2004 2005 2006 2007
Floriculture1,378.9 1,424.7 1,335.5 1,363.1 1,424.4 1,411.3
Nursery502.9 543.6 568.9 591.5 597.6 630.0
Sod87.4 103.8 106.0 104.5 126.4 127.8
Christmas trees74.4 68.5 72.9 73.5 73.3 55.4
Total2,043.7 2,140.7 2,083.3 2,132.6 2,221.7 2,224.6
Source: Deloitte analysis
Total Canadian nursery farm gate gross receipts, by region for 2002-2007 ($ millions)
2002 2003 2004 2005 2006 2007
Atlantic6.4 8.9 8.7 8.6 12.6 12.3
Quebec48.2 68.6 66.3 67.5 70.4 82.6
Ontario245.4 243.9 261.1 283.1 277.0 278.5
Prairies50.6 54.0 54.4 56.5 63.2 63.3
BC152.3 168.3 178.3 175.7 174.5 193.3
Total502.9 543.6 568.9 591.4 597.6 630.0
Source: Deloitte analysis
Total Canadian floriculture farm gate gross receipts, by region for 2002-2007 ($ millions)
2002 2003 2004 2005 2006 2007
Atlantic44.1 55.7 46.7 36.9 49.1 32.8
Quebec147.3 161.0 173.3 165.6 164.6 164.7
Ontario745.1 750.4 672.9 777.2 769.0 774.5
Prairies130.2 126.0 112.9 119.7 124.2 111.5
BC312.3 331.6 329.7 263.8 317.5 327.8
Total1,379.0 1,424.7 1,335.5 1,363.1 1,424.4 1,411.3
Source: Deloitte analysis
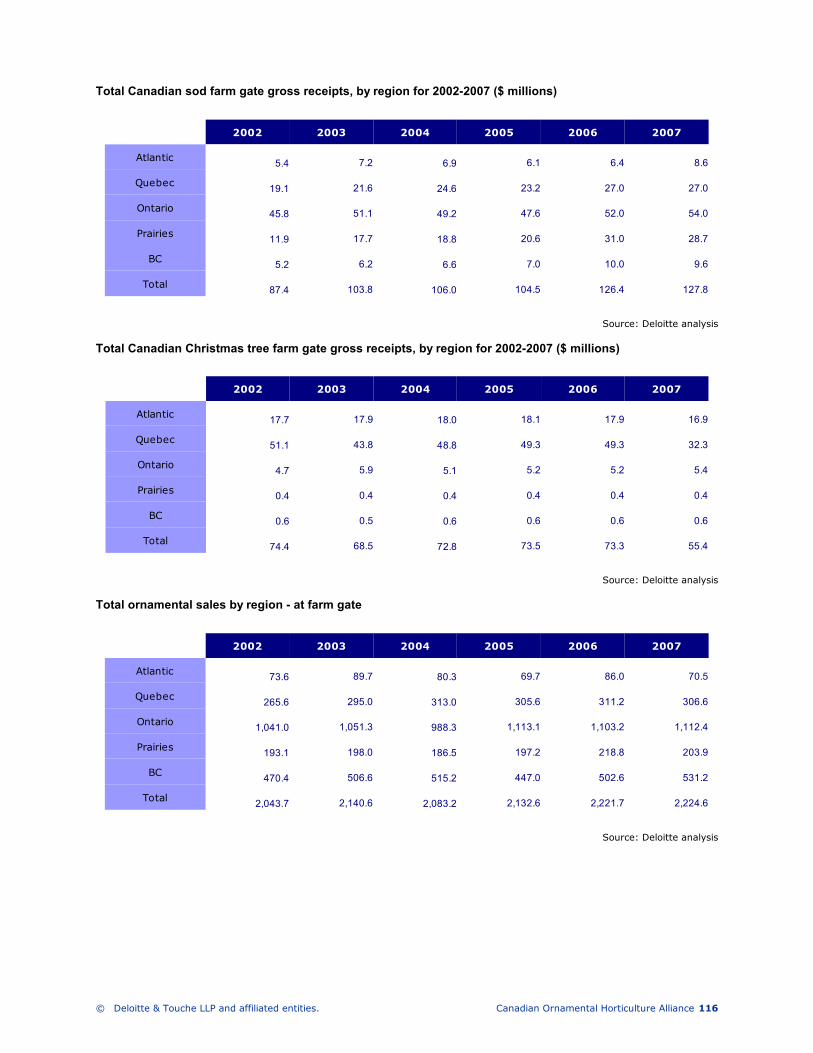
© Deloitte & Touche LLP and affiliated entities. Canadian Ornamental Horticulture Alliance 116
Total Canadian sod farm gate gross receipts, by region for 2002-2007 ($ millions)
2002 2003 2004 2005 2006 2007
Atlantic5.4 7.2 6.9 6.1 6.4 8.6
Quebec19.1 21.6 24.6 23.2 27.0 27.0
Ontario45.8 51.1 49.2 47.6 52.0 54.0
Prairies11.9 17.7 18.8 20.6 31.0 28.7
BC5.2 6.2 6.6 7.0 10.0 9.6
Total87.4 103.8 106.0 104.5 126.4 127.8
Source: Deloitte analysis
Total Canadian Christmas tree farm gate gross receipts, by region for 2002-2007 ($ millions)
2002 2003 2004 2005 2006 2007
Atlantic17.7 17.9 18.0 18.1 17.9 16.9
Quebec51.1 43.8 48.8 49.3 49.3 32.3
Ontario4.7 5.9 5.1 5.2 5.2 5.4
Prairies0.4 0.4 0.4 0.4 0.4 0.4
BC0.6 0.5 0.6 0.6 0.6 0.6
Total74.4 68.5 72.8 73.5 73.3 55.4
Source: Deloitte analysis
Total ornamental sales by region - at farm gate
2002 2003 2004 2005 2006 2007
Atlantic73.6 89.7 80.3 69.7 86.0 70.5
Quebec265.6 295.0 313.0 305.6 311.2 306.6
Ontario1,041.0 1,051.3 988.3 1,113.1 1,103.2 1,112.4
Prairies193.1 198.0 186.5 197.2 218.8 203.9
BC470.4 506.6 515.2 447.0 502.6 531.2
Total2,043.7 2,140.6 2,083.2 2,132.6 2,221.7 2,224.6
Source: Deloitte analysis
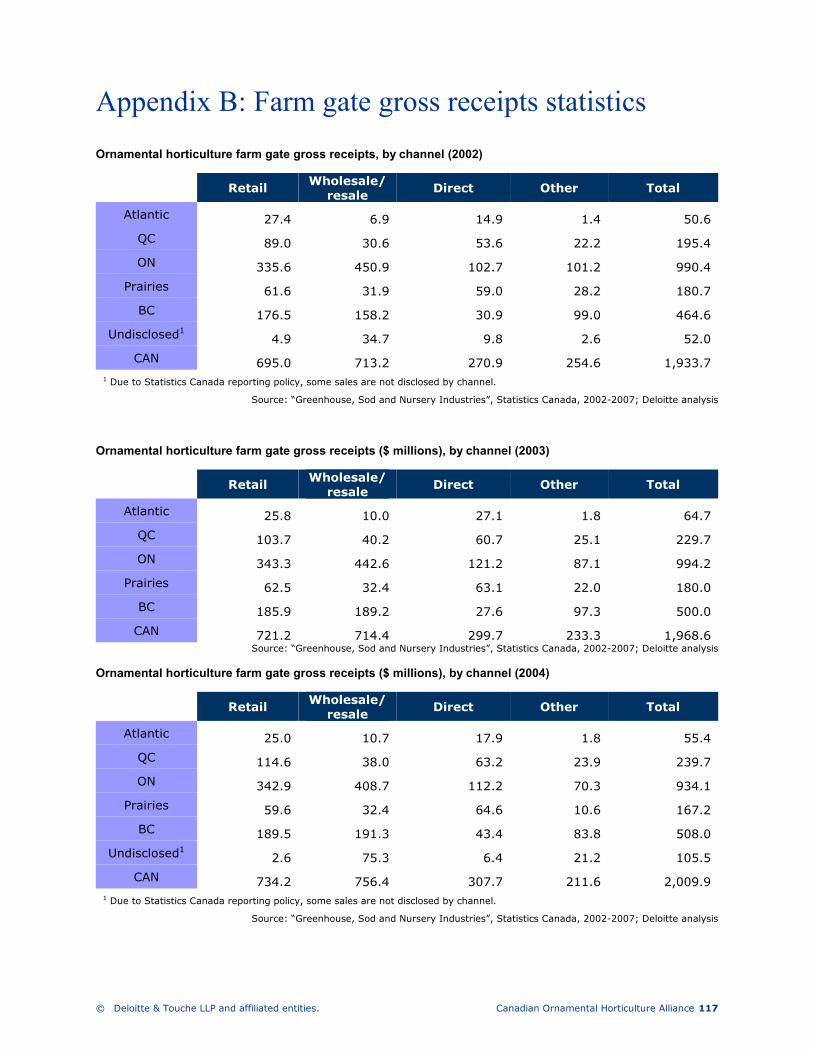
© Deloitte & Touche LLP and affiliated entities. Canadian Ornamental Horticulture Alliance 117
Appendix B: Farm gate gross receipts statistics
Ornamental horticulture farm gate gross receipts, by channel (2002)
Retail Wholesale/ resale
Direct Other Total
Atlantic 27.4 6.9 14.9 1.4 50.6
QC 89.0 30.6 53.6 22.2 195.4
ON 335.6 450.9 102.7 101.2 990.4
Prairies 61.6 31.9 59.0 28.2 180.7
BC 176.5 158.2 30.9 99.0 464.6
Undisclosed1 4.9 34.7 9.8 2.6 52.0
CAN 695.0 713.2 270.9 254.6 1,933.7 1 Due to Statistics Canada reporting policy, some sales are not disclosed by channel.
Source: “Greenhouse, Sod and Nursery Industries”, Statistics Canada, 2002-2007; Deloitte analysis
Ornamental horticulture farm gate gross receipts ($ millions), by channel (2003)
Retail Wholesale/ resale
Direct Other Total
Atlantic 25.8 10.0 27.1 1.8 64.7
QC 103.7 40.2 60.7 25.1 229.7
ON 343.3 442.6 121.2 87.1 994.2
Prairies 62.5 32.4 63.1 22.0 180.0
BC 185.9 189.2 27.6 97.3 500.0
CAN 721.2 714.4 299.7 233.3 1,968.6 Source: “Greenhouse, Sod and Nursery Industries”, Statistics Canada, 2002-2007; Deloitte analysis
Ornamental horticulture farm gate gross receipts ($ millions), by channel (2004)
Retail Wholesale/ resale
Direct Other Total
Atlantic 25.0 10.7 17.9 1.8 55.4
QC 114.6 38.0 63.2 23.9 239.7
ON 342.9 408.7 112.2 70.3 934.1
Prairies 59.6 32.4 64.6 10.6 167.2
BC 189.5 191.3 43.4 83.8 508.0
Undisclosed1 2.6 75.3 6.4 21.2 105.5
CAN 734.2 756.4 307.7 211.6 2,009.9 1 Due to Statistics Canada reporting policy, some sales are not disclosed by channel.
Source: “Greenhouse, Sod and Nursery Industries”, Statistics Canada, 2002-2007; Deloitte analysis
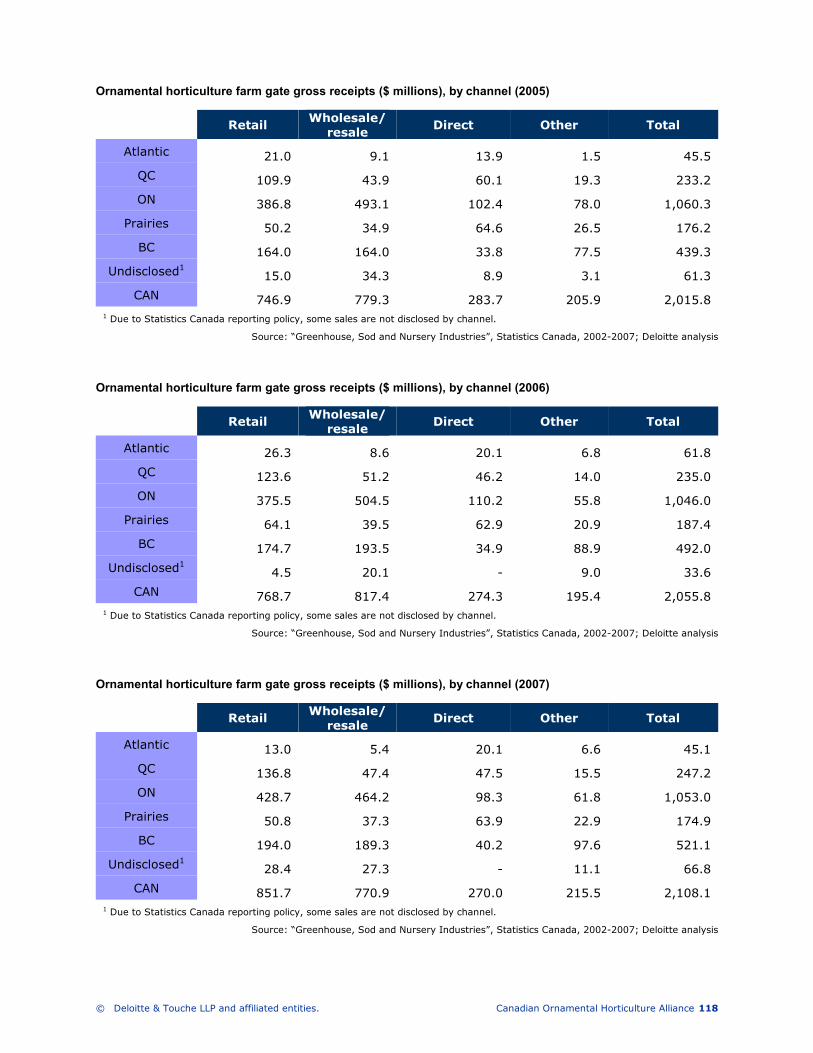
© Deloitte & Touche LLP and affiliated entities. Canadian Ornamental Horticulture Alliance 118
Ornamental horticulture farm gate gross receipts ($ millions), by channel (2005)
Retail Wholesale/ resale
Direct Other Total
Atlantic 21.0 9.1 13.9 1.5 45.5
QC 109.9 43.9 60.1 19.3 233.2
ON 386.8 493.1 102.4 78.0 1,060.3
Prairies 50.2 34.9 64.6 26.5 176.2
BC 164.0 164.0 33.8 77.5 439.3
Undisclosed1 15.0 34.3 8.9 3.1 61.3
CAN 746.9 779.3 283.7 205.9 2,015.8 1 Due to Statistics Canada reporting policy, some sales are not disclosed by channel.
Source: “Greenhouse, Sod and Nursery Industries”, Statistics Canada, 2002-2007; Deloitte analysis
Ornamental horticulture farm gate gross receipts ($ millions), by channel (2006)
Retail Wholesale/ resale
Direct Other Total
Atlantic 26.3 8.6 20.1 6.8 61.8
QC 123.6 51.2 46.2 14.0 235.0
ON 375.5 504.5 110.2 55.8 1,046.0
Prairies 64.1 39.5 62.9 20.9 187.4
BC 174.7 193.5 34.9 88.9 492.0
Undisclosed1 4.5 20.1 - 9.0 33.6
CAN 768.7 817.4 274.3 195.4 2,055.8 1 Due to Statistics Canada reporting policy, some sales are not disclosed by channel.
Source: “Greenhouse, Sod and Nursery Industries”, Statistics Canada, 2002-2007; Deloitte analysis
Ornamental horticulture farm gate gross receipts ($ millions), by channel (2007)
Retail Wholesale/ resale
Direct Other Total
Atlantic 13.0 5.4 20.1 6.6 45.1
QC 136.8 47.4 47.5 15.5 247.2
ON 428.7 464.2 98.3 61.8 1,053.0
Prairies 50.8 37.3 63.9 22.9 174.9
BC 194.0 189.3 40.2 97.6 521.1
Undisclosed1 28.4 27.3 - 11.1 66.8
CAN 851.7 770.9 270.0 215.5 2,108.1 1 Due to Statistics Canada reporting policy, some sales are not disclosed by channel.
Source: “Greenhouse, Sod and Nursery Industries”, Statistics Canada, 2002-2007; Deloitte analysis
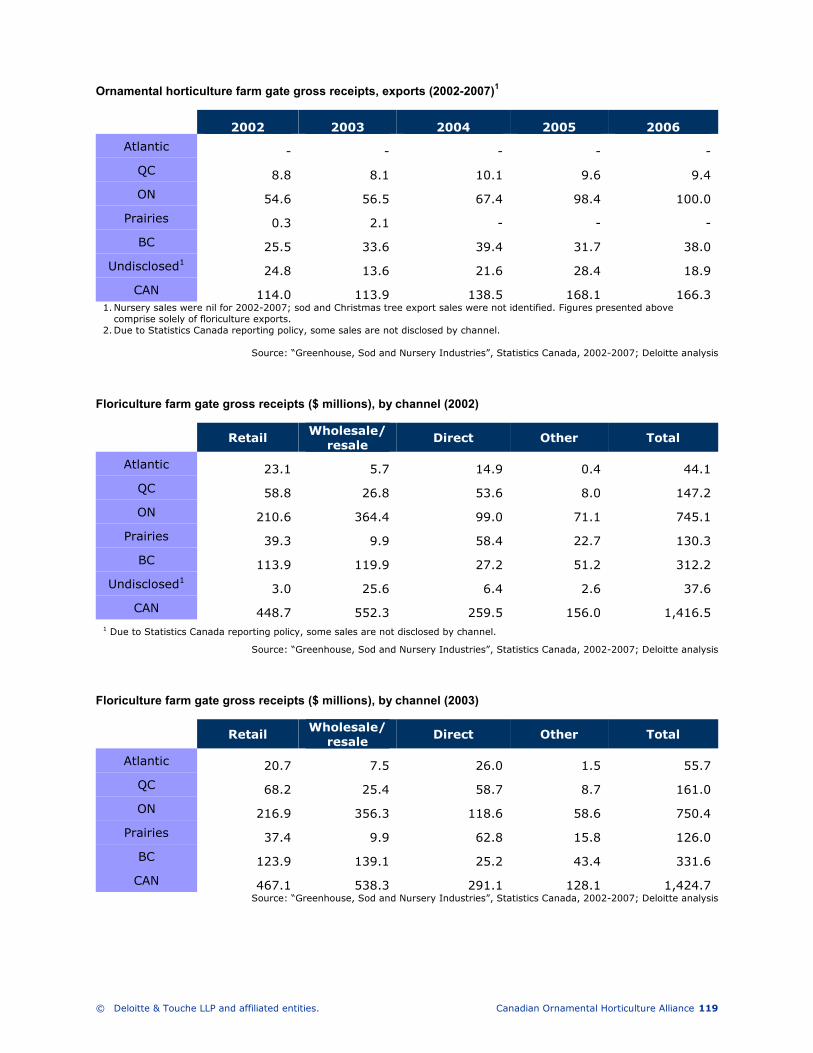
© Deloitte & Touche LLP and affiliated entities. Canadian Ornamental Horticulture Alliance 119
Ornamental horticulture farm gate gross receipts, exports (2002-2007)1
2002 2003 2004 2005 2006
Atlantic - - - - -
QC 8.8 8.1 10.1 9.6 9.4
ON 54.6 56.5 67.4 98.4 100.0
Prairies 0.3 2.1 - - -
BC 25.5 33.6 39.4 31.7 38.0
Undisclosed1 24.8 13.6 21.6 28.4 18.9
CAN 114.0 113.9 138.5 168.1 166.3 1. Nursery sales were nil for 2002-2007; sod and Christmas tree export sales were not identified. Figures presented above comprise solely of floriculture exports.
2. Due to Statistics Canada reporting policy, some sales are not disclosed by channel.
Source: “Greenhouse, Sod and Nursery Industries”, Statistics Canada, 2002-2007; Deloitte analysis
Floriculture farm gate gross receipts ($ millions), by channel (2002)
Retail Wholesale/ resale
Direct Other Total
Atlantic 23.1 5.7 14.9 0.4 44.1
QC 58.8 26.8 53.6 8.0 147.2
ON 210.6 364.4 99.0 71.1 745.1
Prairies 39.3 9.9 58.4 22.7 130.3
BC 113.9 119.9 27.2 51.2 312.2
Undisclosed1 3.0 25.6 6.4 2.6 37.6
CAN 448.7 552.3 259.5 156.0 1,416.5 1 Due to Statistics Canada reporting policy, some sales are not disclosed by channel.
Source: “Greenhouse, Sod and Nursery Industries”, Statistics Canada, 2002-2007; Deloitte analysis
Floriculture farm gate gross receipts ($ millions), by channel (2003)
Retail Wholesale/ resale
Direct Other Total
Atlantic 20.7 7.5 26.0 1.5 55.7
QC 68.2 25.4 58.7 8.7 161.0
ON 216.9 356.3 118.6 58.6 750.4
Prairies 37.4 9.9 62.8 15.8 126.0
BC 123.9 139.1 25.2 43.4 331.6
CAN 467.1 538.3 291.1 128.1 1,424.7 Source: “Greenhouse, Sod and Nursery Industries”, Statistics Canada, 2002-2007; Deloitte analysis

© Deloitte & Touche LLP and affiliated entities. Canadian Ornamental Horticulture Alliance 120
Floriculture farm gate gross receipts ($ millions), by channel (2004)
Retail Wholesale/ resale
Direct Other Total
Atlantic 19.8 8.2 17.7 1.1 46.8
QC 78.7 25.0 61.7 7.8 173.2
ON 210.6 303.8 108.6 49.9 672.9
Prairies 34.6 7.7 64.5 6.1 112.9
BC 116.7 141.3 33.1 38.5 329.6
Undisclosed1 2.6 75.3 6.5 21.4 105.8
CAN 463.0 561.3 292.1 124.8 1,441.2 1 Due to Statistics Canada reporting policy, some sales are not disclosed by channel.
Source: “Greenhouse, Sod and Nursery Industries”, Statistics Canada, 2002-2007; Deloitte analysis
Floriculture farm gate gross receipts ($ millions), by channel (2005)
Retail Wholesale/ resale
Direct Other Total
Atlantic 16.3 6.8 13.3 0.5 36.9
QC 74.9 26.0 57.0 7.7 165.6
ON 239.6 385.4 98.8 53.4 777.2
Prairies 25.5 8.3 64.3 21.6 119.7
BC 87.1 110.8 30.2 35.7 263.8
Undisclosed1 15.0 34.1 8.9 3.0 61.0
CAN 458.4 571.4 272.5 121.9 1,424.2 1 Due to Statistics Canada reporting policy, some sales are not disclosed by channel.
Source: “Greenhouse, Sod and Nursery Industries”, Statistics Canada, 2002-2007; Deloitte analysis
Floriculture farm gate gross receipts ($ millions), by channel (2006)
Retail Wholesale/ resale
Direct Other Total
Atlantic 22.6 6.4 18.9 1.2 49.1
QC 84.0 32.5 45.0 3.1 164.6
ON 231.0 400.0 106.0 32.0 769.0
Prairies 38.7 6.7 62.2 16.5 124.1
BC 102.0 130.8 31.5 53.2 317.5
Undisclosed1 4.6 20.2 0.1 9.0 33.9
CAN 482.9 596.6 263.7 115.0 1,458.2 1 Due to Statistics Canada reporting policy, some sales are not disclosed by channel.
Source: “Greenhouse, Sod and Nursery Industries”, Statistics Canada, 2002-2007; Deloitte analysis
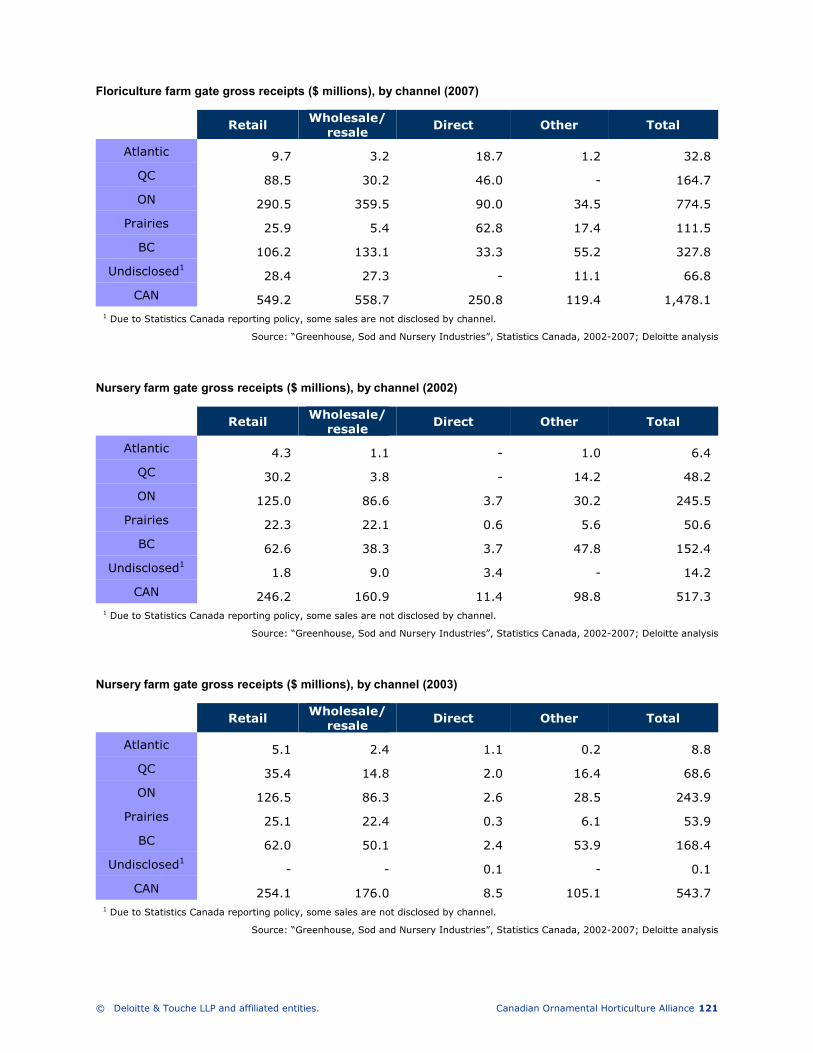
© Deloitte & Touche LLP and affiliated entities. Canadian Ornamental Horticulture Alliance 121
Floriculture farm gate gross receipts ($ millions), by channel (2007)
Retail Wholesale/ resale
Direct Other Total
Atlantic 9.7 3.2 18.7 1.2 32.8
QC 88.5 30.2 46.0 - 164.7
ON 290.5 359.5 90.0 34.5 774.5
Prairies 25.9 5.4 62.8 17.4 111.5
BC 106.2 133.1 33.3 55.2 327.8
Undisclosed1 28.4 27.3 - 11.1 66.8
CAN 549.2 558.7 250.8 119.4 1,478.1 1 Due to Statistics Canada reporting policy, some sales are not disclosed by channel.
Source: “Greenhouse, Sod and Nursery Industries”, Statistics Canada, 2002-2007; Deloitte analysis
Nursery farm gate gross receipts ($ millions), by channel (2002)
Retail Wholesale/ resale
Direct Other Total
Atlantic 4.3 1.1 - 1.0 6.4
QC 30.2 3.8 - 14.2 48.2
ON 125.0 86.6 3.7 30.2 245.5
Prairies 22.3 22.1 0.6 5.6 50.6
BC 62.6 38.3 3.7 47.8 152.4
Undisclosed1 1.8 9.0 3.4 - 14.2
CAN 246.2 160.9 11.4 98.8 517.3 1 Due to Statistics Canada reporting policy, some sales are not disclosed by channel.
Source: “Greenhouse, Sod and Nursery Industries”, Statistics Canada, 2002-2007; Deloitte analysis
Nursery farm gate gross receipts ($ millions), by channel (2003)
Retail Wholesale/ resale
Direct Other Total
Atlantic 5.1 2.4 1.1 0.2 8.8
QC 35.4 14.8 2.0 16.4 68.6
ON 126.5 86.3 2.6 28.5 243.9
Prairies 25.1 22.4 0.3 6.1 53.9
BC 62.0 50.1 2.4 53.9 168.4
Undisclosed1 - - 0.1 - 0.1
CAN 254.1 176.0 8.5 105.1 543.7 1 Due to Statistics Canada reporting policy, some sales are not disclosed by channel.
Source: “Greenhouse, Sod and Nursery Industries”, Statistics Canada, 2002-2007; Deloitte analysis
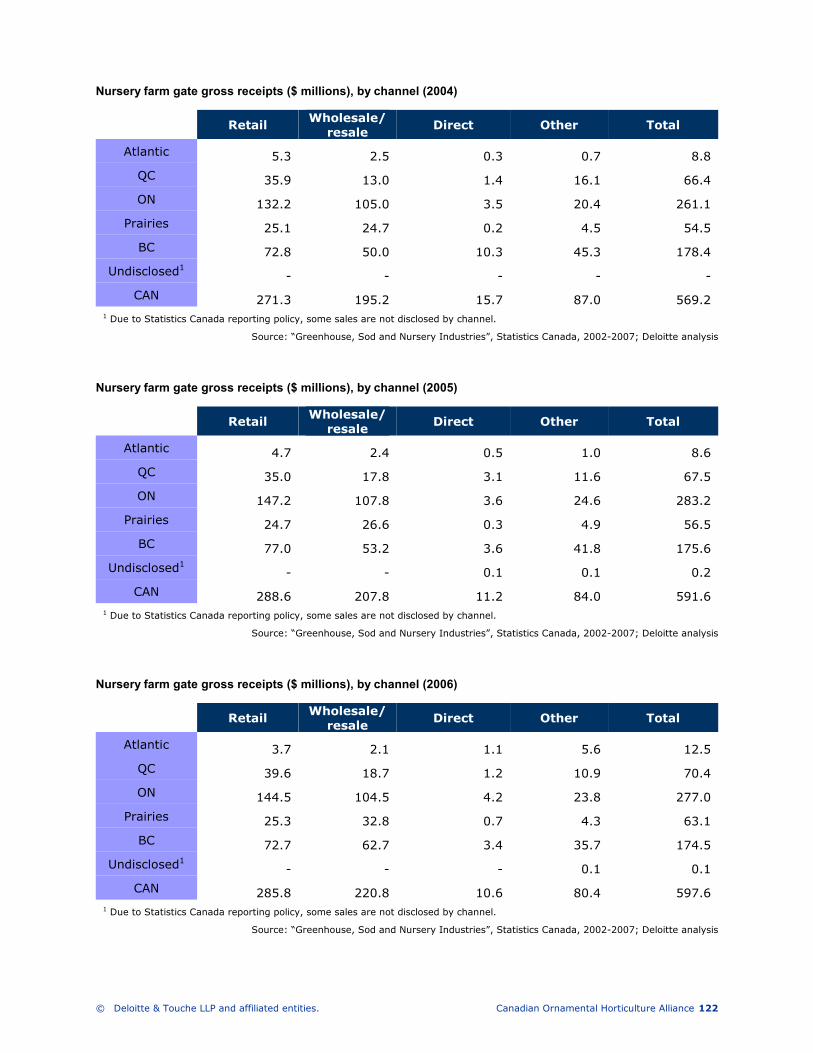
© Deloitte & Touche LLP and affiliated entities. Canadian Ornamental Horticulture Alliance 122
Nursery farm gate gross receipts ($ millions), by channel (2004)
Retail Wholesale/ resale
Direct Other Total
Atlantic 5.3 2.5 0.3 0.7 8.8
QC 35.9 13.0 1.4 16.1 66.4
ON 132.2 105.0 3.5 20.4 261.1
Prairies 25.1 24.7 0.2 4.5 54.5
BC 72.8 50.0 10.3 45.3 178.4
Undisclosed1 - - - - -
CAN 271.3 195.2 15.7 87.0 569.2 1 Due to Statistics Canada reporting policy, some sales are not disclosed by channel.
Source: “Greenhouse, Sod and Nursery Industries”, Statistics Canada, 2002-2007; Deloitte analysis
Nursery farm gate gross receipts ($ millions), by channel (2005)
Retail Wholesale/ resale
Direct Other Total
Atlantic 4.7 2.4 0.5 1.0 8.6
QC 35.0 17.8 3.1 11.6 67.5
ON 147.2 107.8 3.6 24.6 283.2
Prairies 24.7 26.6 0.3 4.9 56.5
BC 77.0 53.2 3.6 41.8 175.6
Undisclosed1 - - 0.1 0.1 0.2
CAN 288.6 207.8 11.2 84.0 591.6 1 Due to Statistics Canada reporting policy, some sales are not disclosed by channel.
Source: “Greenhouse, Sod and Nursery Industries”, Statistics Canada, 2002-2007; Deloitte analysis
Nursery farm gate gross receipts ($ millions), by channel (2006)
Retail Wholesale/ resale
Direct Other Total
Atlantic 3.7 2.1 1.1 5.6 12.5
QC 39.6 18.7 1.2 10.9 70.4
ON 144.5 104.5 4.2 23.8 277.0
Prairies 25.3 32.8 0.7 4.3 63.1
BC 72.7 62.7 3.4 35.7 174.5
Undisclosed1 - - - 0.1 0.1
CAN 285.8 220.8 10.6 80.4 597.6 1 Due to Statistics Canada reporting policy, some sales are not disclosed by channel.
Source: “Greenhouse, Sod and Nursery Industries”, Statistics Canada, 2002-2007; Deloitte analysis
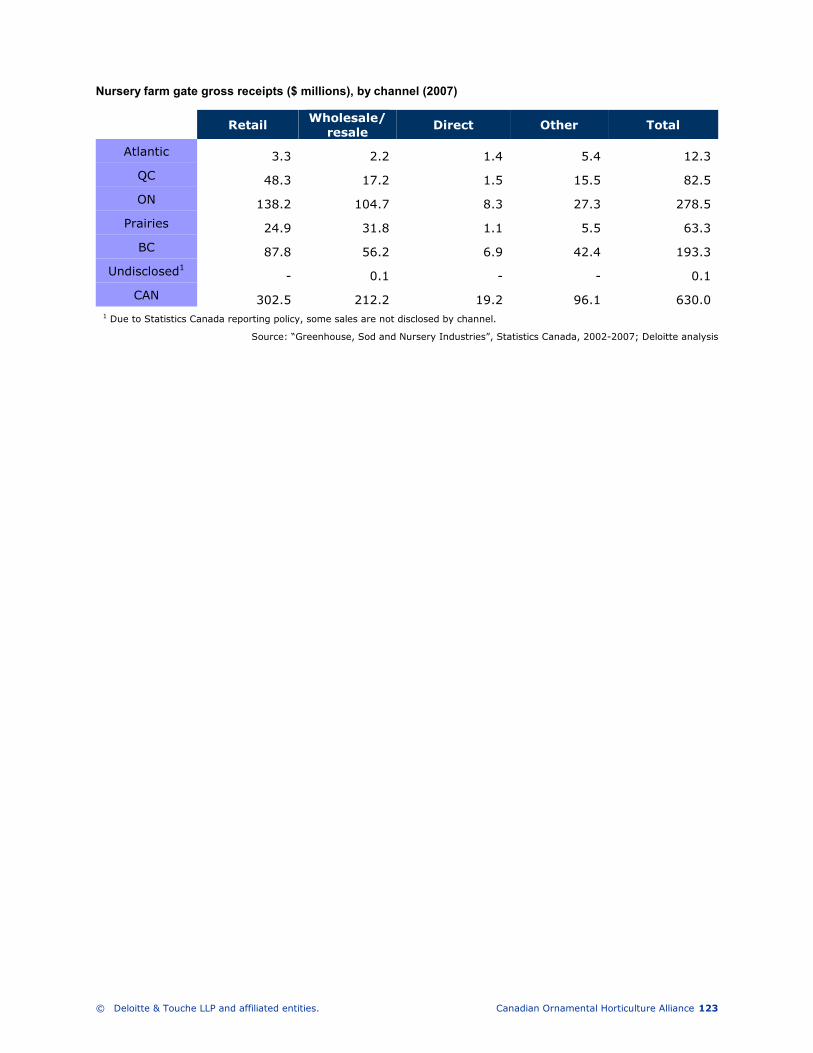
© Deloitte & Touche LLP and affiliated entities. Canadian Ornamental Horticulture Alliance 123
Nursery farm gate gross receipts ($ millions), by channel (2007)
Retail Wholesale/ resale
Direct Other Total
Atlantic 3.3 2.2 1.4 5.4 12.3
QC 48.3 17.2 1.5 15.5 82.5
ON 138.2 104.7 8.3 27.3 278.5
Prairies 24.9 31.8 1.1 5.5 63.3
BC 87.8 56.2 6.9 42.4 193.3
Undisclosed1 - 0.1 - - 0.1
CAN 302.5 212.2 19.2 96.1 630.0 1 Due to Statistics Canada reporting policy, some sales are not disclosed by channel.
Source: “Greenhouse, Sod and Nursery Industries”, Statistics Canada, 2002-2007; Deloitte analysis
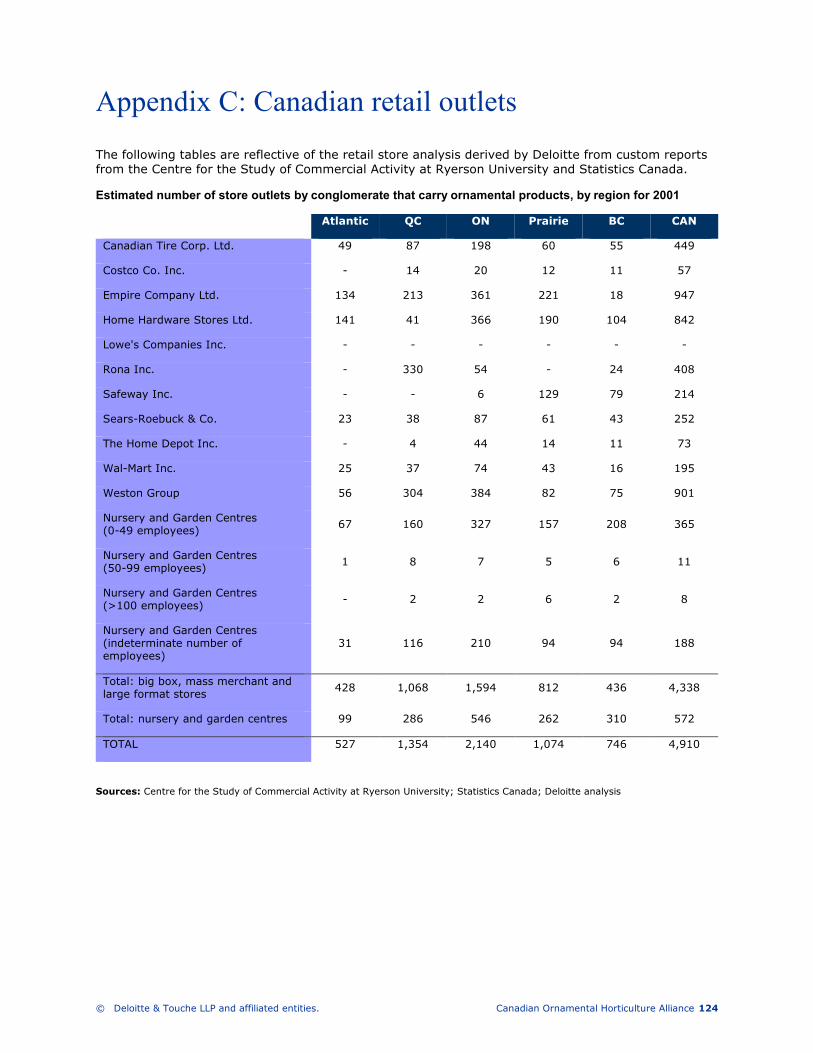
© Deloitte & Touche LLP and affiliated entities. Canadian Ornamental Horticulture Alliance 124
Appendix C: Canadian retail outlets
The following tables are reflective of the retail store analysis derived by Deloitte from custom reports from the Centre for the Study of Commercial Activity at Ryerson University and Statistics Canada.
Estimated number of store outlets by conglomerate that carry ornamental products, by region for 2001
Atlantic QC ON Prairie BC CAN
Canadian Tire Corp. Ltd. 49 87 198 60 55 449
Costco Co. Inc. - 14 20 12 11 57
Empire Company Ltd. 134 213 361 221 18 947
Home Hardware Stores Ltd. 141 41 366 190 104 842
Lowe's Companies Inc. - - - - - -
Rona Inc. - 330 54 - 24 408
Safeway Inc. - - 6 129 79 214
Sears-Roebuck & Co. 23 38 87 61 43 252
The Home Depot Inc. - 4 44 14 11 73
Wal-Mart Inc. 25 37 74 43 16 195
Weston Group 56 304 384 82 75 901
Nursery and Garden Centres (0-49 employees) 67 160 327 157 208 365
Nursery and Garden Centres (50-99 employees) 1 8 7 5 6 11
Nursery and Garden Centres (>100 employees) - 2 2 6 2 8
Nursery and Garden Centres (indeterminate number of employees)
31 116 210 94 94 188
Total: big box, mass merchant and large format stores 428 1,068 1,594 812 436 4,338
Total: nursery and garden centres 99 286 546 262 310 572
TOTAL 527 1,354 2,140 1,074 746 4,910
Sources: Centre for the Study of Commercial Activity at Ryerson University; Statistics Canada; Deloitte analysis

© Deloitte & Touche LLP and affiliated entities. Canadian Ornamental Horticulture Alliance 125
Estimated number of store outlets by conglomerate that carry ornamental products, by region for 2007
Atlantic QC ON Prairie BC CAN
Canadian Tire Corp. Ltd. 52 94 199 71 55 471
Costco Co. Inc. - 17 24 14 12 67
Empire Company Ltd. 123 275 385 183 28 994
Home Hardware Stores Ltd. 150 68 366 162 92 838
Lowe's Companies Inc. - - 3 - - 3
Rona Inc. - 299 60 22 30 411
Safeway Inc. - - 6 131 78 215
Sears-Roebuck & Co. 37 44 90 66 47 284
The Home Depot Inc. 8 20 78 32 21 159
Wal-Mart Inc. 38 50 104 61 28 281
Weston Group 46 264 414 122 87 933
Nursery and Garden Centres (0-49 employees)
70 173 375 177 246 423
Nursery and Garden Centres (50-99 employees)
1 9 8 6 7 13
Nursery and Garden Centres (>100 employees)
1 - 1 5 1 6
Nursery and Garden Centres (indeterminate number of employees)
31 90 247 107 102 209
Total: big box, mass merchant and large format stores
454 1,131 1,729 864 478 4,656
Total: nursery and garden centres 103 272 631 295 356 651
TOTAL 557 1,403 2,360 1,159 834 5,307
Sources: Centre for the Study of Commercial Activity at Ryerson University; Statistics Canada; Deloitte analysis
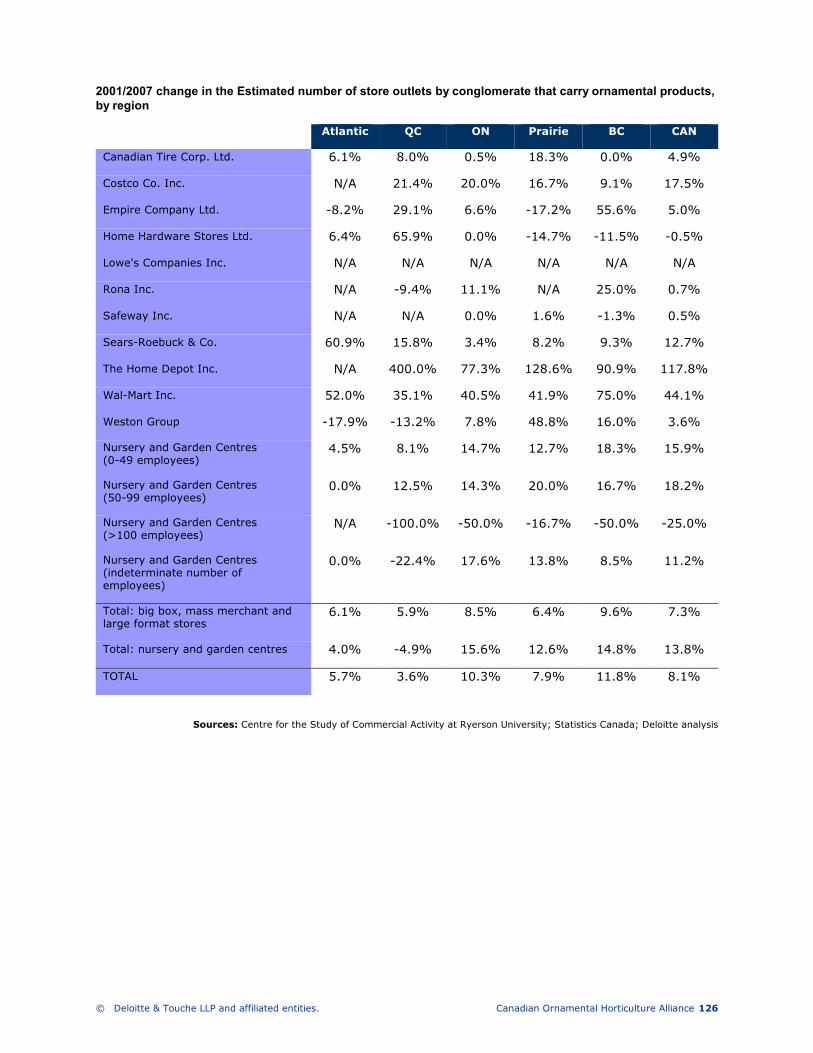
© Deloitte & Touche LLP and affiliated entities. Canadian Ornamental Horticulture Alliance 126
2001/2007 change in the Estimated number of store outlets by conglomerate that carry ornamental products, by region
Atlantic QC ON Prairie BC CAN
Canadian Tire Corp. Ltd. 6.1% 8.0% 0.5% 18.3% 0.0% 4.9%
Costco Co. Inc. N/A 21.4% 20.0% 16.7% 9.1% 17.5%
Empire Company Ltd. -8.2% 29.1% 6.6% -17.2% 55.6% 5.0%
Home Hardware Stores Ltd. 6.4% 65.9% 0.0% -14.7% -11.5% -0.5%
Lowe's Companies Inc. N/A N/A N/A N/A N/A N/A
Rona Inc. N/A -9.4% 11.1% N/A 25.0% 0.7%
Safeway Inc. N/A N/A 0.0% 1.6% -1.3% 0.5%
Sears-Roebuck & Co. 60.9% 15.8% 3.4% 8.2% 9.3% 12.7%
The Home Depot Inc. N/A 400.0% 77.3% 128.6% 90.9% 117.8%
Wal-Mart Inc. 52.0% 35.1% 40.5% 41.9% 75.0% 44.1%
Weston Group -17.9% -13.2% 7.8% 48.8% 16.0% 3.6%
Nursery and Garden Centres (0-49 employees)
4.5% 8.1% 14.7% 12.7% 18.3% 15.9%
Nursery and Garden Centres (50-99 employees)
0.0% 12.5% 14.3% 20.0% 16.7% 18.2%
Nursery and Garden Centres (>100 employees)
N/A -100.0% -50.0% -16.7% -50.0% -25.0%
Nursery and Garden Centres (indeterminate number of employees)
0.0% -22.4% 17.6% 13.8% 8.5% 11.2%
Total: big box, mass merchant and large format stores
6.1% 5.9% 8.5% 6.4% 9.6% 7.3%
Total: nursery and garden centres 4.0% -4.9% 15.6% 12.6% 14.8% 13.8%
TOTAL 5.7% 3.6% 10.3% 7.9% 11.8% 8.1%
Sources: Centre for the Study of Commercial Activity at Ryerson University; Statistics Canada; Deloitte analysis
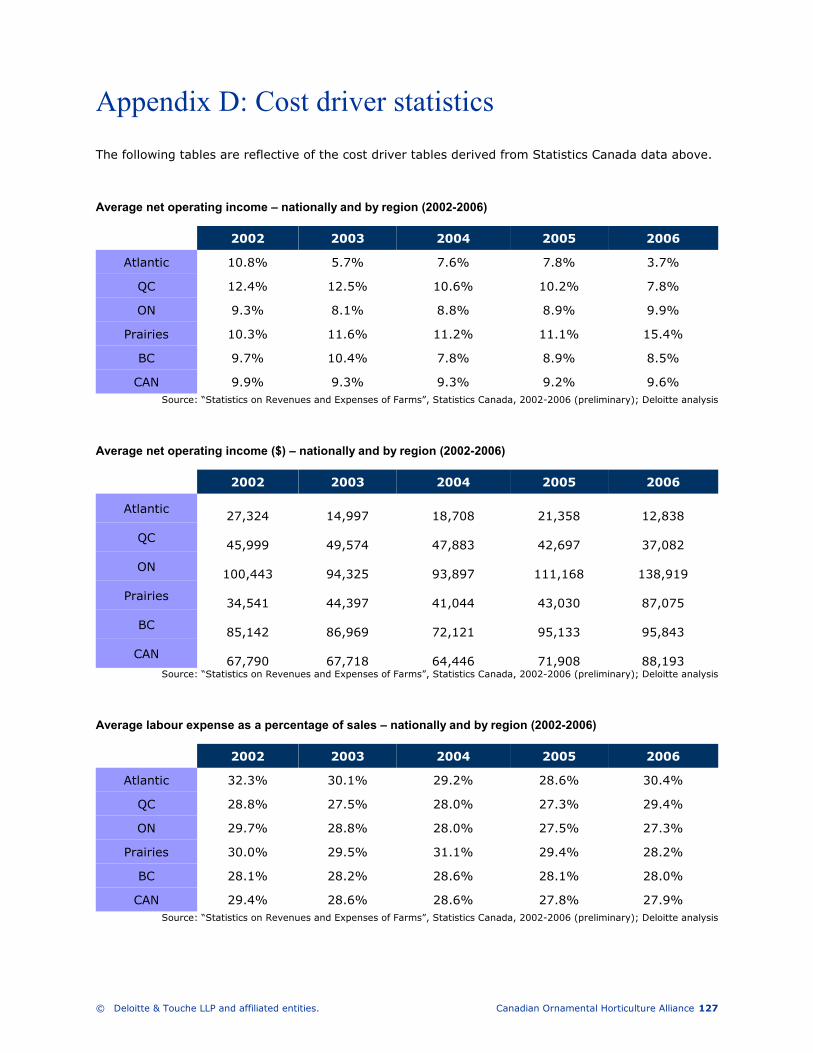
© Deloitte & Touche LLP and affiliated entities. Canadian Ornamental Horticulture Alliance 127
Appendix D: Cost driver statistics
The following tables are reflective of the cost driver tables derived from Statistics Canada data above.
Average net operating income – nationally and by region (2002-2006)
2002 2003 2004 2005 2006
Atlantic 10.8% 5.7% 7.6% 7.8% 3.7%
QC 12.4% 12.5% 10.6% 10.2% 7.8%
ON 9.3% 8.1% 8.8% 8.9% 9.9%
Prairies 10.3% 11.6% 11.2% 11.1% 15.4%
BC 9.7% 10.4% 7.8% 8.9% 8.5%
CAN 9.9% 9.3% 9.3% 9.2% 9.6% Source: “Statistics on Revenues and Expenses of Farms”, Statistics Canada, 2002-2006 (preliminary); Deloitte analysis
Average net operating income ($) – nationally and by region (2002-2006)
2002 2003 2004 2005 2006
Atlantic 27,324
14,997
18,708
21,358
12,838
QC 45,999
49,574
47,883
42,697
37,082
ON 100,443
94,325
93,897
111,168
138,919
Prairies 34,541
44,397
41,044
43,030
87,075
BC 85,142
86,969
72,121
95,133
95,843
CAN 67,790
67,718
64,446
71,908
88,193
Source: “Statistics on Revenues and Expenses of Farms”, Statistics Canada, 2002-2006 (preliminary); Deloitte analysis
Average labour expense as a percentage of sales – nationally and by region (2002-2006)
2002 2003 2004 2005 2006
Atlantic 32.3% 30.1% 29.2% 28.6% 30.4%
QC 28.8% 27.5% 28.0% 27.3% 29.4%
ON 29.7% 28.8% 28.0% 27.5% 27.3%
Prairies 30.0% 29.5% 31.1% 29.4% 28.2%
BC 28.1% 28.2% 28.6% 28.1% 28.0%
CAN 29.4% 28.6% 28.6% 27.8% 27.9% Source: “Statistics on Revenues and Expenses of Farms”, Statistics Canada, 2002-2006 (preliminary); Deloitte analysis
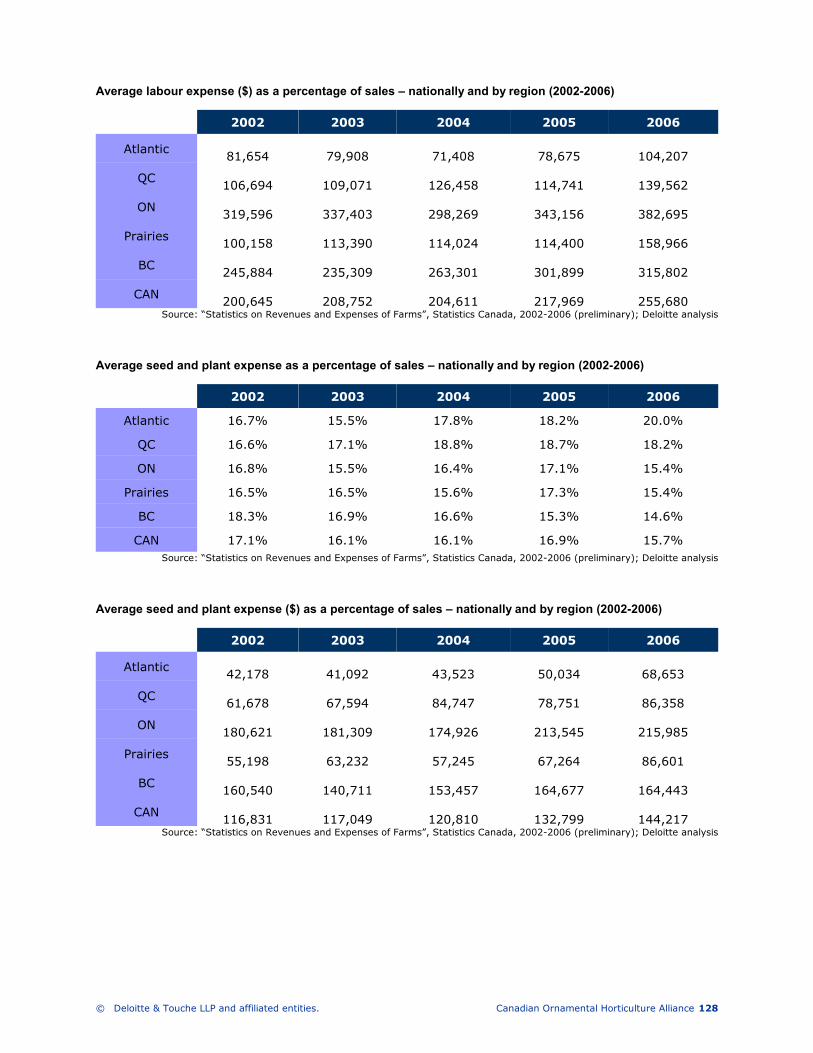
© Deloitte & Touche LLP and affiliated entities. Canadian Ornamental Horticulture Alliance 128
Average labour expense ($) as a percentage of sales – nationally and by region (2002-2006)
2002 2003 2004 2005 2006
Atlantic 81,654
79,908
71,408
78,675
104,207
QC 106,694
109,071
126,458
114,741
139,562
ON 319,596
337,403
298,269
343,156
382,695
Prairies 100,158
113,390
114,024
114,400
158,966
BC 245,884
235,309
263,301
301,899
315,802
CAN 200,645
208,752
204,611
217,969
255,680
Source: “Statistics on Revenues and Expenses of Farms”, Statistics Canada, 2002-2006 (preliminary); Deloitte analysis
Average seed and plant expense as a percentage of sales – nationally and by region (2002-2006)
2002 2003 2004 2005 2006
Atlantic 16.7% 15.5% 17.8% 18.2% 20.0%
QC 16.6% 17.1% 18.8% 18.7% 18.2%
ON 16.8% 15.5% 16.4% 17.1% 15.4%
Prairies 16.5% 16.5% 15.6% 17.3% 15.4%
BC 18.3% 16.9% 16.6% 15.3% 14.6%
CAN 17.1% 16.1% 16.1% 16.9% 15.7% Source: “Statistics on Revenues and Expenses of Farms”, Statistics Canada, 2002-2006 (preliminary); Deloitte analysis
Average seed and plant expense ($) as a percentage of sales – nationally and by region (2002-2006)
2002 2003 2004 2005 2006
Atlantic 42,178
41,092
43,523
50,034
68,653
QC 61,678
67,594
84,747
78,751
86,358
ON 180,621
181,309
174,926
213,545
215,985
Prairies 55,198
63,232
57,245
67,264
86,601
BC 160,540
140,711
153,457
164,677
164,443
CAN 116,831
117,049
120,810
132,799
144,217
Source: “Statistics on Revenues and Expenses of Farms”, Statistics Canada, 2002-2006 (preliminary); Deloitte analysis
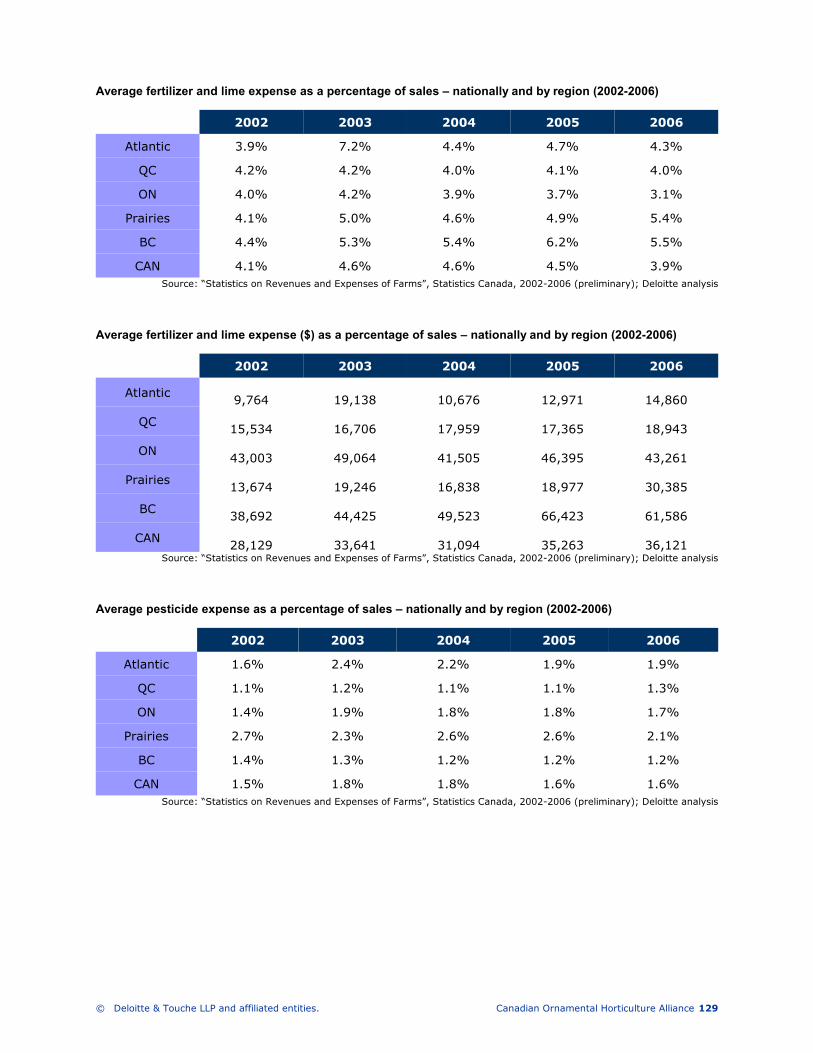
© Deloitte & Touche LLP and affiliated entities. Canadian Ornamental Horticulture Alliance 129
Average fertilizer and lime expense as a percentage of sales – nationally and by region (2002-2006)
2002 2003 2004 2005 2006
Atlantic 3.9% 7.2% 4.4% 4.7% 4.3%
QC 4.2% 4.2% 4.0% 4.1% 4.0%
ON 4.0% 4.2% 3.9% 3.7% 3.1%
Prairies 4.1% 5.0% 4.6% 4.9% 5.4%
BC 4.4% 5.3% 5.4% 6.2% 5.5%
CAN 4.1% 4.6% 4.6% 4.5% 3.9% Source: “Statistics on Revenues and Expenses of Farms”, Statistics Canada, 2002-2006 (preliminary); Deloitte analysis
Average fertilizer and lime expense ($) as a percentage of sales – nationally and by region (2002-2006)
2002 2003 2004 2005 2006
Atlantic 9,764
19,138
10,676
12,971
14,860
QC 15,534
16,706
17,959
17,365
18,943
ON 43,003
49,064
41,505
46,395
43,261
Prairies 13,674
19,246
16,838
18,977
30,385
BC 38,692
44,425
49,523
66,423
61,586
CAN 28,129
33,641
31,094
35,263
36,121
Source: “Statistics on Revenues and Expenses of Farms”, Statistics Canada, 2002-2006 (preliminary); Deloitte analysis
Average pesticide expense as a percentage of sales – nationally and by region (2002-2006)
2002 2003 2004 2005 2006
Atlantic 1.6% 2.4% 2.2% 1.9% 1.9%
QC 1.1% 1.2% 1.1% 1.1% 1.3%
ON 1.4% 1.9% 1.8% 1.8% 1.7%
Prairies 2.7% 2.3% 2.6% 2.6% 2.1%
BC 1.4% 1.3% 1.2% 1.2% 1.2%
CAN 1.5% 1.8% 1.8% 1.6% 1.6% Source: “Statistics on Revenues and Expenses of Farms”, Statistics Canada, 2002-2006 (preliminary); Deloitte analysis
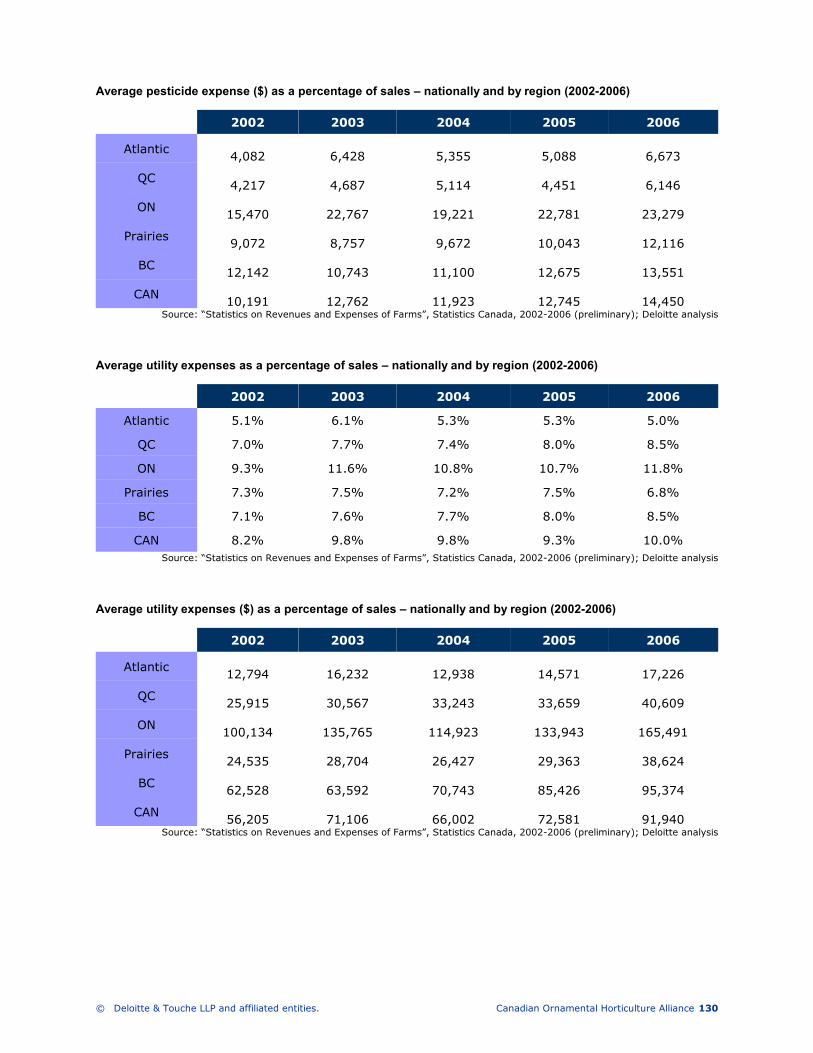
© Deloitte & Touche LLP and affiliated entities. Canadian Ornamental Horticulture Alliance 130
Average pesticide expense ($) as a percentage of sales – nationally and by region (2002-2006)
2002 2003 2004 2005 2006
Atlantic 4,082
6,428
5,355
5,088
6,673
QC 4,217
4,687
5,114
4,451
6,146
ON 15,470
22,767
19,221
22,781
23,279
Prairies 9,072
8,757
9,672
10,043
12,116
BC 12,142
10,743
11,100
12,675
13,551
CAN 10,191
12,762
11,923
12,745
14,450
Source: “Statistics on Revenues and Expenses of Farms”, Statistics Canada, 2002-2006 (preliminary); Deloitte analysis
Average utility expenses as a percentage of sales – nationally and by region (2002-2006)
2002 2003 2004 2005 2006
Atlantic 5.1% 6.1% 5.3% 5.3% 5.0%
QC 7.0% 7.7% 7.4% 8.0% 8.5%
ON 9.3% 11.6% 10.8% 10.7% 11.8%
Prairies 7.3% 7.5% 7.2% 7.5% 6.8%
BC 7.1% 7.6% 7.7% 8.0% 8.5%
CAN 8.2% 9.8% 9.8% 9.3% 10.0% Source: “Statistics on Revenues and Expenses of Farms”, Statistics Canada, 2002-2006 (preliminary); Deloitte analysis
Average utility expenses ($) as a percentage of sales – nationally and by region (2002-2006)
2002 2003 2004 2005 2006
Atlantic 12,794
16,232
12,938
14,571
17,226
QC 25,915
30,567
33,243
33,659
40,609
ON 100,134
135,765
114,923
133,943
165,491
Prairies 24,535
28,704
26,427
29,363
38,624
BC 62,528
63,592
70,743
85,426
95,374
CAN 56,205
71,106
66,002
72,581
91,940
Source: “Statistics on Revenues and Expenses of Farms”, Statistics Canada, 2002-2006 (preliminary); Deloitte analysis
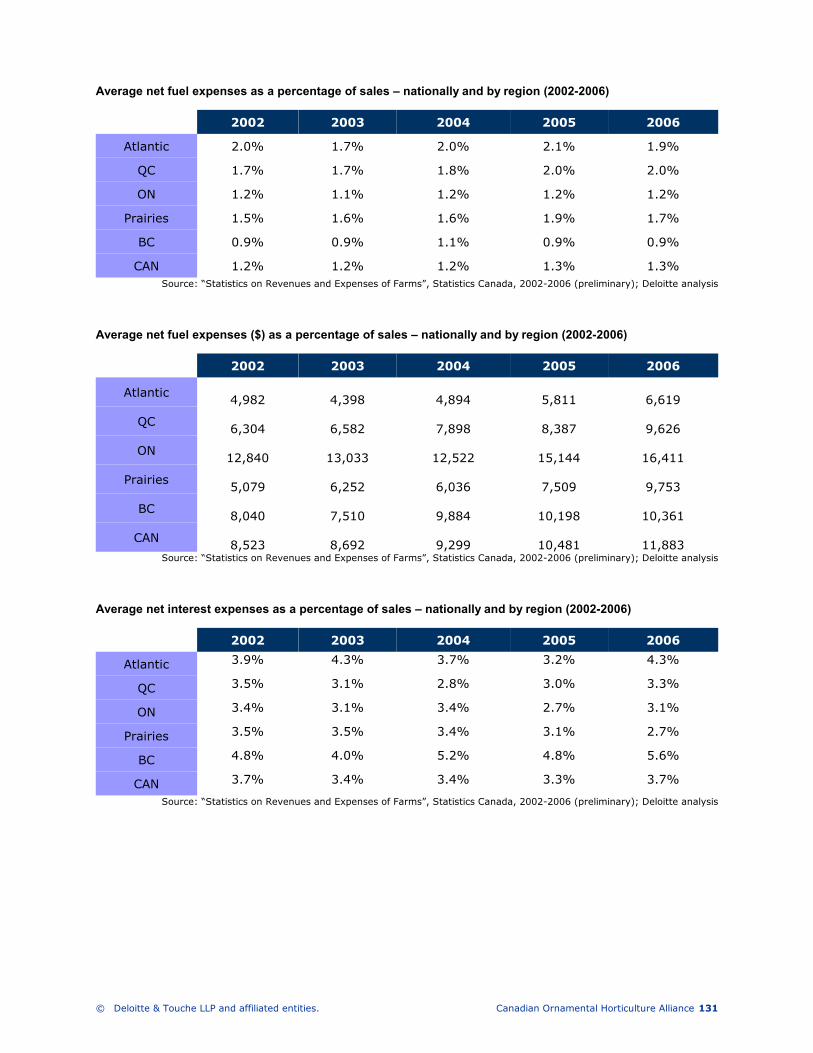
© Deloitte & Touche LLP and affiliated entities. Canadian Ornamental Horticulture Alliance 131
Average net fuel expenses as a percentage of sales – nationally and by region (2002-2006)
2002 2003 2004 2005 2006
Atlantic 2.0% 1.7% 2.0% 2.1% 1.9%
QC 1.7% 1.7% 1.8% 2.0% 2.0%
ON 1.2% 1.1% 1.2% 1.2% 1.2%
Prairies 1.5% 1.6% 1.6% 1.9% 1.7%
BC 0.9% 0.9% 1.1% 0.9% 0.9%
CAN 1.2% 1.2% 1.2% 1.3% 1.3% Source: “Statistics on Revenues and Expenses of Farms”, Statistics Canada, 2002-2006 (preliminary); Deloitte analysis
Average net fuel expenses ($) as a percentage of sales – nationally and by region (2002-2006)
2002 2003 2004 2005 2006
Atlantic 4,982
4,398
4,894
5,811
6,619
QC 6,304
6,582
7,898
8,387
9,626
ON 12,840
13,033
12,522
15,144
16,411
Prairies 5,079
6,252
6,036
7,509
9,753
BC 8,040
7,510
9,884
10,198
10,361
CAN 8,523
8,692
9,299
10,481
11,883
Source: “Statistics on Revenues and Expenses of Farms”, Statistics Canada, 2002-2006 (preliminary); Deloitte analysis
Average net interest expenses as a percentage of sales – nationally and by region (2002-2006)
2002 2003 2004 2005 2006
Atlantic 3.9% 4.3% 3.7% 3.2% 4.3%
QC 3.5% 3.1% 2.8% 3.0% 3.3%
ON 3.4% 3.1% 3.4% 2.7% 3.1%
Prairies 3.5% 3.5% 3.4% 3.1% 2.7%
BC 4.8% 4.0% 5.2% 4.8% 5.6%
CAN 3.7% 3.4% 3.4% 3.3% 3.7%
Source: “Statistics on Revenues and Expenses of Farms”, Statistics Canada, 2002-2006 (preliminary); Deloitte analysis
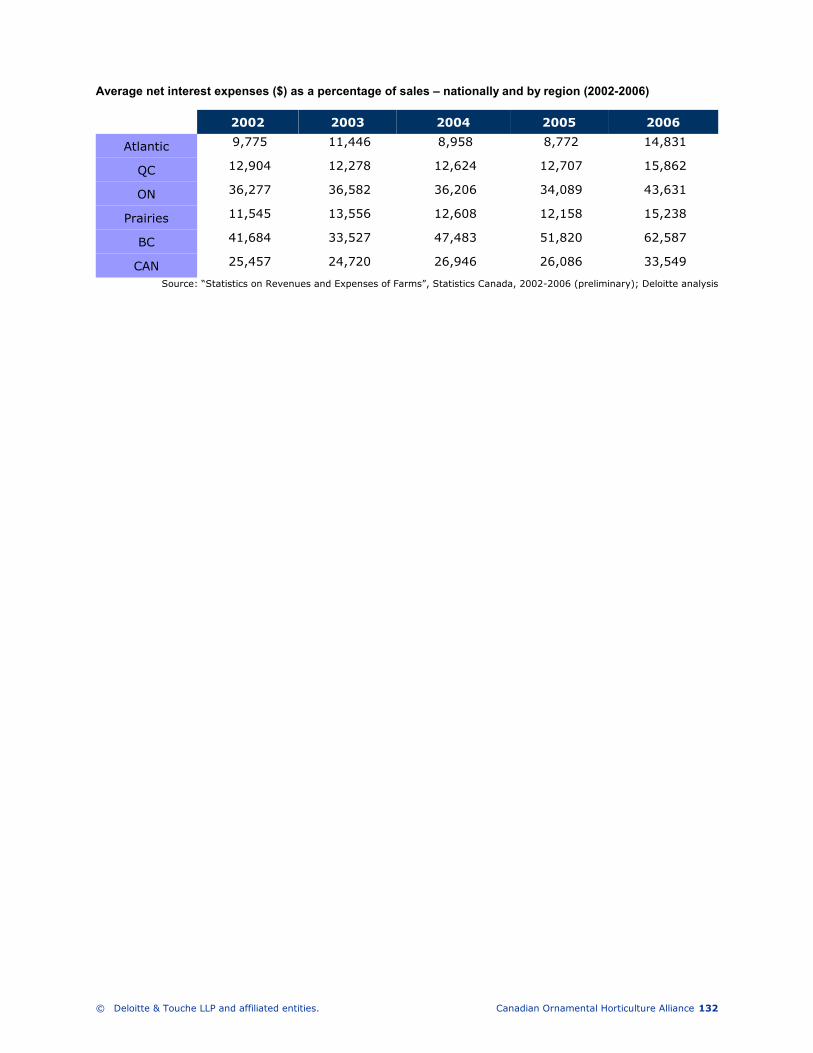
© Deloitte & Touche LLP and affiliated entities. Canadian Ornamental Horticulture Alliance 132
Average net interest expenses ($) as a percentage of sales – nationally and by region (2002-2006)
2002 2003 2004 2005 2006
Atlantic 9,775 11,446 8,958 8,772 14,831
QC 12,904 12,278 12,624 12,707 15,862
ON 36,277 36,582 36,206 34,089 43,631
Prairies 11,545 13,556 12,608 12,158 15,238
BC 41,684 33,527 47,483 51,820 62,587
CAN 25,457 24,720 26,946 26,086 33,549
Source: “Statistics on Revenues and Expenses of Farms”, Statistics Canada, 2002-2006 (preliminary); Deloitte analysis

www.deloitte.ca
Deloitte, one of Canada's leading professional services firms, provides audit, tax, consulting, and financial advisory services through more than 7,600 people in 56 offices. Deloitte operates in Québec as Samson Bélair/Deloitte & Touche s.e.n.c.r.l. The firm is dedicated to helping its clients and its people excel. Deloitte is the Canadian member firm of Deloitte Touche Tohmatsu. Deloitte refers to one or more of Deloitte Touche Tohmatsu, a Swiss Verein, its member firms, and their respective subsidiaries and affiliates. As a Swiss Verein (association), neither Deloitte Touche Tohmatsu nor any of its member firms have any liability for each other's acts or omissions. Each of the member firms is a separate and independent legal entity operating under the names "Deloitte," "Deloitte & Touche," "Deloitte Touche Tohmatsu," or other related names. Services are provided by the member firms or their subsidiaries or affiliates and not by the Deloitte Touche Tohmatsu Verein. © Deloitte & Touche LLP and affiliated entities.