ACCRETION F DISPARATE PROFILES OF RAMAN …jkas.kas.org/journals/2015v48n2/v48n2p105_hwlee.pdfA...
8
Journal of the Korean Astronomical Society http://dx.doi.org/10.5303/JKAS.2015.48.2.105 48: 105 ∼ 112, 2015 April pISSN: 1225-4614 · eISSN: 2288-890X c 2015. The Korean Astronomical Society. All rights reserved. http://jkas.kas.org ACCRETION F LOW AND DISPARATE P ROFILES OF RAMAN S CATTERED O VI λλ 1032, 1038 IN THE S YMBIOTIC S TAR V1016 CYGNI Jeong-Eun Heo and Hee-Won Lee Department of Physics and Astronomy, Sejong University, 209 Neungdong-ro, Gwangjin-gu, Seoul 143-747, Korea [email protected], [email protected] Received January 20, 2015; accepted February 26, 2015 Abstract: The symbiotic star V1016 Cygni, a detached binary system consisting of a hot white dwarf and a mass-losing Mira variable, shows very broad emission features at around 6825 ˚ A and 7082 ˚ A, which are Raman scattered O vi λλ 1032, 1038 by atomic hydrogen. In the high resolution spectrum of V1016 Cyg obtained with the Bohyunsan Optical Echelle Spectrograph these broad features exhibit double peak profiles with the red peak stronger than the blue counterpart. However, their profiles differ in such a way that the blue peak of the 7082 feature is relatively weaker than the 6825 counterpart when the two Raman features are normalized to exhibit an equal red peak strength in the Doppler factor space. Assuming that an accretion flow around the white dwarf is responsible for the double peak profiles, we attribute this disparity in the profiles to the local variation of the flux ratio of O vi λλ 1032, 1038 in the accretion flow. A Monte Carlo technique is adopted to provide emissivity maps showing the local emissivity of O vi λ1032 and O vi λ1038 in the vicinity of the white dwarf. We also present a map indicating the differing flux ratios of O vi λλ 1032 and 1038. Our result shows that the flux ratio reaches its maximum of 2 in the emission region responsible for the central trough of the Raman feature and that the flux ratio in the inner red emission region is almost 1. The blue emission region and the outer red emission region exhibit an intermediate ratio around 1.5. We conclude that the disparity in the profiles of the two Raman O vi features strongly implies accretion flow around the white dwarf, which is azimuthally asymmetric. Key words: binaries: symbiotic — stars: individual: V1016 Cyg — scattering — accretion, accretion disks — line: profiles 1. I NTRODUCTION Active binary systems containing a white dwarf are im- portant as potential progenitors of Type Ia supernovae, which were essential in establishing the standard pic- ture of the universe dominated by dark energy (e.g., Iben & Tutukov 1984; Perlmutter et al. 1998). De- pending on the nature of the companion, active white dwarf binary systems can be divided into cataclysmic variables and symbiotic stars. Cataclysmic variables are binary systems of a white dwarf with a late type main sequence star that fills the Roche lobe. Promi- nent activities exhibited by cataclysmic variables are attributed to the presence of an accretion disk around the white dwarf that results from the Roche lobe over- flow from the companion (e.g., Warner 1995). Symbiotic stars are binary systems of a white dwarf and a mass losing giant which does not fill the Roche lobe (Mikolajewska 2012). The spectra of symbiotic stars are characterized by the existence of TiO absorp- tion bands indicative of a cool star and prominent emis- sion lines including high ionization species such as O vi and Ne vii. Considering the size of the giant compan- ion, the orbital period usually exceeds several hundred days and sometimes several decades. They are classified into ‘S’ type and ‘D’ type, where ‘D’ type symbiotics exhibit an IR excess that indicates the presence of a Corresponding author: H.-W. Lee warm dust component with a temperature T ∼ 1000 K (Angeloni et al. 2010). In contrast, the IR excess is absent in the spectral energy distribution of ‘S’ type symbiotics. One distinguishing aspect of the symbiotic spectra is the existence of broad emission features at around 6825 ˚ A and 7082 ˚ A, whose existence is quite exclusive to symbiotic stars with an exception of a young plan- etary nebula (e.g., Allen 1980). These features were identified by Schmid (1989), who proposed that they are formed through Raman scattering of O vi λλ 1032, 1038 by atomic hydrogen. When an O vi λ 1032 line photon is incident upon a hydrogen atom in the ground state, an optical photon at around 6825 ˚ A is re-emitted as the hydrogen atom de-excites to the excited 2s state. In a similar way, an optical photon at around 7082 ˚ A re- sults from the inelastic scattering process for an O vi λ 1038 photon. The cross sections and branching ratios for Raman scattering can be computed in a straight- forward manner using the Kramers-Heisenberg formula (e.g., Schmid 1989; Bach & Lee 2014). Raman O vi features in symbiotic stars are known to exhibit complicated profiles including double-peak pro- files and triple-peak profiles (e.g., Harries & Howarth 1997). In particular, a number of symbiotic stars clas- sified as symbiotic novae including V1016 Cyg, HM Sge and RR Tel exhibit double-peak profiles clearly with the red peak stronger than the blue counterpart. 105
Transcript of ACCRETION F DISPARATE PROFILES OF RAMAN …jkas.kas.org/journals/2015v48n2/v48n2p105_hwlee.pdfA...
Journal of the Korean Astronomical Society http://dx.doi.org/10.5303/JKAS.2015.48.2.105
48: 105 ∼ 112, 2015 April pISSN: 1225-4614 · eISSN: 2288-890X
c©2015. The Korean Astronomical Society. All rights reserved. http://jkas.kas.org
ACCRETION FLOW AND DISPARATE PROFILES OF RAMAN SCATTERED
O VI λλ 1032, 1038IN THE SYMBIOTIC STAR V1016 CYGNI
Jeong-Eun Heo and Hee-Won Lee
Department of Physics and Astronomy, Sejong University, 209 Neungdong-ro, Gwangjin-gu, Seoul 143-747, [email protected], [email protected]
Received January 20, 2015; accepted February 26, 2015
Abstract: The symbiotic star V1016 Cygni, a detached binary system consisting of a hot white dwarf anda mass-losing Mira variable, shows very broad emission features at around 6825 A and 7082 A, which areRaman scattered Ovi λλ 1032, 1038 by atomic hydrogen. In the high resolution spectrum of V1016 Cygobtained with the Bohyunsan Optical Echelle Spectrograph these broad features exhibit double peakprofiles with the red peak stronger than the blue counterpart. However, their profiles differ in such a waythat the blue peak of the 7082 feature is relatively weaker than the 6825 counterpart when the two Ramanfeatures are normalized to exhibit an equal red peak strength in the Doppler factor space. Assuming thatan accretion flow around the white dwarf is responsible for the double peak profiles, we attribute thisdisparity in the profiles to the local variation of the flux ratio of Ovi λλ 1032, 1038 in the accretionflow. A Monte Carlo technique is adopted to provide emissivity maps showing the local emissivity of Oviλ1032 and Ovi λ1038 in the vicinity of the white dwarf. We also present a map indicating the differingflux ratios of Ovi λλ 1032 and 1038. Our result shows that the flux ratio reaches its maximum of 2 inthe emission region responsible for the central trough of the Raman feature and that the flux ratio in theinner red emission region is almost 1. The blue emission region and the outer red emission region exhibitan intermediate ratio around 1.5. We conclude that the disparity in the profiles of the two Raman Ovifeatures strongly implies accretion flow around the white dwarf, which is azimuthally asymmetric.
Key words: binaries: symbiotic — stars: individual: V1016 Cyg — scattering — accretion, accretiondisks — line: profiles
1. INTRODUCTION
Active binary systems containing a white dwarf are im-portant as potential progenitors of Type Ia supernovae,which were essential in establishing the standard pic-ture of the universe dominated by dark energy (e.g.,Iben & Tutukov 1984; Perlmutter et al. 1998). De-pending on the nature of the companion, active whitedwarf binary systems can be divided into cataclysmicvariables and symbiotic stars. Cataclysmic variablesare binary systems of a white dwarf with a late typemain sequence star that fills the Roche lobe. Promi-nent activities exhibited by cataclysmic variables areattributed to the presence of an accretion disk aroundthe white dwarf that results from the Roche lobe over-flow from the companion (e.g., Warner 1995).Symbiotic stars are binary systems of a white dwarf
and a mass losing giant which does not fill the Rochelobe (Mikolajewska 2012). The spectra of symbioticstars are characterized by the existence of TiO absorp-tion bands indicative of a cool star and prominent emis-sion lines including high ionization species such as Oviand Nevii. Considering the size of the giant compan-ion, the orbital period usually exceeds several hundreddays and sometimes several decades. They are classifiedinto ‘S’ type and ‘D’ type, where ‘D’ type symbioticsexhibit an IR excess that indicates the presence of a
Corresponding author: H.-W. Lee
warm dust component with a temperature T ∼ 1000 K(Angeloni et al. 2010). In contrast, the IR excess isabsent in the spectral energy distribution of ‘S’ typesymbiotics.
One distinguishing aspect of the symbiotic spectrais the existence of broad emission features at around6825 A and 7082 A, whose existence is quite exclusiveto symbiotic stars with an exception of a young plan-etary nebula (e.g., Allen 1980). These features wereidentified by Schmid (1989), who proposed that theyare formed through Raman scattering of Ovi λλ 1032,1038 by atomic hydrogen. When an Ovi λ 1032 linephoton is incident upon a hydrogen atom in the groundstate, an optical photon at around 6825 A is re-emittedas the hydrogen atom de-excites to the excited 2s state.In a similar way, an optical photon at around 7082 A re-sults from the inelastic scattering process for an Ovi λ1038 photon. The cross sections and branching ratiosfor Raman scattering can be computed in a straight-forward manner using the Kramers-Heisenberg formula(e.g., Schmid 1989; Bach & Lee 2014).
Raman Ovi features in symbiotic stars are known toexhibit complicated profiles including double-peak pro-files and triple-peak profiles (e.g., Harries & Howarth1997). In particular, a number of symbiotic stars clas-sified as symbiotic novae including V1016 Cyg, HM Sgeand RR Tel exhibit double-peak profiles clearly with thered peak stronger than the blue counterpart.
105
106 Heo & Lee
One possible explanation for the double peaked struc-ture is that the scattering occurs in two distinct regionsone of which approaches the emission nebula while theother recedes from it. This scenario was first advocatedby Schmid (1996), who performed Monte Carlo simula-tions to investigate basic properties of Raman scatteredOvi features. In his model, the red asymmetry arieswhen the receding region of neutral hydrogen is largerin extent than the approaching region.Another possibility is that some part of the emis-
sion nebula approaches the neutral scattering regionwhereas the remaining part recedes from the H i region.In this picture, the emission region is identified with theaccretion flow around the white dwarf. Based on thisaccretion flow model, Lee & Kang (2007) successfullyfitted the profile of the Raman Ovi 6825 feature. Inthe current work, in order to investigate further the ac-cretion flow model, we turn our attention to the weakerRaman 7082 feature.Even though Ovi λλ 1032, 1038 are formed in the
same region, their flux ratio is observed to vary from2 to 1. If the emission nebula is sufficiently opticallythin, then their flux ratio will be exactly 2, because thestatistical weight for the j = 3/2 → j = 1/2 transitionis twice that for the j = 1/2 → j = 1/2 transition. Thisratio will approach 1 in the infinite optical depth limitwhere the thermal spectrum is attained (e.g., Kang &Lee 2008). Various flux ratios of resonance doubletsNv λλ1239, 1243 and C iv λλ1548, 1551 have been re-ported for the symbiotic star CI Cyg by Mikolajewskaet al. (2006). A similar behavior in another resonancedoublet C iv λλ 1548, 1551 was found by Feibelman(1983), who investigated the spectra of a dozen plane-tary nebulae obtained with the International UltravioletExplorer (IUE).In this regard, an interesting phenomenon has been
noted that the profile of the double-peaked Raman 7082feature is systematically different from that of the Ra-man 6825 feature. That is, the blue peak is relativelymore suppressed in the Raman 7082 feature than inthe Raman 6825 feature. This kind of systematic pro-file difference was pointed out by Schmid et al. (1999),who attributed it to the TiO absorption bands. How-ever, in this work we adopt the view that the flux ratioof Ovi λ 1032 and Ovi λ 1038 differs locally in theOvi emission region. In the accretion flow scenario wemay explain this phenomenon by assuming that the fluxratio in the blue emission region is larger than in thered emission region. This in turn implies that the redemission region is more optically thick than the blueemission region.If the emission region is effectively monochromatic
and the Doppler factors are attributed to the bulk mo-tion of the neutral scattering region, then we expectthat the two Raman scattered Ovi features exhibit al-most the same profiles differing only in total fluxes.Therefore, a quantitative comparison of the line profileswill shed much light on the mass transfer processes insymbiotic stars.In this paper, we present our quantitative compari-
0
0.2
0.4
0.6
0.8
1
1.2
6810 6820 6830 6840 6850
Rel
ativ
e F
lux
λ[Å]
2005 Nov 7
0
0.1
0.2
0.3
7060 7070 7080 7090 7100 7110
Rel
ativ
e F
lux
λ[Å]
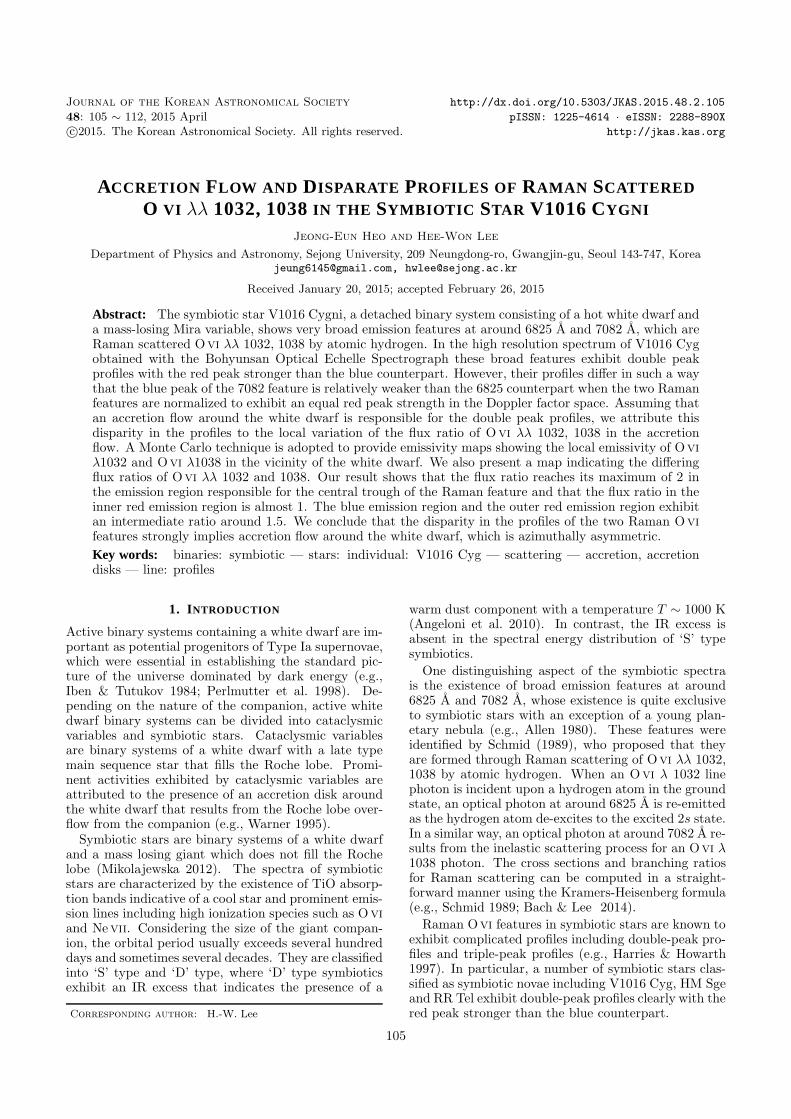
Figure 1. Parts of the BOES spectrum of the symbiotic starV1016 Cyg obtained in 2005. The upper panel shows theRaman 6825 feature and the lower panel shows the Raman7082 feature. Note that the vertical scale of the lower panelis reduced by a factor of 4 compared to that of the upperpanel in order to make the red peak of the Raman 7082feature appear similar to that of the Raman 6825 feature.
son analysis of the two Raman scattered Ovi profilesin the symbiotic nova V1016 Cyg. Adopting the accre-tion flow model, we construct emissivity maps and Ovioptical depth distribution in the accretion flow aroundthe white dwarf.
2. OBSERVATION
2.1. High Resolution Spectroscopy of V1016 Cyg
V1016 Cyg is a D-type symbiotic nova that eruptedwith a magnitude change ∆m ∼ 5 − 7 mag in 1964,which is thought to occur from the thermonuclear run-away process on the surface of the white dwarf compo-nent as it accreted material from the Mira component(e.g., McCusky 1965; Mikolajewska & Kenyon 1992).Little is known about the fundamental parameters ofV1016 Cyg including the mass, distance and orbital pe-riod (e.g., Whitelock 1987). The distance to V1016 Cygis quite uncertain with the estimates ranging from lessthan 1 kpc to 10 kpc (e.g., Ivision et al. 1991; Loren-zetti et al. 1985; Watson et al. 2000). Brocksopp et al.(2002) presented their Hubble Space Telescope (HST)image of V1016 Cyg to propose that the projected bi-nary separation of 84±2 AU assuming the distance of2 kpc. Schmid & Schild (2002) suggested an orbitalperiod longer than a century from their monitoring ofthe position angle of the linear polarization of the Ra-man Ovi 6825 feature. A photometric variation witha period of 15 years was proposed by Parimucha et al.(2003), who attributed the activity to the orbital mo-tion.We obtained a high resolution spectrum of
V1016 Cyg on the night of 2005 November 7 usingthe Bohyunsan Optical Echelle Spectrograph (BOES),which is an optical fiber fed system installed on the1.8 m telescope at the Bohyunsan Optical Observatory.The spectral coverage of the BOES is from 3800 A to
Disparate Profiles of Raman Scattered O vi λλ 1032, 1038 in V1016 Cyg 107
10500 A, which can be obtained with one single expo-sure. The optical fiber with a diameter of 300µm wasused to yield a spectroscopic resolution ∼ 30, 000 andthe exposure time was 7000 seconds. Use was madeof the ‘IRAF’ and a standard procedure was followedto reduce the data. Figure 1 shows two parts of thespectrum that contain Raman scattered Ovi features,where the 6825 feature is shown in the upper panel andthe 7082 feature is found in the lower panel.In particular, Lee & Kang (2007) used the part of the
spectrum shown in the upper panel for their profile fit-ting analysis. The 7082 feature is much weaker than the6825 feature, which is attributed to the smaller scatter-ing cross section for Ovi λ 1038 than Ovi λ 1032 bya factor ∼ 5 (e.g., Allen 1980; Nussbaumer et al. 1989;Schmid 1989). In this work, we focus on the differingline profiles of these two Raman features. It is quite no-ticeable that the 7082 feature exhibits relatively moresuppressed blue peak than the 6825 feature does.
2.2. Profile Analysis
When a far ultraviolet photon with frequency νi moreenergetic than Lyα is incident on a hydrogen atom inthe ground state and subsequently scattered leaving thehydrogen atom in the 2s state, then the frequency νoof the scattered photon is determined by the relation ofenergy conservation
νo = νi − νLyα, (1)
where νLyα is the frequency of Lyα.The adopted values of line center wavelengths of the
far UV Ovi resonance doublet are
λ1 = 1031.912 A, λ2 = 1037.613 A, (2)
respectively, with the Lyα line center wavelength ofλLyα = 1215.670A.The broad profiles that characterize Raman scattered
features are also a direct consequence of energy conser-vation. This can be seen by observing the relation
∆νoνo
=∆νiνo
=
(
νiνo
)
∆νiνi
, (3)
which leads to a broader profile by a factor νi/νo. In thecase of Raman Ovi, this factor amounts to around 7,leading to significantly broadened profiles. The profilebroadening results in another important property thatthe profile of a Raman scattered feature is determinedmainly by the relative motion between the scatterer andthe emitter and mostly independent of the observer’sline of sight.To be more specific, we let vs and ve be the veloc-
ities of the scatterer and the emitter in the observersrest frame, respectively. We also let ki and kf be theunit wavevector of the incident Ovi line photon withwavelength λi and the Raman scattered optical photonwith wavelength λo, respectively. Then the observedwavelength λobs is
∆λo
λo=
λo
λi
ki · (vs − ve)
c−
kf · vs
c(4)
0
0.2
0.4
0.6
0.8
1
1.2
−60 −40 −20 0 20 40 60 80
6825
0
0.2
0.4
0.6
0.8
1
1.2
−60 −40 −20 0 20 40 60 80
Rel
ativ
e F
lux
∆v[km/s]
7082
1
2
Flu
x R
atio
1
2
Flu
x R
atio
1
2
Flu
x R
atio
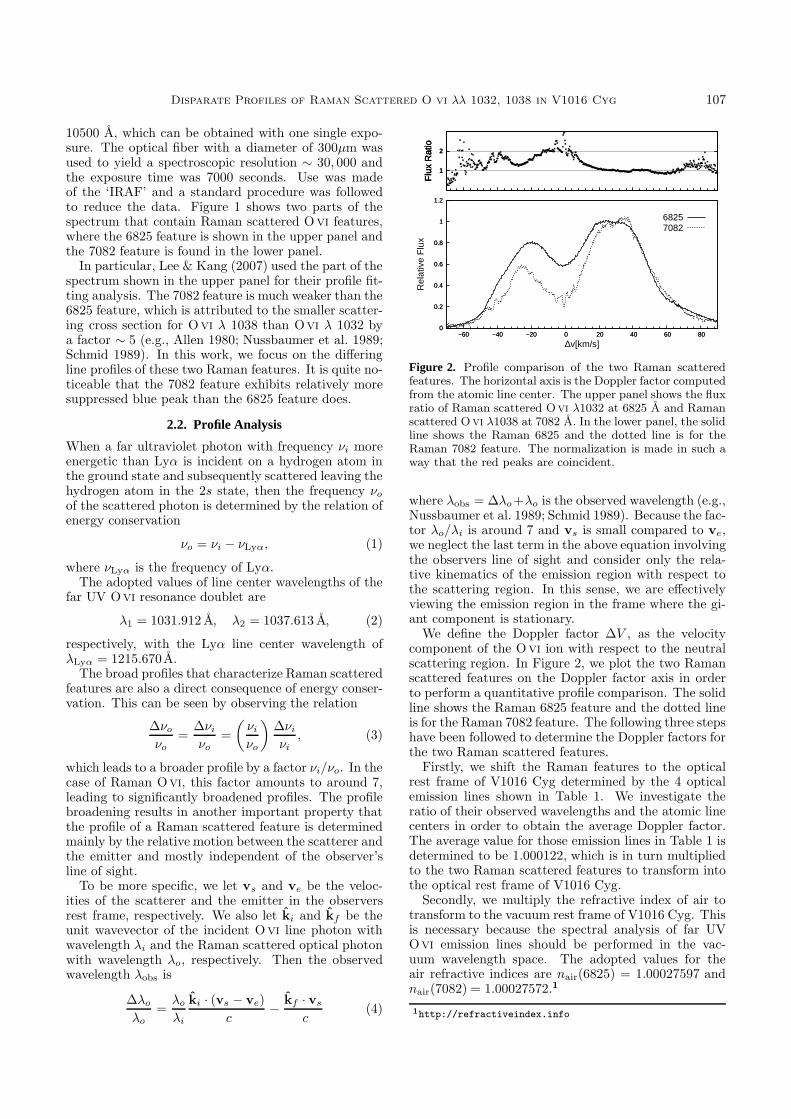
Figure 2. Profile comparison of the two Raman scatteredfeatures. The horizontal axis is the Doppler factor computedfrom the atomic line center. The upper panel shows the fluxratio of Raman scattered Ovi λ1032 at 6825 A and Ramanscattered Ovi λ1038 at 7082 A. In the lower panel, the solidline shows the Raman 6825 and the dotted line is for theRaman 7082 feature. The normalization is made in such away that the red peaks are coincident.
where λobs = ∆λo+λo is the observed wavelength (e.g.,Nussbaumer et al. 1989; Schmid 1989). Because the fac-tor λo/λi is around 7 and vs is small compared to ve,we neglect the last term in the above equation involvingthe observers line of sight and consider only the rela-tive kinematics of the emission region with respect tothe scattering region. In this sense, we are effectivelyviewing the emission region in the frame where the gi-ant component is stationary.We define the Doppler factor ∆V , as the velocity
component of the Ovi ion with respect to the neutralscattering region. In Figure 2, we plot the two Ramanscattered features on the Doppler factor axis in orderto perform a quantitative profile comparison. The solidline shows the Raman 6825 feature and the dotted lineis for the Raman 7082 feature. The following three stepshave been followed to determine the Doppler factors forthe two Raman scattered features.Firstly, we shift the Raman features to the optical
rest frame of V1016 Cyg determined by the 4 opticalemission lines shown in Table 1. We investigate theratio of their observed wavelengths and the atomic linecenters in order to obtain the average Doppler factor.The average value for those emission lines in Table 1 isdetermined to be 1.000122, which is in turn multipliedto the two Raman scattered features to transform intothe optical rest frame of V1016 Cyg.Secondly, we multiply the refractive index of air to
transform to the vacuum rest frame of V1016 Cyg. Thisis necessary because the spectral analysis of far UVOvi emission lines should be performed in the vac-uum wavelength space. The adopted values for theair refractive indices are nair(6825) = 1.00027597 andnair(7082) = 1.00027572.1
1http://refractiveindex.info
108 Heo & Lee
Table 1Optical forbidden lines of V1016 Cyg to define the optical
rest frame of V1016 Cyg.
Atomic ObservedLine Line Center Wavelength Ratio
λc (A) λobs (A) λc/λobs
He i 7065 7065.195 7064.13 1.000151S ii 6730 6730.815 6730.26 1.000083N ii 6583 6583.450 6582.77 1.000103O i 6300 6300.304 6299.36 1.000150
Average 1.000122
Thirdly, we obtain the vacuum wavelength of the in-cident Ovi line radiation using Equation (1).
In Figure 2, it is notable that the center dip ap-pears at around 0 km s−1. Even though the doublepeak profiles are asymmetric, we may reasonably thinkthat the central dip with the null Doppler factor dividesthe blue and red emission parts in the spectrum. Thisalso implies that the neutral scattering region has nosystematic bulk motion with respect to the rest frameof V1016 Cyg defined by the optical emission lines. Inthis figure, the red peaks of the two Raman featureshave been normalized so that their mean strengths areequal. We then plot the ratio of the flux in the twofeatures as a function of the Doppler factor ∆V in theupper panel.
We immediately notice that the flux ratio at the cen-tral dip has the largest value of 2, which is the theoret-ical maximum ratio of Ovi λ 1032 to Ovi λ 1038. Thered and blue wing regions also exhibit the maximumflux ratio of 2 as in the central dip region. However,the weak flux of the Raman 7082 feature in the wingregions renders the flux ratio in these regions unreliable.We note that the flux ratio in the blue peak region isaround 1.5, which is clearly distinct from the red peakregion and the central dip part. With the normalizationof equal red peak strengths the flux ratio is observed torange from 1 to 2. Because this happens to be the fullrange that is theoretically allowed, we may concludethat this normalization is the unique possibility.
Figure 2 also shows that the emission region can bedivided into three parts based on the flux ratio of ap-proximately 1, 1.5 and 2, which reflects the opticalthickness of Ovi doublet lines. The part of the emissionregion with the flux ratio 1 is mainly found around thered peak, where Ovi emission is dominantly produced.The intermediate flux ratio of ∼ 1.5 is seen around theblue peak, where Ovi emission is less prominent thanthe red counterpart. The emission region with flux ra-tio near 2 corresponds to a highly extended outer regionmoving slowly or the region moving across the line con-necting the two stars. It appears that the flux ratio isanticorrelated with the flux intensity so that the fluxratio approaches 2 as the flux decreases.
<< 1, I1032 : I1038 = 2 : 1
>> 1, I1032 : I1038 = 1 : 1
τ
τ
RER
1032 1038 (Α)
1032 1038 (Α)
1032 1038 (Α)6825 7082 (Α)Raman
Scattered
BER
BER + RER
O VI Blue Emission
Region ( BER )
O VI Red Emission
Region ( RER )
Red Giant
White
Dwarf
Scattering
Region
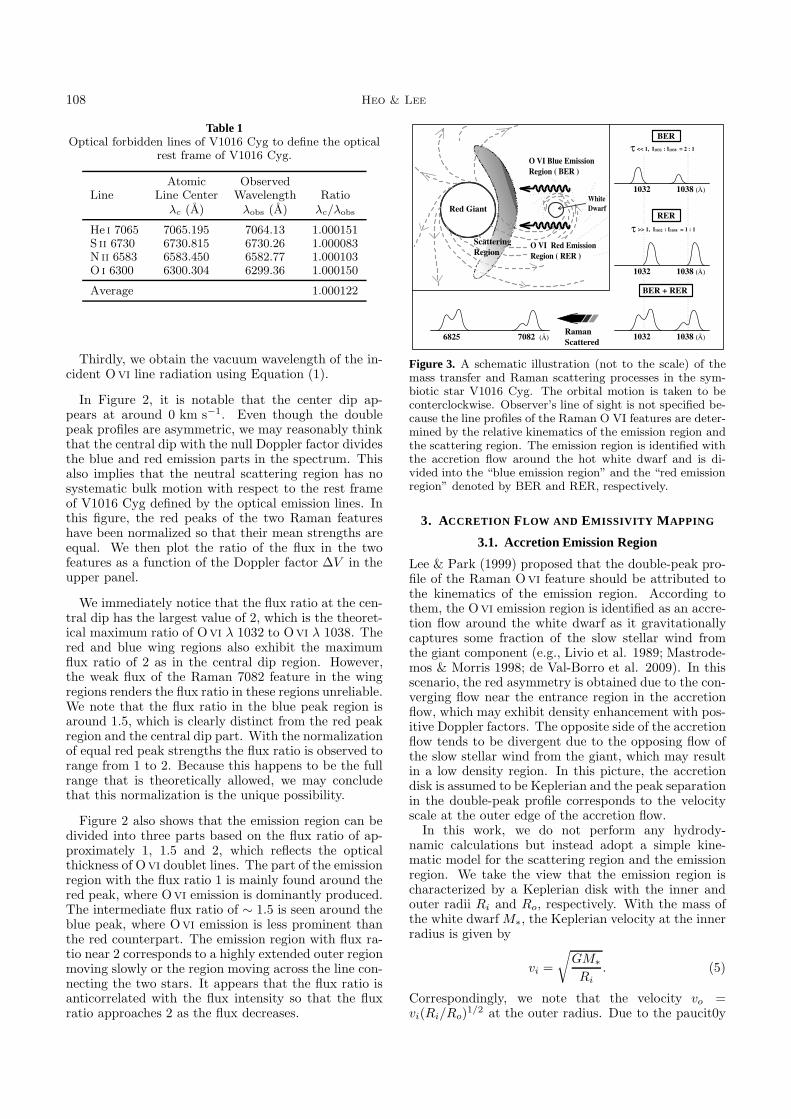
Figure 3. A schematic illustration (not to the scale) of themass transfer and Raman scattering processes in the sym-biotic star V1016 Cyg. The orbital motion is taken to beconterclockwise. Observer’s line of sight is not specified be-cause the line profiles of the Raman O VI features are deter-mined by the relative kinematics of the emission region andthe scattering region. The emission region is identified withthe accretion flow around the hot white dwarf and is di-vided into the “blue emission region” and the “red emissionregion” denoted by BER and RER, respectively.
3. ACCRETION FLOW AND EMISSIVITY M APPING
3.1. Accretion Emission Region
Lee & Park (1999) proposed that the double-peak pro-file of the Raman Ovi feature should be attributed tothe kinematics of the emission region. According tothem, the Ovi emission region is identified as an accre-tion flow around the white dwarf as it gravitationallycaptures some fraction of the slow stellar wind fromthe giant component (e.g., Livio et al. 1989; Mastrode-mos & Morris 1998; de Val-Borro et al. 2009). In thisscenario, the red asymmetry is obtained due to the con-verging flow near the entrance region in the accretionflow, which may exhibit density enhancement with pos-itive Doppler factors. The opposite side of the accretionflow tends to be divergent due to the opposing flow ofthe slow stellar wind from the giant, which may resultin a low density region. In this picture, the accretiondisk is assumed to be Keplerian and the peak separationin the double-peak profile corresponds to the velocityscale at the outer edge of the accretion flow.In this work, we do not perform any hydrody-
namic calculations but instead adopt a simple kine-matic model for the scattering region and the emissionregion. We take the view that the emission region ischaracterized by a Keplerian disk with the inner andouter radii Ri and Ro, respectively. With the mass ofthe white dwarf M∗, the Keplerian velocity at the innerradius is given by
vi =
√
GM∗
Ri. (5)
Correspondingly, we note that the velocity vo =vi(Ri/Ro)
1/2 at the outer radius. Due to the paucit0y
Disparate Profiles of Raman Scattered O vi λλ 1032, 1038 in V1016 Cyg 109
of information about the fundamental parameters ofV1016 Cyg mentioned earlier, in this work for the sakeof scaling, we setM∗ = 1 M⊙ so that the rotation speedv = 30 km s−1 at r = 1 AU.In Figure 3, we show a schematic illustration adopted
in this work for the line formation of the Raman 6825and 7082 features in V1016 Cyg. Note that the fig-ure is not to scale and that the orbital motion occurscounterclockwise. If we adopt the values presented inBrocksopp et al. (2002) the binary separation should bemuch larger than illustrated. As mentioned in the pre-vious section, the line profile analysis is independent ofthe orbital parameters and the observers line of sight,which are omitted in the figure.The accretion flow is roughly divided into the “blue
emission region (BER)” and the “red emission region(RER)”, where the BER is the part of the accretionflow approaching the neutral scattering region or ∆V <0. In the RER, the accretion flow recedes from thescattering region, or equivalently ∆V > 0.It is expected that the RER is denser than the BER,
because the accretion flow in the BER is opposed tothe slow stellar wind from the giant. The flux ratioof Ovi λ1032 to Ovi λ1038 is expected to be smallerin the RER than that in the BER, which leads to therelatively more suppressed blue peak of the Raman 7082feature than the Raman 6825 counterpart.
3.2. Emissivity Maps
Doppler tomography is a popular technique to study de-tailed structures of the accretion disk in a cataclysmicvariable (e.g., Marsh & Horne 1988). A series of highresolution spectra covering the entire orbital phase areobtained and reorganized to map the emission regionaccording to the emission profile. The emission froma specific structure such as the hot spot has a varyingDoppler factor as a function of the orbital phase. Bycorrecting the Doppler factor to a direction that is fixedin the binary system, we can make a map which indi-cates the region of the emission in the two-dimensionalvelocity space. Therefore the Doppler tomography isparticularly useful to locate the hot spot in the accre-tion disk in a cataclysmic binary system.However, the same technique is an inappropriate op-
tion in the case of V1016 Cyg with an orbital periodexceeding several decades and a long period variablecompanion. We produce the emissivity maps of the ac-cretion flow based on the profiles of Raman scatteredOvi features in the real 2-dimensional space instead ofthe 2-dimensional velocity space. An emissivity map inthis work is basically meant to be a plot of the weightassigned to a region characterized by a given Dopplerfactor, where the weight is simply proportional to theRaman flux at the Doppler factor. Figure 4 shows theemissivity map obtained from the observed Raman 6825feature. The white dwarf lies at the center of the figureand the distance unit is 1 AU.We briefly describe how the map is obtained using
the observed Raman 6825 profile. A coordinate systemis set up so that the origin coincides with the location
-3
-2
-1
0
1
2
3
-3 -2 -1 0 1 2 3
[AU
]
[AU]
Rank 5
Rank 4
Rank 3
Rank 2
Rank 1
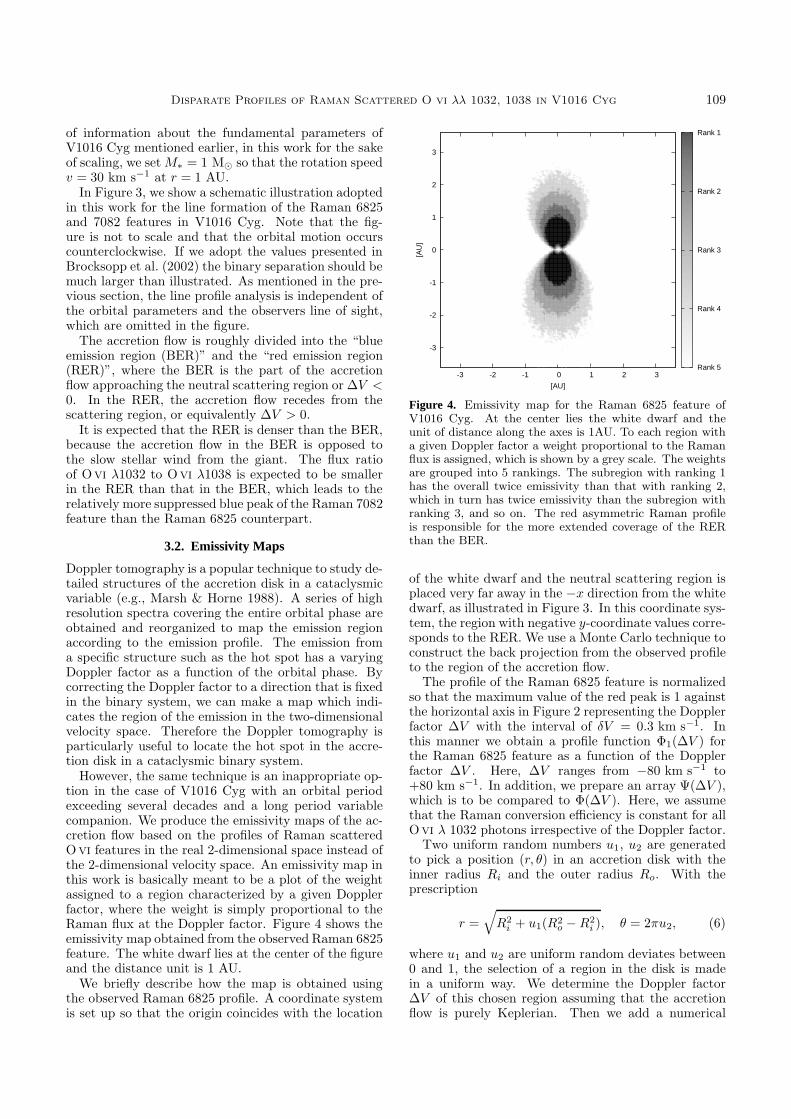
Figure 4. Emissivity map for the Raman 6825 feature ofV1016 Cyg. At the center lies the white dwarf and theunit of distance along the axes is 1AU. To each region witha given Doppler factor a weight proportional to the Ramanflux is assigned, which is shown by a grey scale. The weightsare grouped into 5 rankings. The subregion with ranking 1has the overall twice emissivity than that with ranking 2,which in turn has twice emissivity than the subregion withranking 3, and so on. The red asymmetric Raman profileis responsible for the more extended coverage of the RERthan the BER.
of the white dwarf and the neutral scattering region isplaced very far away in the −x direction from the whitedwarf, as illustrated in Figure 3. In this coordinate sys-tem, the region with negative y-coordinate values corre-sponds to the RER. We use a Monte Carlo technique toconstruct the back projection from the observed profileto the region of the accretion flow.The profile of the Raman 6825 feature is normalized
so that the maximum value of the red peak is 1 againstthe horizontal axis in Figure 2 representing the Dopplerfactor ∆V with the interval of δV = 0.3 km s−1. Inthis manner we obtain a profile function Φ1(∆V ) forthe Raman 6825 feature as a function of the Dopplerfactor ∆V . Here, ∆V ranges from −80 km s−1 to+80 km s−1. In addition, we prepare an array Ψ(∆V ),which is to be compared to Φ(∆V ). Here, we assumethat the Raman conversion efficiency is constant for allOvi λ 1032 photons irrespective of the Doppler factor.Two uniform random numbers u1, u2 are generated
to pick a position (r, θ) in an accretion disk with theinner radius Ri and the outer radius Ro. With theprescription
r =√
R2i + u1(R2
o −R2i ), θ = 2πu2, (6)
where u1 and u2 are uniform random deviates between0 and 1, the selection of a region in the disk is madein a uniform way. We determine the Doppler factor∆V of this chosen region assuming that the accretionflow is purely Keplerian. Then we add a numerical
110 Heo & Lee
-3
-2
-1
0
1
2
3
-3 -2 -1 0 1 2 3
[AU
]
[AU]
Rank 5
Rank 4
Rank 3
Rank 2
Rank 1
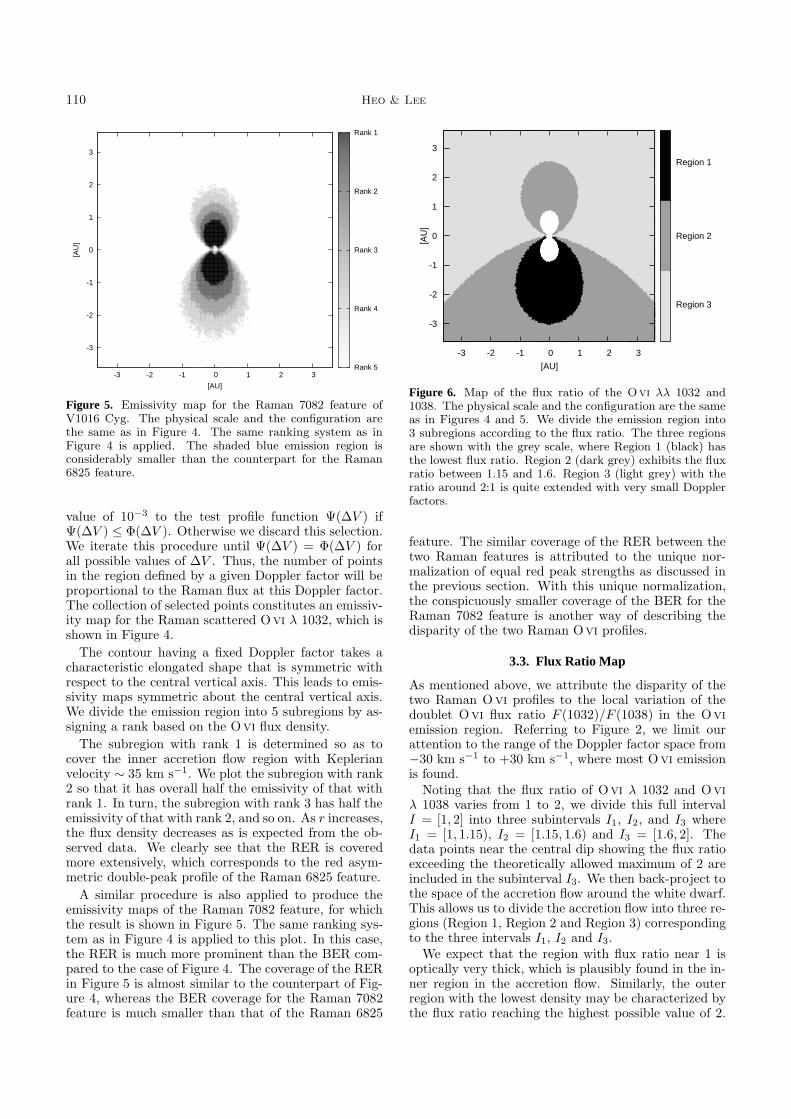
Figure 5. Emissivity map for the Raman 7082 feature ofV1016 Cyg. The physical scale and the configuration arethe same as in Figure 4. The same ranking system as inFigure 4 is applied. The shaded blue emission region isconsiderably smaller than the counterpart for the Raman6825 feature.
value of 10−3 to the test profile function Ψ(∆V ) ifΨ(∆V ) ≤ Φ(∆V ). Otherwise we discard this selection.We iterate this procedure until Ψ(∆V ) = Φ(∆V ) forall possible values of ∆V . Thus, the number of pointsin the region defined by a given Doppler factor will beproportional to the Raman flux at this Doppler factor.The collection of selected points constitutes an emissiv-ity map for the Raman scattered Ovi λ 1032, which isshown in Figure 4.
The contour having a fixed Doppler factor takes acharacteristic elongated shape that is symmetric withrespect to the central vertical axis. This leads to emis-sivity maps symmetric about the central vertical axis.We divide the emission region into 5 subregions by as-signing a rank based on the Ovi flux density.
The subregion with rank 1 is determined so as tocover the inner accretion flow region with Keplerianvelocity ∼ 35 km s−1. We plot the subregion with rank2 so that it has overall half the emissivity of that withrank 1. In turn, the subregion with rank 3 has half theemissivity of that with rank 2, and so on. As r increases,the flux density decreases as is expected from the ob-served data. We clearly see that the RER is coveredmore extensively, which corresponds to the red asym-metric double-peak profile of the Raman 6825 feature.
A similar procedure is also applied to produce theemissivity maps of the Raman 7082 feature, for whichthe result is shown in Figure 5. The same ranking sys-tem as in Figure 4 is applied to this plot. In this case,the RER is much more prominent than the BER com-pared to the case of Figure 4. The coverage of the RERin Figure 5 is almost similar to the counterpart of Fig-ure 4, whereas the BER coverage for the Raman 7082feature is much smaller than that of the Raman 6825
-3 -2 -1 0 1 2 3
[AU]
-3
-2
-1
0
1
2
3
[AU
]
Region 3
Region 2
Region 1
Figure 6. Map of the flux ratio of the Ovi λλ 1032 and1038. The physical scale and the configuration are the sameas in Figures 4 and 5. We divide the emission region into3 subregions according to the flux ratio. The three regionsare shown with the grey scale, where Region 1 (black) hasthe lowest flux ratio. Region 2 (dark grey) exhibits the fluxratio between 1.15 and 1.6. Region 3 (light grey) with theratio around 2:1 is quite extended with very small Dopplerfactors.
feature. The similar coverage of the RER between thetwo Raman features is attributed to the unique nor-malization of equal red peak strengths as discussed inthe previous section. With this unique normalization,the conspicuously smaller coverage of the BER for theRaman 7082 feature is another way of describing thedisparity of the two Raman Ovi profiles.
3.3. Flux Ratio Map
As mentioned above, we attribute the disparity of thetwo Raman Ovi profiles to the local variation of thedoublet Ovi flux ratio F (1032)/F (1038) in the Oviemission region. Referring to Figure 2, we limit ourattention to the range of the Doppler factor space from−30 km s−1 to +30 km s−1, where most Ovi emissionis found.Noting that the flux ratio of Ovi λ 1032 and Ovi
λ 1038 varies from 1 to 2, we divide this full intervalI = [1, 2] into three subintervals I1, I2, and I3 whereI1 = [1, 1.15), I2 = [1.15, 1.6) and I3 = [1.6, 2]. Thedata points near the central dip showing the flux ratioexceeding the theoretically allowed maximum of 2 areincluded in the subinterval I3. We then back-project tothe space of the accretion flow around the white dwarf.This allows us to divide the accretion flow into three re-gions (Region 1, Region 2 and Region 3) correspondingto the three intervals I1, I2 and I3.We expect that the region with flux ratio near 1 is
optically very thick, which is plausibly found in the in-ner region in the accretion flow. Similarly, the outerregion with the lowest density may be characterized bythe flux ratio reaching the highest possible value of 2.
Disparate Profiles of Raman Scattered O vi λλ 1032, 1038 in V1016 Cyg 111
In Figure 6, we present the three regions Region 1, Re-gion 2 and Region 3 around the white dwarf componentusing grey scale, where the physical scale and the con-figuration are the same as in Figures 4 and 5. The whiteregion found near the white dwarf results from the ex-clusion of the data points having the Doppler factorsoutside of [−30 km s−1,+30 km s−1].As is shown clearly in the figure, Region 1 with the
lowest flux ratio and hence regarded as being of thehighest density is found in the inner part of the RER.It is interesting to note that Region 1 does not intersectwith the BER. As is shown in Figure 2, Region 1 con-sists of those regions with the Doppler factor between+15 km s−1 and +30 km s−1. Region 3 corresponds tothe outer region with weak emission.Region 2 shaded by dark grey is found mostly in the
outer region of Region 1 and is also found in the innerregion of the BER. As is illustrated in Figure 2, Region2 is found mainly in the region with the Doppler factornear −25 km s−1 and in the region with the Dopplerfactor ∼ +15 km s−1.
4. SUMMARY AND DISCUSSION
In this work, we have performed a quantitative com-parison of the line profiles of the two Raman scatteredfeatures at 6825 A and 7082 A from the high resolu-tion spectrum of the symbiotic star V1016 Cyg obtainedwith the BOES in 2005. We attribute the disparity inthe profiles to the local variation of the flux ratio ofOvi λ 1032 and Ovi λ 1038 in the Ovi emission re-gion that is regarded as the accretion flow around thewhite dwarf. The profile comparison is made by trans-forming the two observed optical features first to thevacuum optical rest frame and then to the vacuum UVrest frame of Ovi λλ 1032 and 1038, where the Dopplerfactors with respect to the neutral scattering region aredetermined. With the constraint that the flux ratio ofOvi λ 1032 and Ovi λ 1038 varies between 1 and 2, aunique normalization is obtained where the red peaks ofthe two Raman features coincide in the Doppler factorspace as shown in Figure 2. We provide the emissiv-ity maps that assign to each region with a specifiedDoppler factor a weight that is proportional to the Ra-man flux. These maps are another way of presentingthe red asymmetry of the Raman profiles. A map of theflux ratio is also produced in order to infer the matterdistribution in the accretion flow. The inner part ofthe red emission region in the accretion flow shows theflux ratio of ∼ 1, which implies that Ovi emission isoptically very thick. The region with the lowest op-tical depth is quite extended to the outer region withnegligible Doppler factors.It appears that other Raman features of He ii and
Nevii exhibit broad single peak profile even thoughthey are usually very weak (e.g., Lee 2012; Lee, Heo& Lee 2014; Birriel 2004). If this is the case, it is un-clear why the profiles of these Raman features differsystematically from those of Raman Ovi features. Therelative weakness of Raman He ii and Nevii featurescompared with Raman Ovi features strongly implies
that He ii and Nevii emission regions are much lessdense than Ovi emission region in the accretion flow.This is further supported because He ii and Nevii havelarger scattering cross section than Ovi resonance(e.g.,van Groningen 1993; Nussbaumer et al. 1989; Lee et al.2014) emissivity scaling with the density squared, wemay expect that He ii and Nevii emission are producedin a small region of exceptionally enhanced density hav-ing a very narrow range of Doppler factors. In this casethe resulting Raman profile will be single-peaked withthe peak located at the Doppler factor of the He ii andNevii emission spot.Spectropolarimetry of Raman Ovi 6825 and 7082
provided by Harries & Howarth (1997) shows that theextreme red wing part of the Raman Ovi 6825 and 7082features is polarized with the position angle that differsby 90 degrees from that of the main part of the features(see also Schild & Schmid 1996). This is very interest-ing in view of the bipolar morphology of the emissionnebula (Solf 1983; Brocksopp et al. 2002; Lee & Park1999). In our model, the polarization flip in the extremered part implies the existence of an additional neutralscattering region that recedes from the Ovi emissionregion in the direction normal to the orbital plane. Inthis case the additional scattering region may be neutralclumps that may have formed through Rayleigh-Taylorinstability in the bipolar regions. Another possibility isthat instead of assuming an additional scattering regionwe can place an additional emission region that recedesfrom the giant in the direction perpendicular to the or-bital plane. This emission flow may be identified withthe collimated bipolar outflow.Due to the weakness of the Raman 7082 feature com-
pared to the Raman 6825 feature, it requires a goodamount of telescope time to secure spectra with highsignal to noise ratio and sufficient spectral resolution.However, considering the disparity in the profiles canbe an important probe of the accretion flow around thewhite dwarf, we expect that high quality spectroscopicdata in other symbiotic systems will reveal much in-formation on the mass transfer processes in symbioticstars.
ACKNOWLEDGMENTS
We are grateful to the anonymous referee for very usefulcomments that improved the presentation of the paper.We thank the staff of the Bohyunsan Optical Observa-tory for their help in obtaining the high resolution spec-tra of V1016 Cyg. This research was supported by theBasic Science Research Program through the NationalResearch Foundation (NRF-2014R1A1A2054887).
REFERENCES
Allen, D. A. 1980, Candidate Symbiotic Stars in the LargeMagellanic Cloud, ApJ, 20, 131
Angeloni, R., Contini, M., Ciroi, S., & Rafanelli, P. 2010,The Spectral Energy Distribution of D-Type SymbioticStars: the Role of Dust Shell, MNRAS, 402, 2075
Bach, K., & Lee, H.-W. 2014, The Kramers-Heisenberg For-mula and the Gunn-Peterson Trough, JKAS, 47, 187
112 Heo & Lee
Birriel, J. 2004, Raman-Scattered He ii at 4851 A in theSymbiotic Stars HM Sagittae and V1016 Cygni, ApJ, 612,1136
Brocksopp, C., Bode, M. F., Eyres, S. P. S., Crocker, M. M.,Davis, R., & Taylor, A. R. 2002, The Central Binary andSurrounding Nebular of the Symbiotic Star V1016 Cygni,ApJ, 571, 947
de Val-Borro, M., Karovska, M., & Sasselov, D. 2009, Nu-merical Simulations of Wind Accretion in Symbiotic Bi-naries, ApJ, 700, 1148
Feibelman, W. 1983, Profiles and Intensity Ratios of theC iv λ 1548, 1550 Emission Lines in Planetary Nebulae,A&A, 122, 335
Harries, T. J., & Howarth, I. D. 1997, Raman Scattering inSymbiotic Stars. II. Numerical Models, A&AS, 121, 15
Iben, I. Jr., & Tutukov, A. V. 1984, Supernovae of Type Ias End Products of the Evolution of Binaries with Com-ponents of Moderate Initial Mass (M not Greater thanabout 9 Solar Masses), ApJS, 54, 335
Ivison, R. J., Bode, M. F., Roberts, J. A., Meaburn, J.,Davis, R. J., Nelson, R. F., & Spencer, R. E. 1991,A Multi-Frequency Study of Symbiotic Stars. I - Near-simultaneous Optical and Radio Observations, MNRAS,249, 374
Kang, E.-H., & Lee, H.-W. 2008, Effects of Collisional De-Excitation on the Resonance Doublet Flux Ratios in Sym-biotic Stars and Planetary Nebulae, JKAS, 41, 49
Lee, H.-W. 2012, Raman Scattered He ii 4332 in the Sym-biotic Star V1016 Cygni, ApJ, 750, 127
Lee, H.-W., & Kang, S. 2007, Raman-scattered O VI 6825and the Accretion Disk Emission Model in the SymbioticStars V1016 Cygni and HM Sagittae, ApJ, 669, 1156
Lee, H.-W., & Park, M.-G. 1999, Toward the Evidence ofthe Accretion Disk Emission in the Symbiotic Star RRTelescopii, ApJ, 515, L89
Lee, H.-W., Heo, J.-E., & Lee, B.-C. 2014, Raman-ScatteredNe VII 973 at 4881 in the Symbiotic Star V1016 Cygni,MNRAS, 442, 1956
Livio, M., Prialnik, D., & Regev, O. 1989, Accretion ontoHot White Dwarfs in Relation to Symbiotic Novae, ApJ,341, 299
Lorenzetti, D., Saraceno, P., & Strafella, F. 1985, On theIR Variability of Symbiotic Stars - The Case of V1016Cygni, HM Sagittae and V1329 Cygni, ApJ, 298, 350
Mastrodemos, N., & Morris, M. 1998, Bipolar Preplanetary
Nebulae: Hydrodynamics of Dusty Winds in Binary Sys-tems. I. Formation of Accretion Disks, ApJ, 497, 303
Marsh, T. R., & Horne, K. 1988, Images of Accretion Discs.II - Doppler Tomography, MNRAS, 235, 269
Mikolajewska, M. 2012, Symbiotic Stars: Observations Con-front Theory, Baltic Astron., 21, 5
Mikolajewska, M., Friedjung, M., & Quiroga, C. 2006, LineFormation Regions of the UV Spectrum of CI Cygni,A&A, 460, 191
Mikolajewska, M., & Kenyon, S. 1992, On the Nova-LikeEruptions of Symbiotic Binaries, MNRAS, 256, 177
McCuskey, S. 1965, Activity in H Emission Object, IAUCirc., 1916, 0
Nussbaumer, H., Schmid, H. M., & Vogel, M. 1989, RamanScattering as a Diagnostic Possibility in Astrophysics,A&A, 211, L27
Parimucha, S., Chochol, D., Pribulla, T., Buson, L. M., &Vittone, A. A. 2003, Fifteen-Year Period of Activity inthe Symbiotic Nova V1016 Cyg, ASPC, 303, 80
Perlmutter, S., et al. 1998, Discovery of a Supernova Explo-sion at Half the Age of the Universe, Nature, 391, 51
Schild, H., & Schmid, H. M. 1996, Spectropolarimetry ofSymbiotic Stars. On the Binary Orbit and the GeometricStructure of V1016 Cygni, A&A, 310, 211
Schmid, H. M. 1989, Identification of the Emission Bandsat 6830, 7088 A A&A, 211, L31
Schmid, H. M. 1996, Simulations of the Raman-ScatteredOVI Emission Lines in Symbiotic Stars, MNRAS, 282,511
Schmid, H. M., & Schild, H. 2002, Orbital Motion in Sym-biotic Mira Systems, A&A, 395, 117
Schmid, H. M., et al. 1999, ORFEUS Spectroscopy of theO BT VI Lines in Symbiotic Stars and the Raman Scat-tering Process, A&A, 348, 950
Solf, J. 1983, Optical Confirmation of a Very Compact Bipo-lar Nebula Associated with the Symbiotic Star V1016Cygni, ApJ, 266, L113
van Groningen, E. 1993, Further Evidence for Raman Scat-tering in Rr-Telescopii, MNRAS, 264, 975
Warner, B. 1995, Cataclysmic Variable Stars (Cambridge:Cambridge University Press)
Watson, S. K., Eyres, S. P. S., Davis, R. J., Bode, M. F.,Richards, A. M. S., & Kenny, H. T. 2000, Colliding Windsin V1016 Cygni, MNRAS, 311, 449
Whitelock, P. 1987, Symbiotic Miras, PASP, 99, 573