Magnetic field amplification and particle acceleration in ...

September 2009
Environmental Technology Verification Report ABRAXIS 17β-ESTRADIOL (E2) MAGNETIC PARTICLE ENZYME-LINKED IMMUNOSORBENT ASSAY (ELISA) TEST KITS
Prepared by Battelle
Under a cooperative agreement with
U.S. Environmental Protection Agency


September 2009
Environmental Technology Verification
Report
ETV Advanced Monitoring Systems Center
ABRAXIS 17β-ESTRADIOL (E2) MAGNETIC PARTICLE ENZYME-LINKED IMMUNOSORBENT ASSAY
(ELISA) TEST KITS
By
Stephanie Buehler, Zachary Willenberg, Amy Dindal, Battelle
Eric Kleiner, Michelle Henderson, and John McKernan, U.S. EPA
ii
Notice
The U.S. Environmental Protection Agency, through its Office of Research and Development, funded and managed, or partially funded and collaborated in, the research described herein. It has been subjected to the Agency’s peer and administrative review and has been approved for publication. Any opinions expressed in this report are those of the author (s) and do not necessarily reflect the views of the Agency, therefore, no official endorsement should be inferred. Any mention of trade names or commercial products does not constitute endorsement or recommendation for use.
iii
Foreword
The EPA is charged by Congress with protecting the nation’s air, water, and land resources. Under a mandate of national environmental laws, the Agency strives to formulate and implement actions leading to a compatible balance between human activities and the ability of natural systems to support and nurture life. To meet this mandate, the EPA’s Office of Research and Development provides data and science support that can be used to solve environmental problems and to build the scientific knowledge base needed to manage our ecological resources wisely, to understand how pollutants affect our health, and to prevent or reduce environmental risks. The Environmental Technology Verification (ETV) Program has been established by the EPA to verify the performance characteristics of innovative environmental technology across all media and to report this objective information to permitters, buyers, and users of the technology, thus substantially accelerating the entrance of new environmental technologies into the marketplace. Verification organizations oversee and report verification activities based on testing and quality assurance protocols developed with input from major stakeholders and customer groups associated with the technology area. ETV consists of six environmental technology centers. Information about each of these centers can be found on the Internet at http://www.epa.gov/etv/. Effective verifications of monitoring technologies are needed to assess environmental quality and to supply cost and performance data to select the most appropriate technology for that assessment. Under a cooperative agreement, Battelle has received EPA funding to plan, coordinate, and conduct such verification tests for “Advanced Monitoring Systems for Air, Water, and Soil” and report the results to the community at large. Information concerning this specific environmental technology area can be found on the Internet at http://www.epa.gov/etv/centers/center1.html.
iv
Acknowledgments
The authors wish to acknowledge the support of all those who helped plan and conduct the verification test, analyze the data, and prepare this report. We sincerely appreciate the involvement and support of all staff from the participating laboratories who conducted testing as part of this verification test. In particular, we would like to thank the following staff for their contribution in conducting this verification at their respective laboratories: Mark Mills and Scott Jacobs, U.S. EPA NRMRL, Cincinnati, OH; Jennifer Gundersen, Dave Russell, Ronald Landy, Annie Hilliard, John Curry, and Martin Lazarus, U.S. EPA Region 3 Fort Meade, MD; Dennis Wesolowski, Larry Zintek, and Charles Steiner, U.S. EPA Region 5 Chicago, IL; Mike Meyer, Keith Loftin, Larry Barber, and James Gray, USGS, Kansas; Jim Lazorchak, Tirumuru Reddy, and Dan Bender, U.S. EPA NERL, Cincinnati, OH; and Jeanette Van Emon, U.S. EPA NERL Las Vegas, NV. Finally, we would like to thank Lisa Olsen, USGS; Paul Pennington, NOAA, and Marion Kelly, U.S. EPA, for their review of this verification report.
v
Contents
Notice .............................................................................................................................................. ii
Page
Foreword ........................................................................................................................................ iii
Acknowledgments.......................................................................................................................... iv
List of Abbreviations .................................................................................................................... vii
Chapter 1 Background ................................................................................................................... 1
Chapter 2 Technology Description ................................................................................................ 2
Chapter 3 Test Design and Procedures .......................................................................................... 4 3.1 Introduction ...........................................................................................................................4 3.2 Test Facilities ........................................................................................................................5 3.3 Test Procedures .....................................................................................................................6
3.3.1 Test Sample Collection and Preparation ............................................................. 7 3.3.2 Test Sample Analysis Procedure ........................................................................ 8
Chapter 4 Quality Assurance/Quality Control ............................................................................. 10 4.1 Quality Control Samples ...............................................................................................10
4.1.1 GC-MS Method Blank and Surrogate Spike Results .............................................. 10 4.1.2 Test Kit Method Blanks .......................................................................................... 11
4.2 Audits ..................................................................................................................................11 4.2.1 Performance Evaluation Audit ................................................................................ 11 4.2.2 Technical Systems Audit ........................................................................................ 12 4.2.3 Data Quality Audit .................................................................................................. 13
4.3 QA/QC Reporting ...............................................................................................................13 4.4 Data Review ........................................................................................................................13
Chapter 5 Statistical Methods ...................................................................................................... 15 5.1 Precision ..............................................................................................................................15 5.2 Percent Bias ........................................................................................................................16 5.3 Matrix Effects .....................................................................................................................16 5.4 Operational Factors .............................................................................................................17
Chapter 6 Test Results ................................................................................................................. 18 6.1 Precision ..............................................................................................................................18 6.2 Percent Bias ........................................................................................................................20 6.4 Matrix Effects .....................................................................................................................21 6.5 Operational Factors .............................................................................................................23
Chapter 7 Performance Summary ................................................................................................ 24
Chapter 8 References ................................................................................................................... 26
vi
Figures
Figure 2-1. Abraxis 17β-Estradiol (E2) magnetic particle ELISA Test Kit ..................................2
Tables
Table 3-1. Target Analyte .............................................................................................................. 5
Table 3-2. ELISA Test Kit Evaluation Responsibilities for Each Participating Laboratory ......... 5
Table 4-1. PE Audit Sample Results ............................................................................................ 12
Table 4-2. Summary of Data Recording Process ......................................................................... 14
Table 6-1. ELISA Test Kit Average Concentration and Relative Standard Deviation (RSD) Results ........................................................................................................................................... 19
Table 6-2. Expected Concentrations for each Phase .................................................................... 19
Table 6-3. ELISA Test Kit Percent Bias vs. GC-MS .................................................................. 20
Table 6-4. GC-MS Average Concentration, RSD, and Percent Bias Results .............................. 21
Table 6-4. ELISA Test Kit Percent Bias vs. Expected Spike Concentration .............................. 21
Table 6-5. Percent Recovery ........................................................................................................ 22
Table 6-6. Concentrations of Cross-Reactive Compounds .......................................................... 23
vii
List of Abbreviations
AMS Advanced Monitoring Systems °C degrees Celsius COC chain of custody DI deionized DIR direct E1 estrone E2 17-β-estradiol E3 estriol EDC endocrine-disrupting compound EE2 17-α-ethynylestradiol ELISA enzyme-linked immunosorbent assay EPA U.S. Environmental Protection Agency ETV Environmental Technology Verification GC-MS gas chromatography–mass spectrometry GFF glass fiber filter HPLC high performance liquid chromatography L liter LC-MS liquid chromatography–mass spectrometry MB method blank MDL method detection limit µL microliter µm micron NERL EPA ORD National Exposure Research Laboratory ng nanogram nm nanometer NP nonylphenol NRMRL EPA ORD National Risk Management Research Laboratory ORD EPA Office of Research and Development PE performance evaluation ppt QA
parts per trillion quality assurance
QC quality control QMP quality management plan rpm revolutions per minute RSD relative standard deviation
viii
S standard deviation SOP standard operating procedure SPE solid phase extraction TSA technical systems audit USGS United States Geological Survey WWTP wastewater treatment plant
1
Chapter 1 Background
The U.S. Environmental Protection Agency (EPA) supports the Environmental Technology Verification Program (ETV) to facilitate the deployment of innovative environmental technologies through performance verification and dissemination of information. The goal of the ETV Program is to further environmental protection by accelerating the acceptance and use of improved and cost-effective technologies. ETV seeks to achieve this goal by providing high-quality, peer-reviewed data on technology performance to those involved in the design, distribution, financing, permitting, purchase, and use of environmental technologies. ETV works in partnership with recognized testing organizations; with stakeholder groups consisting of buyers, vendor organizations, and permitters; and with the full participation of individual technology developers. The Program evaluates the performance of innovative technologies by developing test plans that are responsive to the needs of stakeholders, conducting field or laboratory tests (as appropriate), collecting and analyzing data, and preparing peer-reviewed reports. All evaluations are conducted in accordance with rigorous quality assurance (QA) protocols to ensure that data of known and adequate quality are generated and that the results are defensible. The EPA’s National Risk Management Research Laboratory (NRMRL) and its verification organization partner, Battelle, operate the Advanced Monitoring Systems (AMS) Center under ETV. The AMS Center recently evaluated the performance of the Abraxis 17β-estradiol (E2) magnetic particle enzyme-linked immunosorbent assay (ELISA) test kit for determining endocrine-disrupting compounds (EDCs) in water.
2
Chapter 2 Technology Description
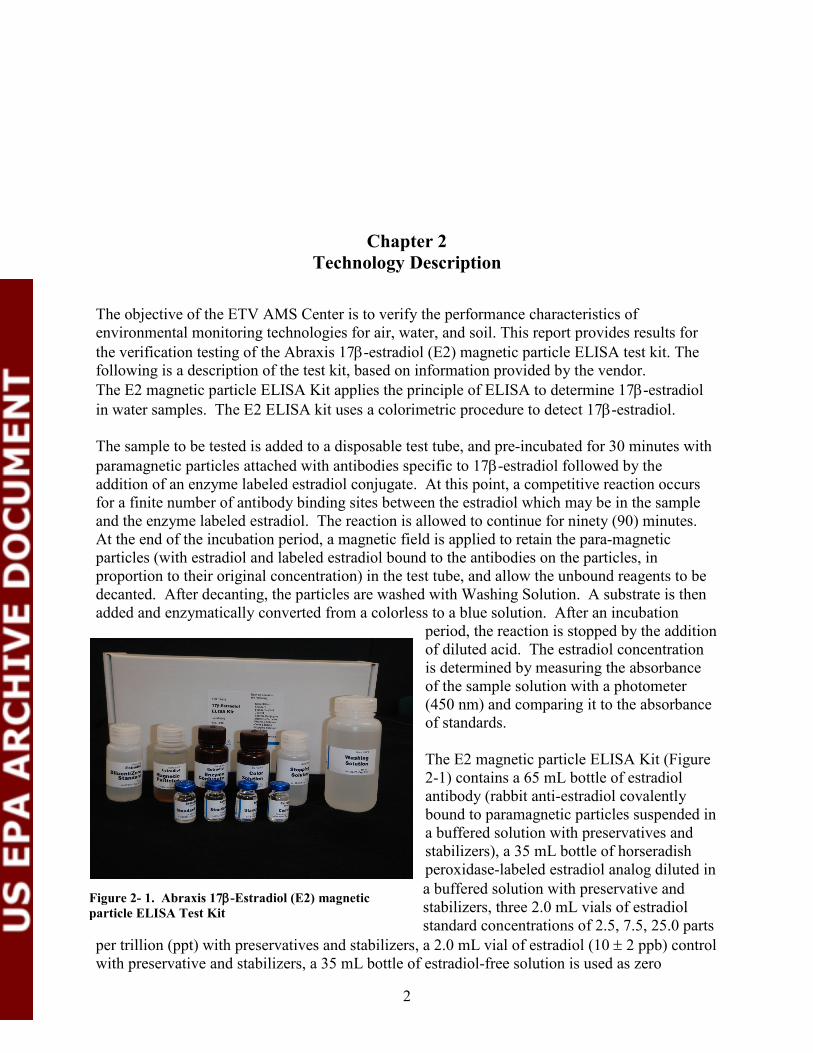
The objective of the ETV AMS Center is to verify the performance characteristics of environmental monitoring technologies for air, water, and soil. This report provides results for the verification testing of the Abraxis 17β-estradiol (E2) magnetic particle ELISA test kit. The following is a description of the test kit, based on information provided by the vendor. The E2 magnetic particle ELISA Kit applies the principle of ELISA to determine 17β-estradiol in water samples. The E2 ELISA kit uses a colorimetric procedure to detect 17β-estradiol. The sample to be tested is added to a disposable test tube, and pre-incubated for 30 minutes with paramagnetic particles attached with antibodies specific to 17β-estradiol followed by the addition of an enzyme labeled estradiol conjugate. At this point, a competitive reaction occurs for a finite number of antibody binding sites between the estradiol which may be in the sample and the enzyme labeled estradiol. The reaction is allowed to continue for ninety (90) minutes. At the end of the incubation period, a magnetic field is applied to retain the para-magnetic particles (with estradiol and labeled estradiol bound to the antibodies on the particles, in proportion to their original concentration) in the test tube, and allow the unbound reagents to be decanted. After decanting, the particles are washed with Washing Solution. A substrate is then added and enzymatically converted from a colorless to a blue solution. After an incubation
period, the reaction is stopped by the addition of diluted acid. The estradiol concentration is determined by measuring the absorbance of the sample solution with a photometer (450 nm) and comparing it to the absorbance of standards. The E2 magnetic particle ELISA Kit (Figure 2-1) contains a 65 mL bottle of estradiol antibody (rabbit anti-estradiol covalently bound to paramagnetic particles suspended in a buffered solution with preservatives and stabilizers), a 35 mL bottle of horseradish peroxidase-labeled estradiol analog diluted in a buffered solution with preservative and stabilizers, three 2.0 mL vials of estradiol standard concentrations of 2.5, 7.5, 25.0 parts
per trillion (ppt) with preservatives and stabilizers, a 2.0 mL vial of estradiol (10 ± 2 ppb) control with preservative and stabilizers, a 35 mL bottle of estradiol-free solution is used as zero
Figure 2- 1. Abraxis 17β-Estradiol (E2) magnetic particle ELISA Test Kit

3
standard, a 65 mL bottle of hydrogen peroxide and 3,3′,5,5′-tetramethylbenzidine solution in an organic base, a 60 mL bottle of diluted acid, a 250 mL bottle of preserved deionized water, and 3 boxes of 33 polystyrene tubes. The E2 magnetic particle ELISA Kit measures 14 by 6 ¼ by 3 ½ inches. Final results and calibration curves are printed from the photometric analyzer or sent directly to a laboratory computer. List price is $350 for a 100-test kit. Other materials that are required but are not provided with the E2 magnetic particle ELISA Kit are pipettes (including a repeating pipette for the addition of reagents), a vortex mixer, a magnetic separation system, and a photometer capable of reading at 450 nanometer (nm). These materials can be purchased separately or rented.
4
Chapter 3 Test Design and Procedures
3.1 Introduction
This verification test was conducted according to procedures specified in the Test/QA Plan for Verification of Enzyme-Linked Immunosorbent Assay (ELISA) Test Kits for the Quantitative Determination of Endocrine Disrupting Compounds (EDCs) in Aqueous Phase Samples.1 Deviations to the test/QA plan were made due to unanticipated circumstances. As such, the test procedures described in this chapter are a complete description of the actual test conditions. Because of their potential to interfere with human, domestic animal, and wildlife reproduction, EDCs are of increasing concern throughout the country. Several EPA Regions have undertaken activities to monitor for these compounds, and several states are considering including monitoring for EDCs in their regulatory programs. Presently, gas chromatography–mass spectrometry (GC-MS), high performance liquid chromatography (HPLC), and liquid chromatography–mass spectrometry (LC-MS) are being used for detecting these compounds. However, immunoassay techniques, particularly ELISA, are becoming increasingly popular in the field of environmental analysis due to their high sensitivity, ease of use, short analysis time, and cost-effectiveness. Immunoassay analytical detection is based on the capability of antibodies to specifically recognize and form stable complexes with antigens. Immunoassays employ antibodies as analytical reagents. In ELISA test kits, an enzyme conjugate competes with the chemical in the sample for a limited number of binding sites on the antibody coated plate or particles. The extent of color development is inversely proportional to the amount of chemical in the sample or standard. The higher the concentration of a specific steroid or other EDC in the sample, the less color reaction produced and recorded using a plate reader or tube photometer. Testing was conducted with multiple collaborating laboratories, specifically the EPA Office of Research and Development (ORD) NRMRL, EPA Region 3, and the United States Geological Survey (USGS) Organic Geochemistry Research Laboratory in Kansas. The laboratory participation was coordinated by EPA NRMRL, in collaboration with Battelle. Laboratory names are removed, and simply stated as “Laboratory (or Lab) 1, 2, and 3” in the test results section, since inter-laboratory comparison was not an objective of this report. This verification test was conducted in four phases to evaluate the ability of the Abraxis E2 magnetic particle ELISA test kit to quantitate 17-β-estradiol (E2) in four different water matrices
5
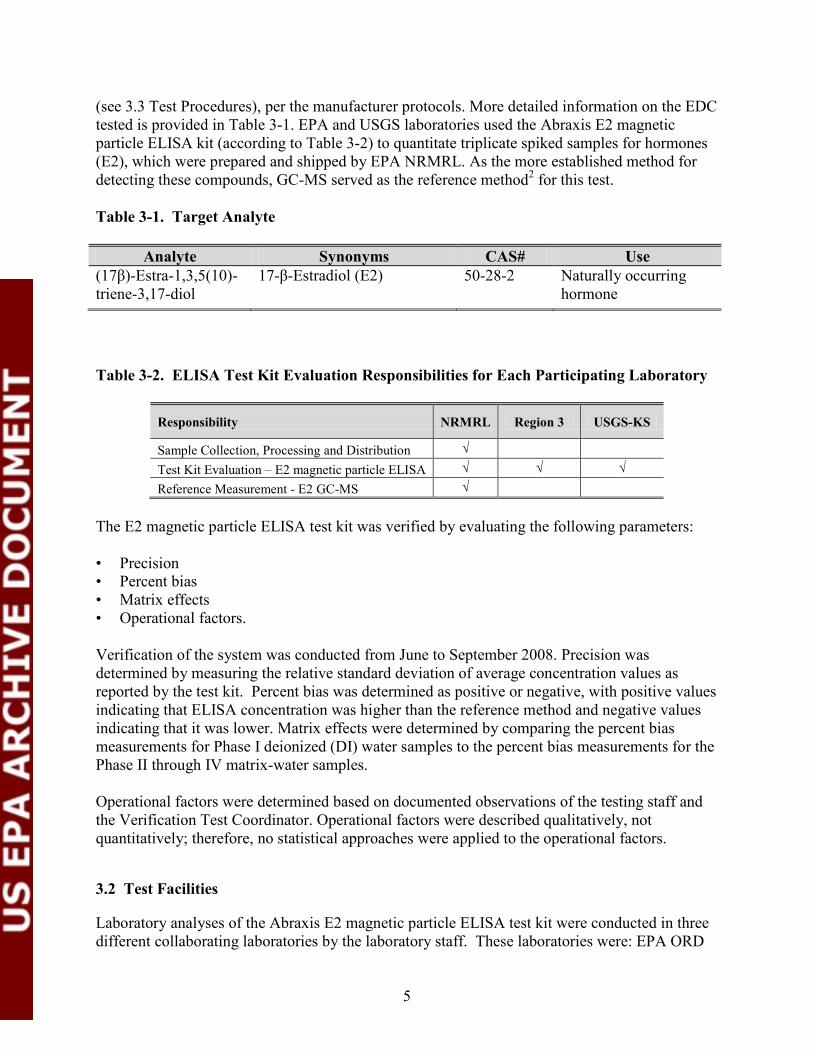
(see 3.3 Test Procedures), per the manufacturer protocols. More detailed information on the EDC tested is provided in Table 3-1. EPA and USGS laboratories used the Abraxis E2 magnetic particle ELISA kit (according to Table 3-2) to quantitate triplicate spiked samples for hormones (E2), which were prepared and shipped by EPA NRMRL. As the more established method for detecting these compounds, GC-MS served as the reference method2 for this test. Table 3-1. Target Analyte
Analyte Synonyms CAS# Use (17β)-Estra-1,3,5(10)-triene-3,17-diol
17-β-Estradiol (E2) 50-28-2 Naturally occurring hormone
Table 3-2. ELISA Test Kit Evaluation Responsibilities for Each Participating Laboratory
Responsibility NRMRL Region 3 USGS-KS
Sample Collection, Processing and Distribution √ Test Kit Evaluation – E2 magnetic particle ELISA √ √ √ Reference Measurement - E2 GC-MS √
The E2 magnetic particle ELISA test kit was verified by evaluating the following parameters: • Precision • Percent bias • Matrix effects • Operational factors. Verification of the system was conducted from June to September 2008. Precision was determined by measuring the relative standard deviation of average concentration values as reported by the test kit. Percent bias was determined as positive or negative, with positive values indicating that ELISA concentration was higher than the reference method and negative values indicating that it was lower. Matrix effects were determined by comparing the percent bias measurements for Phase I deionized (DI) water samples to the percent bias measurements for the Phase II through IV matrix-water samples. Operational factors were determined based on documented observations of the testing staff and the Verification Test Coordinator. Operational factors were described qualitatively, not quantitatively; therefore, no statistical approaches were applied to the operational factors.
3.2 Test Facilities
Laboratory analyses of the Abraxis E2 magnetic particle ELISA test kit were conducted in three different collaborating laboratories by the laboratory staff. These laboratories were: EPA ORD
6
NRMRL laboratory in Cincinnati, OH; EPA Region 3; and USGS - Kansas. Reference measurements for E2 were preformed at EPA ORD NRMRL in Cincinnati.
3.3 Test Procedures
This verification test was conducted in four phases. Phase I consisted of a clean water sample (DI water) spiked with a single concentration of E2, split into single samples, and submitted to the ELISA kit users in each collaborating laboratory to measure the concentration, in triplicate. The split sample, as well as the un-spiked, matrix background sample, were also simultaneously sent for reference GC-MS analysis of E2 and for various compounds which are known to cause cross-reactivity with some ELISA kits. Phase II consisted of environmental surface water samples subjected to the same spiking and splitting process as Phase I. Phase III consisted of a complex matrix of wastewater treatment plant (WWTP) effluent samples subjected to the same spiking and splitting process as Phase I and II. Phase IV consisted of a complex matrix of WWTP influent samples, spiked and split as in previous phases. Details on the sample matrices, spiking levels, and spiking procedures for each phase are provided in Section 3.3.1. All E2 spike concentrations used in each phase of this verification test were based on real-world concentrations found in environmental samples, per the procedure described in the test/QA plan.1 Background concentrations of E2 were measured for each matrix for each phase. These GC-MS measurements were made to determine if any measureable amounts of E2 might exist in the sample matrix prior to the addition of any sample spikes. If a detectable concentration was found, this concentration was then added to the spiked amount of E2 to calculate the total concentration for all spiked samples of a particular phase. Specific concentrations of E2, as presented in Section 3.3.1, were spiked into the sample matrix for each phase, regardless of any background concentrations of these compounds that may have been present in the collected water. For Phase III and Phase IV, 4.03 ng/L and 4.00 ng/L of E2, respectively, were found in the background matrix samples. The nominal concentration of each sample was then calculated using the measured background concentration and the expected spiked concentrations for each phase. The ELISA kit results from the various laboratories for the Abraxis E2 magnetic particle test kit were compared to each other and compared to GC-MS results. The E2 magnetic particle ELISA test kit was tested only under laboratory controlled conditions, as opposed to field conditions which would have been more variable. The analyses were performed according to the vendor’s recommended procedures as described in the user’s manual. Simple cleanup procedures, as directed by the manufacturer of the test kit, were used for the four different matrices. Each sample was analyzed both directly (prior to cleanup) and after solid phase extraction (SPE) cleanup using the procedure detailed in the kit instructions and provided in Section 3.3.2. Each sample for ELISA analysis was filtered through a 1 micron (μm) glass fiber filter prior to direct analysis and SPE. Calibration and maintenance of the technology reader (i.e., photometer) was performed as specified by the vendor. A US EPA NRMRL GC-MS standard operating procedure (SOP) was followed for reference measurements.2 The GC-MS method for estrone (E1), E2, estriol (E3), EE2, testosterone, dihydrotestosterone, androstenedione, and progesterone operated within a concentration range of 2-50 ng/L. Samples for the GC-MS methods went through an extraction step to concentrate (or dilute, depending upon the sample) to ensure the samples were within the method’s analytical
7
range.2 The procedures for preparing, storing, and analyzing the test samples are provided below.
3.3.1 Test Sample Collection and Preparation
All sample bottles and glassware associated with hormone samples, including the glass carboy, were cleaned and silanized using a procedure included in the test/QA plan. 1 All samples were thoroughly mixed and were thus assumed to contain the same concentration. Samples were spiked with E2 as one large stock solution and then split into smaller sub-samples in bottles. All sample bottles were amber glass to prevent photodegradation of the analytes. All samples were prepared and shipped by NRMRL, immediately after being made, in coolers on ice or freezer packs to maintain a 4 degrees Celsius (oC) temperature. When samples were received by each laboratory, the condition of the samples, i.e., temperature, broken bottles etc., was noted by the receiving laboratory operator and the samples were then immediately placed in a refrigerator at 4oC until analyzed. Holding times of hormone samples are currently unknown; therefore, all samples were either analyzed or solvent exchanged within 24 hours of receipt to reduce error associated with analyte degradation during sample holding. All laboratories performing quantitative analysis, ELISA or GC-MS, received split samples from the same bulk sample. Each laboratory that participated in the ELISA analysis received one 2.5 L spiked sample plus one 500 mL DI water method blank. The laboratory that performed the reference analysis received one 4L spiked sample and one 1 L DI water method blank to be processed by the GC-MS method. 3.3.1.1 Phase I Samples A sample of DI water was collected in a cleaned, 20 L, glass carboy from the USEPA laboratory in Cincinnati, Ohio. The water was spiked with E2 to a concentration of 10 ng/L. This concentration was selected because it is on the higher end of the range of concentrations expected to be encountered in a real-world situation and is representative of the anticipated mid-range of the test kit. The carboy was thoroughly mixed, by inserting a stir bar and stirring on a stir plate at 300 revolutions per minute (rpm) for 2 hours, to ensure homogeneous concentrations of the analyte throughout the carboy. One 2.5L spiked sample was collected for each participating laboratory as well as one 4L sample for each reference laboratory. DI water blanks were also prepared and shipped in separate 500 mL bottles. The blank samples were analyzed both directly (DIR) and after SPE but only in two wells (or test tubes) on the kits as opposed to three wells (or test tubes) for all other samples. Before spiking, the DI water was sampled and analyzed by GC-MS to confirm the background levels of E2. Samples of the spiked mixtures were taken and the concentrations of these samples and blank were determined using the Abraxis E2 magnetic particle ELISA test kit and GC-MS. 3.3.1.2 Phase II Samples Grab samples of stream water were collected in three, clean, five gallon buckets from the South Hasha Tributary to Eastfork Lake in Clermont County, Ohio. The tributary was accessed from where it crosses Williamsburg-Bantam Road. Before the stream water was spiked, a single sample of the collected stream water was taken, split into triplicate aliquots, and analyzed by GC-MS to confirm the background levels of E2. Background levels of E2 measured in the samples were added to the spiked concentration of E2 once results were obtained. Next, a
8
cleaned, 20 L, glass carboy was used to collect 20 L of the stream water, which was then spiked to contain a 10 ng/L concentration of E2. The carboy was thoroughly mixed by inserting a stir bar and stirring on a stir plate at 300 rpm for 2 hours, to ensure homogeneous concentration of the analyte throughout the carboy. Split samples were taken, as noted for Phase I. DI water method blanks were filled with DI water at the same time as the stream water in the 20 L carboys. 3.3.1.3 Phase III Samples
Grab samples of final effluent wastewater were collected in three, clean, five gallon buckets from the Metropolitan Sewer District of Greater Cincinnati in Hamilton County, Ohio. After the sample was transported back to the NRMRL laboratory, the effluent was measured and then transferred into a clean, 20 L carboy. Before spiking, a single sample of the effluent was taken, split into triplicate aliquots, and analyzed by GC-MS to confirm the background levels of E2. In a cleaned, 20 L, glass carboy, 20 L of WWTP effluent was prepared containing 10 ng/L of E2. The carboy was thoroughly mixed by inserting a stir bar and stirring on a stir plate at 300 rpm for 2 hours to ensure homogeneous concentration of the analyte throughout the carboy. Split samples were collected as noted for Phase I. 3.3.1.4 Phase IV Samples Grab samples of influent wastewater were collected in three, clean, five gallon buckets from the Metropolitan Sewer District of Greater Cincinnati in Hamilton County, Ohio. After the sample was transported back to the NRMRL laboratory, the influent was measured and transferred into a 20 L carboy. Before spiking, a single sample of the influent was taken, split into triplicate aliquots, and analyzed by GC-MS to confirm the background levels of E2. In a cleaned, 20 L, glass carboy, 20 L of WWTP influent was prepared containing 10 ng/L concentration of E2. The carboy was thoroughly mixed by inserting a stir bar and stirring on a stir plate at 300 rpm for 2 hours to ensure homogeneous concentration of the analyte throughout the carboy. Split samples were collected as noted in Phase I.
3.3.2 Test Sample Analysis Procedure
The ELISA test kit users followed simple cleanup procedures as directed in the vendor’s instructions. The 2.5 L sample was split into three 500 mL aliquots. Each of the three aliquots was analyzed by direct analysis utilizing only glass fiber filter (GFF) cleanup and by utilizing GFF cleanup and SPE. Each aliquot sample was transferred in triplicate to the ELISA kits for quantification, per the test kit protocols. The cleanup procedures are described below. Each sample for ELISA analysis was filtered through a 1μm GFF prior to direct analysis on the E2 magnetic particle ELISA test kit and for SPE clean-up. After filtering, one 1600 μL aliquot was removed and transferred to three tubes (250 μL for each tube) in the E2 magnetic particle test kit. After all aliquots were removed for direct analysis, three 500 mL aliquots were removed from the filtered sample for SPE. These three aliquots were treated as three independent samples. SPE directions entitled “Extractions for EE2 from Water Sample for ELISA”, which were based on the vendor’s protocols and summarized by EPA NRMRL, were followed.1 The SPE protocol consists of the following steps:
9
1. Filter 500 mL of the sample, or the remainder of liquid in the sample bottle noting the volume for later calculation, through 1µm glass fiber filter. 2. Rinse a C18 cartridge with 5 mL of methanol and then 10 mL of distilled water at a flow rate not exceeding 20 mL/min (preconditioning). 3. Pour the filtered sample through the C18 SPE cartridge at a flow rate, no faster than 20 mL/min. 4. Wash the cartridge with 5mL of distilled water (up to 20 mL/min). Keep suctioning for about a minute to dry the cartridge. 5. Wash the cartridge with 5mL of hexane (up to 20 mL/min). 6. Elute the analyte with 5mL of dichloromethane at a rate, no faster than 3 mL/min. 7. Evaporate the solvent with nitrogen gas to dryness. 8. Add 1mL of 100% methanol to the residue and stir the mixture with a vortex mixer. To adjust the content to 10% methanol (volume/volume) add 9 mL of distilled water for a total volume of 10mL. After the SPE column, the E2 sample is concentrated 50 times that of the original spike concentration. Samples were reconstituted with 10mL of a 10% methanol solution. From this reconstitution, 20 microliter (µL) was removed and added to 1980 µL of DI water. For the spiked samples, this process effectively reduced the spiked concentration by a factor of 100, down to an expected level of 5.05 ng/L. All reconstituted samples were transferred to three tubes (250 µL for each tube) according to the manufacturer’s instructions. Samples were quantified by reading at 450 nm using a tube style spectrophotometer following the manufacturer’s instructions. The general steps for operating the ELISA test kit that were followed during this verification test are provided below. The Abraxis ELISA E2 magnetic particle kit assay procedure consists of the following steps: 1. Add 250 µL of the appropriate standard, control, or sample. Each standard will be added to two tubes while each sample will be added to four tubes. 2. Mix the E2 antibody coupled paramagnetic particles thoroughly and add 500 µL to each tube. 3. Vortex for 1 to 2 seconds minimizing foaming. 4. Incubate for 30 minutes at room temperature. 5. Add 250 µL of estradiol enzyme conjugate to each tube. 6. Vortex for 1 to 2 seconds minimizing foaming. 7. Incubate for 90 minutes at room temperature. 8. Separate in the magnetic separation system for 2 minutes. 9. Decant and gently blot all tubes briefly in a consistent manner. 10. Add 1mL of washing solution to each tube and allow them to remain in the magnetic separation unit for 2 minutes. 11. Decant and gently blot all tubes briefly in a consistent manner. 12. Repeat steps 10 and 11 an additional time. 13. Remove the rack from the separator and add 500 µL of color solution to each tube. 14. Vortex for 1 to 2 seconds minimizing foaming. 15. Incubate for 20 minutes at room temperature. 16. Add 500µL of stopping solution to each tube. 17. Add 1mL washing solution to a clean test tube. Use as a blank in step 18. 18. Read results at 450 nm within 15 minutes after adding the stopping solution.

10
Chapter 4 Quality Assurance/Quality Control
QA/Quality Control (QC) procedures were performed in accordance with the quality management plan (QMP) for the AMS Center3 and the test/QA plan for this verification test.1 Test procedures were as stated in the test/QA plan1; however deviations to the test/QA plan were made due to unanticipated circumstances. As such, the test procedures described in Chapter 3 are a complete description of the actual test conditions. The statistical calculations intended for analysis of the test kit results were also changed. This deviation is further described in Chapter 5. This change had no impact on the quality of the results. QA/QC procedures and results are described below.
4.1 Quality Control Samples
Steps taken to maintain the quality of data collected during this verification test included analyzing specific quality control samples for both the reference method (GC-MS) and the test kits.
4.1.1 GC-MS Method Blank and Surrogate Spike Results
This verification test included a comparison of the Abraxis E2 magnetic particle ELISA test kit results to those of the GC-MS reference method for E2. Samples analyzed for each phase included performance evaluation (PE) samples, test samples, background samples, and blank samples. The quality of the reference measurements was evaluated by adherence to the requirements of the GC-MS method for this compound, including requirements for method blanks (MBs), instrument solvent blanks, and surrogate spikes, as indicated in the test/QA plan1. Method blank samples were analyzed to ensure that no sources of contamination were present. If the analysis of a method blank sample indicated a concentration above five times the method detection limit, contamination was suspected. Any contamination source(s) were corrected and samples were reanalyzed or flagged before proceeding with the analyses. Surrogate spikes were also included in each sample. Average acceptable recoveries for these samples were between 60 and 140%. Samples outside of the acceptable range were generally flagged and/or reanalyzed. D4-EE2 was used as a surrogate standard for the GC-MS analysis of E2 in the samples. No levels of E2 were detected in any of the reference method blank samples. Surrogate recoveries in Phase I – IV samples varied across phases. Phase I surrogate recoveries ranged from 59 – 96% and averaged 85 ± 10% across 13 samples. All recoveries were considered in the acceptable range. Phase II recoveries ranged from 77 to 155% and averaged
11
132 ± 25% over 11 samples. Surrogate recoveries for six of the samples were outside of the acceptable range. Compared to the surrogates, the peak shapes for the target analytes were good and the baselines were clean in the chromatogram. Phase III surrogate recoveries ranged from 154% to 197% and averaged 176 ± 14% over 8 samples. Surrogate recoveries for all samples were outside of the acceptable range for Phase III. Phase IV surrogate recoveries ranged from 61% to 93% and averaged 76 ± 10% over 11 samples. Surrogate recoveries for all Phase IV samples were within the acceptable range.
4.1.2 Test Kit Method Blanks
Method blank samples were run in duplicate using both direct analysis and after SPE clean-up with each set of samples for all four phases. Method blank samples were unspiked DI water. Because concentrations for samples analyzed with the test kit are calculated based on the interpolations from a curve constructed from the standards run with each batch of samples, it is possible to obtain concentration values for all samples. However, the E2 magnetic particle test kit has a stated method detection limit (MDL) of 1.5 ng/L. Based on this MDL, it is assumed that sample concentrations lower than this level cannot be reliably determined or reported. Thus, any samples, including method blank samples, with concentrations lower than the manufacturer’s stated MDL were considered non-detects. The E2 magnetic particle test kit was evaluated by three laboratories (see Table 3-2). Concentrations of E2 were not detected in any of the method blank samples from two of the participating laboratories. For the Region 3 results, levels of E2 above the MDL were not detected in Phase II – IV method blanks. However, during the analysis of Phase I samples, concentrations of E2 above the MDL were found for both sets of duplicate method blanks for one test kit. Two Abraxis E2 magnetic particle ELISA test kits were evaluated by this laboratory for each phase of testing. The second test kit operated during Phase I did not show any detectable levels of E2 in any of the method blanks analyzed. All method blanks for this phase came from the same initial sample. Phase I sample concentration values were on average twice as high for one kit versus the other between the two kits operated by Region 3. This appears to be related to differences in the standard curve generated for each kit, which could also impact the results for the method blanks. No signs of contamination were apparent in the results.
4.2 Audits
Three types of audits were performed during the verification test: a PE audit of the reference method measurements (GC-MS analyses), a technical systems audit (TSA) of the verification test performance, and a data quality audit. Audit procedures are described further below.
4.2.1 Performance Evaluation Audit
A PE audit was conducted to assess the quality of the reference method measurements (GC-MS analyses) made in this verification test. The reference method PE audit was performed by supplying an independent second standard solution of E2 prepared from a different source than that used in verification testing. The PE audit samples were analyzed in the same manner as all other samples and the analytical results for the PE audit samples were compared to the nominal concentration. The target criterion for this PE audit was agreement of the analytical result within
12
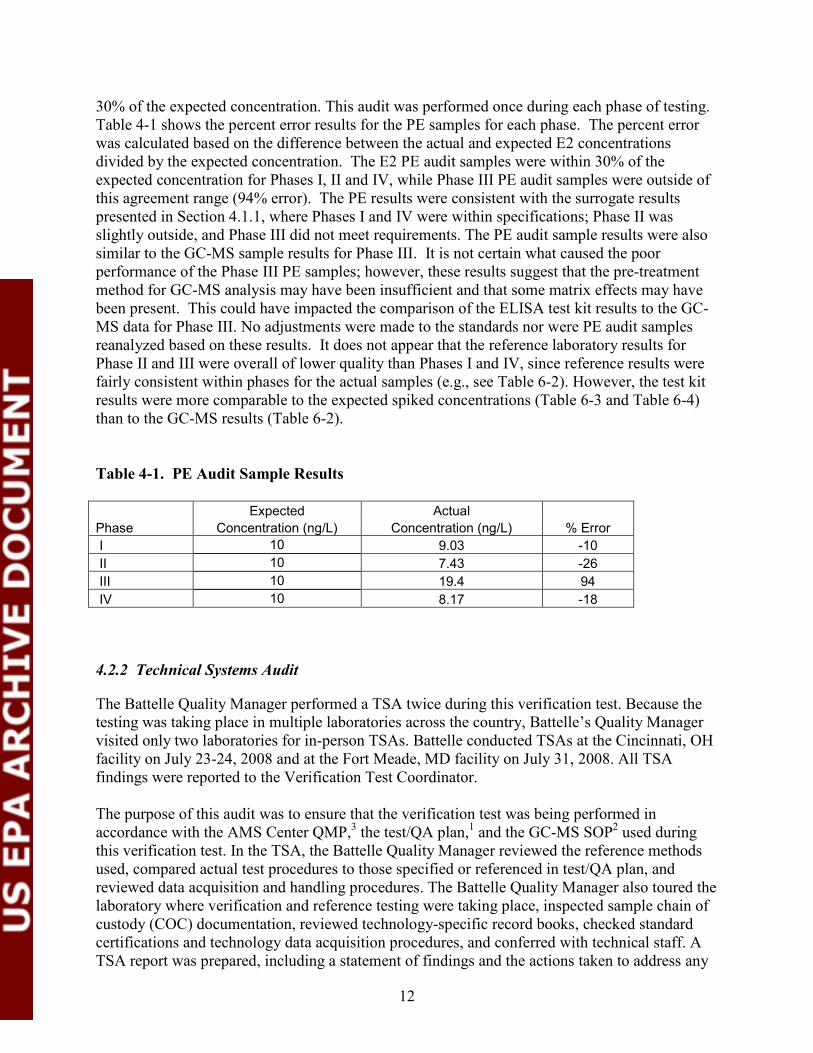
30% of the expected concentration. This audit was performed once during each phase of testing. Table 4-1 shows the percent error results for the PE samples for each phase. The percent error was calculated based on the difference between the actual and expected E2 concentrations divided by the expected concentration. The E2 PE audit samples were within 30% of the expected concentration for Phases I, II and IV, while Phase III PE audit samples were outside of this agreement range (94% error). The PE results were consistent with the surrogate results presented in Section 4.1.1, where Phases I and IV were within specifications; Phase II was slightly outside, and Phase III did not meet requirements. The PE audit sample results were also similar to the GC-MS sample results for Phase III. It is not certain what caused the poor performance of the Phase III PE samples; however, these results suggest that the pre-treatment method for GC-MS analysis may have been insufficient and that some matrix effects may have been present. This could have impacted the comparison of the ELISA test kit results to the GC-MS data for Phase III. No adjustments were made to the standards nor were PE audit samples reanalyzed based on these results. It does not appear that the reference laboratory results for Phase II and III were overall of lower quality than Phases I and IV, since reference results were fairly consistent within phases for the actual samples (e.g., see Table 6-2). However, the test kit results were more comparable to the expected spiked concentrations (Table 6-3 and Table 6-4) than to the GC-MS results (Table 6-2). Table 4-1. PE Audit Sample Results Expected Actual Phase Concentration (ng/L) Concentration (ng/L) % Error I 10 9.03 -10 II 10 7.43 -26 III 10 19.4 94 IV 10 8.17 -18
4.2.2 Technical Systems Audit
The Battelle Quality Manager performed a TSA twice during this verification test. Because the testing was taking place in multiple laboratories across the country, Battelle’s Quality Manager visited only two laboratories for in-person TSAs. Battelle conducted TSAs at the Cincinnati, OH facility on July 23-24, 2008 and at the Fort Meade, MD facility on July 31, 2008. All TSA findings were reported to the Verification Test Coordinator. The purpose of this audit was to ensure that the verification test was being performed in accordance with the AMS Center QMP,3 the test/QA plan,1 and the GC-MS SOP2 used during this verification test. In the TSA, the Battelle Quality Manager reviewed the reference methods used, compared actual test procedures to those specified or referenced in test/QA plan, and reviewed data acquisition and handling procedures. The Battelle Quality Manager also toured the laboratory where verification and reference testing were taking place, inspected sample chain of custody (COC) documentation, reviewed technology-specific record books, checked standard certifications and technology data acquisition procedures, and conferred with technical staff. A TSA report was prepared, including a statement of findings and the actions taken to address any
13
adverse findings, and a copy of Battelle’s TSA report was sent to the EPA AMS Center QA Manager. No adverse findings were reported. The TSA findings were communicated to technical staff at the time of the audit.
4.2.3 Data Quality Audit
At least 10% of the data acquired during the verification test were audited. Battelle’s Quality Manager traced the data from the initial acquisition, through reduction and statistical analysis, to final reporting to ensure the integrity of the reported results. All calculations performed on the data undergoing the audit were checked. Minor transcription errors and errors due to rounding were identified and corrected before the results were used for the calculations described in Chapter 5.
4.3 QA/QC Reporting
Each audit was documented in accordance with Section 3.3.4 of the AMS Center QMP. 3 Once the audit reports were prepared, the Battelle Verification Test Coordinator ensured that a response was provided for each adverse finding or potential problem and implemented any necessary follow-up corrective action. The Battelle Quality Manager ensured that follow-up corrective action was taken. The results of the TSA were submitted to the EPA.
4.4 Data Review
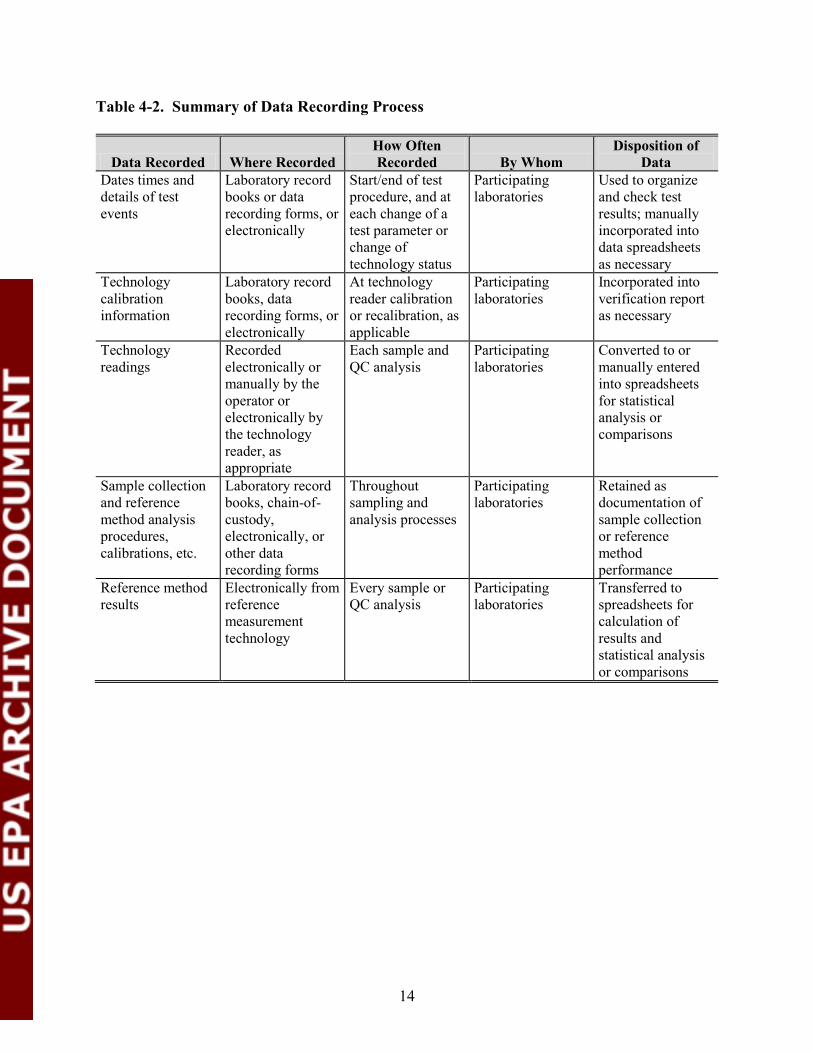
Records generated in the verification test received an independent internal review before these records were used to calculate, evaluate, or report verification results. Table 4-2 summarizes the types of data recorded. Data were reviewed by a Battelle technical staff member involved in the verification test. The person performing the review added his/her initials and the date to a hard copy of the record being reviewed.
14
Table 4-2. Summary of Data Recording Process
Data Recorded Where Recorded How Often Recorded By Whom
Disposition of Data
Dates times and details of test events
Laboratory record books or data recording forms, or electronically
Start/end of test procedure, and at each change of a test parameter or change of technology status
Participating laboratories
Used to organize and check test results; manually incorporated into data spreadsheets as necessary
Technology calibration information
Laboratory record books, data recording forms, or electronically
At technology reader calibration or recalibration, as applicable
Participating laboratories
Incorporated into verification report as necessary
Technology readings
Recorded electronically or manually by the operator or electronically by the technology reader, as appropriate
Each sample and QC analysis
Participating laboratories
Converted to or manually entered into spreadsheets for statistical analysis or comparisons
Sample collection and reference method analysis procedures, calibrations, etc.
Laboratory record books, chain-of-custody, electronically, or other data recording forms
Throughout sampling and analysis processes
Participating laboratories
Retained as documentation of sample collection or reference method performance
Reference method results
Electronically from reference measurement technology
Every sample or QC analysis
Participating laboratories
Transferred to spreadsheets for calculation of results and statistical analysis or comparisons
15
Chapter 5 Statistical Methods
The statistical methods used to evaluate the quantitative performance factors listed in Section 3.1 are presented in this chapter. Qualitative observations were also used to evaluate verification test data. Per the test/QA plan, 1 repeatability and reproducibility were intended to be calculated as performance parameters for this verification test. However, after further discussion with EPA, and in agreement with EPA, it was determined that higher level summary statistics provided a better synopsis of the test kit results. Thus, the mean and relative standard deviations (precision) were calculated for the test kit results.
5.1 Precision
The standard deviation (S) of the results for the replicate analyses of the same sample was calculated as follows:
∑=
−−
=n
kMM
nS
1
2/122 ])(
11[
where n is the number of replicate samples, Mk is the ELISA test kit measurement for the k
th
sample, and M is the average ELISA test kit measurement of the replicate samples. The precision for each sample is reported in terms of the relative standard deviation (RSD), which was calculated as follows:
100(%) ×=MSRSD
The RSD was calculated for each laboratory that participated in the verification test and for each test kit that was tested. The RSD was also calculated across all laboratories and test kits for each phase of testing.
(1)
(2)
16
5.2 Percent Bias
Percent bias was calculated as a percentage for each measurement in each phase for each kit using Equation 3:
% Bias = [ n
ji
yx
– 1 ] 100× (3)
where j = 1, 2, 3 denotes the laboratory, i = 1, 2 denotes the ELISA test kit within laboratory, n = 1, 2 denotes the reference method, xji is the ELISA concentration for the jth laboratory and the ith test kit, yn is the concentration of the reference method GC-MS or the concentration of the spike. Ideally percent bias results will be within ±25%.
5.3 Matrix Effects
Matrix effects were examined by comparing the percent bias measurements for the Phase I DI water samples to the percent bias measurements for the Phase II – IV samples. Percent bias was determined as described in Section 5.2. General observations of potential matrix effects, such as false negatives, if observed, were documented but were not used in statistical calculations. False negatives were defined as a negative (zero) response in a sample that is spiked with contaminant at a detectable concentration. General observations on potential cross-reactivity were documented. Blank samples of each matrix were evaluated by GC-MS to determine background levels of the compounds with which the kits have cross-reactivity, as stated by the vendor. Percent recovery results were calculated on a per-sample and per-phase basis and were based on the expected spiked concentration of the analyte in each sample matrix. Percent recovery was calculated using the Equation 4:
% Recovery = 100×EA
(4)
Where A is the actual ELISA test kit measurement and E is the expected concentration. The expected concentration includes the known spike concentration as well as any detected background levels of E2 in the matrix water (see Section 3.3). Percent recovery results are presented to provide another measure of test kit performance to the end user. Ideal percent recovery values are near 100%. A comparison of the ELISA results generated with and without the use of SPE cleanup was also performed. This evaluated whether the use of the more involved SPE cleanup procedure was necessary/warranted with the ELISA test kits. Percent bias calculations based on the actual and expected spike concentrations and a t-test were used to evaluate these results.

17
5.4 Operational Factors
Operational factors were determined based on documented observations of the testing staff. Operational factors are described qualitatively, not quantitatively; therefore, no statistical approaches were applied to the operational factors.
18
Chapter 6 Test Results
The results of the verification tests of the Abraxis E2 magnetic particle ELISA test kit are presented below for each of the performance parameters.
6.1 Precision
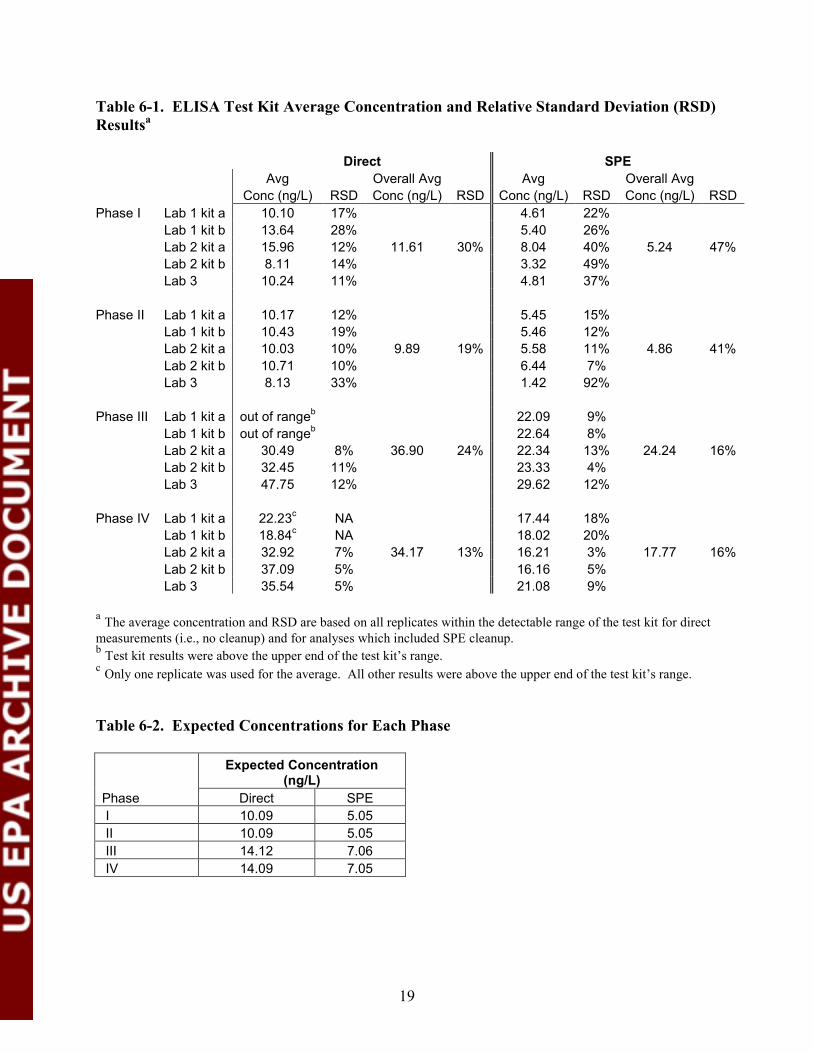
The relative standard deviation (RSD) is used as a means of evaluating the precision of the ELISA test kit. Three laboratories operated the E2 magnetic particle ELISA test kit. Two laboratories (Lab 1 and Lab 2) ran identical samples on two separate test kits (kit “a” and kit “b”). Lab 3 ran a single kit. Table 6-1 presents the resulting RSD for each participating laboratory and test kit along with the overall average concentrations per phase of E2 found using the E2 magnetic particle ELISA test kit for all analyses. RSD values are also presented across all results for each phase. Expected concentrations for both direct and SPE analysis are presented for each phase in Table 6-2. RSDs ranged from 5 to 33% for direct analysis and 3 to 92% for SPE analysis. The RSDs across all analyses were similar for Phase IV using both direct and SPE analysis (13% and 16%, respectively). For both the direct and SPE analysis, the RSD for Phase I was greater than that in Phase IV. For both direct and SPE analysis, Phase I (which was performed with DI water) samples had the highest overall RSD. Average concentrations were similar between Phases I and II using direct analysis and between Phases III and IV. Resulting concentration relationships between phases were the same for SPE analysis, though average concentrations for Phases III (24.24 ng/L) and IV (17.77 ng/L) samples differed by approximately 7 ng/L.
19
Table 6-1. ELISA Test Kit Average Concentration and Relative Standard Deviation (RSD) Resultsa Direct SPE Avg Overall Avg Avg Overall Avg Conc (ng/L) RSD Conc (ng/L) RSD Conc (ng/L) RSD Conc (ng/L) RSD Phase I Lab 1 kit a 10.10 17% 4.61 22% Lab 1 kit b 13.64 28% 5.40 26% Lab 2 kit a 15.96 12% 11.61 30% 8.04 40% 5.24 47% Lab 2 kit b 8.11 14% 3.32 49% Lab 3 10.24 11% 4.81 37% Phase II Lab 1 kit a 10.17 12% 5.45 15% Lab 1 kit b 10.43 19% 5.46 12% Lab 2 kit a 10.03 10% 9.89 19% 5.58 11% 4.86 41% Lab 2 kit b 10.71 10% 6.44 7% Lab 3 8.13 33% 1.42 92% Phase III Lab 1 kit a out of rangeb 22.09 9% Lab 1 kit b out of rangeb 22.64 8% Lab 2 kit a 30.49 8% 36.90 24% 22.34 13% 24.24 16% Lab 2 kit b 32.45 11% 23.33 4% Lab 3 47.75 12% 29.62 12% Phase IV Lab 1 kit a 22.23c NA 17.44 18% Lab 1 kit b 18.84c NA 18.02 20% Lab 2 kit a 32.92 7% 34.17 13% 16.21 3% 17.77 16% Lab 2 kit b 37.09 5% 16.16 5% Lab 3 35.54 5% 21.08 9% a The average concentration and RSD are based on all replicates within the detectable range of the test kit for direct measurements (i.e., no cleanup) and for analyses which included SPE cleanup. b Test kit results were above the upper end of the test kit’s range. c Only one replicate was used for the average. All other results were above the upper end of the test kit’s range. Table 6-2. Expected Concentrations for Each Phase
Phase
Expected Concentration (ng/L)
Direct SPE I 10.09 5.05 II 10.09 5.05 III 14.12 7.06 IV 14.09 7.05
20
6.2 Percent Bias
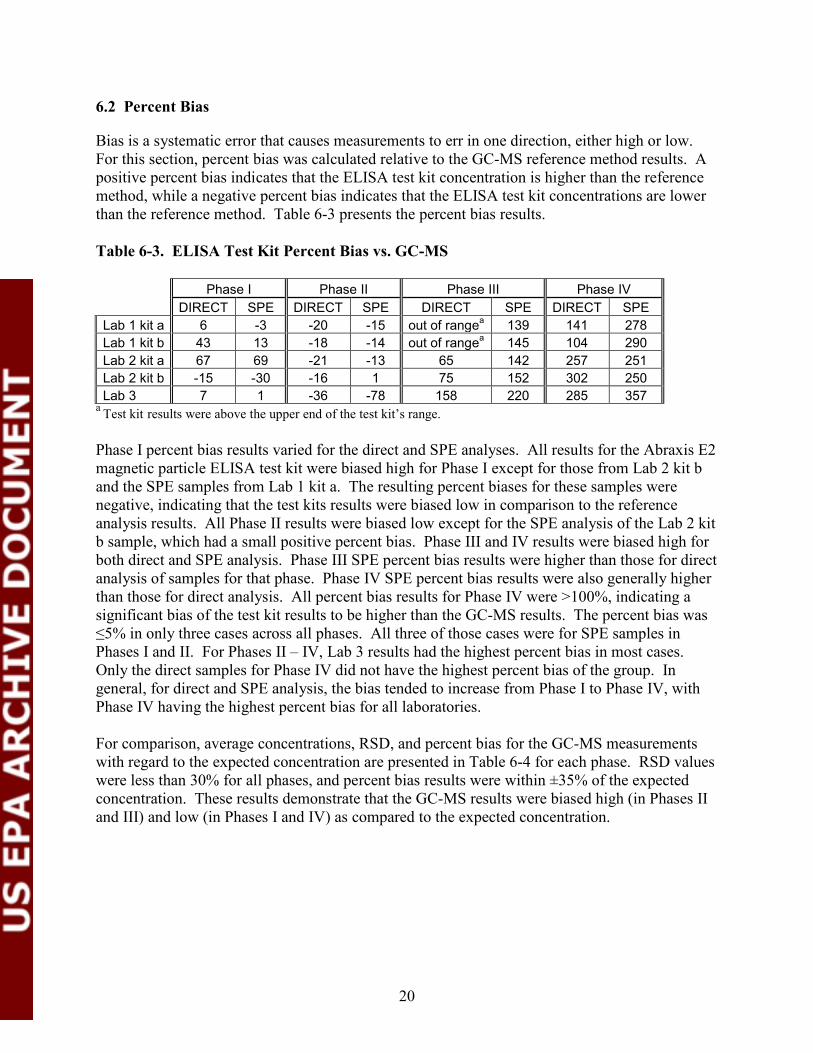
Bias is a systematic error that causes measurements to err in one direction, either high or low. For this section, percent bias was calculated relative to the GC-MS reference method results. A positive percent bias indicates that the ELISA test kit concentration is higher than the reference method, while a negative percent bias indicates that the ELISA test kit concentrations are lower than the reference method. Table 6-3 presents the percent bias results. Table 6-3. ELISA Test Kit Percent Bias vs. GC-MS Phase I Phase II Phase III Phase IV DIRECT SPE DIRECT SPE DIRECT SPE DIRECT SPE Lab 1 kit a 6 -3 -20 -15 out of rangea 139 141 278 Lab 1 kit b 43 13 -18 -14 out of rangea 145 104 290 Lab 2 kit a 67 69 -21 -13 65 142 257 251 Lab 2 kit b -15 -30 -16 1 75 152 302 250 Lab 3 7 1 -36 -78 158 220 285 357
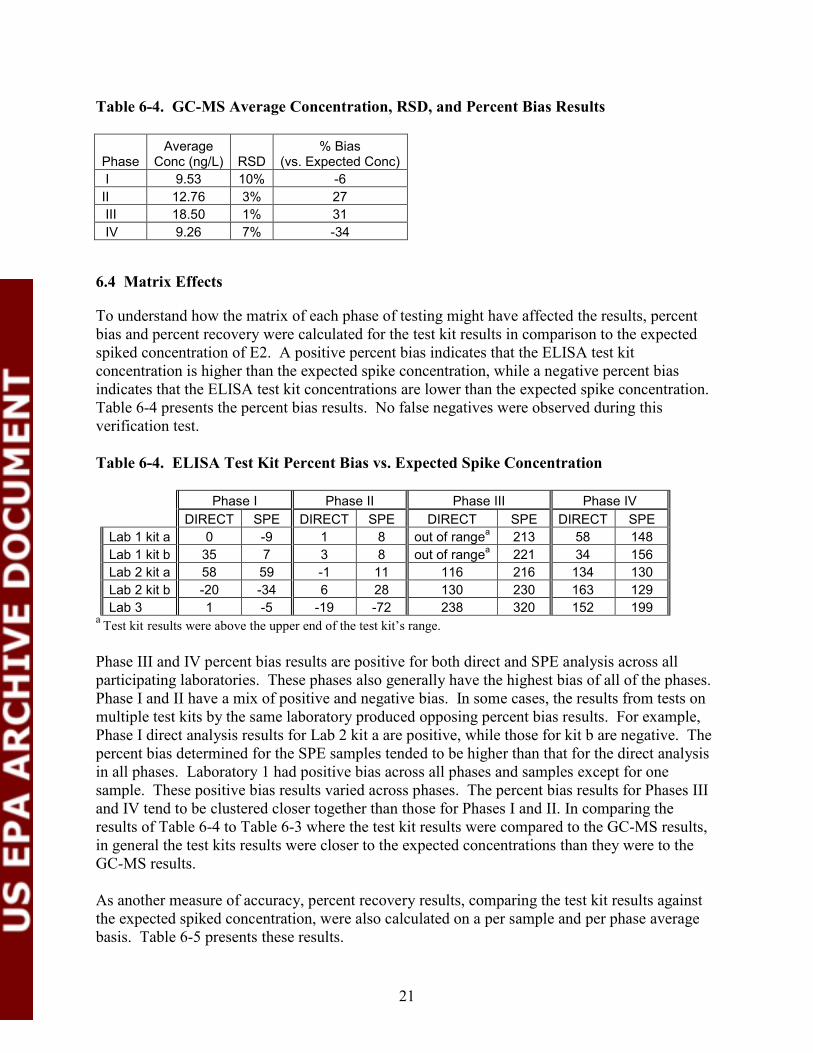
a Test kit results were above the upper end of the test kit’s range. Phase I percent bias results varied for the direct and SPE analyses. All results for the Abraxis E2 magnetic particle ELISA test kit were biased high for Phase I except for those from Lab 2 kit b and the SPE samples from Lab 1 kit a. The resulting percent biases for these samples were negative, indicating that the test kits results were biased low in comparison to the reference analysis results. All Phase II results were biased low except for the SPE analysis of the Lab 2 kit b sample, which had a small positive percent bias. Phase III and IV results were biased high for both direct and SPE analysis. Phase III SPE percent bias results were higher than those for direct analysis of samples for that phase. Phase IV SPE percent bias results were also generally higher than those for direct analysis. All percent bias results for Phase IV were >100%, indicating a significant bias of the test kit results to be higher than the GC-MS results. The percent bias was ≤5% in only three cases across all phases. All three of those cases were for SPE samples in Phases I and II. For Phases II – IV, Lab 3 results had the highest percent bias in most cases. Only the direct samples for Phase IV did not have the highest percent bias of the group. In general, for direct and SPE analysis, the bias tended to increase from Phase I to Phase IV, with Phase IV having the highest percent bias for all laboratories. For comparison, average concentrations, RSD, and percent bias for the GC-MS measurements with regard to the expected concentration are presented in Table 6-4 for each phase. RSD values were less than 30% for all phases, and percent bias results were within ±35% of the expected concentration. These results demonstrate that the GC-MS results were biased high (in Phases II and III) and low (in Phases I and IV) as compared to the expected concentration.
21
Table 6-4. GC-MS Average Concentration, RSD, and Percent Bias Results
Phase Average
Conc (ng/L) RSD % Bias
(vs. Expected Conc) I 9.53 10% -6 II 12.76 3% 27 III 18.50 1% 31 IV 9.26 7% -34
6.4 Matrix Effects
To understand how the matrix of each phase of testing might have affected the results, percent bias and percent recovery were calculated for the test kit results in comparison to the expected spiked concentration of E2. A positive percent bias indicates that the ELISA test kit concentration is higher than the expected spike concentration, while a negative percent bias indicates that the ELISA test kit concentrations are lower than the expected spike concentration. Table 6-4 presents the percent bias results. No false negatives were observed during this verification test. Table 6-4. ELISA Test Kit Percent Bias vs. Expected Spike Concentration
Phase I Phase II Phase III Phase IV DIRECT SPE DIRECT SPE DIRECT SPE DIRECT SPE Lab 1 kit a 0 -9 1 8 out of rangea 213 58 148 Lab 1 kit b 35 7 3 8 out of rangea 221 34 156 Lab 2 kit a 58 59 -1 11 116 216 134 130 Lab 2 kit b -20 -34 6 28 130 230 163 129 Lab 3 1 -5 -19 -72 238 320 152 199
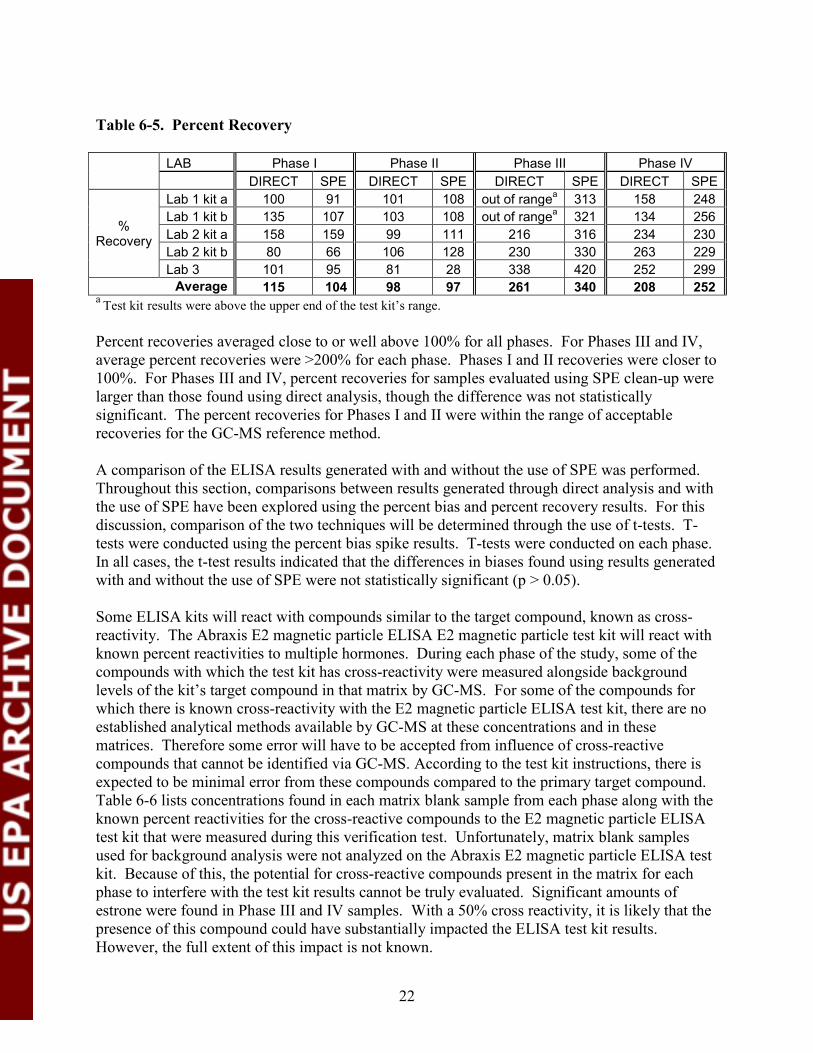
a Test kit results were above the upper end of the test kit’s range. Phase III and IV percent bias results are positive for both direct and SPE analysis across all participating laboratories. These phases also generally have the highest bias of all of the phases. Phase I and II have a mix of positive and negative bias. In some cases, the results from tests on multiple test kits by the same laboratory produced opposing percent bias results. For example, Phase I direct analysis results for Lab 2 kit a are positive, while those for kit b are negative. The percent bias determined for the SPE samples tended to be higher than that for the direct analysis in all phases. Laboratory 1 had positive bias across all phases and samples except for one sample. These positive bias results varied across phases. The percent bias results for Phases III and IV tend to be clustered closer together than those for Phases I and II. In comparing the results of Table 6-4 to Table 6-3 where the test kit results were compared to the GC-MS results, in general the test kits results were closer to the expected concentrations than they were to the GC-MS results. As another measure of accuracy, percent recovery results, comparing the test kit results against the expected spiked concentration, were also calculated on a per sample and per phase average basis. Table 6-5 presents these results.
22
Table 6-5. Percent Recovery LAB Phase I Phase II Phase III Phase IV DIRECT SPE DIRECT SPE DIRECT SPE DIRECT SPE
% Recovery
Lab 1 kit a 100 91 101 108 out of rangea 313 158 248 Lab 1 kit b 135 107 103 108 out of rangea 321 134 256 Lab 2 kit a 158 159 99 111 216 316 234 230 Lab 2 kit b 80 66 106 128 230 330 263 229 Lab 3 101 95 81 28 338 420 252 299
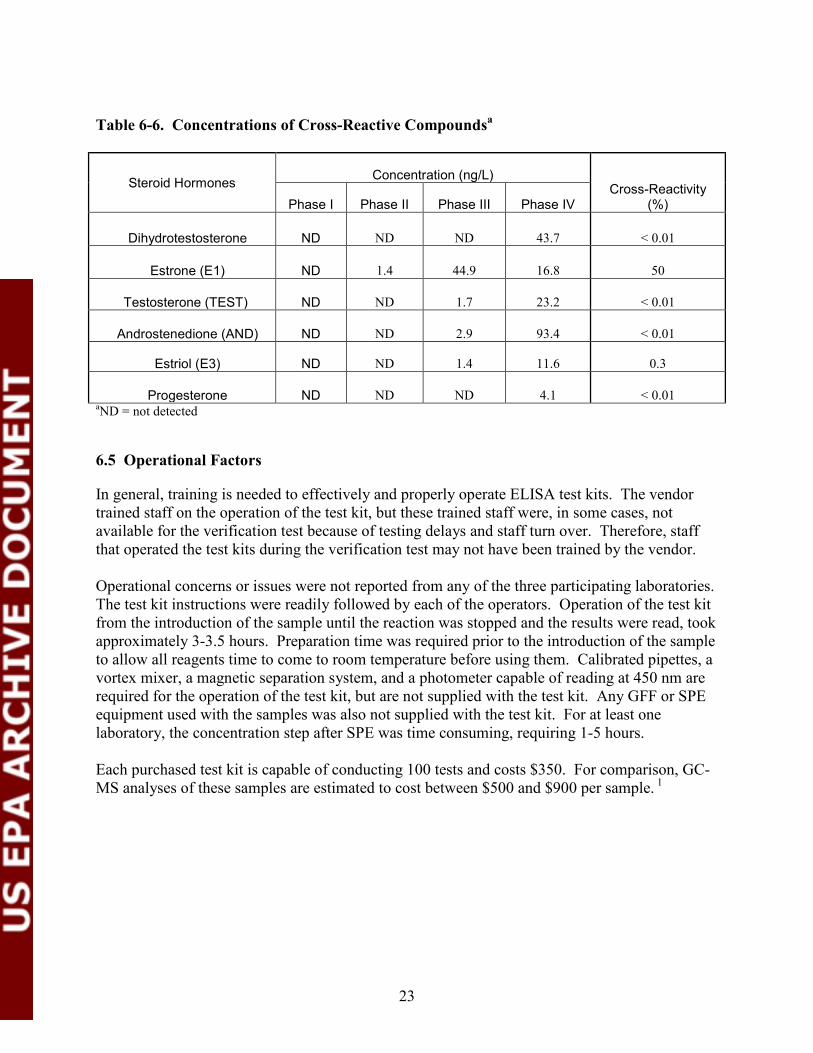
Average 115 104 98 97 261 340 208 252 a Test kit results were above the upper end of the test kit’s range. Percent recoveries averaged close to or well above 100% for all phases. For Phases III and IV, average percent recoveries were >200% for each phase. Phases I and II recoveries were closer to 100%. For Phases III and IV, percent recoveries for samples evaluated using SPE clean-up were larger than those found using direct analysis, though the difference was not statistically significant. The percent recoveries for Phases I and II were within the range of acceptable recoveries for the GC-MS reference method. A comparison of the ELISA results generated with and without the use of SPE was performed. Throughout this section, comparisons between results generated through direct analysis and with the use of SPE have been explored using the percent bias and percent recovery results. For this discussion, comparison of the two techniques will be determined through the use of t-tests. T-tests were conducted using the percent bias spike results. T-tests were conducted on each phase. In all cases, the t-test results indicated that the differences in biases found using results generated with and without the use of SPE were not statistically significant (p > 0.05). Some ELISA kits will react with compounds similar to the target compound, known as cross-reactivity. The Abraxis E2 magnetic particle ELISA E2 magnetic particle test kit will react with known percent reactivities to multiple hormones. During each phase of the study, some of the compounds with which the test kit has cross-reactivity were measured alongside background levels of the kit’s target compound in that matrix by GC-MS. For some of the compounds for which there is known cross-reactivity with the E2 magnetic particle ELISA test kit, there are no established analytical methods available by GC-MS at these concentrations and in these matrices. Therefore some error will have to be accepted from influence of cross-reactive compounds that cannot be identified via GC-MS. According to the test kit instructions, there is expected to be minimal error from these compounds compared to the primary target compound. Table 6-6 lists concentrations found in each matrix blank sample from each phase along with the known percent reactivities for the cross-reactive compounds to the E2 magnetic particle ELISA test kit that were measured during this verification test. Unfortunately, matrix blank samples used for background analysis were not analyzed on the Abraxis E2 magnetic particle ELISA test kit. Because of this, the potential for cross-reactive compounds present in the matrix for each phase to interfere with the test kit results cannot be truly evaluated. Significant amounts of estrone were found in Phase III and IV samples. With a 50% cross reactivity, it is likely that the presence of this compound could have substantially impacted the ELISA test kit results. However, the full extent of this impact is not known.
23
Table 6-6. Concentrations of Cross-Reactive Compoundsa
Steroid Hormones Concentration (ng/L) Cross-Reactivity
(%) Phase I Phase II Phase III Phase IV
Dihydrotestosterone ND ND ND 43.7 < 0.01
Estrone (E1) ND 1.4 44.9 16.8 50
Testosterone (TEST) ND ND 1.7 23.2 < 0.01
Androstenedione (AND) ND ND 2.9 93.4 < 0.01
Estriol (E3) ND ND 1.4 11.6 0.3
Progesterone ND ND ND 4.1 < 0.01 aND = not detected
6.5 Operational Factors
In general, training is needed to effectively and properly operate ELISA test kits. The vendor trained staff on the operation of the test kit, but these trained staff were, in some cases, not available for the verification test because of testing delays and staff turn over. Therefore, staff that operated the test kits during the verification test may not have been trained by the vendor. Operational concerns or issues were not reported from any of the three participating laboratories. The test kit instructions were readily followed by each of the operators. Operation of the test kit from the introduction of the sample until the reaction was stopped and the results were read, took approximately 3-3.5 hours. Preparation time was required prior to the introduction of the sample to allow all reagents time to come to room temperature before using them. Calibrated pipettes, a vortex mixer, a magnetic separation system, and a photometer capable of reading at 450 nm are required for the operation of the test kit, but are not supplied with the test kit. Any GFF or SPE equipment used with the samples was also not supplied with the test kit. For at least one laboratory, the concentration step after SPE was time consuming, requiring 1-5 hours. Each purchased test kit is capable of conducting 100 tests and costs $350. For comparison, GC-MS analyses of these samples are estimated to cost between $500 and $900 per sample. 1
24
Chapter 7 Performance Summary
The ability of the Abraxis E2 magnetic particle ELISA test kit to detect E2 in water was evaluated using four different water matrices. The test kit was operated by three different laboratories with and without the use of SPE. The test kit results were evaluated against the expected spike concentrations and the reference measurements of the same samples made using GC-MS. Relative standard deviations (RSDs) ranged from 5 to 33% for direct analysis and 3 to 92% for SPE analysis. The RSDs across all analyses were similar for Phase IV using both direct and SPE analysis (13% and 16%, respectively). For both the direct and SPE analysis, the RSD for Phase I was greater than that in Phase IV. For both direct and SPE analysis, Phase I (which was performed with DI water) samples had the highest overall RSD. Average concentrations were similar between Phases I and II using direct analysis and between Phases III and IV. Resulting concentration relationships between phases were the same for SPE analysis, though average concentrations for Phases III (24.24 ng/L) and IV (17.77 ng/L) samples differed by approximately 7 ng/L. Percent bias, as compared to the GC-MS reference analysis results, was varied for both sample results using both direct and SPE analysis. There did not appear to be any consistent trend in bias across phases or laboratories. Percent bias, as compared to the expected spiked E2 concentration, was also mixed with no clear trends. T-test results indicated that the bias found using results generated with and without the use of SPE were not significantly different (p > 0.05). No false negatives were observed during this verification test. Average percent recoveries were close to or well above 100% for all phases. For Phases III and IV, average percent recoveries were >200% for each phase. Phases I and II recoveries were closer to 100%. The percent recoveries for Phases I and II were within the range of acceptable recoveries for the GC-MS reference method. Operational concerns or issues were not reported from any of the three participating laboratories. The test kit instructions were readily followed by each of the operators. Operation of the test kit from the introduction of the sample until the reaction was stopped and the results were read took approximately 3-3.5 hours. Preparation time was required prior to the introduction of the sample to allow all reagents time to come to room temperature before using them. Calibrated pipettes, a vortex mixer, a magnetic separation system, and a photometer capable of reading at 450 nm are

25
required for the operation of the test kit but are not supplied with the test kit. GFF and SPE equipment used with the samples was not supplied with the test kit. For at least one laboratory, the concentration step after SPE was time consuming, requiring 1-5 hours. Each purchased test kit is capable of conducting 100 tests and costs $350.
26
Chapter 8 References
1. Test/QA Plan for Verification of Enzyme-Linked Immunosorbent Assay (ELISA) Test Kits for the Quantitative Determination of Endocrine Disrupting Compounds (EDCs) in Aqueous Phase Samples, Battelle, Columbus, Ohio, July 1, 2008.
2. U.S. EPA NRMRL Standard Operating Procedure (SOP) for the Analysis of Steroid
Hormones in Aqueous Samples, QA ID 503-P3-0, 09/29/05. 3. Quality Management Plan (QMP) for the ETV Advanced Monitoring Systems Center,
Version 6.0, U.S. EPA Environmental Technology Verification Program, Battelle, Columbus, Ohio, November 2005.