
Direct α-synuclein promoter transactivation by the tumor suppressor p53
Oil & Gas Science and Technology – Rev. IFP, Vol. 64 (2009), No. 6, pp. 719-730 Copyright © 2009, Institut français du pétroleDOI: 10.2516/ogst/2009037
A Rational Comparison of the Optimal Promoter Edge Decoration
of HDT NiMoS vs CoMoS CatalystsK. Marchand, C. Legens, D. Guillaume and P. Raybaud*
Institut français du pétrole, IFP-Lyon, BP 3, Rond point de l'échangeur de Solaize, 69360 Solaize - France e-mail: [email protected] - [email protected] - [email protected]
*Corresponding author
Résumé — Étude comparative de la décoration optimale par le promoteur des phases CoMoS et NiMoS actives en hydrotraitement — Dans le but d’acquérir une meilleure compréhension de lamorphologie et la teneur en promoteur de la phase active des catalyseurs d’hydrotraitement dans lesconditions de l’hydrotraitement, une étude multi-technique a été entreprise sur une série de catalyseursNiMoP avec des ratios Ni/Mo variables. La combinaison de la spectroscopie photoélectronique-X, de lamicroscopie électronique à transmission, de la modélisation moléculaire ab initio et de tests catalytiquesd’hydrogénation du toluène a permis d’aboutir à un modèle morphologique qui a été comparé à une précédente étude menée sur une série analogue promue par le cobalt. Cette étude confirme l’importancede la présence de sites mixtes Ni-Mo sur les bords des cristallites, en particulier sur le bord M-edge pourles réactions d’hydrogénation. Ces résultats permettent d’orienter la mise au point de nouveaux catalyseurs dans le but de maximiser leurs performances.
Abstract — A Rational Comparison of the Optimal Promoter Edge Decoration of HDT NiMoS vs CoMoS Catalysts — In order to gain a better understanding of the morphology and promoter edgecontent of the active phase of industrial HDT NiMoP catalysts in working conditions, a multi-techniquestudy has been undertaken on a series of NiMoP catalysts with various Ni/Mo ratios. The combination ofX-ray Photoelectron Spectroscopy (XPS), Transition Electron Microscopy (TEM), Density FunctionalTheory (DFT) modeling and catalytic testing (toluene hydrogenation) provided data to build a morphological model of NiMoS nanocrystallites. A parallel has been established with their CoMoS counterparts obtained in our previous work in order to emphasize differences arising from the promoteratom. This study confirms the importance of the presence of mixed Ni-Mo sites on the edges of the NiMoSnanocrystallites, and especially on the M-edge for reactions involving hydrogenation. These results provide new guidelines for future and ever more active catalysts.
Catalysts and Adsorbents: from Molecular Insight to Industrial OptimizationCatalyseurs et adsorbants : de la compréhension moléculaire à l'optimisation industrielle
D o s s i e r
Oil & Gas Science and Technology – Rev. IFP, Vol. 64 (2009), No. 6
INTRODUCTION
The production of ever cleaner fuels with ultra low sulfurcontent requires a continuous improvement of the catalystsused by the refining industry. Sulfides catalysts such as γ-alumina supported Co(Ni)MoS have been widely used inhydrotreatment processes for the last six decades. However,until the early 80s, very little information was available aboutthe structures of the active phase of industrial HDT catalystsin working conditions. They are now better characterized andunderstood. The active phase consists of Co(Ni) promotedMoS2 nanocrystallites. Promotions/decorations and sulfida-tions of those catalysts may be characterized by X-rayPhotoelectron Spectroscopy (XPS). This technique is alsoappropriate to identify the electronic state of Co species [1-4]and Ni species [5-7] in the active phase and to quantify them[8, 9]. More recently, Density Functional Theory (DFT) hasalso appeared as a very efficient method to bring newinsights on the local structure and electronic properties of theactive phase of HDT catalysts [10, 11]. Moreover, in linewith the geometrical model earlier proposed by Kasztelan etal. [12], the stable morphologies of the active CoMoS andNiMoS phases in reaction conditions have been solved byDFT calculations [13]. For instance, Schweiger [14] et al. putforward two distinct behaviors at the metallic-edge and sul-fur-edge with respect to the promoter: they found that Co ismore stable in substitution at the S-edge than at the Mo-edgedue to a smaller edge energy at the S-edge, which is also sup-ported by other DFT simulations [15] and STM experimentson gold supported CoMoS [16]. These calculations havebeen successfully confronted to experimental results onCoMo catalysts in a previous study [8]: the decomposition ofthe XPS spectral envelope was used to quantify the amountof CoMoS phase, determine the promoter-to-molybdenumratio in the nanocrystallites and normalize the catalytic activ-ity in toluene hydrogenation per edge CoMoS site. It wasthus found that the optimal promoter-to-molybdenum atomicratio in the nanocrystallite (decoration ratio) corresponded to(Co/Mo)CoMoS = 0.3, a ratio for which a total decoration ofthe S-edge is obtained whereas the substitution of the M-edge
corresponds to 50%. In the present work, we extended thatstudy to NiMo catalysts, exploring the characteristics of theNiMoS active phase by a multitechnique approach combin-ing X-ray Photoelectron Spectroscopy (XPS), TransmissionElectron Microscopy (TEM), catalytic tests and DensityFunctional Theory (DFT) calculations. Our goal is here againto gain a better understanding of the promoter decoration atthe edges of the MoS2 crystallites, taking into account thecrystallites morphology effects and to focus on the differ-ences arising from the use of different promoter atoms. Wefinally make a proposal deduced from these techniques forthe most coherent model of morphology and active sites ofthe NiMoS phase and thus discuss it with respect to theCoMoS phase model recently proposed on the same bases.
1 EXPERIMENTAL METHODS
1.1 Preparation of the Catalysts
The oxidic precursors were prepared by incipient wetnessimpregnation of γ-alumina extrudates (from Axens) withimpregnation solutions containing the appropriate amount ofmetal to be deposited. The impregnated extrudates were thenplaced in water-saturated atmosphere for at least 3 h and thendried at 120°C overnight. Finally the solids were calcinedunder air at 500°C for 2 h.
The NiMoP catalysts with various Ni/Mo ratio were prepared with impregnation solutions containing Strandberg-type heteropolycompound NixP2Mo5O23 [17]. A large excessof phosphoric acid, corresponding to 1.9 wt% P loading, wasnecessary to dissolve the molybdenum and nickel precursors.The Mo loading was of 12.7 wt% as Mo, the concentration ofNi was adjusted to obtain various nickel-to-molybdenummolar ratios. These catalysts will be referred to as NixMoP,where x represents the Ni/Mo atomic ratio. The Ni loadingscorrespond respectively to 0.8, 1.6, 2.4, 3.1, 3.9, 4.6 and 5.4 wt% Ni for respectively 0.1, 0.2, 0.3, 0.4, 0.5, 0.6 and 0.7 ratios. Definitions and compositions of the prepared catalysts are listed in Table 1.
720
TABLE 1
Definitions and compositions of NiMoP catalysts
Catalyst Ni loading (wt%) Mo loading (wt%) P loading (wt%)(Theoretical Ni/Mo Experimental Ni/Mo ratio
ratio (mol/mol) by XRF (mol/mol)
Ni0.1MoP 0.8 12.8 1.8 0.10 0.10
Ni0.2MoP 1.6 12.9 1.9 0.20 0.20
Ni0.3MoP 2.4 13.0 1.9 0.30 0.30
Ni0.4MoP 3.1 12.6 1.8 0.40 0.40
Ni0.5MoP 3.9 12.7 2.0 0.50 0.50
Ni0.6MoP 4.6 12.5 1.9 0.60 0.61
Ni0.7MoP 5.4 12.5 2.0 0.70 0.71
K Marchand et al. / A Rational Comparison of the Optimal Promoter Edge Decoration of HDT NiMoS vs CoMoS Catalysts
1.2 Sulfidation Conditions
The oxide precursors were sulfided at atmospheric pressureunder a H2S/H2 mixture with a p(H2S)/p(H2) ratio about 0.17and a gas flow of 2 L/h/g of catalyst. The samples wereheated under the sulfiding mixture at a rate of 5°C/min up to400°C and maintained at this temperature for 2 h. They werethen cooled down to room temperature at a rate of 20°C/minalso under the reactive mixture. The sulfided catalysts weretransferred into glass vials under vacuum in order to avoidany contact with air.
1.3 TEM Analysis
The sulfided samples were analyzed by TEM to determinethe average lengths and stackings of the MoS2 nanocrystal-lites by counting at least 350 particles. The extrudates werecrushed into a fine powder, a small amount of which beingultra sonically diluted in ethanol. Two drops of this solutionwere deposited on a carbon-coated Cu grid and the solventwas evaporated under infrared light. TEM images were takenusing a 200 kV JEOL-2010 transmission electron microscopeequipped with a digital camera.
1.4 XPS Analysis
The XPS sampling of the sulfided catalysts was performed ina glove box under argon atmosphere, with controlled oxygenand water level (less than 20 ppm) in order to avoid their par-tial reoxidation. The samples were crushed and pressed ontoan indium foil that was attached to the sample holder via adouble side carbon tape. The sample holder was then moveddirectly to the introduction chamber of the XPS spectrometer,
thanks to the special connection of the glove box to the XPSspectrometer. The XPS spectra were recorded on a KratosAxis Ultra instrument with Al monochromator source(1486.6 eV) and a hemi-spherical analyzer operating at fixedpass energy of 40 eV. The measurements were made at 293 Kin steps of 0.05 eV for nickel, 0.1 eV for sulfur and 0.1 eV formolybdenum, and at a pressure lower than 1 × 10⁻⁹ Pa in thesample analysis chamber. Binding energies (BE) of the vari-ous elements have been referenced to the C1s level of thecontamination carbon at 284.6 eV (the Al 2p is found at 74.7 eV). The curves were integrated applying a Shirley typebaseline. The collected spectra were analyzed by usingCasaXPS software, Version 2.0.71. The decomposition of theS 2p, Mo 3d and Ni 2p XPS spectra were performed usingthe appropriate oxide and sulfided references as supportedmonometallic catalysts and led us to propose a protocol toquantify inter alia the NiMoS phase, as had already beenobtained previously for CoMoS type phase [3, 8].
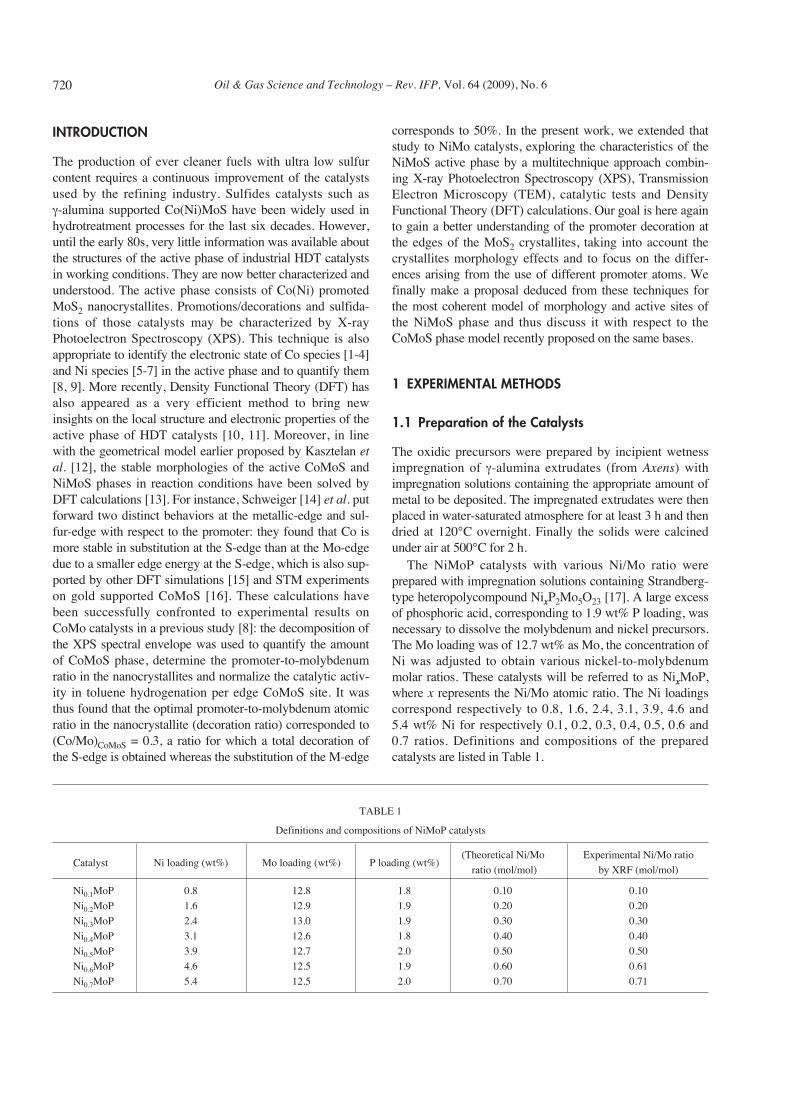
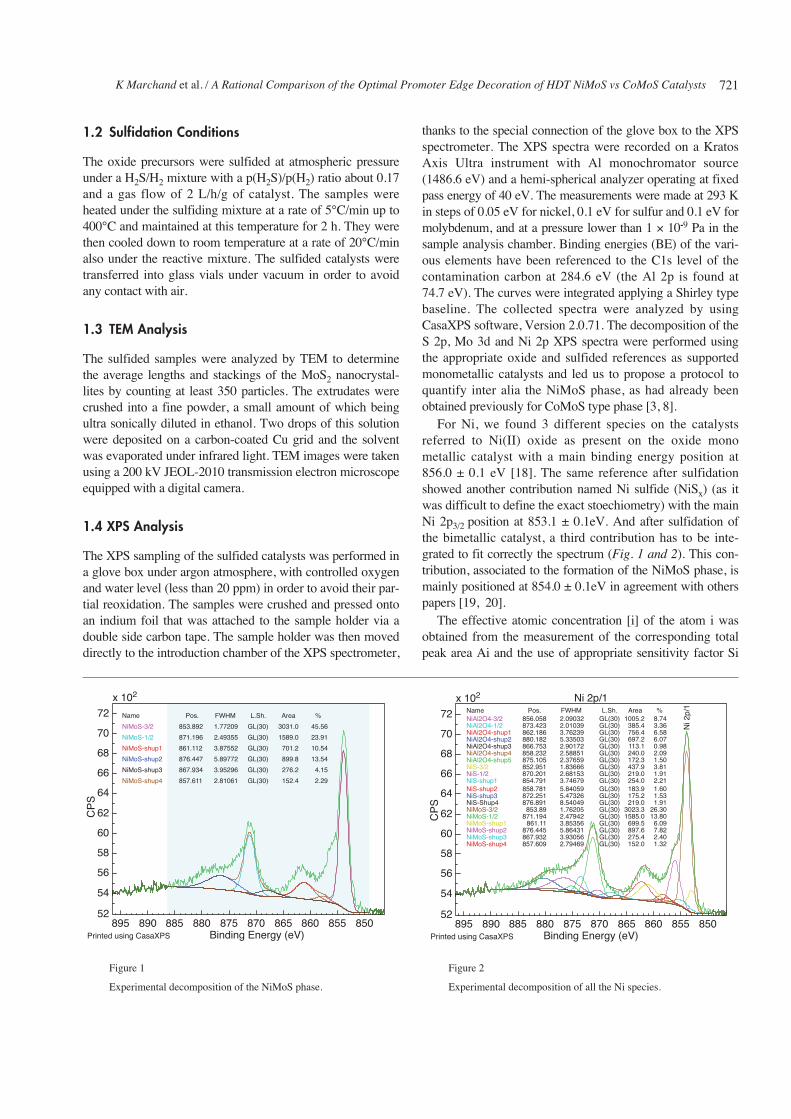
For Ni, we found 3 different species on the catalystsreferred to Ni(II) oxide as present on the oxide mono metallic catalyst with a main binding energy position at 856.0 ± 0.1 eV [18]. The same reference after sulfidationshowed another contribution named Ni sulfide (NiSx) (as itwas difficult to define the exact stoechiometry) with the mainNi 2p3/2 position at 853.1 ± 0.1eV. And after sulfidation ofthe bimetallic catalyst, a third contribution has to be inte-grated to fit correctly the spectrum (Fig. 1 and 2). This con-tribution, associated to the formation of the NiMoS phase, ismainly positioned at 854.0 ± 0.1eV in agreement with otherspapers [19, 20].
The effective atomic concentration [i] of the atom i wasobtained from the measurement of the corresponding totalpeak area Ai and the use of appropriate sensitivity factor Si
721
Name
NiMoS-3/2
NiMoS-1/2
NiMoS-shup1
NiMoS-shup2
NiMoS-shup3
NiMoS-shup4
Pos.
853.892
871.196
861.112
876.447
867.934
857.611
FWHM
1.77209
2.49355
3.87552
5.89772
3.95296
2.81061
L.Sh.
GL(30)
GL(30)
GL(30)
GL(30)
GL(30)
GL(30)
Area
3031.0
1589.0
701.2
899.8
276.2
152.4
%
45.56
23.91
10.54
13.54
��4.15
��2.29
850855860865870875880885890895
x 102
CP
S
52
72
70
68
66
64
62
60
58
56
54
Binding Energy (eV)Printed using CasaXPS
NameNiAl2O4-3/2NiAl2O4-1/2NiAl2O4-shup1
NiS-shup2
NiMoS-shup4
NiAl2O4-shup2NiAl2O4-shup3NiAl2O4-shup4NiAl2O4-shup5NiS-3/2NiS-1/2NiS-shup1
NiS-shup3NiS-Shup4NiMoS-3/2NiMoS-1/2NiMoS-shup1NiMoS-shup2NiMoS-shup3
Pos.856.058873.423862.186880.182866.753858.232875.105852.951870.201854.791858.781872.251876.891
853.89871.194
861.11876.445867.932857.609
FWHM2.090322.010393.762395.335032.901722.588512.376591.836662.681533.746795.840595.473268.540491.762052.479423.853565.864313.930562.79469
L.Sh.GL(30)GL(30)GL(30)GL(30)GL(30)GL(30)GL(30)GL(30)GL(30)GL(30)GL(30)GL(30)GL(30)GL(30)GL(30)GL(30)GL(30)GL(30)GL(30)
Area1005.2385.4756.4697.2113.1240.0172.3437.9219.0254.0183.9175.2219.0
3023.31585.0699.5897.6275.4152.0
%8.743.366.586.070.982.091.503.811.912.211.601.531.91
26.3013.80
6.097.822.401.32
850855860865870875880885890895
x 102
CP
S
52
72
70
68
66
64
62
60
58
56
54
Binding Energy (eV)
Ni 2p/1N
i 2p/
1
Printed using CasaXPS
Figure 1
Experimental decomposition of the NiMoS phase.
Figure 2
Experimental decomposition of all the Ni species.
Oil & Gas Science and Technology – Rev. IFP, Vol. 64 (2009), No. 6
furnished by the constructor. To approach the effectiveatomic surface concentrations, all the atoms (except the contamination carbon) detected on the surface were takeninto account (Eq. 1).
(1)
For one atom, the signal obtained can be decomposedinto different contributions relative to various chemicalspecies. The calculation of the respective contribution ofeach peak area will lead to the knowledge of the relativeproportion of each chemical form for a given atom. Forexample in the case of Ni atoms detected as Ni(II) oxide,NiMoS and Ni sulfide (NiSx), the relative amount inNiMoS phase is given Equation (2).
(2)
with ANiMoS, ANi(II) and ANiSx the experimental XPS area ofrespectively NiMoS, Ni (II) oxide and Ni sulfide species.
We may then deduce the effective amount of NiMoSphase noted [NiMoS] by multiplying the relative value withthe total Ni content [Ni] measured by XPS (Eq. 3).
[NiMoS] = % NiMoS × [Ni] (3)
Two samples have been analyzed for each catalyst and thedata presented in this paper correspond to the average valuesof both analysis. Figure 1 is the illustration of the NiMoSphase signal experimentally found, after deduction of themonometallic oxide and sulfide nickel. Figure 2 shows theexperimental XPS spectrum after complete decompositioninto the three species mentioned above.
1.5 Catalytic Measurements
The catalytic tests performed in this study were carried out ina fixed bed-high pressure flow microreactor under the fol-lowing conditions: 4 cm3 of length-selected extrudates (2-4 mm), a total pressure of 60 bar corresponding to p(H2S)= 2.15 bar, p(H2) = 36.9 bar, reaction temperature of 350°C,Liquid Hourly Space Velocity (LHSV) of 2 h-1, hydrogen-to-feed ratio of 450 L/L. The feed consists of a dimethyldisul-fide (5.9 wt%) and toluene (20 wt%) mixture in cyclohexane.After the unit was pressure-tested at room temperature, thetemperature was increased at 3°C/min to 350°C. Steady-stateconversion was measured after 2 h on stream. Reaction products were analyzed by on line gas chromatography. Theactivity in toluene-hydrogenation was expressed consideringa first-order reaction.
1.6 DFT Calculations for the MorphologyDetermination
The DFT results used in this work are presented in details inthe companion paper by Krebs et al. published in this issue[21] as well as in a previous paper [22]. Total energy calcula-tions are based on the plane wave density functional theorywithin the generalized gradient approximation [23, 24] andperiodic boundary conditions. For that, we used the Viennaab initio simulation package to solve the Kohn–Sham equa-tions within the Projected Augmented Wave (PAW) formal-ism [25]. All details on the methodology and approximations(cut-off energy, convergence criteria, cell’s size) are reportedin [22]. The main insights useful for the present work andtaken from these previous DFT calculations are the determination of the Gibbs-Curie-Wulff morphologies ofCo(Ni)MoS nano-crystallites as a function of HDT reactionsconditions and promoter content at the edges.
2 RESULTS
2.1 Quantification of the NiMoS and MoS2 PhasesUsing XPS and XRF
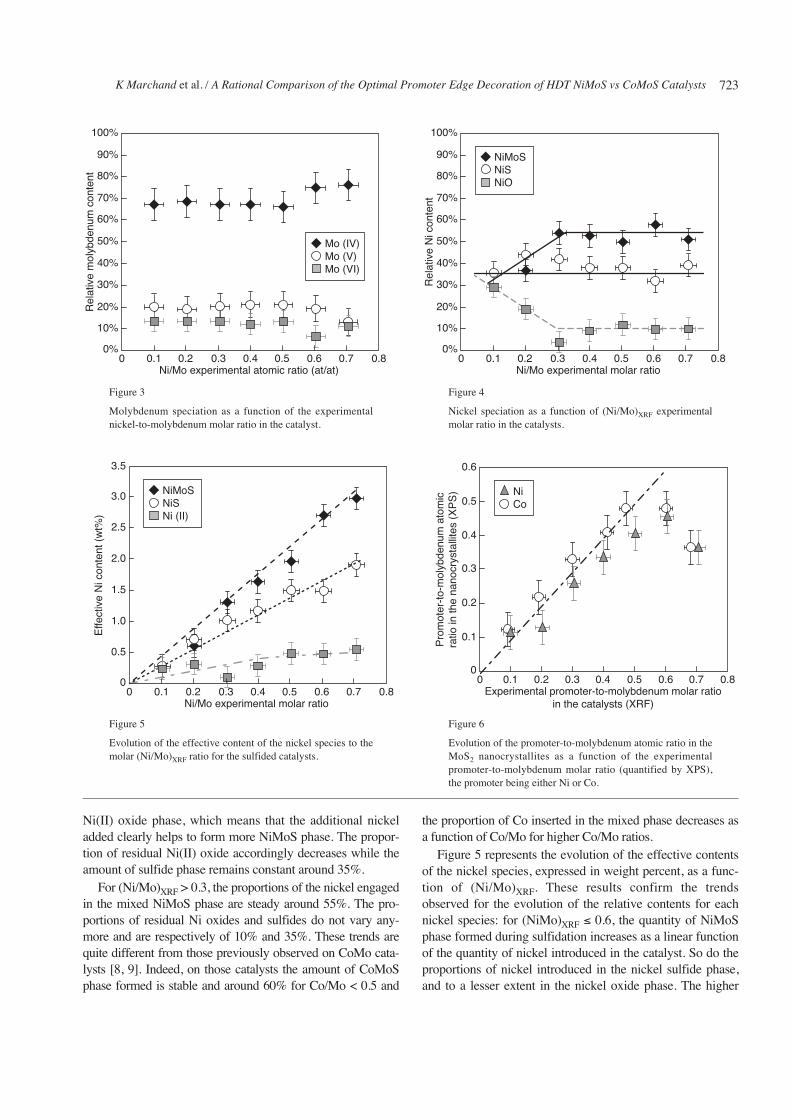
The Mo 3d spectra of sulfided catalysts were decomposedaccording to the methods described in [8, 3]. Three different oxidation degrees of molybdenum were found: VI (232.1 eV), V (230.1 eV), IV (228.7 eV); they wererespectively attributed to the oxide, oxisulfide and sulfidephases. The proportions of each phase have been reported as afunction of the experimental nickel-to-molybdenum molarratio in the catalyst (XRF) in Figure 3. As may be seen fromthat figure, the different amounts of nickel do not influencethe sulfurability of molybdenum: about 70% of the introducedmolybdenum are sulfided into MoS2 whereas about 10% arestill under their oxide form and 20% are defined as MoOxSy atan intermediate oxidation/sulfidation state. A similar trendwas found on cobalt catalysts in previous studies [8, 9].
Decompositions of Ni 2p spectra of sulfided catalystswere carried out as described in the experimental section. Inthe case of the nickel species, since the nickel contentsdeposited on alumina during the preparation of catalystsvary, it is easier in the first place to follow the evolution ofthe contents of the different nickel species expressed as a rel-ative percentage. Figure 4 depicts the evolution of the rela-tive contents of the nickel species, Ni(II), Ni sulfide and themixed NiMoS phase, as a function of the experimentalnickel-to-molybdenum molar ratio in the catalysts (XRF).
As expected, the variation of the experimental nickel-to-molybdenum molar ratio in the catalysts (denoted (NiMo)XRFfor the sake of clarity) clearly influences the nickel speciespresent at the surface of the sulfided catalysts.
For (Ni/Mo)XRF < 0.3, the results show a clear increase ofthe proportion of the NiMoS phase at the expense of the
% NiMoS = NiMoS
NiMoS Ni(II) NiS
A
A A A x+ +×100
i
A
S
S
A[ ]=
⎛
⎝⎜
⎞
⎠⎟
=
=
∑
i
ii
ii
i n
1
722
K Marchand et al. / A Rational Comparison of the Optimal Promoter Edge Decoration of HDT NiMoS vs CoMoS Catalysts
Ni(II) oxide phase, which means that the additional nickeladded clearly helps to form more NiMoS phase. The propor-tion of residual Ni(II) oxide accordingly decreases while theamount of sulfide phase remains constant around 35%.
For (Ni/Mo)XRF > 0.3, the proportions of the nickel engagedin the mixed NiMoS phase are steady around 55%. The pro-portions of residual Ni oxides and sulfides do not vary any-more and are respectively of 10% and 35%. These trends arequite different from those previously observed on CoMo cata-lysts [8, 9]. Indeed, on those catalysts the amount of CoMoSphase formed is stable and around 60% for Co/Mo < 0.5 and
the proportion of Co inserted in the mixed phase decreases asa function of Co/Mo for higher Co/Mo ratios.
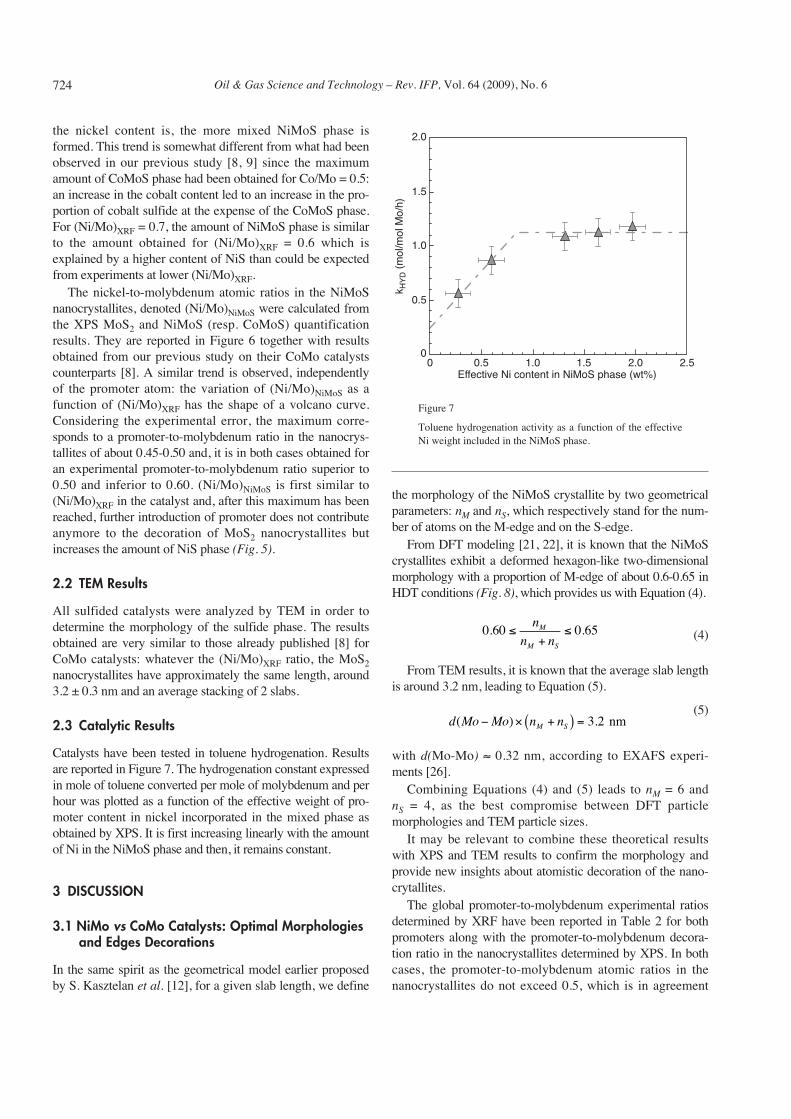
Figure 5 represents the evolution of the effective contentsof the nickel species, expressed in weight percent, as a func-tion of (Ni/Mo)XRF. These results confirm the trendsobserved for the evolution of the relative contents for eachnickel species: for (NiMo)XRF ≤ 0.6, the quantity of NiMoSphase formed during sulfidation increases as a linear functionof the quantity of nickel introduced in the catalyst. So do theproportions of nickel introduced in the nickel sulfide phase,and to a lesser extent in the nickel oxide phase. The higher
723
0.1 0.80.2 0.3 0.4 0.5 0.6 0.70
Rel
ativ
e m
olyb
denu
m c
onte
nt
100%
0%
10%
20%
30%
40%
50%
60%
70%
80%
90%
Ni/Mo experimental atomic ratio (at/at)
Mo (IV)Mo (V)Mo (VI)
0.1 0.80.2 0.3 0.4 0.5 0.6 0.70
Rel
ativ
e N
i con
tent
100%
0%
10%
20%
30%
40%
50%
60%
70%
80%
90%
Ni/Mo experimental molar ratio
NiMoSNiSNiO
Figure 3
Molybdenum speciation as a function of the experimentalnickel-to-molybdenum molar ratio in the catalyst.
Figure 4
Nickel speciation as a function of (Ni/Mo)XRF experimentalmolar ratio in the catalysts.
0.1 0.80.2 0.3 0.4 0.5 0.6 0.70
Effe
ctiv
e N
i con
tent
(w
t%)
3.5
0
3.0
2.5
2.0
1.5
1.0
0.5
Ni/Mo experimental molar ratio
NiMoSNiSNi (II)
0.80.1 0.2 0.3 0.4 0.5 0.6 0.70
Pro
mot
er-t
o-m
olyb
denu
m a
tom
icra
tio in
the
nano
crys
talli
tes
(XP
S)
0.6
0
0.1
0.2
0.3
0.4
0.5
Experimental promoter-to-molybdenum molar ratioin the catalysts (XRF)
NiCo
Figure 5
Evolution of the effective content of the nickel species to themolar (Ni/Mo)XRF ratio for the sulfided catalysts.
Figure 6
Evolution of the promoter-to-molybdenum atomic ratio in theMoS2 nanocrystallites as a function of the experimental promoter-to-molybdenum molar ratio (quantified by XPS),the promoter being either Ni or Co.
Oil & Gas Science and Technology – Rev. IFP, Vol. 64 (2009), No. 6
the nickel content is, the more mixed NiMoS phase isformed. This trend is somewhat different from what had beenobserved in our previous study [8, 9] since the maximumamount of CoMoS phase had been obtained for Co/Mo = 0.5:an increase in the cobalt content led to an increase in the pro-portion of cobalt sulfide at the expense of the CoMoS phase.For (Ni/Mo)XRF = 0.7, the amount of NiMoS phase is similarto the amount obtained for (Ni/Mo)XRF = 0.6 which isexplained by a higher content of NiS than could be expectedfrom experiments at lower (Ni/Mo)XRF.
The nickel-to-molybdenum atomic ratios in the NiMoSnanocrystallites, denoted (Ni/Mo)NiMoS were calculated fromthe XPS MoS2 and NiMoS (resp. CoMoS) quantificationresults. They are reported in Figure 6 together with resultsobtained from our previous study on their CoMo catalystscounterparts [8]. A similar trend is observed, independentlyof the promoter atom: the variation of (Ni/Mo)NiMoS as afunction of (Ni/Mo)XRF has the shape of a volcano curve.Considering the experimental error, the maximum corre-sponds to a promoter-to-molybdenum ratio in the nanocrys-tallites of about 0.45-0.50 and, it is in both cases obtained foran experimental promoter-to-molybdenum ratio superior to0.50 and inferior to 0.60. (Ni/Mo)NiMoS is first similar to(Ni/Mo)XRF in the catalyst and, after this maximum has beenreached, further introduction of promoter does not contributeanymore to the decoration of MoS2 nanocrystallites butincreases the amount of NiS phase (Fig. 5).
2.2 TEM Results
All sulfided catalysts were analyzed by TEM in order todetermine the morphology of the sulfide phase. The resultsobtained are very similar to those already published [8] forCoMo catalysts: whatever the (Ni/Mo)XRF ratio, the MoS2nanocrystallites have approximately the same length, around3.2 ± 0.3 nm and an average stacking of 2 slabs.
2.3 Catalytic Results
Catalysts have been tested in toluene hydrogenation. Resultsare reported in Figure 7. The hydrogenation constant expressedin mole of toluene converted per mole of molybdenum and perhour was plotted as a function of the effective weight of pro-moter content in nickel incorporated in the mixed phase asobtained by XPS. It is first increasing linearly with the amountof Ni in the NiMoS phase and then, it remains constant.
3 DISCUSSION
3.1 NiMo vs CoMo Catalysts: Optimal Morphologiesand Edges Decorations
In the same spirit as the geometrical model earlier proposedby S. Kasztelan et al. [12], for a given slab length, we define
Figure 7
Toluene hydrogenation activity as a function of the effectiveNi weight included in the NiMoS phase.
the morphology of the NiMoS crystallite by two geometricalparameters: nM and nS, which respectively stand for the num-ber of atoms on the M-edge and on the S-edge.
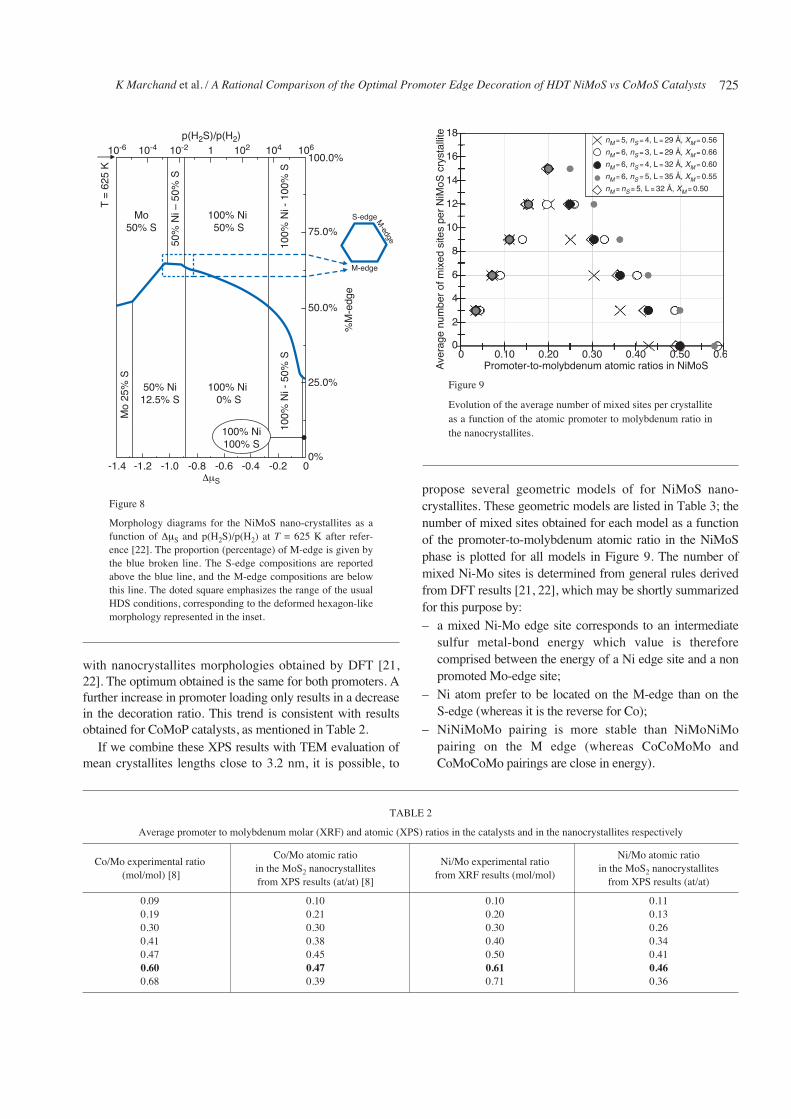
From DFT modeling [21, 22], it is known that the NiMoScrystallites exhibit a deformed hexagon-like two-dimensionalmorphology with a proportion of M-edge of about 0.6-0.65 inHDT conditions (Fig. 8), which provides us with Equation (4).
(4)
From TEM results, it is known that the average slab lengthis around 3.2 nm, leading to Equation (5).
(5)
with d(Mo-Mo) ≈ 0.32 nm, according to EXAFS experi-ments [26].
Combining Equations (4) and (5) leads to nM = 6 and nS = 4, as the best compromise between DFT particle morphologies and TEM particle sizes.
It may be relevant to combine these theoretical resultswith XPS and TEM results to confirm the morphology andprovide new insights about atomistic decoration of the nano-crytallites.
The global promoter-to-molybdenum experimental ratiosdetermined by XRF have been reported in Table 2 for bothpromoters along with the promoter-to-molybdenum decora-tion ratio in the nanocrystallites determined by XPS. In bothcases, the promoter-to-molybdenum atomic ratios in thenanocrystallites do not exceed 0.5, which is in agreement
d Mo Mo n nM S( ) . − × +( ) = 3 2 nm
0 60 0 65. .≤+
≤n
n nM
M S
2.52.01.51.00.50
k HY
D (
mol
/mol
Mo/
h)
2.0
0
0.5
1.0
1.5
Effective Ni content in NiMoS phase (wt%)
724
K Marchand et al. / A Rational Comparison of the Optimal Promoter Edge Decoration of HDT NiMoS vs CoMoS Catalysts
Figure 8
Morphology diagrams for the NiMoS nano-crystallites as afunction of ΔμS and p(H2S)/p(H2) at T = 625 K after refer-ence [22]. The proportion (percentage) of M-edge is given bythe blue broken line. The S-edge compositions are reportedabove the blue line, and the M-edge compositions are belowthis line. The doted square emphasizes the range of the usualHDS conditions, corresponding to the deformed hexagon-likemorphology represented in the inset.
with nanocrystallites morphologies obtained by DFT [21,22]. The optimum obtained is the same for both promoters. Afurther increase in promoter loading only results in a decreasein the decoration ratio. This trend is consistent with resultsobtained for CoMoP catalysts, as mentioned in Table 2.
If we combine these XPS results with TEM evaluation ofmean crystallites lengths close to 3.2 nm, it is possible, to
Figure 9
Evolution of the average number of mixed sites per crystalliteas a function of the atomic promoter to molybdenum ratio inthe nanocrystallites.
propose several geometric models of for NiMoS nano-crystallites. These geometric models are listed in Table 3; thenumber of mixed sites obtained for each model as a functionof the promoter-to-molybdenum atomic ratio in the NiMoSphase is plotted for all models in Figure 9. The number ofmixed Ni-Mo sites is determined from general rules derivedfrom DFT results [21, 22], which may be shortly summarizedfor this purpose by: – a mixed Ni-Mo edge site corresponds to an intermediate
sulfur metal-bond energy which value is therefore comprised between the energy of a Ni edge site and a nonpromoted Mo-edge site;
– Ni atom prefer to be located on the M-edge than on the S-edge (whereas it is the reverse for Co);
– NiNiMoMo pairing is more stable than NiMoNiMo pairing on the M edge (whereas CoCoMoMo andCoMoCoMo pairings are close in energy).
0.60.500.400.300.200.100
Ave
rage
num
ber
of m
ixed
site
s pe
r N
iMoS
cry
stal
lite 18
0
16
14
12
10
8
6
4
2
Promoter-to-molybdenum atomic ratios in NiMoS
nM = 5, nS = 4, L = 29 Å, XM = 0.56
nM = 6, nS = 3, L = 29 Å, XM = 0.66
nM = 6, nS = 4, L = 32 Å, XM = 0.60
nM = 6, nS = 5, L = 35 Å, XM = 0.55
nM = nS = 5, L = 32 Å, XM = 0.50
T =
625
K
50%
Ni –
50%
S
Mo
25%
S
100%
Ni -
50%
S10
0% N
i - 1
00%
S
M-edge
M-edge
S-edge
%M
-edg
e
Mo50% S
100% Ni 50% S
100% Ni 0% S
50% Ni12.5% S
-0.6 0-0.4 -0.2
10-410-6 10-2 1 102 104 106
-1.4
75.0%
50.0%
25.0%
0%
100.0%
ΔμS
p(H2S)/p(H2)
-0.8-1.0-1.2
100% Ni100% S
725
TABLE 2
Average promoter to molybdenum molar (XRF) and atomic (XPS) ratios in the catalysts and in the nanocrystallites respectively
Co/Mo experimental ratioCo/Mo atomic ratio
Ni/Mo experimental ratio Ni/Mo atomic ratio
(mol/mol) [8]in the MoS2 nanocrystallites
from XRF results (mol/mol)in the MoS2 nanocrystallites
from XPS results (at/at) [8] from XPS results (at/at)
0.09 0.10 0.10 0.110.19 0.21 0.20 0.130.30 0.30 0.30 0.260.41 0.38 0.40 0.340.47 0.45 0.50 0.410.60 0.47 0.61 0.460.68 0.39 0.71 0.36
Oil & Gas Science and Technology – Rev. IFP, Vol. 64 (2009), No. 6
XPS measurements indicated that the highest promoter-to-molybdenum atomic ratio in the NiMoS crystallites was 0.47and this is compatible with two geometric models obeyingthis criterion: either a hexagonal model nM = nS = 5 or aslightly deformed hexagon model with nM = 6 and nS = 4.Hence, It is hard to make a choice without the help of DFTmodeling. Indeed, both models fit according to TEM andXPS and the only criterion in favor of the truncated trianglemodel it conditions (Tab. 3).
3.2 Impact of the Promoter-to-molybdenum AtomicRatio in the Nanocrystallites on TolueneHydrogenation Performances
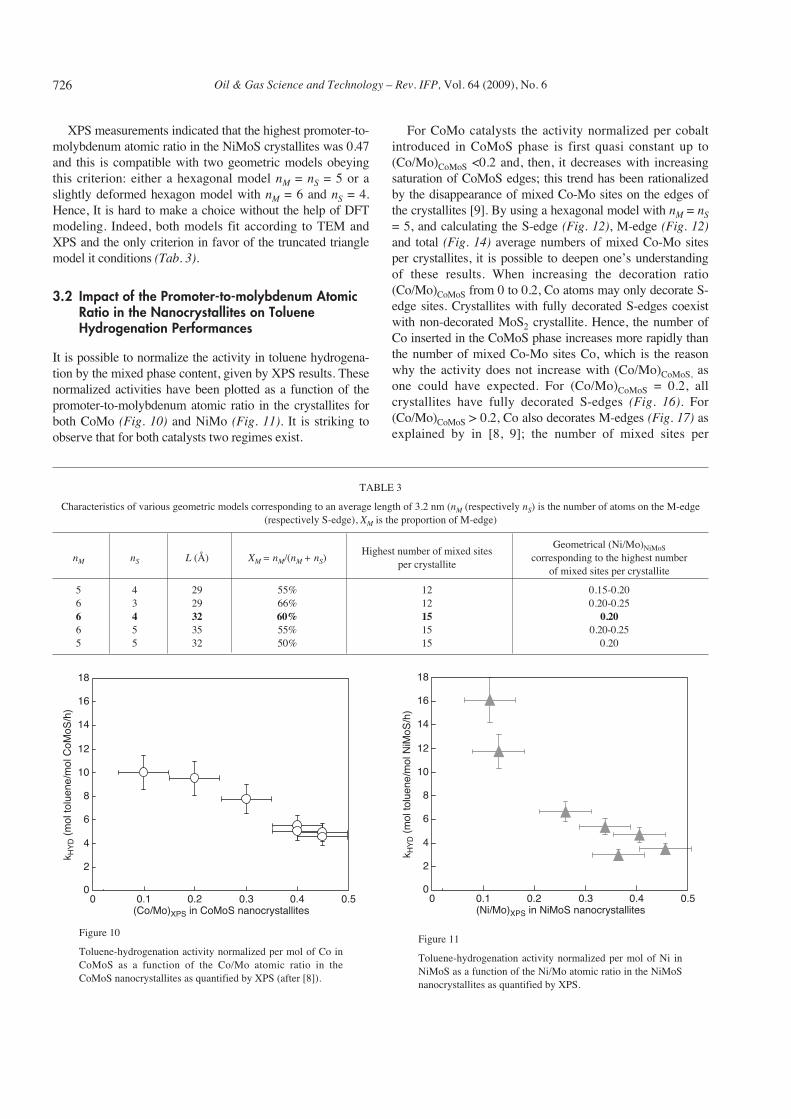
It is possible to normalize the activity in toluene hydrogena-tion by the mixed phase content, given by XPS results. Thesenormalized activities have been plotted as a function of thepromoter-to-molybdenum atomic ratio in the crystallites forboth CoMo (Fig. 10) and NiMo (Fig. 11). It is striking toobserve that for both catalysts two regimes exist.
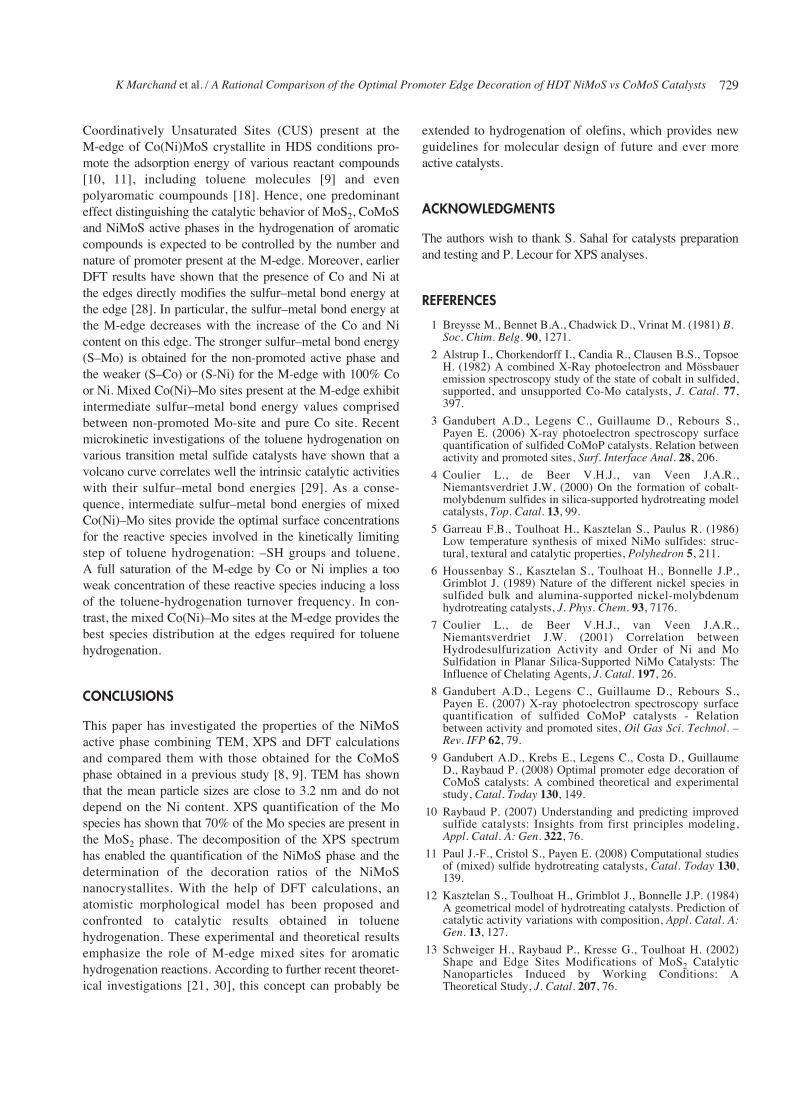
For CoMo catalysts the activity normalized per cobaltintroduced in CoMoS phase is first quasi constant up to(Co/Mo)CoMoS <0.2 and, then, it decreases with increasingsaturation of CoMoS edges; this trend has been rationalizedby the disappearance of mixed Co-Mo sites on the edges ofthe crystallites [9]. By using a hexagonal model with nM = nS= 5, and calculating the S-edge (Fig. 12), M-edge (Fig. 12)and total (Fig. 14) average numbers of mixed Co-Mo sitesper crystallites, it is possible to deepen one’s understandingof these results. When increasing the decoration ratio(Co/Mo)CoMoS from 0 to 0.2, Co atoms may only decorate S-edge sites. Crystallites with fully decorated S-edges coexistwith non-decorated MoS2 crystallite. Hence, the number ofCo inserted in the CoMoS phase increases more rapidly thanthe number of mixed Co-Mo sites Co, which is the reasonwhy the activity does not increase with (Co/Mo)CoMoS, as one could have expected. For (Co/Mo)CoMoS = 0.2, all crystallites have fully decorated S-edges (Fig. 16). For(Co/Mo)CoMoS > 0.2, Co also decorates M-edges (Fig. 17) asexplained by in [8, 9]; the number of mixed sites per
726
0.50.1 0.2 0.3 0.40
k HY
D (
mol
tolu
ene/
mol
CoM
oS/h
)
18
0
16
14
12
10
8
6
4
2
(Co/Mo)XPS in CoMoS nanocrystallites
Figure 10
Toluene-hydrogenation activity normalized per mol of Co inCoMoS as a function of the Co/Mo atomic ratio in theCoMoS nanocrystallites as quantified by XPS (after [8]).
0.50.1 0.2 0.3 0.40
k HY
D (
mol
tolu
ene/
mol
NiM
oS/h
)
18
0
16
14
12
10
8
6
4
2
(Ni/Mo)XPS in NiMoS nanocrystallites
Figure 11
Toluene-hydrogenation activity normalized per mol of Ni inNiMoS as a function of the Ni/Mo atomic ratio in the NiMoSnanocrystallites as quantified by XPS.
TABLE 3
Characteristics of various geometric models corresponding to an average length of 3.2 nm (nM (respectively nS) is the number of atoms on the M-edge(respectively S-edge), XM is the proportion of M-edge)
Highest number of mixed sites Geometrical (Ni/Mo)NiMoS
nM nS L (Å) XM = nM/(nM + nS) per crystallitecorresponding to the highest number
of mixed sites per crystallite
5 4 29 55% 12 0.15-0.206 3 29 66% 12 0.20-0.256 4 32 60% 15 0.206 5 35 55% 15 0.20-0.255 5 32 50% 15 0.20
K Marchand et al. / A Rational Comparison of the Optimal Promoter Edge Decoration of HDT NiMoS vs CoMoS Catalysts
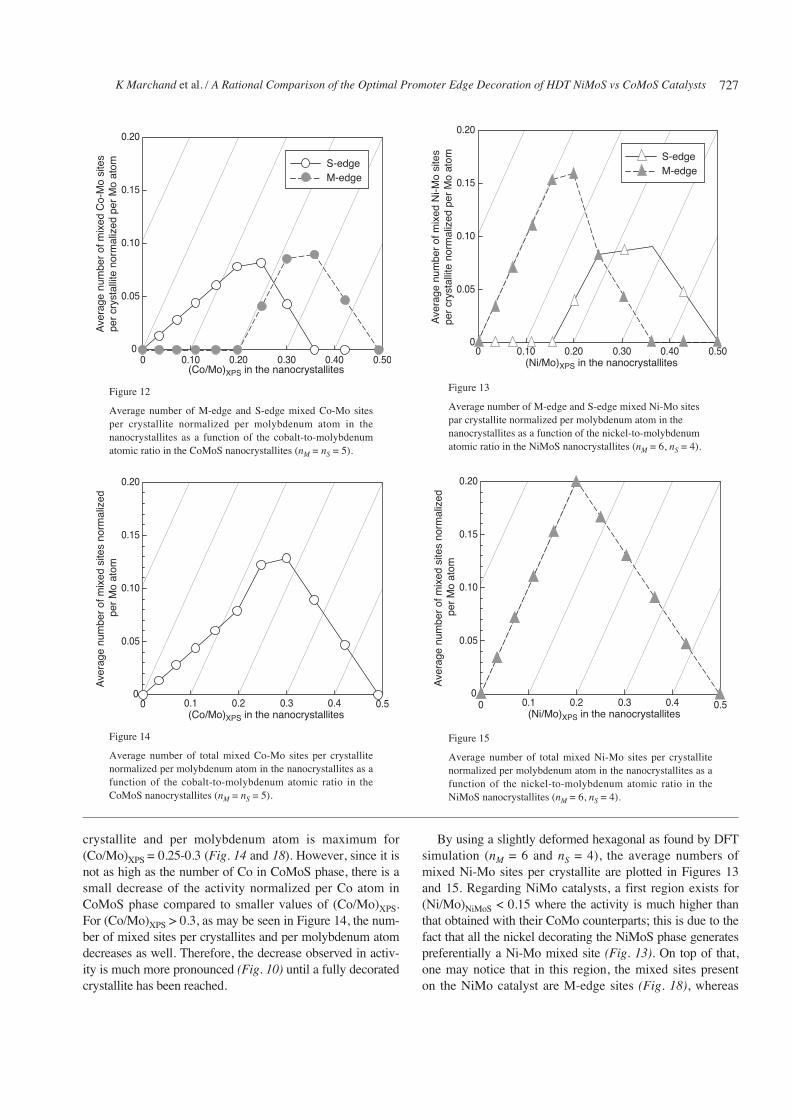
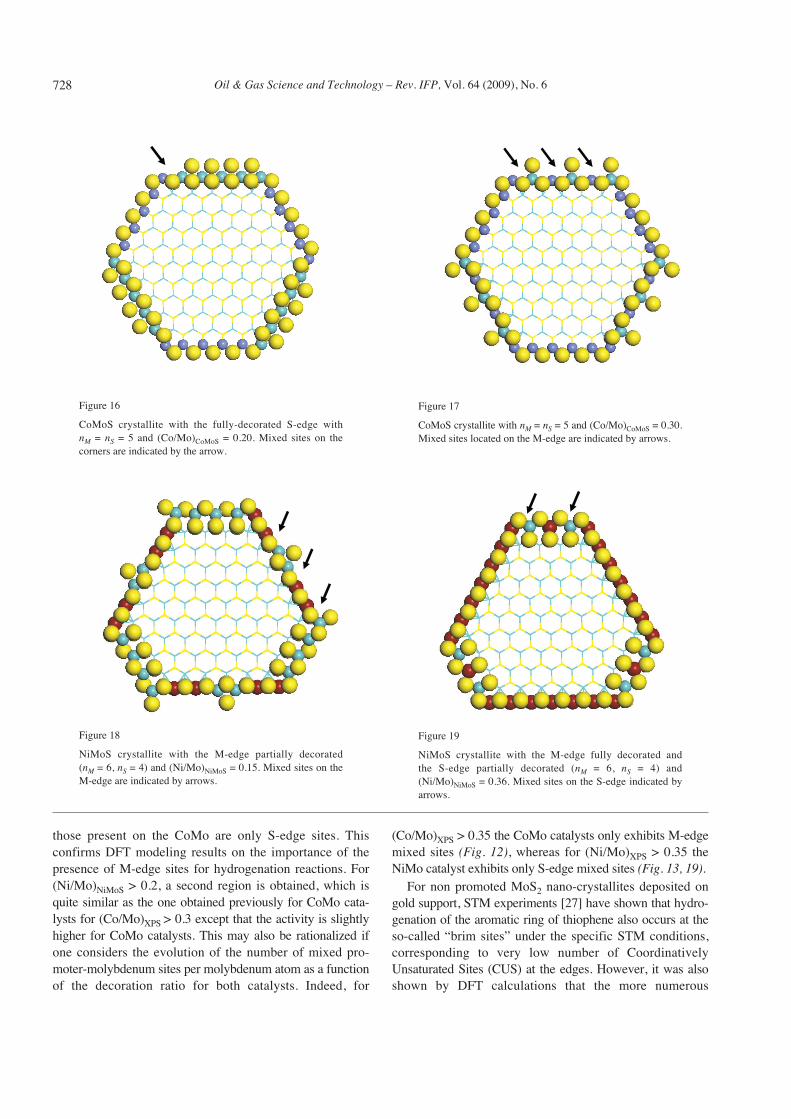
crystallite and per molybdenum atom is maximum for(Co/Mo)XPS = 0.25-0.3 (Fig. 14 and 18). However, since it isnot as high as the number of Co in CoMoS phase, there is asmall decrease of the activity normalized per Co atom inCoMoS phase compared to smaller values of (Co/Mo)XPS.For (Co/Mo)XPS > 0.3, as may be seen in Figure 14, the num-ber of mixed sites per crystallites and per molybdenum atomdecreases as well. Therefore, the decrease observed in activ-ity is much more pronounced (Fig. 10) until a fully decoratedcrystallite has been reached.
By using a slightly deformed hexagonal as found by DFTsimulation (nM = 6 and nS = 4), the average numbers ofmixed Ni-Mo sites per crystallite are plotted in Figures 13and 15. Regarding NiMo catalysts, a first region exists for(Ni/Mo)NiMoS < 0.15 where the activity is much higher thanthat obtained with their CoMo counterparts; this is due to thefact that all the nickel decorating the NiMoS phase generatespreferentially a Ni-Mo mixed site (Fig. 13). On top of that,one may notice that in this region, the mixed sites present on the NiMo catalyst are M-edge sites (Fig. 18), whereas
727
0.50.40.30.20.10
Ave
rage
num
ber
of m
ixed
site
s no
rmal
ized
per
Mo
atom
0.20
0
0.05
0.10
0.15
(Co/Mo)XPS in the nanocrystallites
Figure 14
Average number of total mixed Co-Mo sites per crystallitenormalized per molybdenum atom in the nanocrystallites as afunction of the cobalt-to-molybdenum atomic ratio in theCoMoS nanocrystallites (nM = nS = 5).
0.50.40.30.20.10
Ave
rage
num
ber
of m
ixed
site
s no
rmal
ized
per
Mo
atom
0.20
0
0.05
0.10
0.15
(Ni/Mo)XPS in the nanocrystallites
Figure 15
Average number of total mixed Ni-Mo sites per crystallitenormalized per molybdenum atom in the nanocrystallites as afunction of the nickel-to-molybdenum atomic ratio in theNiMoS nanocrystallites (nM = 6, nS = 4).
0.500.400.300.200.100
Ave
rage
num
ber
of m
ixed
Co-
Mo
site
spe
r cr
ysta
llite
nor
mal
ized
per
Mo
atom
0.20
0
0.15
0.10
0.05
(Co/Mo)XPS in the nanocrystallites
S-edgeM-edge
Figure 12
Average number of M-edge and S-edge mixed Co-Mo sitesper crystallite normalized per molybdenum atom in thenanocrystallites as a function of the cobalt-to-molybdenumatomic ratio in the CoMoS nanocrystallites (nM = nS = 5).
0.500.400.300.200.100
Ave
rage
num
ber
of m
ixed
Ni-M
o si
tes
per
crys
talli
te n
orm
aliz
ed p
er M
o at
om
0.20
0
0.15
0.10
0.05
(Ni/Mo)XPS in the nanocrystallites
S-edgeM-edge
Figure 13
Average number of M-edge and S-edge mixed Ni-Mo sitespar crystallite normalized per molybdenum atom in thenanocrystallites as a function of the nickel-to-molybdenumatomic ratio in the NiMoS nanocrystallites (nM = 6, nS = 4).
Oil & Gas Science and Technology – Rev. IFP, Vol. 64 (2009), No. 6
those present on the CoMo are only S-edge sites. This confirms DFT modeling results on the importance of thepresence of M-edge sites for hydrogenation reactions. For(Ni/Mo)NiMoS > 0.2, a second region is obtained, which isquite similar as the one obtained previously for CoMo cata-lysts for (Co/Mo)XPS > 0.3 except that the activity is slightlyhigher for CoMo catalysts. This may also be rationalized ifone considers the evolution of the number of mixed pro-moter-molybdenum sites per molybdenum atom as a functionof the decoration ratio for both catalysts. Indeed, for
(Co/Mo)XPS > 0.35 the CoMo catalysts only exhibits M-edgemixed sites (Fig. 12), whereas for (Ni/Mo)XPS > 0.35 theNiMo catalyst exhibits only S-edge mixed sites (Fig. 13, 19).
For non promoted MoS2 nano-crystallites deposited ongold support, STM experiments [27] have shown that hydro-genation of the aromatic ring of thiophene also occurs at theso-called “brim sites” under the specific STM conditions,corresponding to very low number of CoordinativelyUnsaturated Sites (CUS) at the edges. However, it was alsoshown by DFT calculations that the more numerous
728
Figure 16
CoMoS crystallite with the fully-decorated S-edge with nM = nS = 5 and (Co/Mo)CoMoS = 0.20. Mixed sites on the corners are indicated by the arrow.
Figure 17
CoMoS crystallite with nM = nS = 5 and (Co/Mo)CoMoS = 0.30.Mixed sites located on the M-edge are indicated by arrows.
Figure 18
NiMoS crystallite with the M-edge partially decorated (nM = 6, nS = 4) and (Ni/Mo)NiMoS = 0.15. Mixed sites on theM-edge are indicated by arrows.
Figure 19
NiMoS crystallite with the M-edge fully decorated and the S-edge partially decorated (nM = 6, nS = 4) and (Ni/Mo)NiMoS = 0.36. Mixed sites on the S-edge indicated byarrows.
K Marchand et al. / A Rational Comparison of the Optimal Promoter Edge Decoration of HDT NiMoS vs CoMoS Catalysts
Coordinatively Unsaturated Sites (CUS) present at the M-edge of Co(Ni)MoS crystallite in HDS conditions pro-mote the adsorption energy of various reactant compounds[10, 11], including toluene molecules [9] and even polyaromatic coumpounds [18]. Hence, one predominanteffect distinguishing the catalytic behavior of MoS2, CoMoSand NiMoS active phases in the hydrogenation of aromaticcompounds is expected to be controlled by the number andnature of promoter present at the M-edge. Moreover, earlierDFT results have shown that the presence of Co and Ni atthe edges directly modifies the sulfur–metal bond energy atthe edge [28]. In particular, the sulfur–metal bond energy atthe M-edge decreases with the increase of the Co and Nicontent on this edge. The stronger sulfur–metal bond energy(S–Mo) is obtained for the non-promoted active phase andthe weaker (S–Co) or (S-Ni) for the M-edge with 100% Coor Ni. Mixed Co(Ni)–Mo sites present at the M-edge exhibitintermediate sulfur–metal bond energy values comprisedbetween non-promoted Mo-site and pure Co site. Recentmicrokinetic investigations of the toluene hydrogenation onvarious transition metal sulfide catalysts have shown that avolcano curve correlates well the intrinsic catalytic activitieswith their sulfur–metal bond energies [29]. As a conse-quence, intermediate sulfur–metal bond energies of mixedCo(Ni)–Mo sites provide the optimal surface concentrationsfor the reactive species involved in the kinetically limitingstep of toluene hydrogenation: –SH groups and toluene. A full saturation of the M-edge by Co or Ni implies a tooweak concentration of these reactive species inducing a lossof the toluene-hydrogenation turnover frequency. In con-trast, the mixed Co(Ni)–Mo sites at the M-edge provides thebest species distribution at the edges required for toluenehydrogenation.
CONCLUSIONS
This paper has investigated the properties of the NiMoSactive phase combining TEM, XPS and DFT calculationsand compared them with those obtained for the CoMoSphase obtained in a previous study [8, 9]. TEM has shownthat the mean particle sizes are close to 3.2 nm and do notdepend on the Ni content. XPS quantification of the Mospecies has shown that 70% of the Mo species are present inthe MoS2 phase. The decomposition of the XPS spectrumhas enabled the quantification of the NiMoS phase and thedetermination of the decoration ratios of the NiMoSnanocrystallites. With the help of DFT calculations, anatomistic morphological model has been proposed and confronted to catalytic results obtained in toluene hydrogenation. These experimental and theoretical resultsemphasize the role of M-edge mixed sites for aromatichydrogenation reactions. According to further recent theoret-ical investigations [21, 30], this concept can probably be
extended to hydrogenation of olefins, which provides newguidelines for molecular design of future and ever moreactive catalysts.
ACKNOWLEDGMENTS
The authors wish to thank S. Sahal for catalysts preparationand testing and P. Lecour for XPS analyses.
REFERENCES
1 Breysse M., Bennet B.A., Chadwick D., Vrinat M. (1981) B.Soc. Chim. Belg. 90, 1271.
2 Alstrup I., Chorkendorff I., Candia R., Clausen B.S., TopsoeH. (1982) A combined X-Ray photoelectron and Mössbaueremission spectroscopy study of the state of cobalt in sulfided,supported, and unsupported Co-Mo catalysts, J. Catal. 77,397.
3 Gandubert A.D., Legens C., Guillaume D., Rebours S.,Payen E. (2006) X-ray photoelectron spectroscopy surfacequantification of sulfided CoMoP catalysts. Relation betweenactivity and promoted sites, Surf. Interface Anal. 28, 206.
4 Coulier L., de Beer V.H.J., van Veen J.A.R.,Niemantsverdriet J.W. (2000) On the formation of cobalt-molybdenum sulfides in silica-supported hydrotreating modelcatalysts, Top. Catal. 13, 99.
5 Garreau F.B., Toulhoat H., Kasztelan S., Paulus R. (1986)Low temperature synthesis of mixed NiMo sulfides: struc-tural, textural and catalytic properties, Polyhedron 5, 211.
6 Houssenbay S., Kasztelan S., Toulhoat H., Bonnelle J.P.,Grimblot J. (1989) Nature of the different nickel species insulfided bulk and alumina-supported nickel-molybdenumhydrotreating catalysts, J. Phys. Chem. 93, 7176.
7 Coulier L., de Beer V.H.J., van Veen J.A.R.,Niemantsverdriet J.W. (2001) Correlation betweenHydrodesulfurization Activity and Order of Ni and MoSulfidation in Planar Silica-Supported NiMo Catalysts: TheInfluence of Chelating Agents, J. Catal. 197, 26.
8 Gandubert A.D., Legens C., Guillaume D., Rebours S.,Payen E. (2007) X-ray photoelectron spectroscopy surfacequantification of sulfided CoMoP catalysts - Relationbetween activity and promoted sites, Oil Gas Sci. Technol. –Rev. IFP 62, 79.
9 Gandubert A.D., Krebs E., Legens C., Costa D., GuillaumeD., Raybaud P. (2008) Optimal promoter edge decoration ofCoMoS catalysts: A combined theoretical and experimentalstudy, Catal. Today 130, 149.
10 Raybaud P. (2007) Understanding and predicting improvedsulfide catalysts: Insights from first principles modeling,Appl. Catal. A: Gen. 322, 76.
11 Paul J.-F., Cristol S., Payen E. (2008) Computational studiesof (mixed) sulfide hydrotreating catalysts, Catal. Today 130,139.
12 Kasztelan S., Toulhoat H., Grimblot J., Bonnelle J.P. (1984)A geometrical model of hydrotreating catalysts. Prediction ofcatalytic activity variations with composition, Appl. Catal. A:Gen. 13, 127.
13 Schweiger H., Raybaud P., Kresse G., Toulhoat H. (2002)Shape and Edge Sites Modifications of MoS2 CatalyticNanoparticles Induced by Working Conditions: ATheoretical Study, J. Catal. 207, 76.
729
Oil & Gas Science and Technology – Rev. IFP, Vol. 64 (2009), No. 6
14 Schweiger H., Raybaud P., Toulhoat H. (2002) Promoter sen-sitive shapes of Co(Ni)MoS nanocatalysts in sulfo-reductiveconditions, J. Catal. 212, 33.
15 Byskov L.S., Hammer B., Nørskov J.K., Clausen B.S.,Topsøe H. (1997) Sulfur bonding in MoS2 and Co-Mo-Sstructures, Catal. Lett. 47, 177.
16 Lauritsen J.V., Nyberg M., Nørskov J.K., Clausen B.S.,Topsøe H., Lægsgaard E., Besenbacher F. (2004)Hydrodesulfurization reaction pathways on MoS2 nanoclustersrevealed by scanning tunneling microscopy, J. Catal. 224, 94.
17 Griboval A., Blanchard P., Payen E., Fournier M., DuboisJ.L. (1998) Alumina supported HDS catalysts prepared byimpregnation with new heteropolycompounds. Comparisonwith catalysts prepared by conventional Co–Mo–P coimpreg-nation, Catal. Today 45, 277.
18 Guichard B., Roy-Auberger M., Devers E., Legens C.,Raybaud P. (2008) Aging of Co(Ni)MoP/Al2O3 catalysts inworking state, Catal. Today 130, 97.
19 Wang X., Saleh R.Y., Ozkan U.S. (2005) Effect of S-com-pounds and CO on hydrogenation of aldehydes over reducedand sulfided Ni–Mo/Al2O3 catalysts, Appl. Catal. A: Gen.286, 111.
20 Escobar J., Barrera M.C., Toledo J.A., Cortés-Jácome M.A.,Angeles-Chávez C., Núñez S., Santes V., Gómez E., Díaz L.,Romero E., Pacheco J.G. (2009) Effect of ethyleneglycoladdition on the properties of P-doped NiMo/Al2O3 HDS cat-alysts: Part I. Materials preparation and characterization,Appl. Catal. B: Environ. 88, 564.
21 Krebs E., Daudin A., Raybaud P. (2009) A DFT Study ofCoMoS and NiMoS Catalysts: from nano-crystallite mor-phology to selective hydrodesulfurization, Oil Gas Sci.Technol. – Rev. IFP (this issue), DOI: 10.2516/ogst/2009004.
22 Krebs E., Silvi B., Raybaud P. (2007) Mixed sites and pro-moter segregation: A DFT study of the manifestation of LeChatelier’s principle for the Co(Ni)MoS active phase in reac-tion conditions, Catal. Today 130, 160.
23 Kohn W., Sham L.J. (1965) Self-Consistent EquationsIncluding Exchange and Correlation Effects, Phys. Rev. A140, 1133.
24 Perdew J.P., Wang Y. (1992) Accurate and simple analyticrepresentation of the electron-gas correlation energy, Phys.Rev. B 45, 13244.
25 Kresse G., Furthmüller J. (1996) Efficiency of ab-initio totalenergy calculations for metals and semiconductors using aplanewave basis set, Comput. Mater. Sci. 6, 15.
26 Lauritsen J.V., Kibsgaard J., Olesen G.H., Moses P.G.,Hinnemann B., Helveg S., Norskøv J.K., Clausen B.S.,Topsøe H., Lægsgaard E., Besenbacher F. (2007) Locationand coordination of promoter atoms in Co- and Ni-promotedMoS2-based hydrotreating catalysts, J. Catal. 249, 220.
27 Lauritsen J.V., Nyberg M., Vang R.T., Bollinger M.V.,Clausen B.S., Topsoe H., Jacobsen K.W., Laegsgaard E.,Norskov J.K., Besenbacher F. (2003) Chemistry of one-dimensional metallic edge states in MoS2 nanoclusters,Nanotechnology 14, 385.
28 Raybaud P., Hafner J., Kresse G., Kasztelan S., Toulhoat H.(2000) Structure, Energetics, and Electronic Properties of theSurface of a Promoted MoS2 Catalyst: An ab Initio LocalDensity Functional Study, J. Catal. 190, 128.
29 Guernalec N., Geantet C., Raybaud P., Cseri T., Aouine M.,Vrinat M. (2006) Dual Effect of H2S on Volcano Curves inHydrotreating Sulfide Catalysis, Oil Gas Sci. Technol. – Rev.IFP 61, 515.
30 Krebs E., Silvi B., Daudin A., Raybaud P. (2008) A DFTstudy of the origin of the HDS/HydO selectivity onCo(Ni)MoS active phases, J. Catal. 260, 276.
Final manuscript received in June 2009Published online in September 2009
730
Copyright © 2009 Institut français du pétrolePermission to make digital or hard copies of part or all of this work for personal or classroom use is granted without fee provided that copies are not madeor distributed for profit or commercial advantage and that copies bear this notice and the full citation on the first page. Copyrights for components of thiswork owned by others than IFP must be honored. Abstracting with credit is permitted. To copy otherwise, to republish, to post on servers, or to redistributeto lists, requires prior specific permission and/or a fee: Request permission from Documentation, Institut français du pétrole, fax. +33 1 47 52 70 78, or [email protected].


![Graph Edge Coloring: Tashkinov Trees and Goldberg’s … · Graph Edge Coloring: Tashkinov Trees and Goldberg’s Conjecture ... [13, 14] a simple but very ... tional edge coloring](https://static.fdocument.org/doc/165x107/5af8fa657f8b9aac248dd47f/graph-edge-coloring-tashkinov-trees-and-goldbergs-edge-coloring-tashkinov.jpg)