A proposal for experiments at the SABER facility€¦ · · 2006-11-09A proposal for experiments...
26
E-169 Page 1 of 26 E-169: Wakefield Acceleration in Dielectric Structures A proposal for experiments at the SABER facility H. Badakov α , M. Berry β , I. Blumenfeld β , A. Cook α , F.-J. Decker β , M. J. Hogan β* , R. Ischebeck β , R. Iverson β , A. Kanareykin ε , N. Kirby β , P. Muggli γ* , J.B. Rosenzweig α* , R. Siemann β , M.C. Thompson δ , R. Tikhoplav α , G. Travish α* , D. Walz β α Department of Physics and Astronomy, University of California, Los Angeles β Stanford Linear Accelerator Center γ University of Southern California δ Lawrence Livermore National Laboratory ε Euclid TechLabs, LLC * Spokesperson 1 Introduction The set of accelerator physics concepts and technologies used to create high-energy colliders are now mature, and successful at its mission: allowing particle physics discoveries at the energy frontier. It is, however, widely perceived that the future prospects for the continued health of accelerator-based particle physics in the TeV region are dependent on going past the approaches to accelerators that have defined the state-of- the-art to this point. The centrality and urgency of developing new acceleration concepts was stated in the recent report from the HEPAP Subpanel on Assessment of Advanced Accelerator Research and Development in the US [1]: “A major challenge for the accelerator science community is to identify and develop new concepts for future energy frontier accelerators that will be able to provide the exploration tools needed for HEP within a feasible cost to society. The future of accelerator-based HEP will be limited unless new ideas and new accelerator directions are developed to address the demands of beam energy and luminosity and consequently the management of beam power, energy recovery, accelerator power, size, and cost. ” Indeed, in the panel report the dramatic recent progress in very high gradient accelerators based on new concepts is highlighted, with support of this research strongly recom- mended. Advanced accelerators have produced notable results within the past few years including multi-GeV/m gradients from plasma wakefield [2], and various laser-based accelerators [3]. The key insight which explains the success of recent plasma wakefield acceleration experiments is that the shorter the beam, the higher the fields obtainable from wake excitation. This observation applies equally well to the excitation of Cerenkov wakes in dielectric structures, as seen from the approximate expression for the decelerating field in the structure shown in Fig. 1, a dielectric wakefield accelerator (DWA):
Transcript of A proposal for experiments at the SABER facility€¦ · · 2006-11-09A proposal for experiments...
E-169 Page 1 of 26
E-169: Wakefield Acceleration in Dielectric Structures
A proposal for experiments at the SABER facility
H. Badakovα, M. Berryβ, I. Blumenfeldβ, A. Cookα, F.-J. Deckerβ, M. J. Hoganβ*, R. Ischebeckβ, R. Iversonβ, A. Kanareykinε, N. Kirbyβ, P. Muggliγ*, J.B. Rosenzweigα*,
R. Siemannβ, M.C. Thompsonδ, R. Tikhoplavα, G. Travishα*, D. Walzβ αDepartment of Physics and Astronomy, University of California, Los Angeles
βStanford Linear Accelerator Center γUniversity of Southern California
δLawrence Livermore National Laboratory εEuclid TechLabs, LLC
*Spokesperson
1 Introduction The set of accelerator physics concepts and technologies used to create high-energy colliders are now mature, and successful at its mission: allowing particle physics discoveries at the energy frontier. It is, however, widely perceived that the future prospects for the continued health of accelerator-based particle physics in the TeV region are dependent on going past the approaches to accelerators that have defined the state-of-the-art to this point. The centrality and urgency of developing new acceleration concepts was stated in the recent report from the HEPAP Subpanel on Assessment of Advanced Accelerator Research and Development in the US [1]:
“A major challenge for the accelerator science community is to identify and develop new concepts for future energy frontier accelerators that will be able to provide the exploration tools needed for HEP within a feasible cost to society. The future of accelerator-based HEP will be limited unless new ideas and new accelerator directions are developed to address the demands of beam energy and luminosity and consequently the management of beam power, energy recovery, accelerator power, size, and cost.”
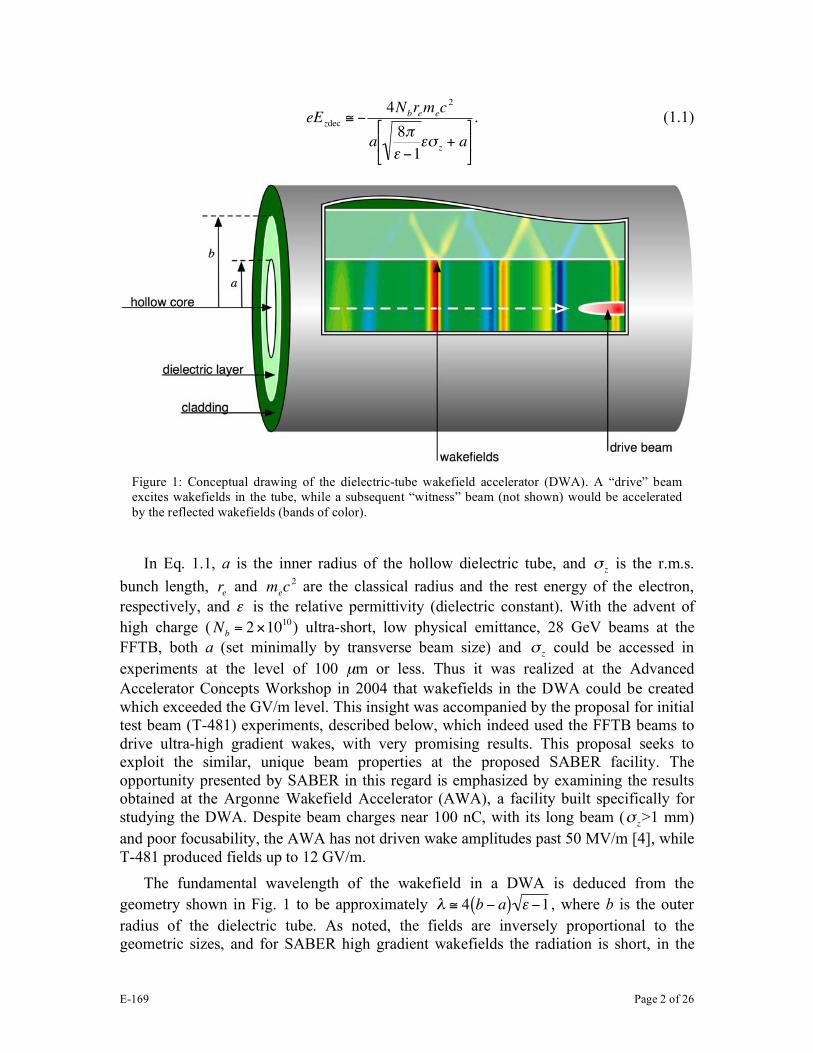
Indeed, in the panel report the dramatic recent progress in very high gradient accelerators based on new concepts is highlighted, with support of this research strongly recom-mended. Advanced accelerators have produced notable results within the past few years including multi-GeV/m gradients from plasma wakefield [2], and various laser-based accelerators [3]. The key insight which explains the success of recent plasma wakefield acceleration experiments is that the shorter the beam, the higher the fields obtainable from wake excitation. This observation applies equally well to the excitation of Cerenkov wakes in dielectric structures, as seen from the approximate expression for the decelerating field in the structure shown in Fig. 1, a dielectric wakefield accelerator (DWA):
E-169 Page 2 of 26
!
eEzdec
" #4N
brem
ec2
a8$
% #1%&
z+ a
'
( )
*
+ ,
. (1.1)
Figure 1: Conceptual drawing of the dielectric-tube wakefield accelerator (DWA). A “drive” beam excites wakefields in the tube, while a subsequent “witness” beam (not shown) would be accelerated by the reflected wakefields (bands of color).
In Eq. 1.1, a is the inner radius of the hollow dielectric tube, and
!
"z is the r.m.s.
bunch length,
!
re and
!
mec2 are the classical radius and the rest energy of the electron,
respectively, and ε is the relative permittivity (dielectric constant). With the advent of high charge (
!
Nb
= 2"1010) ultra-short, low physical emittance, 28 GeV beams at the
FFTB, both a (set minimally by transverse beam size) and
!
"z could be accessed in
experiments at the level of 100 µm or less. Thus it was realized at the Advanced Accelerator Concepts Workshop in 2004 that wakefields in the DWA could be created which exceeded the GV/m level. This insight was accompanied by the proposal for initial test beam (T-481) experiments, described below, which indeed used the FFTB beams to drive ultra-high gradient wakes, with very promising results. This proposal seeks to exploit the similar, unique beam properties at the proposed SABER facility. The opportunity presented by SABER in this regard is emphasized by examining the results obtained at the Argonne Wakefield Accelerator (AWA), a facility built specifically for studying the DWA. Despite beam charges near 100 nC, with its long beam (
!
"z>1 mm)
and poor focusability, the AWA has not driven wake amplitudes past 50 MV/m [4], while T-481 produced fields up to 12 GV/m.
The fundamental wavelength of the wakefield in a DWA is deduced from the geometry shown in Fig. 1 to be approximately
!
" # 4 b $ a( ) % $1 , where b is the outer radius of the dielectric tube. As noted, the fields are inversely proportional to the geometric sizes, and for SABER high gradient wakefields the radiation is short, in the
E-169 Page 3 of 26
sub-mm (>0.3 THz) regime. This has long been noted as a promising region of the electromagnetic spectrum for future acceleration schemes — one may obtain very high fields, but in relaxed geometries compared with those driven by ubiquitous laser sources — but has suffered from lack of viable power sources.
Cerenkov wakefield excitation using ultra-short beams simply and elegantly solves the power source problem by creating and using the accelerating fields within one collinear structure. The radiated fields in the dielectric propagate towards the outer boundary of the structure at the Cerenkov angle and are then reflected back towards the center axis, where a second beam is accelerated. While this geometry is of inherent interest as an accelerator, one may also consider using the DWA structure as a new, novel source of short pulse, high power THz radiation. As THz-based imaging is a burgeoning field, such a source has many potential applications.
The choice of wake-inducing environment — the dielectric tube — needs some comment. In microwave accelerators, structures fabricated from metals are preferred for their low loss, as well as their ability to withstand high fields. This is no longer the situation in the spectral region from sub-mm to optical, where metals have poor loss and damage threshold characteristics. It is also well known from laser-matter interaction studies that dielectrics have superior performance in these regards in the far IR-to-UV range. However, these studies do not extrapolate well to the THz frequency scale, and in considering dielectric-loaded accelerators as a path for scaling down in size the microwave linac, the high field properties of dielectrics have represented the highest uncertainty.
Because of the lack of mm-wave and THz sources, these key material issues have remained unaddressed until recently, when this collaboration undertook a first study of breakdown in sub-mm wavelength DWA, in the T-481 test beam run. The initial measurements made by this collaboration during T-481 probed the breakdown response of metallic coated silica tubes to bunches of varying length, and thus maximum wakefield. These parametric studies provided strong evidence for >2 GV/m breakdown threshold (>1.5 GV/m acceleration field) of the dielectric (silica) tubes and for the survivability of the material at lower gradients [5].
The test beam run T-481, while of limited (48 hour) duration, has produced several definitive results. The first is that the boundaries of useful field values in the DWA have been explored for the first time in the THz regime, giving a gratifyingly large damage threshold. In the process of analyzing the data from T-481, the E-169 collaboration has developed an array of online and offline tools for quantifying damage to the dielectric. Beyond the dielectric damage threshold, it was also observed that the metallic cladding used to confine the electromagnetic field at the dielectric tube outer boundary was vaporized at even moderate wake amplitudes. This particularly vulnerable design feature has been eliminated in favor of dielectric-based solutions.
To go further in our studies, it is necessary to provide more direct experimental measures of the electromagnetic wake properties in the DWA. This improved measurement can be accomplished by detecting the coherent Cerenkov radiation from the dielectric tube exit, to examine the total electromagnetic energy deposited by the beam. From the viewpoint of accelerator applications, it is of course even more direct to detect
E-169 Page 4 of 26
acceleration and/or deceleration, thus determining the longitudinal wake. This direct detection may be accomplished by increasing the interaction length of the DWA tubes.
Also, we note that study of variations in DWA structure design is highly desirable, including further exploration of different materials, such as diamond. Additionally, one should explore the parameter space of beam and structure geometries (
!
"z, a and b), as
differing geometries and charge combinations produce similar wakes but with different ratios of peak-to-accelerating fields, different mode frequencies, and different exposure times of the material to high fields. Finally we note that new approaches to DWA tube cladding, such as lower
!
" materials, should be explored. This proposal thus builds on the pioneering work of this collaboration. It seeks to:
— directly measure the coherent Cerenkov radiation produced in the DWA tubes; — test new dielectric materials;
— explore new dielectric cladding designs for the dielectric tubes; — extend the interaction length so that deceleration and acceleration of the electron
beam can be diagnosed directly through momentum spectrum measurements.
2 DWA Experiments at SABER Following on the success of T-481, the experiments proposed here will take place at the SABER facility and will involve three phases. The first phase will be a more detailed breakdown study including exploration of a large range of design parameter space, and different materials. This phase will also include quantifying of the fields by measurement of the coherent Cerenkov radiation. The second experimental phase will attempt to directly observe acceleration and deceleration of particles in 10 cm length fibers. The third phase — once the SABER facility is well characterized and fully operational — will involve significant acceleration, building on the results and expertise gained in the initial two phases, by using tubes in the range of one meter.
2.1 Experimental overview The proposed experiment is foreseen to occupy a short section of beamline after the SABER interaction point. A compressed, focused beam would be sent into a vacuum chamber large enough to accommodate the fiber holders, diagnostics and optics. The vacuum chamber would be separated from the beamline vacuum by upstream and down-stream foils, as was done in the FFTB. This vacuum isolation allows for the experimental chamber to operate at modest vacuum while not contaminating the beamline.
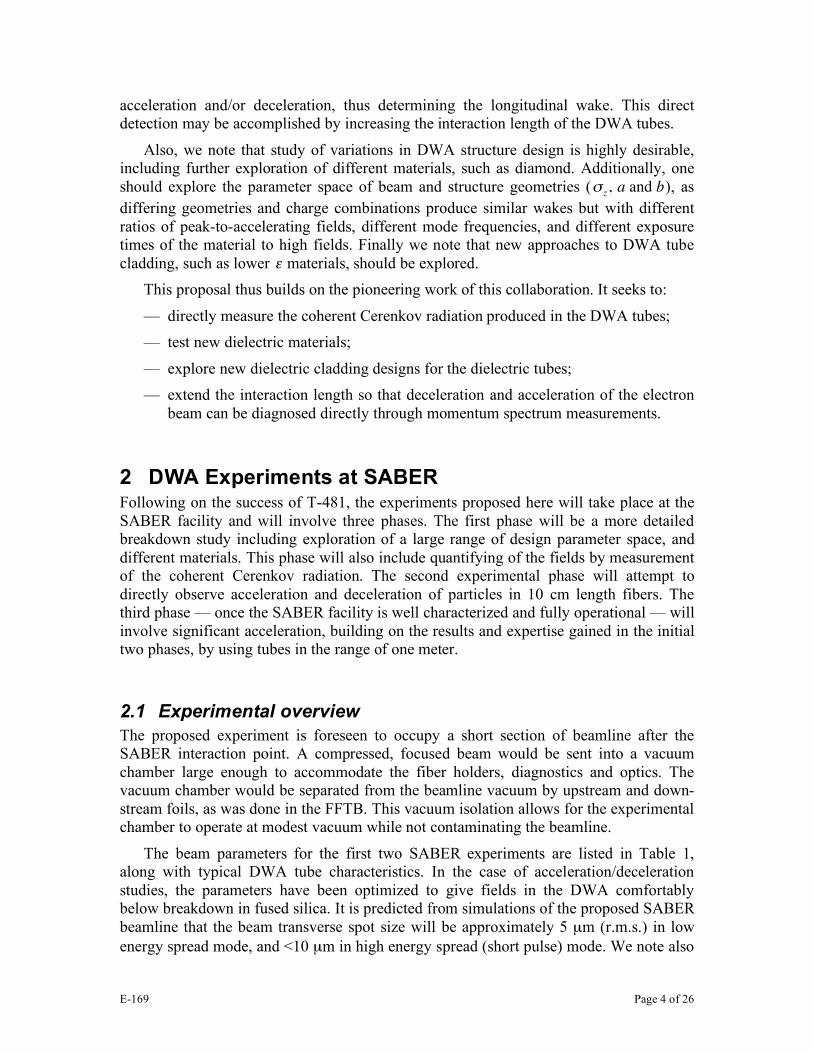
The beam parameters for the first two SABER experiments are listed in Table 1, along with typical DWA tube characteristics. In the case of acceleration/deceleration studies, the parameters have been optimized to give fields in the DWA comfortably below breakdown in fused silica. It is predicted from simulations of the proposed SABER beamline that the beam transverse spot size will be approximately 5 µm (r.m.s.) in low energy spread mode, and <10 µm in high energy spread (short pulse) mode. We note also
E-169 Page 5 of 26
that the simulated capabilities of the SABER beamlines allow peak currents which will easily produce breakdown — in short pulse mode — in the proposed tubes.
Table 1: Proposed experimental parameters for SABER runs using fused silica tubes, with short pulse used for breakdown studies, and long pulse for observation of acceleration/deceleration.
Parameter Design Value
Beam Charge: short (long) pulse 3 (5) nC
Beam Energy 25 GeV
Energy Spread (FWHM), short pulse < 2% (0.6 GeV)
Energy Spread (FWHM), long pulse < 0.28% (0.070 GeV)
Beam Length (σz), short (long) pulse ≥20 µm, (≤150 µm)
Beam Radius (σr) <10 µm
Inner Dielectric Radius, a 100 µm
Outer Dielectric Radius, b 175 µm
Dielectric Permittivity,
!
" ~ 3
Dielectric Tube Length,
!
Ld 10 cm
Peak Ez , acceleration long pulse case 1.1 GV/m
Peak Er,surface , acceleration case 2.2 GV/m
Maximum Energy Gain (10 cm) 0.11 GeV
We list the parameters and experimental explorations that form the mission of the
proposed DWA studies at SABER: Coherent Cerenkov radiation measurements: Investigations of the coherent
Cerenkov signal in the THz spectral range will be undertaken as an independent measure of the fields in the dielectric, and as a bunch length diagnostic.
Materials: In T-481, only fused silica tubes were tested; additional materials including CVD-fabricated diamond will be explored.
Coating: The thin metallic coating used on the tubes in T-481 proved inadequate to withstand ohmic heating due to induced currents. In the proposed tests use of dielectric cladding will be explored.
Varying tube diameters: T-481 used off-the-shelf fused silica tubes which were available in 100 µm and 200 µm IDs, and fixed 350 µm OD. In E-169 we plan to have several custom diameters fabricated, allowing the breakdown limit to be explored at fixed beam parameters.
Varying tube length: Short, 1 cm tubes were used in T-481. The proposed experiments will employ a range of lengths from 1 to 10 cm with the ultimate goal of pursuing a 1 m long DWA module. They will also allow study of the dependence of breakdown on time of exposure to high gradient acceleration and
E-169 Page 6 of 26
the gradient limit due to slippage caused by partial ionization changing the phase velocity[6].
Direct observation of beam changes: Longer fibers will allow for the direct measurement of energy change to the beam due to wakefield acceleration and deceleration. They may also produce notable changes in the transverse centroid due to transverse wakes.
Preparation: Alternative fiber preparation techniques will be considered and tested. Other methods of cladding removal and tips polishing (e.g. diamond cleaving) to eliminate debris contamination in the tube bore will be employed.
We expand on aspects of these points further in the following sections.
2.1.1 CCR Measurements The study of the coherent Cerenkov radiation (CCR) emitted from fused silica fibers is a central part of this proposal, as it directly probes the wake-field excitation process, giving an independent measurement of the wake-field strength. The CCR measurements can be one of the first efforts undertaken at SABER since they require only reproduction of the FFTB electron beam parameters. The total energy lost to emission of CCR may be estimated as
!
U (
C " Qb Ez,decLd /2 , where
!
Ld is the length of the tube. For
!
Ld=1 cm,
!
Qb = 3 nC, and
!
Ez,dec
=2 GV/m. We estimate that 30 mJ of CCR will be emitted.
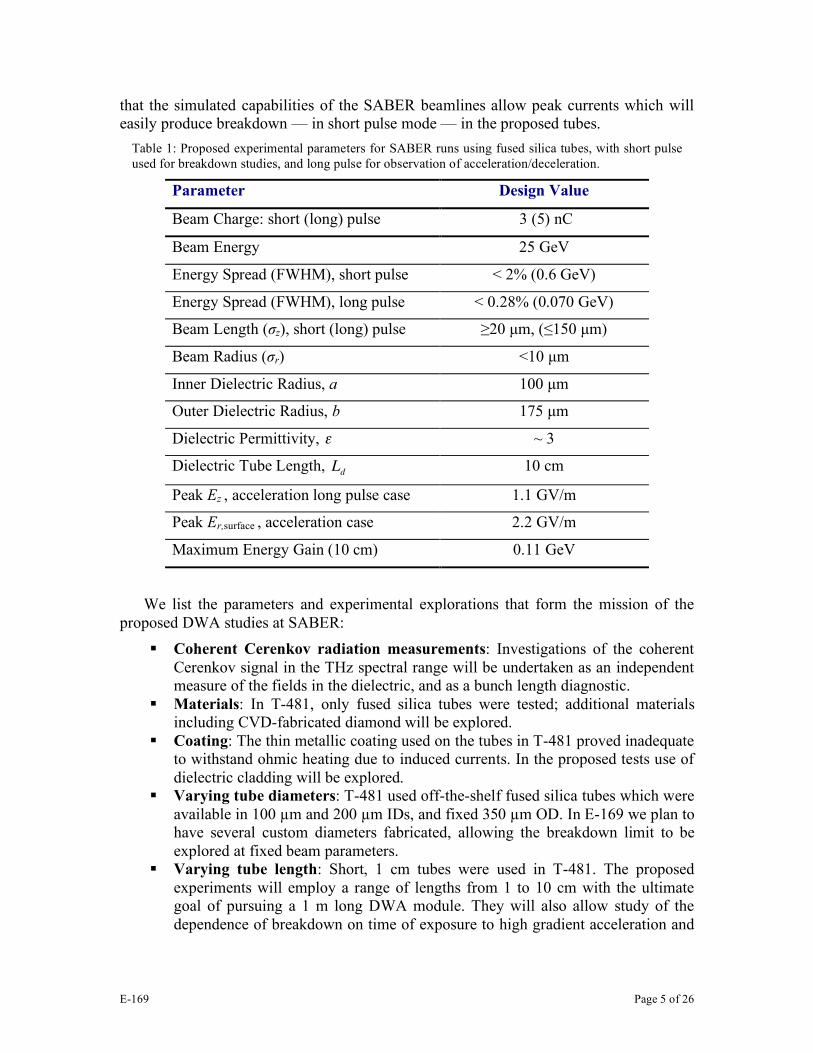
Figure 2: Drawing of the DWA structure geometry showing the outline of radiation launching horn downstream of a dielectric-tube.
In a DWA tube, the Cerenkov radiation is restricted to narrow frequency lines
corresponding to the modes of the structure having near speed-of-light phase velocity. The wavelengths corresponding to these lines are approximately
!
"n#4 b $ a( )
n% $1 , with harmonic number
!
n =1,2,3... . (2.1)
The radiated energy associated with each mode is approximately
E-169 Page 7 of 26
!
Un"
# 2nN
b
2rem
ec
2$z
2Ld
2a b % a( )2
8# & %1( )&$ z+ & %1( )a[ ]
exp %n#$
z
2 b % a( ) & %1
'
( ) )
*
+ , ,
2-
.
/ /
0
1
2 2 , n =1,2,3... (2.2)
The energy in each line is approximately proportional to n, up until a roll-off wavelength at
!
" # 2$%z. Due to this scaling, the CCR absolute amplitude is not only a measure of
the energy loss in the drive beam and associated field amplitude, but its spectral distribution also serves as a sensitive diagnostic of
!
"z.
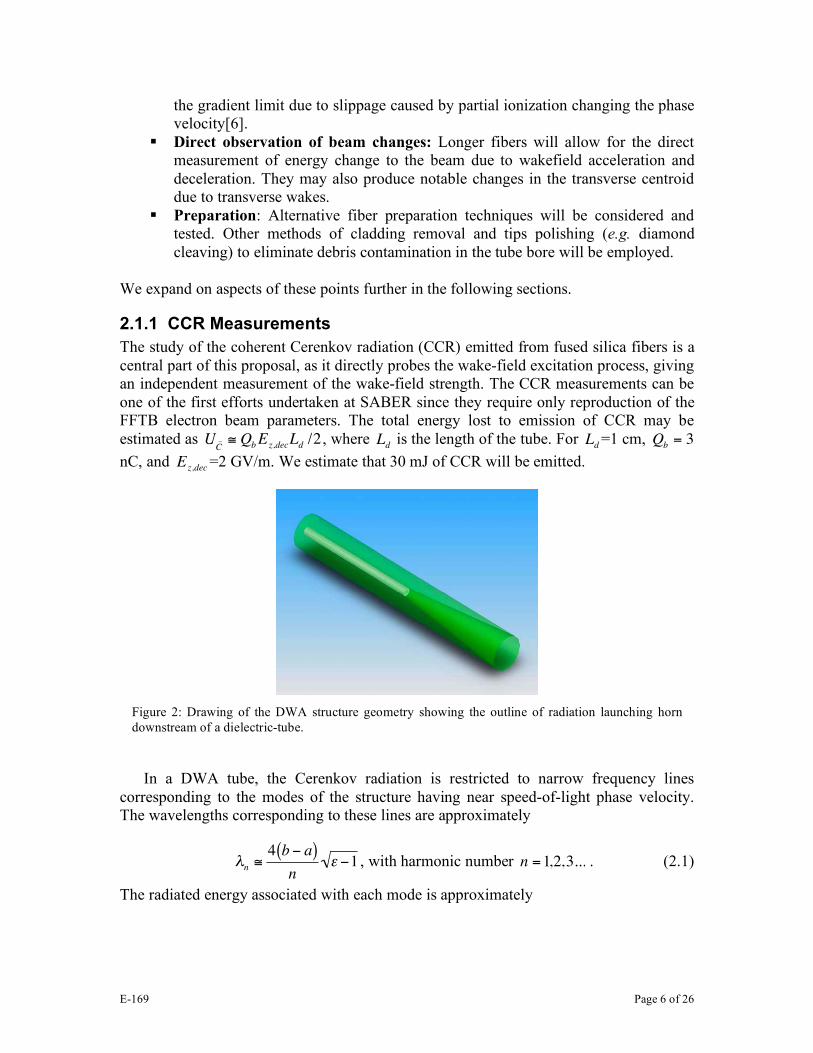
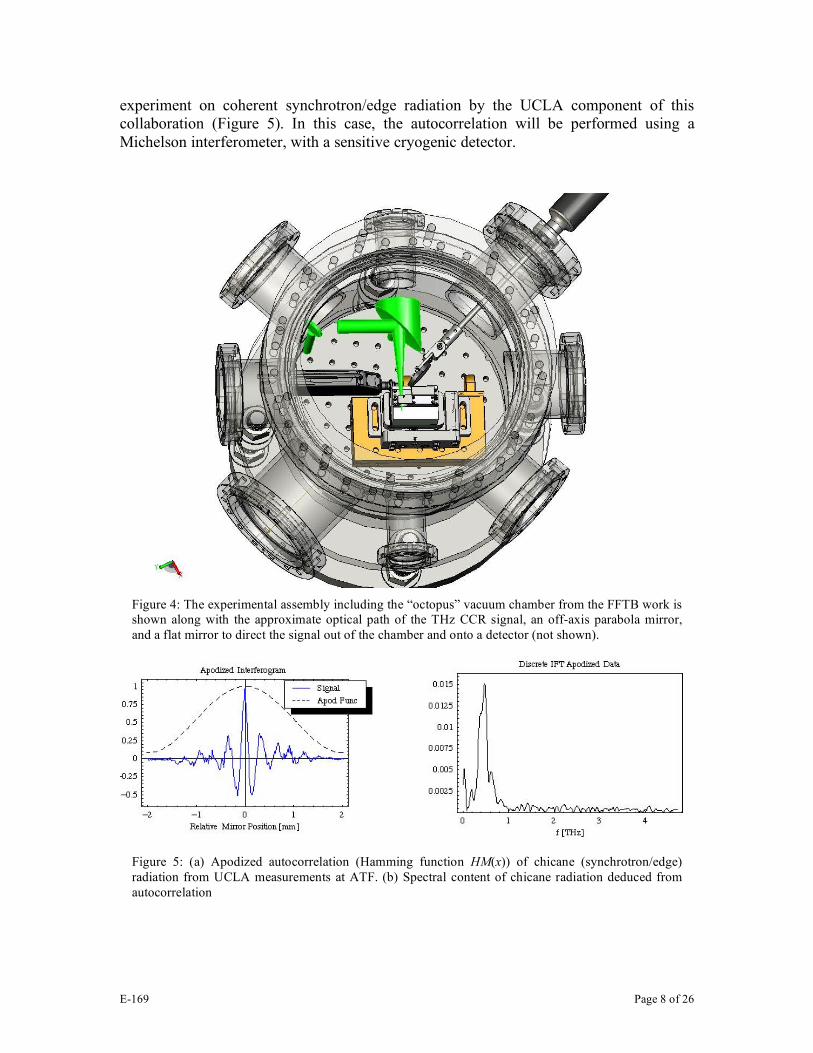
The CCR radiation emitted at the downstream fiber end requires a means of impedance matching to free space, and directing the radiation in a forward cone. A conical horn has been designed that optimally launches the fundamental CCR mode wavelength from the fiber to free space (see Figure 2). Following the original design from T-481, the fibers are inserted into a holder block which mounts 10 tubes at a time. This mounting block is, in turn, aligned to a 10 horn array (see Figure 3). The THz radiation propagates from the horn to an off-axis parabola (OAP) mirror, with a hole in the center to allow the electron beam to pass. The OAP mirror turns and collimates the radiation, which can then be sent through a THz-transparent window, such as z-cut quartz, in the chamber (see Figure 4), and onto a detector. As the CCR signal is quite large (considerably in excess of, e.g., the background due to coherent transition or diffraction radiation), the detector may be a simple pyroelectric.
Figure 3: A block containing an array of horns for the CCR measurement is shown in transparency, mounted along with the fiber holder (behind), OTR screen (on the left), and 5-axis manual alignment stage (below).
The CCR radiation travels out along the tube with group velocity (which in the limit
the beam hole vanishes is
!
vg " c /# ), and therefore leaves the tube exit over a time of
!
T = Ld / c " vg( ) # $Ld /c $ "1( ). During this propagation, the different CCR frequency components are dispersed in time. Despite the dispersion of the signal, the wavelength spectrum may be obtained by autocorrelation, as was done recently for a similar
E-169 Page 8 of 26
experiment on coherent synchrotron/edge radiation by the UCLA component of this collaboration (Figure 5). In this case, the autocorrelation will be performed using a Michelson interferometer, with a sensitive cryogenic detector.
Figure 4: The experimental assembly including the “octopus” vacuum chamber from the FFTB work is shown along with the approximate optical path of the THz CCR signal, an off-axis parabola mirror, and a flat mirror to direct the signal out of the chamber and onto a detector (not shown).
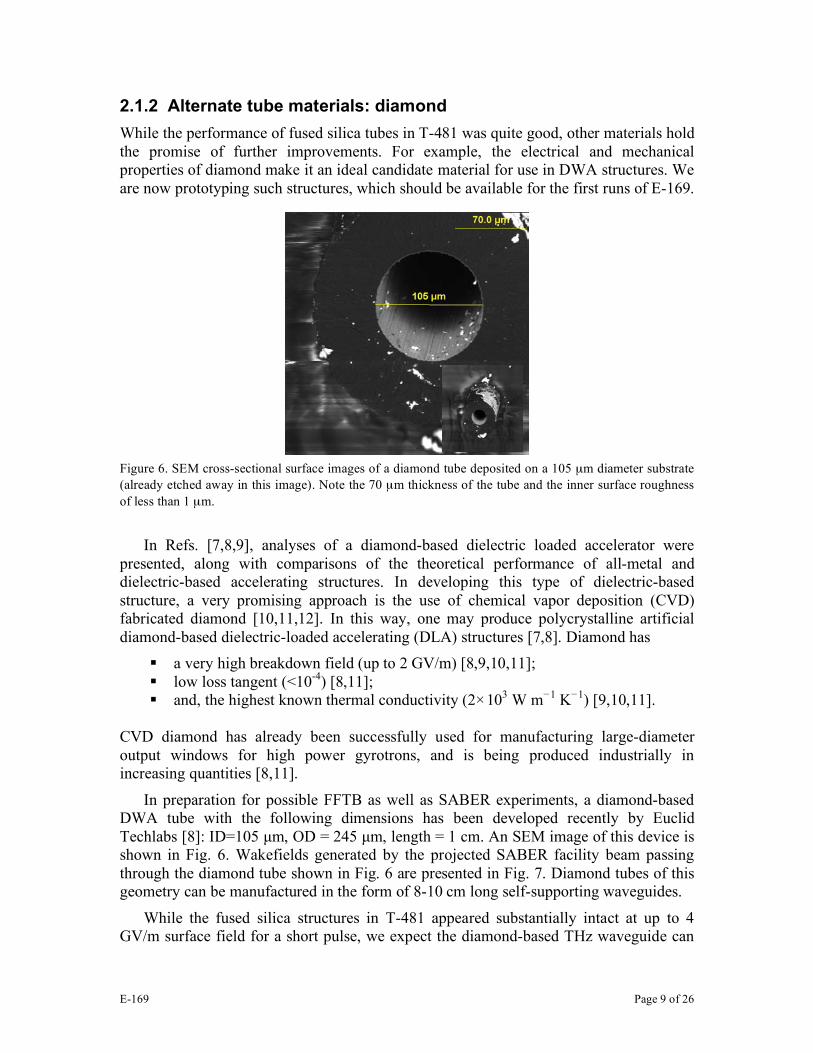
Figure 5: (a) Apodized autocorrelation (Hamming function HM(x)) of chicane (synchrotron/edge) radiation from UCLA measurements at ATF. (b) Spectral content of chicane radiation deduced from autocorrelation
E-169 Page 9 of 26
2.1.2 Alternate tube materials: diamond While the performance of fused silica tubes in T-481 was quite good, other materials hold the promise of further improvements. For example, the electrical and mechanical properties of diamond make it an ideal candidate material for use in DWA structures. We are now prototyping such structures, which should be available for the first runs of E-169.
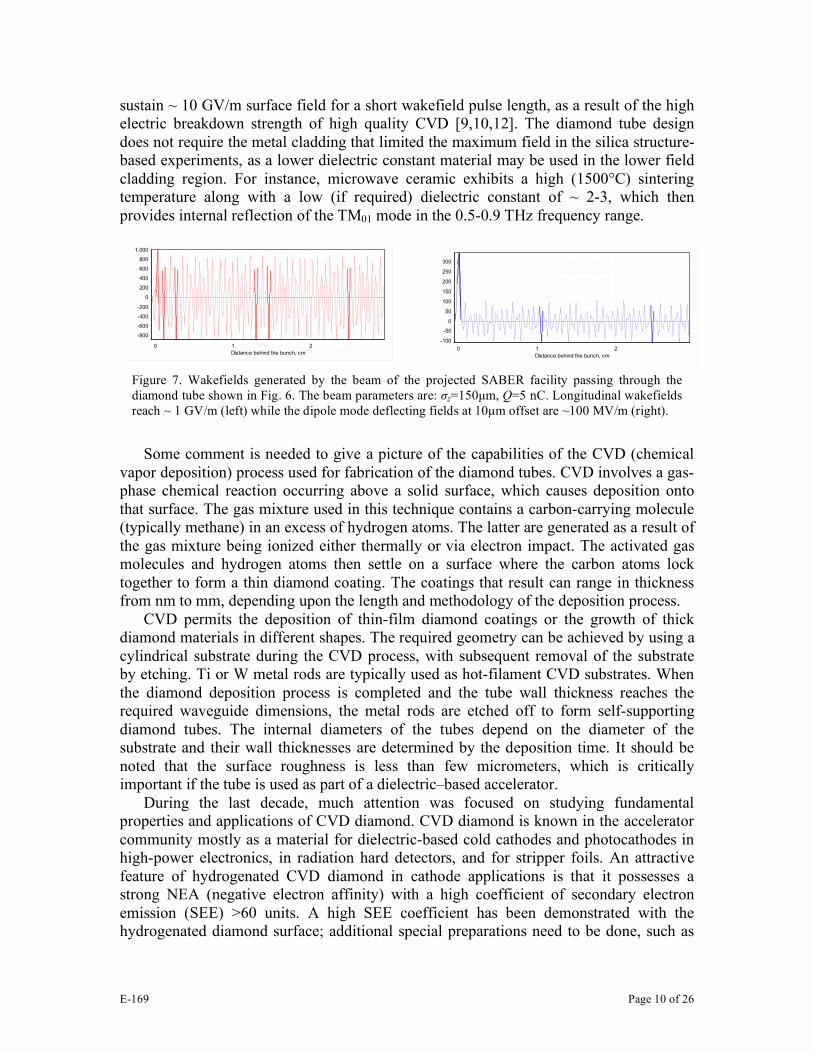
Figure 6. SEM cross-sectional surface images of a diamond tube deposited on a 105 µm diameter substrate (already etched away in this image). Note the 70 µm thickness of the tube and the inner surface roughness of less than 1 µm.
In Refs. [7,8,9], analyses of a diamond-based dielectric loaded accelerator were
presented, along with comparisons of the theoretical performance of all-metal and dielectric-based accelerating structures. In developing this type of dielectric-based structure, a very promising approach is the use of chemical vapor deposition (CVD) fabricated diamond [10,11,12]. In this way, one may produce polycrystalline artificial diamond-based dielectric-loaded accelerating (DLA) structures [7,8]. Diamond has
a very high breakdown field (up to 2 GV/m) [8,9,10,11]; low loss tangent (<10-4) [8,11]; and, the highest known thermal conductivity (2×10³ W m−1 K−1) [9,10,11].
CVD diamond has already been successfully used for manufacturing large-diameter output windows for high power gyrotrons, and is being produced industrially in increasing quantities [8,11].
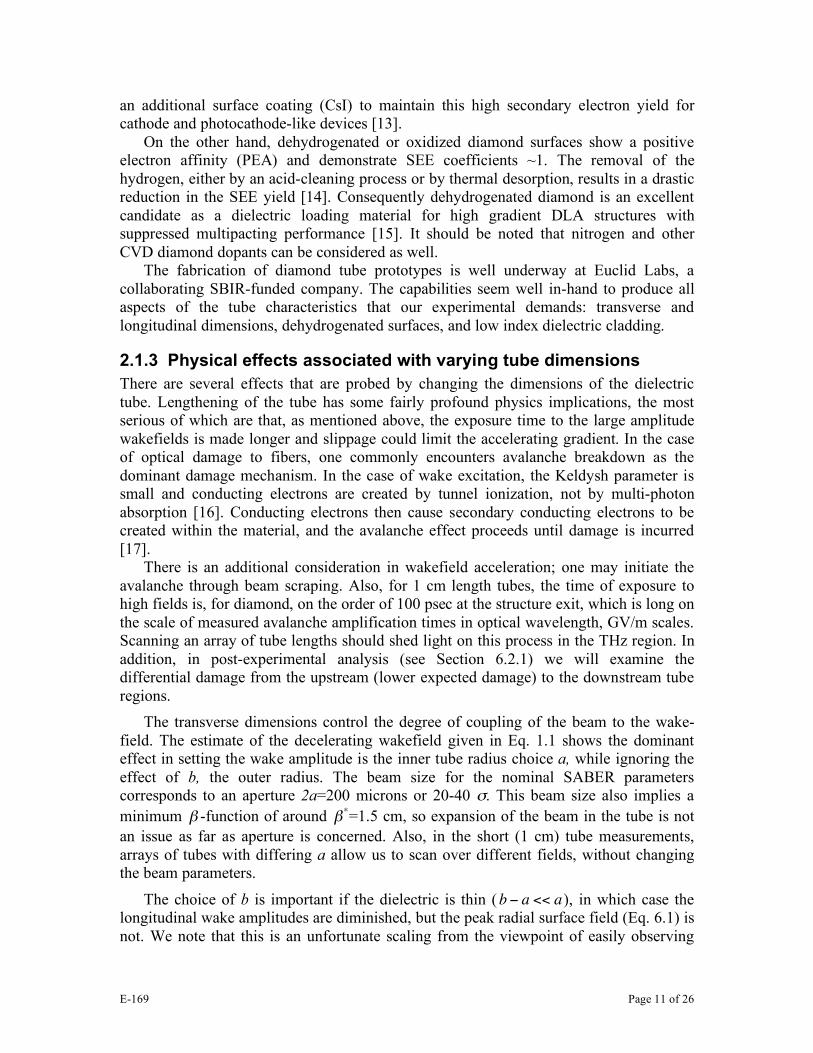
In preparation for possible FFTB as well as SABER experiments, a diamond-based DWA tube with the following dimensions has been developed recently by Euclid Techlabs [8]: ID=105 µm, OD = 245 µm, length = 1 cm. An SEM image of this device is shown in Fig. 6. Wakefields generated by the projected SABER facility beam passing through the diamond tube shown in Fig. 6 are presented in Fig. 7. Diamond tubes of this geometry can be manufactured in the form of 8-10 cm long self-supporting waveguides.
While the fused silica structures in T-481 appeared substantially intact at up to 4 GV/m surface field for a short pulse, we expect the diamond-based THz waveguide can
E-169 Page 10 of 26
sustain ~ 10 GV/m surface field for a short wakefield pulse length, as a result of the high electric breakdown strength of high quality CVD [9,10,12]. The diamond tube design does not require the metal cladding that limited the maximum field in the silica structure-based experiments, as a lower dielectric constant material may be used in the lower field cladding region. For instance, microwave ceramic exhibits a high (1500°C) sintering temperature along with a low (if required) dielectric constant of ~ 2-3, which then provides internal reflection of the TM01 mode in the 0.5-0.9 THz frequency range.
Distance behind the bunch, cm
210
Wakefield
, M
V/m
1,000
800
600
400
200
0
-200
-400
-600
-800
Distance behind the bunch, cm
210
Wakefield
, M
V/m
300
250
200
150
100
50
0
-50
-100
Figure 7. Wakefields generated by the beam of the projected SABER facility passing through the diamond tube shown in Fig. 6. The beam parameters are: σz=150µm, Q=5 nC. Longitudinal wakefields reach ~ 1 GV/m (left) while the dipole mode deflecting fields at 10µm offset are ~100 MV/m (right).
Some comment is needed to give a picture of the capabilities of the CVD (chemical
vapor deposition) process used for fabrication of the diamond tubes. CVD involves a gas-phase chemical reaction occurring above a solid surface, which causes deposition onto that surface. The gas mixture used in this technique contains a carbon-carrying molecule (typically methane) in an excess of hydrogen atoms. The latter are generated as a result of the gas mixture being ionized either thermally or via electron impact. The activated gas molecules and hydrogen atoms then settle on a surface where the carbon atoms lock together to form a thin diamond coating. The coatings that result can range in thickness from nm to mm, depending upon the length and methodology of the deposition process.
CVD permits the deposition of thin-film diamond coatings or the growth of thick diamond materials in different shapes. The required geometry can be achieved by using a cylindrical substrate during the CVD process, with subsequent removal of the substrate by etching. Ti or W metal rods are typically used as hot-filament CVD substrates. When the diamond deposition process is completed and the tube wall thickness reaches the required waveguide dimensions, the metal rods are etched off to form self-supporting diamond tubes. The internal diameters of the tubes depend on the diameter of the substrate and their wall thicknesses are determined by the deposition time. It should be noted that the surface roughness is less than few micrometers, which is critically important if the tube is used as part of a dielectric–based accelerator.
During the last decade, much attention was focused on studying fundamental properties and applications of CVD diamond. CVD diamond is known in the accelerator community mostly as a material for dielectric-based cold cathodes and photocathodes in high-power electronics, in radiation hard detectors, and for stripper foils. An attractive feature of hydrogenated CVD diamond in cathode applications is that it possesses a strong NEA (negative electron affinity) with a high coefficient of secondary electron emission (SEE) >60 units. A high SEE coefficient has been demonstrated with the hydrogenated diamond surface; additional special preparations need to be done, such as
E-169 Page 11 of 26
an additional surface coating (CsI) to maintain this high secondary electron yield for cathode and photocathode-like devices [13].
On the other hand, dehydrogenated or oxidized diamond surfaces show a positive electron affinity (PEA) and demonstrate SEE coefficients ~1. The removal of the hydrogen, either by an acid-cleaning process or by thermal desorption, results in a drastic reduction in the SEE yield [14]. Consequently dehydrogenated diamond is an excellent candidate as a dielectric loading material for high gradient DLA structures with suppressed multipacting performance [15]. It should be noted that nitrogen and other CVD diamond dopants can be considered as well.
The fabrication of diamond tube prototypes is well underway at Euclid Labs, a collaborating SBIR-funded company. The capabilities seem well in-hand to produce all aspects of the tube characteristics that our experimental demands: transverse and longitudinal dimensions, dehydrogenated surfaces, and low index dielectric cladding.
2.1.3 Physical effects associated with varying tube dimensions There are several effects that are probed by changing the dimensions of the dielectric tube. Lengthening of the tube has some fairly profound physics implications, the most serious of which are that, as mentioned above, the exposure time to the large amplitude wakefields is made longer and slippage could limit the accelerating gradient. In the case of optical damage to fibers, one commonly encounters avalanche breakdown as the dominant damage mechanism. In the case of wake excitation, the Keldysh parameter is small and conducting electrons are created by tunnel ionization, not by multi-photon absorption [16]. Conducting electrons then cause secondary conducting electrons to be created within the material, and the avalanche effect proceeds until damage is incurred [17].
There is an additional consideration in wakefield acceleration; one may initiate the avalanche through beam scraping. Also, for 1 cm length tubes, the time of exposure to high fields is, for diamond, on the order of 100 psec at the structure exit, which is long on the scale of measured avalanche amplification times in optical wavelength, GV/m scales. Scanning an array of tube lengths should shed light on this process in the THz region. In addition, in post-experimental analysis (see Section 6.2.1) we will examine the differential damage from the upstream (lower expected damage) to the downstream tube regions.
The transverse dimensions control the degree of coupling of the beam to the wake-field. The estimate of the decelerating wakefield given in Eq. 1.1 shows the dominant effect in setting the wake amplitude is the inner tube radius choice a, while ignoring the effect of b, the outer radius. The beam size for the nominal SABER parameters corresponds to an aperture 2a=200 microns or 20-40 σ. This beam size also implies a minimum
!
" -function of around
!
"*=1.5 cm, so expansion of the beam in the tube is not an issue as far as aperture is concerned. Also, in the short (1 cm) tube measurements, arrays of tubes with differing a allow us to scan over different fields, without changing the beam parameters.
The choice of b is important if the dielectric is thin (
!
b " a << a), in which case the longitudinal wake amplitudes are diminished, but the peak radial surface field (Eq. 6.1) is not. We note that this is an unfortunate scaling from the viewpoint of easily observing
E-169 Page 12 of 26
acceleration. To make the wavelength short enough to accelerate the beam tail, one would like to make
!
b " a small, especially in the case of diamond, where
!
" # 9 .
For structures of 10 cm length, the maximum beam size at the tube ends is estimated to give an aperture of 5.5-11σ without re-optimizing the final focus. Thus it may be necessary to retune the optics to the optimum minimum
!
"*=5 cm, giving an aperture of 8-16 σ. For a 1 m tube with 200 µm ID, with an optimum
!
"*=50 cm, the maximum beam size at the tube ends is at least 35 µm. In this case, one must consider focusing or use of a larger aperture tube, in order to avoid, as one must scrupulously do to suppress avalanche initiation, beam halo scraping.
Finally, we note that in longer structures one may, as stated above, observe energy changes in the beam. For 10 cm structures, and the longer beam listed in Table 1, the initial FWHM energy spread is ~85 MeV. Thus one may easily resolve the induced change in energy in the beam of ~110 MeV. In addition, one may also observe transverse wake effects. An initial 20 µm (~4σ) offset in the beam centroid may produce, in the diamond tubes discussed above, a transverse wake force of 200 MeV/m, or an integrated transverse kick over 10 cm of 20 MeV. This corresponds to an angle of 80 µrad, which is a bit smaller than the angles due to emittance (140 µrad for
!
"*=5 cm).
It is with these considerations in mind that we will make the selection of tube dimensions, as well as study their impact on focusing, alignment, and the beam measurement program in E-169. These measurements are discussed in the following section.
2.1.4 Beam measurement systems
In this section, we describe the beam measurement and diagnostic systems which enable the experimental program — they assure that the appropriate beams are input to the DWA, and allow changes to the beam induced by the DWA to be monitored
X-ray Stripe: A non-destructive spectrometer following an idea developed for the SLC [18] is used to determine the energy spectrum of the incoming bunches. In a horizontally dispersive section in the beam switchyard at the entrance of the south arc, a weak magnetic chicane deflects the beam in the vertical direction and produces a stripe of beam synchrotron radiation. The horizontal profile of this radiation is the energy spectrum of the incoming bunch. To record the spectrum, the radiation is intercepted by an off-axis phosphor screen. The light from the phosphor is transported and imaged on to a cooled CCD camera with 12-bits of dynamic range located outside of the linac housing. The typical r.m.s. energy spread on the beam is 1.5% or ~ 420 MeV whereas the energy resolution of the x-rays on the phosphor is only on the order of 60MeV. Thus the relative longitudinal current distribution of the incoming electron bunch can be measured from shot-to-shot.
Imaging Magnetic Spectrometer: The quadrupoles downstream of the SABER focal point will, in conjunction with the dipole dump magnet, form the magnetic imaging energy spectrometer. The spectrometer images the beam exiting the
E-169 Page 13 of 26
plasma onto a piece of aerogel in an energy dispersive plane. The visible Cherenkov radiation from the aerogel is imaged onto a cooled CCD camera with 16-bits of dynamic range. The electron bunch vertical profile is dominated by the vertical dispersion and is the energy spectrum. Imaging the beam at the exit of the dielectric tubes eliminates possible contributions to the beam profile resulting from deflecting forces in the dielectric tubes (see Section 2.1.3). The transverse profile in the dispersive plane is then an unambiguous measurement of the energy spectrum of the bunch exiting the dielectric tube. Thus without the dielectric accelerator, the current distributions obtained from the Cherenkov images, spectra can be calibrated against the X-ray chicane result. Then when the beam interacts with the dielectric accelerator, the x-ray chicane image gives us the input beam energy spectrum while the Cherenkov image (in the dispersive plane) gives us the effect of the dielectric accelerator on the beam energy spectrum and on the beam transverse size (in the non-dispersive plane). This technique is optimum when the energy spectrum exiting the dielectric accelerator is less than 10% wide.
Up and down stream OTR: Optical transition radiation (OTR) will be used to monitor the size, transverse shape, and position of the beam both before and after the fiber holder. The beam emits OTR when traversing 1 µm-thin titanium foils placed at 45º in the beam path. The visible radiation is imaged onto a CDD camera. Previous results obtained in the FFTB indicate that the system resolution is of the order of 10 µm. However, the minimum beam size that can be measured is limited to >20 µm by single bunch damage to the thin foils. Once the beam position of the foils is determined, a HeNe laser can be made collinear with the electron beam and is used as a rough alignment system for the fibers onto the beam path. In addition, thicker foils will be attached to the fiber holder for the fine alignment of the fiber axis and position (see Fig. 14). It that case the OTR light will be imaged using microscope objectives for better resolution. Once the beam is located on the foils, the fiber can be inserted into the beam path by simply sliding the holder into the appropriate location. These alignment techniques were developed for, and eventually proven in T-481. In this test beam the fibers were aligned to the beam vector on the first try, with no measurable beam loss for the duration of the test beam.
CTR: Another 1 µm thin titanium foil will be placed upstream from the experiment to measure the coherent transition radiation (CTR) emitted by the bunch. The coherent radiation has a wavelength longer than the bunch length and is in the far infrared range (>30 µm) for the typical SABER short bunches. This radiation will be detected using a pyro-electric detector (as previously done in the FFTB). The time-integrated energy emitted by each bunch is proportional to the bunch peak current or inversely proportional to the bunch length (for a fixed number of particles and a fixed bunch current profile). This simple diagnostic allows for a simple, bunch-to-bunch monitoring of the bunch length. Sending the CTR radiation to an interferometer yields an auto-correlation trace from which information about average bunch current profile can be inferred. However, to obtain a current profile for each bunch a single shot measurement described hereafter will be used.
E-169 Page 14 of 26
Numerical simulations of the three stages of bunch magnetic compression process along the linac using the code LiTrack [19] indicate that there is a strong correlation between the bunch energy spectrum in the SABER beam line and the bunch current profile. The bunch energy spectrum before the experiment will be measured using an existing soft vertical chicane in the beam switchyard where there is x-dispersion. The bunch emits synchrotron radiation when bent in the soft vertical chicane. The x-ray radiation intercepts an off-axis phosphor screen where it is converted into visible radiation. This radiation is imaged onto a cooled CCD camera to yield the energy spectrum for each incoming bunch. The bunch current profile and length can then be retrieved using the method described in Ref. [2]. Knowledge of the bunch current profile is crucial to determine the electric field at the dielectric surface.
In addition, the standard SLC diagnostics such as beam position monitors (BPMs) and beam current monitors (toroids) are recorded. All diagnostics are acquired at 1 Hz and correlated on a pulse-to-pulse basis.
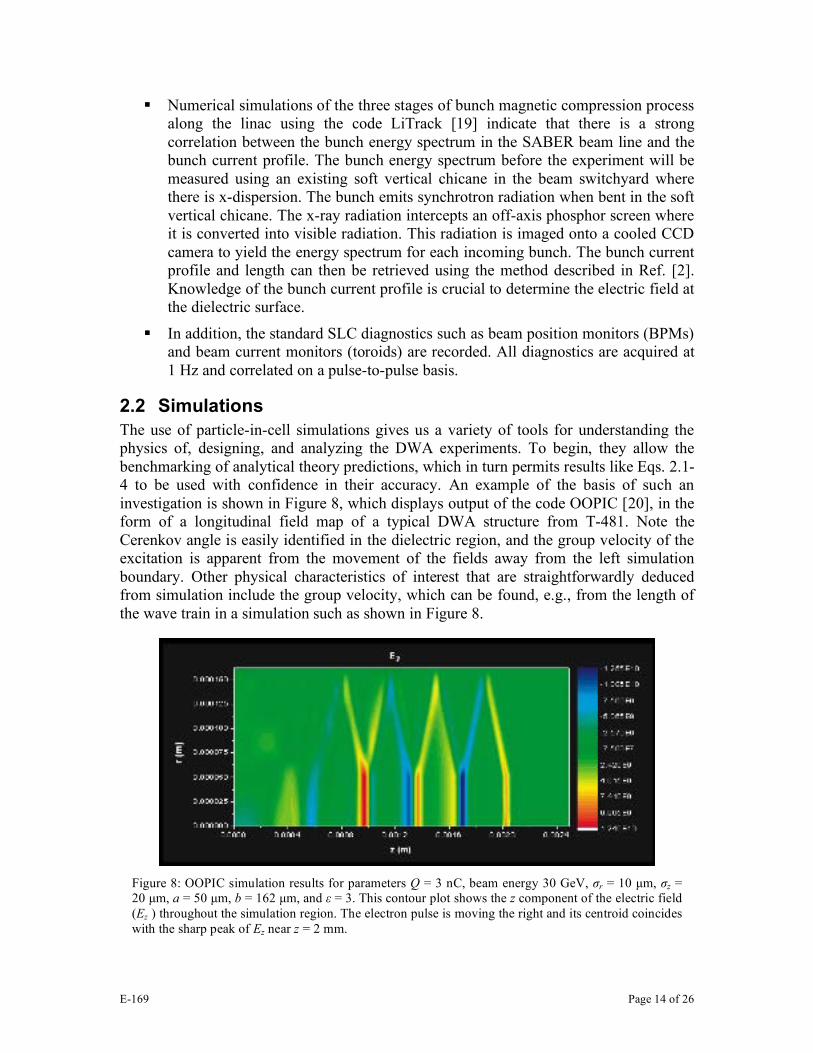
2.2 Simulations The use of particle-in-cell simulations gives us a variety of tools for understanding the physics of, designing, and analyzing the DWA experiments. To begin, they allow the benchmarking of analytical theory predictions, which in turn permits results like Eqs. 2.1-4 to be used with confidence in their accuracy. An example of the basis of such an investigation is shown in Figure 8, which displays output of the code OOPIC [20], in the form of a longitudinal field map of a typical DWA structure from T-481. Note the Cerenkov angle is easily identified in the dielectric region, and the group velocity of the excitation is apparent from the movement of the fields away from the left simulation boundary. Other physical characteristics of interest that are straightforwardly deduced from simulation include the group velocity, which can be found, e.g., from the length of the wave train in a simulation such as shown in Figure 8.
Figure 8: OOPIC simulation results for parameters Q = 3 nC, beam energy 30 GeV, σr = 10 µm, σz = 20 µm, a = 50 µm, b = 162 µm, and ε = 3. This contour plot shows the z component of the electric field (Ez ) throughout the simulation region. The electron pulse is moving the right and its centroid coincides with the sharp peak of Ez near z = 2 mm.
E-169 Page 15 of 26
0
5 109
1 1010
1.5 1010
40 60 80 100 120 140 160
E_dec,max (OOPIC)E_acc max (OOPIC)E_dec,theory
Ez
(V
/m)
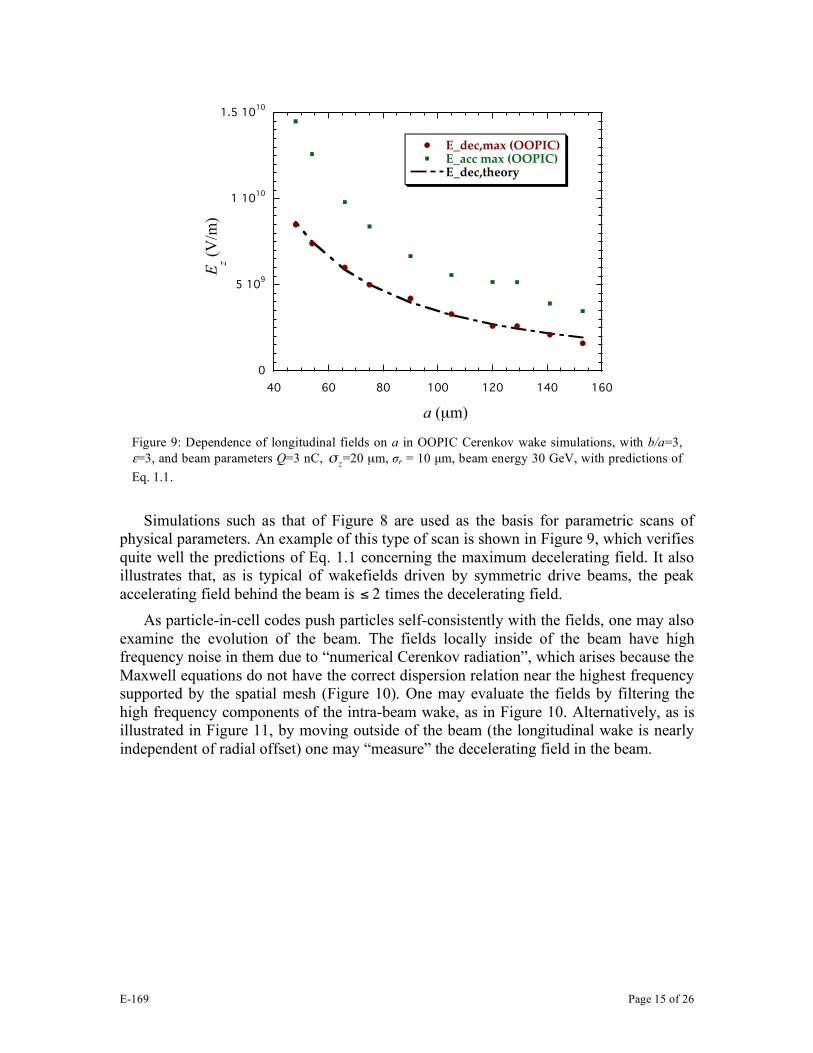
a (µm) Figure 9: Dependence of longitudinal fields on a in OOPIC Cerenkov wake simulations, with b/a=3, ε=3, and beam parameters Q=3 nC,
!
"z=20 µm, σr = 10 µm, beam energy 30 GeV, with predictions of
Eq. 1.1.
Simulations such as that of Figure 8 are used as the basis for parametric scans of
physical parameters. An example of this type of scan is shown in Figure 9, which verifies quite well the predictions of Eq. 1.1 concerning the maximum decelerating field. It also illustrates that, as is typical of wakefields driven by symmetric drive beams, the peak accelerating field behind the beam is
!
" 2 times the decelerating field. As particle-in-cell codes push particles self-consistently with the fields, one may also
examine the evolution of the beam. The fields locally inside of the beam have high frequency noise in them due to “numerical Cerenkov radiation”, which arises because the Maxwell equations do not have the correct dispersion relation near the highest frequency supported by the spatial mesh (Figure 10). One may evaluate the fields by filtering the high frequency components of the intra-beam wake, as in Figure 10. Alternatively, as is illustrated in Figure 11, by moving outside of the beam (the longitudinal wake is nearly independent of radial offset) one may “measure” the decelerating field in the beam.
E-169 Page 16 of 26
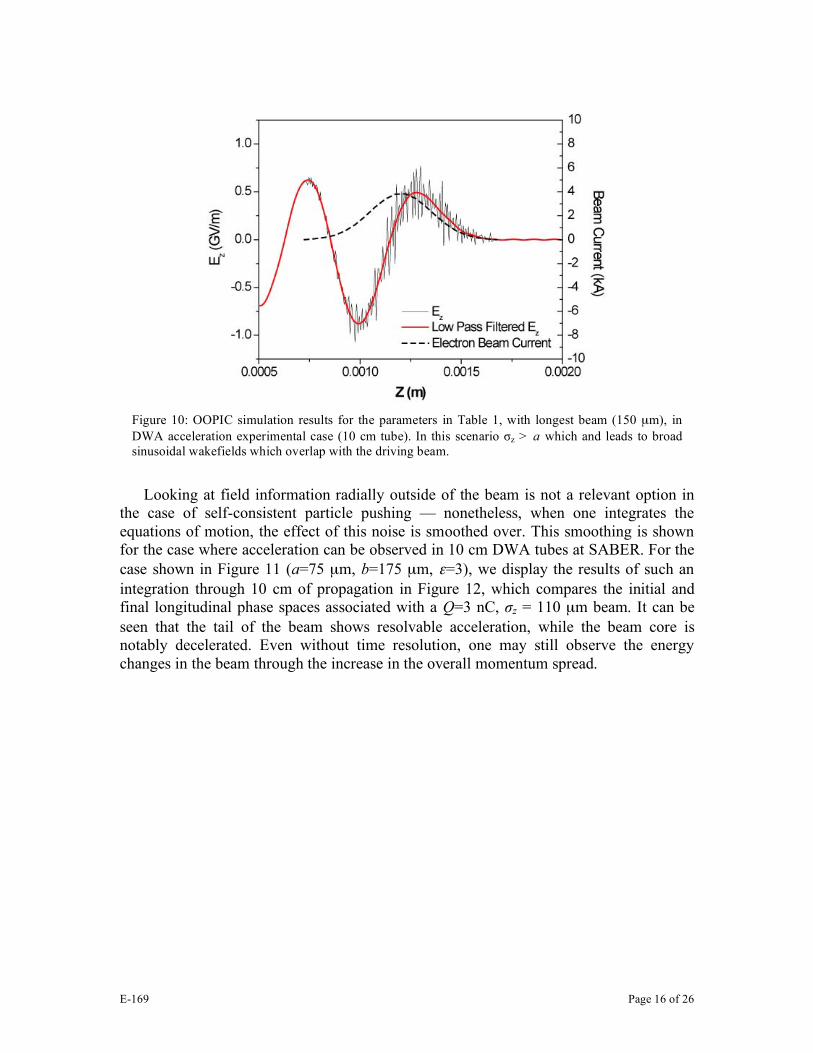
Figure 10: OOPIC simulation results for the parameters in Table 1, with longest beam (150 µm), in DWA acceleration experimental case (10 cm tube). In this scenario σz > a which and leads to broad sinusoidal wakefields which overlap with the driving beam.
Looking at field information radially outside of the beam is not a relevant option in
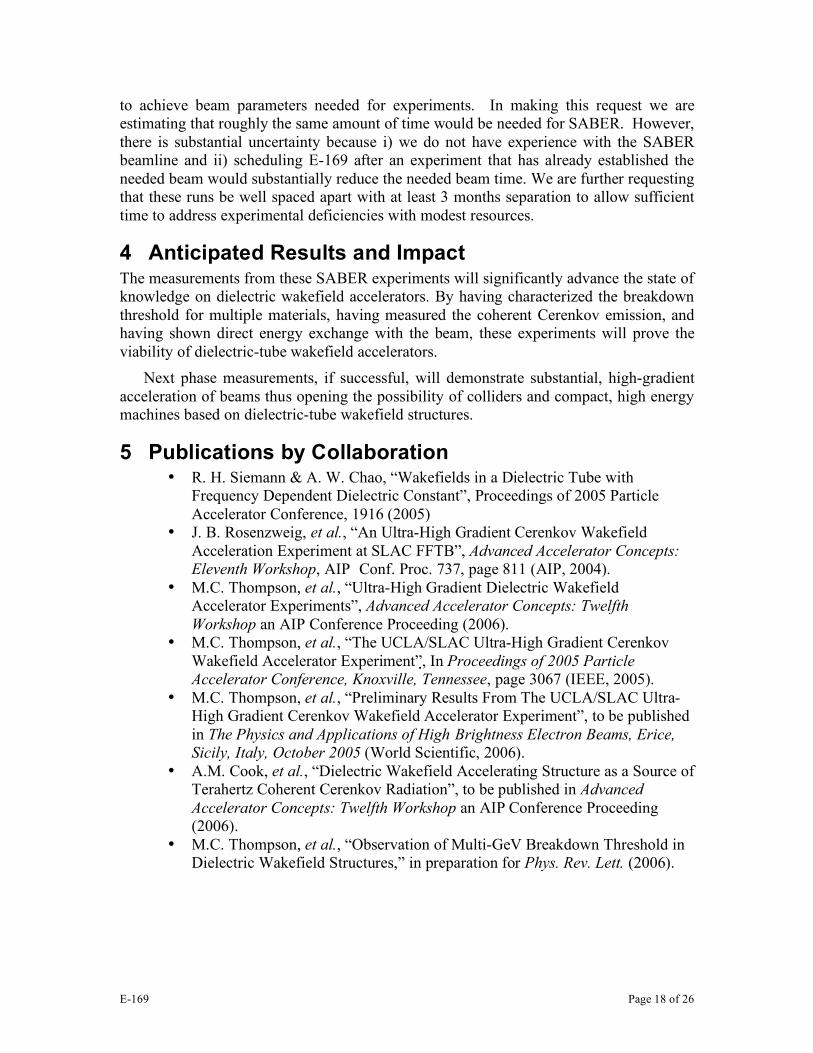
the case of self-consistent particle pushing — nonetheless, when one integrates the equations of motion, the effect of this noise is smoothed over. This smoothing is shown for the case where acceleration can be observed in 10 cm DWA tubes at SABER. For the case shown in Figure 11 (a=75 µm, b=175 µm, ε=3), we display the results of such an integration through 10 cm of propagation in Figure 12, which compares the initial and final longitudinal phase spaces associated with a Q=3 nC, σz = 110 µm beam. It can be seen that the tail of the beam shows resolvable acceleration, while the beam core is notably decelerated. Even without time resolution, one may still observe the energy changes in the beam through the increase in the overall momentum spread.
E-169 Page 17 of 26
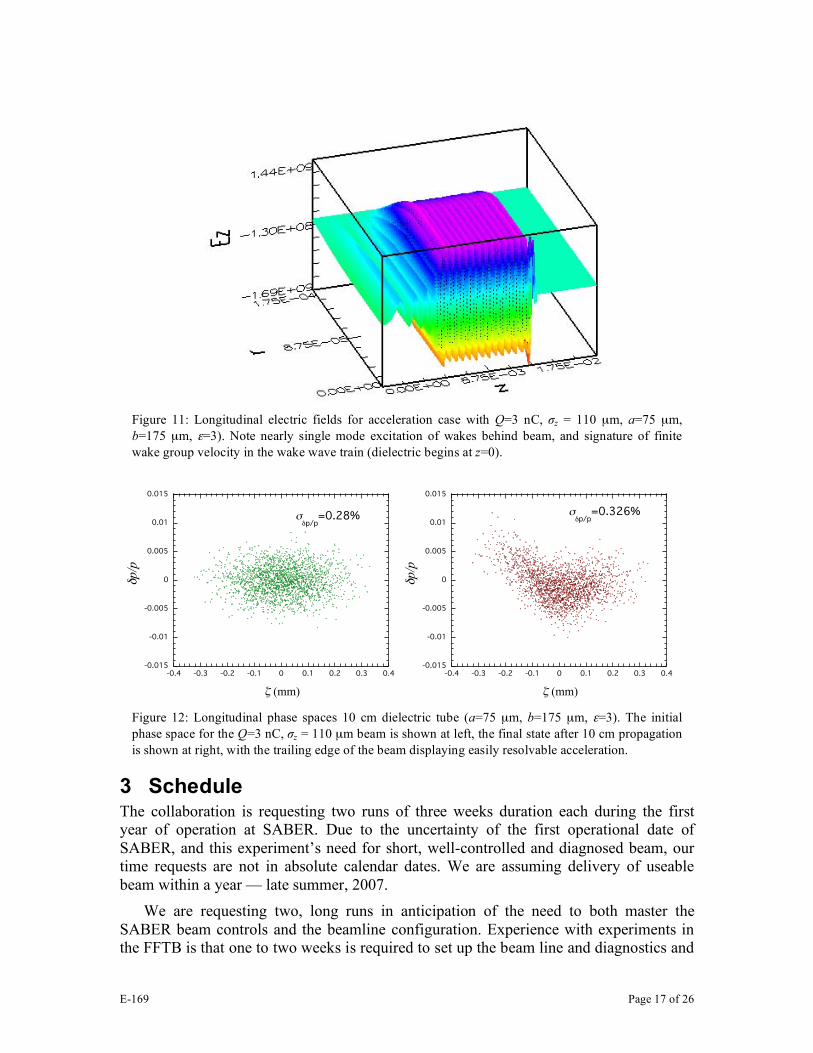
Figure 11: Longitudinal electric fields for acceleration case with Q=3 nC, σz = 110 µm, a=75 µm, b=175 µm, ε=3). Note nearly single mode excitation of wakes behind beam, and signature of finite wake group velocity in the wake wave train (dielectric begins at z=0).
-0.015
-0.01
-0.005
0
0.005
0.01
0.015
-0.4 -0.3 -0.2 -0.1 0 0.1 0.2 0.3 0.4
!p
/p
" (mm)
#!p/p
=0.28%
-0.015
-0.01
-0.005
0
0.005
0.01
0.015
-0.4 -0.3 -0.2 -0.1 0 0.1 0.2 0.3 0.4
!p
/p
" (mm)
#!p/p
=0.326%
Figure 12: Longitudinal phase spaces 10 cm dielectric tube (a=75 µm, b=175 µm, ε=3). The initial phase space for the Q=3 nC, σz = 110 µm beam is shown at left, the final state after 10 cm propagation is shown at right, with the trailing edge of the beam displaying easily resolvable acceleration.
3 Schedule The collaboration is requesting two runs of three weeks duration each during the first year of operation at SABER. Due to the uncertainty of the first operational date of SABER, and this experiment’s need for short, well-controlled and diagnosed beam, our time requests are not in absolute calendar dates. We are assuming delivery of useable beam within a year — late summer, 2007.
We are requesting two, long runs in anticipation of the need to both master the SABER beam controls and the beamline configuration. Experience with experiments in the FFTB is that one to two weeks is required to set up the beam line and diagnostics and
E-169 Page 18 of 26
to achieve beam parameters needed for experiments. In making this request we are estimating that roughly the same amount of time would be needed for SABER. However, there is substantial uncertainty because i) we do not have experience with the SABER beamline and ii) scheduling E-169 after an experiment that has already established the needed beam would substantially reduce the needed beam time. We are further requesting that these runs be well spaced apart with at least 3 months separation to allow sufficient time to address experimental deficiencies with modest resources.
4 Anticipated Results and Impact The measurements from these SABER experiments will significantly advance the state of knowledge on dielectric wakefield accelerators. By having characterized the breakdown threshold for multiple materials, having measured the coherent Cerenkov emission, and having shown direct energy exchange with the beam, these experiments will prove the viability of dielectric-tube wakefield accelerators.
Next phase measurements, if successful, will demonstrate substantial, high-gradient acceleration of beams thus opening the possibility of colliders and compact, high energy machines based on dielectric-tube wakefield structures.
5 Publications by Collaboration • R. H. Siemann & A. W. Chao, “Wakefields in a Dielectric Tube with
Frequency Dependent Dielectric Constant”, Proceedings of 2005 Particle Accelerator Conference, 1916 (2005)
• J. B. Rosenzweig, et al., “An Ultra-High Gradient Cerenkov Wakefield Acceleration Experiment at SLAC FFTB”, Advanced Accelerator Concepts: Eleventh Workshop, AIP Conf. Proc. 737, page 811 (AIP, 2004).
• M.C. Thompson, et al., “Ultra-High Gradient Dielectric Wakefield Accelerator Experiments”, Advanced Accelerator Concepts: Twelfth Workshop an AIP Conference Proceeding (2006).
• M.C. Thompson, et al., “The UCLA/SLAC Ultra-High Gradient Cerenkov Wakefield Accelerator Experiment”, In Proceedings of 2005 Particle Accelerator Conference, Knoxville, Tennessee, page 3067 (IEEE, 2005).
• M.C. Thompson, et al., “Preliminary Results From The UCLA/SLAC Ultra-High Gradient Cerenkov Wakefield Accelerator Experiment”, to be published in The Physics and Applications of High Brightness Electron Beams, Erice, Sicily, Italy, October 2005 (World Scientific, 2006).
• A.M. Cook, et al., “Dielectric Wakefield Accelerating Structure as a Source of Terahertz Coherent Cerenkov Radiation”, to be published in Advanced Accelerator Concepts: Twelfth Workshop an AIP Conference Proceeding (2006).
• M.C. Thompson, et al., “Observation of Multi-GeV Breakdown Threshold in Dielectric Wakefield Structures,” in preparation for Phys. Rev. Lett. (2006).
E-169 Page 19 of 26
6 Appendix: Summary of results from T-481 This proposal represents a continuation of the first phase of DWA investigations using ultra-short beams at SLAC, the test-beam run termed T-481. We review here the progress made during this preliminary experiment.
6.1 Motivation for T-481: Breakdown Studies The primary goal of the first phase of the experiment was to set the boundary of DWA applicability for high gradient acceleration, by assessing dielectric material survivability. The parameters for our experiment were based upon the unprecedented combination of high charge, short pulse duration, and small spot size available in the SLAC FFTB beam, as summarized in Table 1. While multimode wakefield analyses [21] provide exact solutions for the fields excited in the DWA, they do not provide easy information upon inspection, as such, heuristic scaling laws for the wakefields have been developed, e.g. Eq. 1.1. As the beam is both short and well focused at the FFTB (bunch length and radius both < 20 µm), extremely high fields are predicted.
More accurate predictions concerning the excited electric field values in the DWA are derived from OOPIC simulations, as typified by Figure 8. The ability to excite longitudinal wakes up to 12 GV/m, with associated surface fields of 22 GV/m assured that we would be able to exceed commonly predicted breakdown fields in the dielectric by an order of magnitude. Since the experiment uses dielectric tubes with 100 and 200 µm IDs, we chose a tube length of 1 cm in order to mitigate alignment issues. The energy gained or lost by beam particles is therefore predicted to be less than 100 MeV, while the full energy spread of the highly compressed FFTB beam is several GeV. Consequently, energy changes were not resolvable in this experiment. The primary signature of high field wakes in this first phase of the experiment was the detection of dielectric breakdown, as illustrated in Figure 15.
Indeed, the main result of T-481 is a first establishment of a >GV/m breakdown limit of dielectric tubes under wake excitation. This DWA experiment is unique in that it produces fields comparable to those in earlier laser breakdown studies. It is critical to differentiating material breakdown in wake-excited, relatively long wavelength (>50 µm photon) systems, as compared with optically excited systems. Quantum absorption of photons to produce free electrons in the material is known to be an initiator of avalanche ionization [17]. In the wake excited case, tunneling ionization appears to be the dominant method of producing the free electrons that initiate the avalanche. As discussed below, it seems that surface fields higher than 2 GV/m where sustained in our dielectric wake experiment at for ~ 70 fsec pulse length. This path-breaking result is of high importance, as it indicates, for the first time, that tantalizingly large fields are possible in the DWA.
E-169 Page 20 of 26
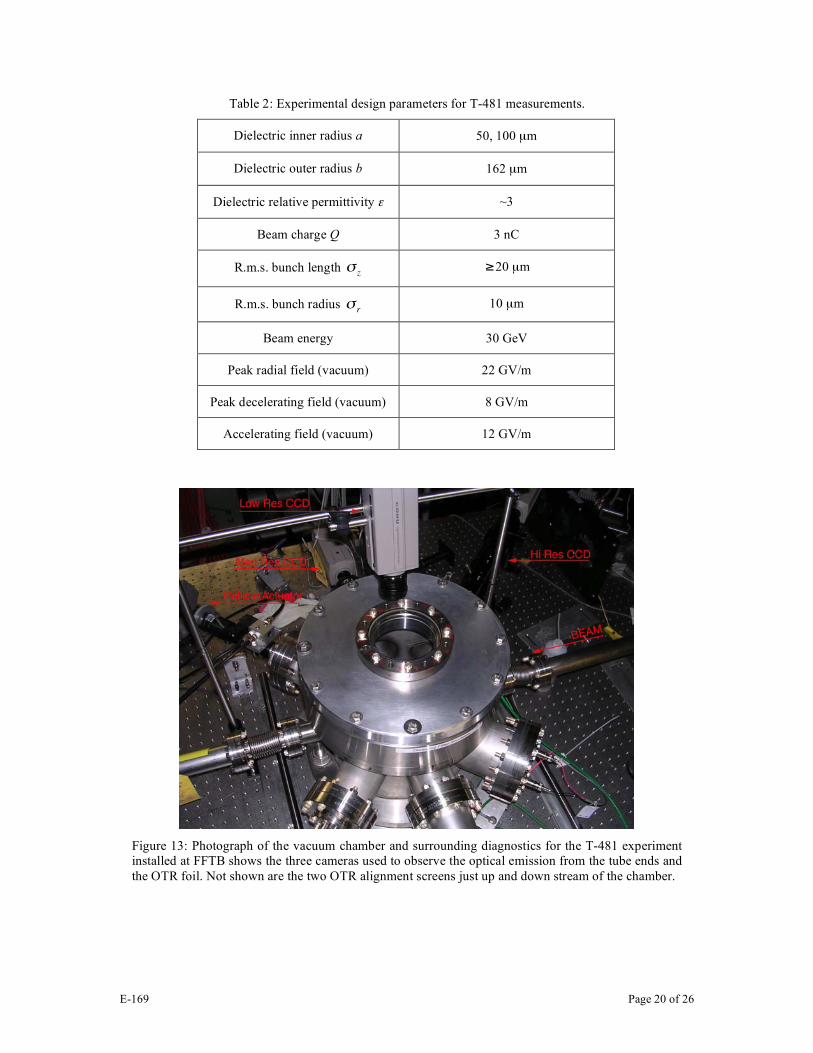
Table 2: Experimental design parameters for T-481 measurements.
Dielectric inner radius a 50, 100 µm
Dielectric outer radius b 162 µm
Dielectric relative permittivity ε ~3
Beam charge Q 3 nC
R.m.s. bunch length
!
"z
!
"20 µm
R.m.s. bunch radius
!
"r 10 µm
Beam energy 30 GeV
Peak radial field (vacuum) 22 GV/m
Peak decelerating field (vacuum) 8 GV/m
Accelerating field (vacuum) 12 GV/m
Figure 13: Photograph of the vacuum chamber and surrounding diagnostics for the T-481 experiment installed at FFTB shows the three cameras used to observe the optical emission from the tube ends and the OTR foil. Not shown are the two OTR alignment screens just up and down stream of the chamber.
E-169 Page 21 of 26
6.2 T-481 Experimental Results In August of 2005, this collaboration installed a dielectric-tube wakefield experiment during a test beam run (T-481) and measured breakdown of a series of very small-bore, hollow dielectric fibers (tubes) exposed to beams of high charge (3 nC), and various beam bunch lengths. The parameters of the dielectric tubes and the beam used in these measurements are summarized in Table 2. The maximum field parameters indicated are: maximum radial electric field found just inside of vacuum-dielectric interface; the maximum on-axis decelerating field inside of the drive beam; and the maximum on-axis accelerating field found behind the beam.
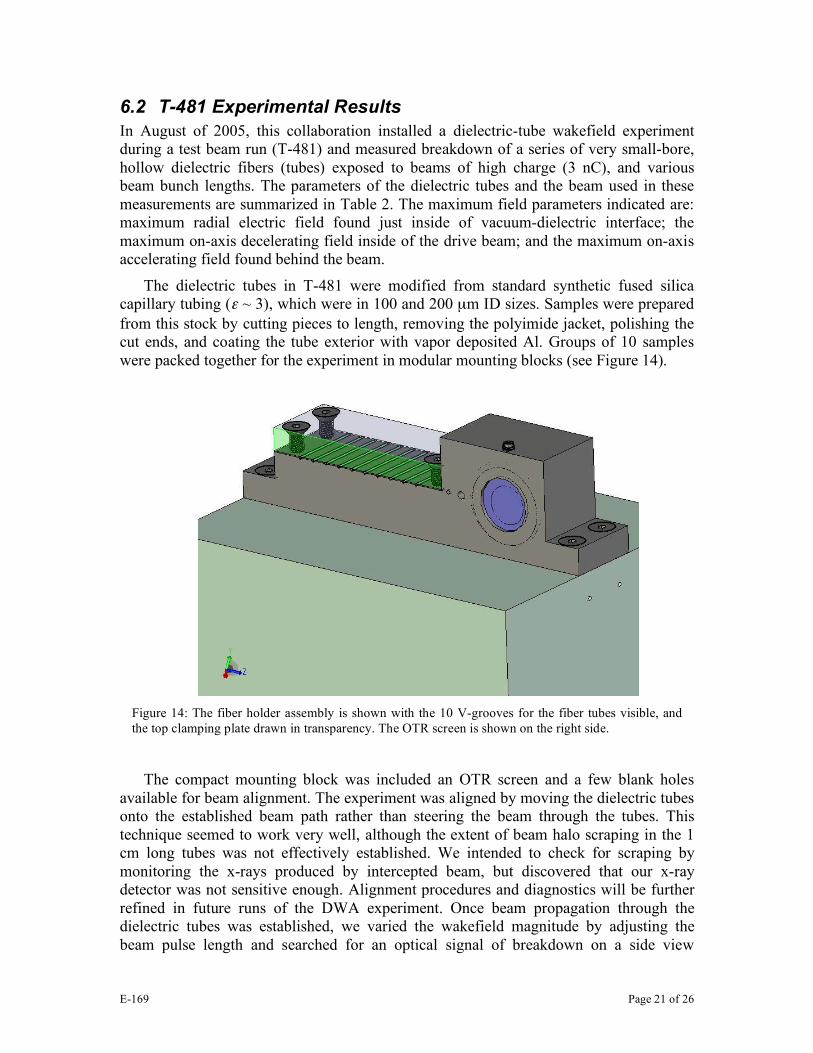
The dielectric tubes in T-481 were modified from standard synthetic fused silica capillary tubing (ε ~ 3), which were in 100 and 200 µm ID sizes. Samples were prepared from this stock by cutting pieces to length, removing the polyimide jacket, polishing the cut ends, and coating the tube exterior with vapor deposited Al. Groups of 10 samples were packed together for the experiment in modular mounting blocks (see Figure 14).
Figure 14: The fiber holder assembly is shown with the 10 V-grooves for the fiber tubes visible, and the top clamping plate drawn in transparency. The OTR screen is shown on the right side.
The compact mounting block was included an OTR screen and a few blank holes
available for beam alignment. The experiment was aligned by moving the dielectric tubes onto the established beam path rather than steering the beam through the tubes. This technique seemed to work very well, although the extent of beam halo scraping in the 1 cm long tubes was not effectively established. We intended to check for scraping by monitoring the x-rays produced by intercepted beam, but discovered that our x-ray detector was not sensitive enough. Alignment procedures and diagnostics will be further refined in future runs of the DWA experiment. Once beam propagation through the dielectric tubes was established, we varied the wakefield magnitude by adjusting the beam pulse length and searched for an optical signal of breakdown on a side view
E-169 Page 22 of 26
telescopic camera (see Figure 13). This experiment was repeated for samples with different tube IDs. Individual tube samples were systematically exposed to different field levels (i.e. bunch lengths) for varying periods of time, to allow a subsequent study of differences in material damage.
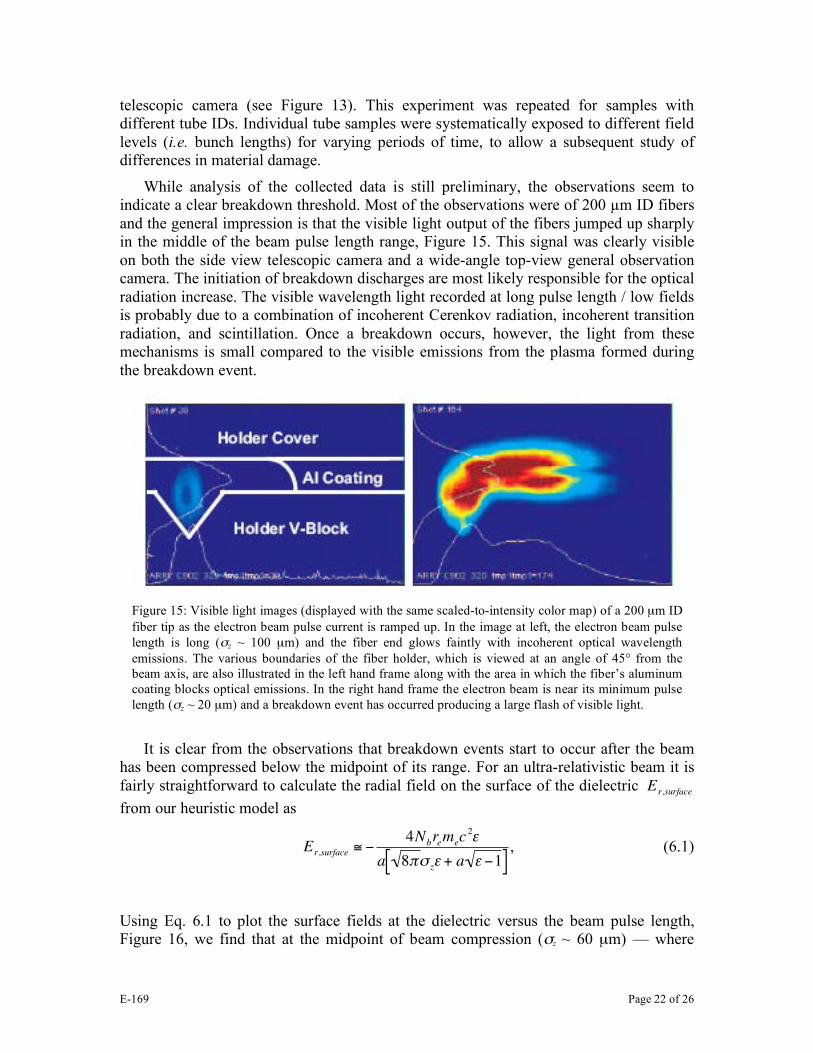
While analysis of the collected data is still preliminary, the observations seem to indicate a clear breakdown threshold. Most of the observations were of 200 µm ID fibers and the general impression is that the visible light output of the fibers jumped up sharply in the middle of the beam pulse length range, Figure 15. This signal was clearly visible on both the side view telescopic camera and a wide-angle top-view general observation camera. The initiation of breakdown discharges are most likely responsible for the optical radiation increase. The visible wavelength light recorded at long pulse length / low fields is probably due to a combination of incoherent Cerenkov radiation, incoherent transition radiation, and scintillation. Once a breakdown occurs, however, the light from these mechanisms is small compared to the visible emissions from the plasma formed during the breakdown event.
Figure 15: Visible light images (displayed with the same scaled-to-intensity color map) of a 200 µm ID fiber tip as the electron beam pulse current is ramped up. In the image at left, the electron beam pulse length is long (σz ~ 100 µm) and the fiber end glows faintly with incoherent optical wavelength emissions. The various boundaries of the fiber holder, which is viewed at an angle of 45° from the beam axis, are also illustrated in the left hand frame along with the area in which the fiber’s aluminum coating blocks optical emissions. In the right hand frame the electron beam is near its minimum pulse length (σz ~ 20 µm) and a breakdown event has occurred producing a large flash of visible light.
It is clear from the observations that breakdown events start to occur after the beam
has been compressed below the midpoint of its range. For an ultra-relativistic beam it is fairly straightforward to calculate the radial field on the surface of the dielectric
!
Er,surface from our heuristic model as
!
Er,surface " #4Nbremec
2$
a 8%& z$ + a $ #1[ ], (6.1)
Using Eq. 6.1 to plot the surface fields at the dielectric versus the beam pulse length, Figure 16, we find that at the midpoint of beam compression (σz ~ 60 µm) — where
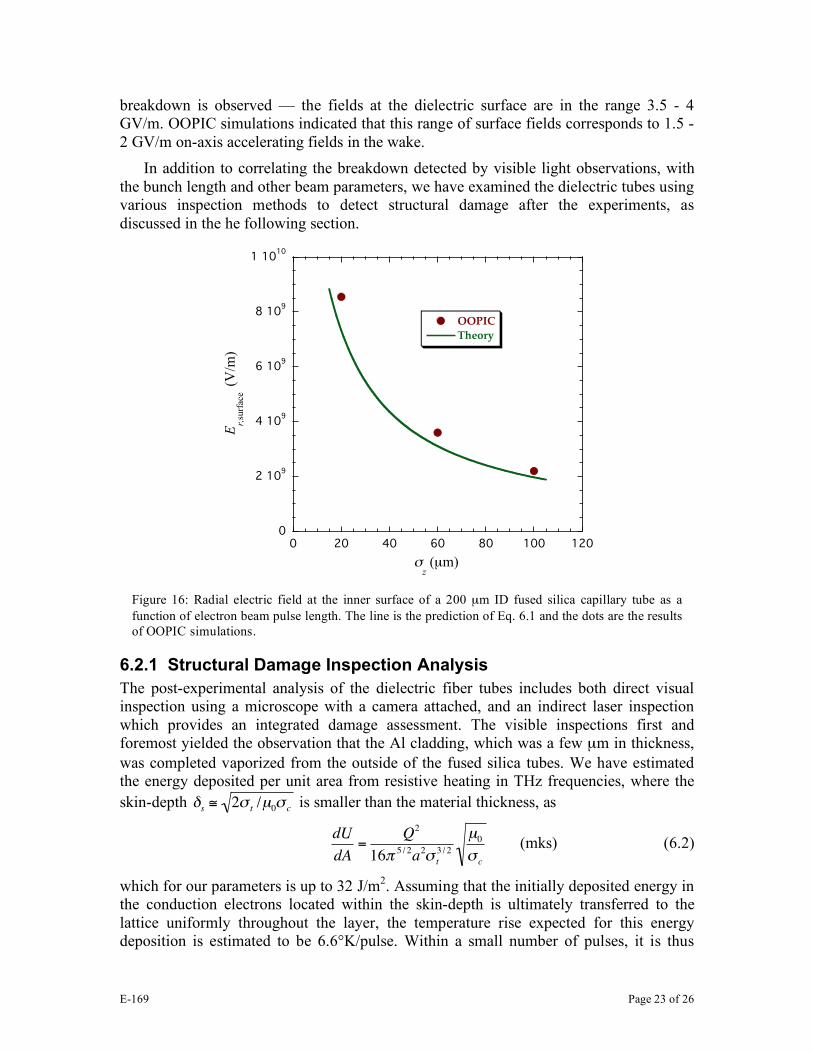
E-169 Page 23 of 26
breakdown is observed — the fields at the dielectric surface are in the range 3.5 - 4 GV/m. OOPIC simulations indicated that this range of surface fields corresponds to 1.5 - 2 GV/m on-axis accelerating fields in the wake.
In addition to correlating the breakdown detected by visible light observations, with the bunch length and other beam parameters, we have examined the dielectric tubes using various inspection methods to detect structural damage after the experiments, as discussed in the he following section.
0
2 109
4 109
6 109
8 109
1 1010
0 20 40 60 80 100 120
OOPIC
Theory
Er,
surf
ace (
V/m
)
!z (µm)
Figure 16: Radial electric field at the inner surface of a 200 µm ID fused silica capillary tube as a function of electron beam pulse length. The line is the prediction of Eq. 6.1 and the dots are the results of OOPIC simulations.
6.2.1 Structural Damage Inspection Analysis The post-experimental analysis of the dielectric fiber tubes includes both direct visual inspection using a microscope with a camera attached, and an indirect laser inspection which provides an integrated damage assessment. The visible inspections first and foremost yielded the observation that the Al cladding, which was a few µm in thickness, was completed vaporized from the outside of the fused silica tubes. We have estimated the energy deposited per unit area from resistive heating in THz frequencies, where the skin-depth
!
"s# 2$
t/µ
0$c
is smaller than the material thickness, as
!
dU
dA=
Q2
16" 5 / 2a2# t
3 / 2
µ0
# c
(mks) (6.2)
which for our parameters is up to 32 J/m2. Assuming that the initially deposited energy in the conduction electrons located within the skin-depth is ultimately transferred to the lattice uniformly throughout the layer, the temperature rise expected for this energy deposition is estimated to be 6.6°K/pulse. Within a small number of pulses, it is thus
E-169 Page 24 of 26
possible to vaporize the aluminum, considering that the low pressure and poor thermal conductivity of the environment the tubes are placed in.
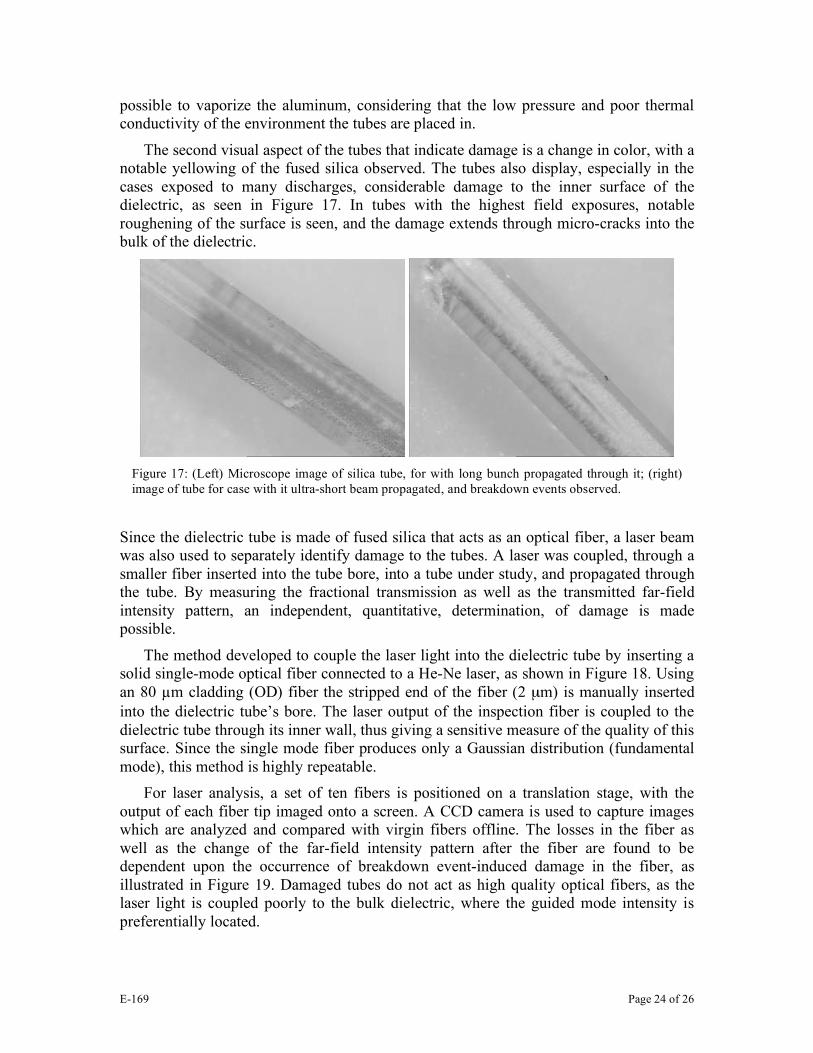
The second visual aspect of the tubes that indicate damage is a change in color, with a notable yellowing of the fused silica observed. The tubes also display, especially in the cases exposed to many discharges, considerable damage to the inner surface of the dielectric, as seen in Figure 17. In tubes with the highest field exposures, notable roughening of the surface is seen, and the damage extends through micro-cracks into the bulk of the dielectric.
Figure 17: (Left) Microscope image of silica tube, for with long bunch propagated through it; (right) image of tube for case with it ultra-short beam propagated, and breakdown events observed.
Since the dielectric tube is made of fused silica that acts as an optical fiber, a laser beam was also used to separately identify damage to the tubes. A laser was coupled, through a smaller fiber inserted into the tube bore, into a tube under study, and propagated through the tube. By measuring the fractional transmission as well as the transmitted far-field intensity pattern, an independent, quantitative, determination, of damage is made possible.
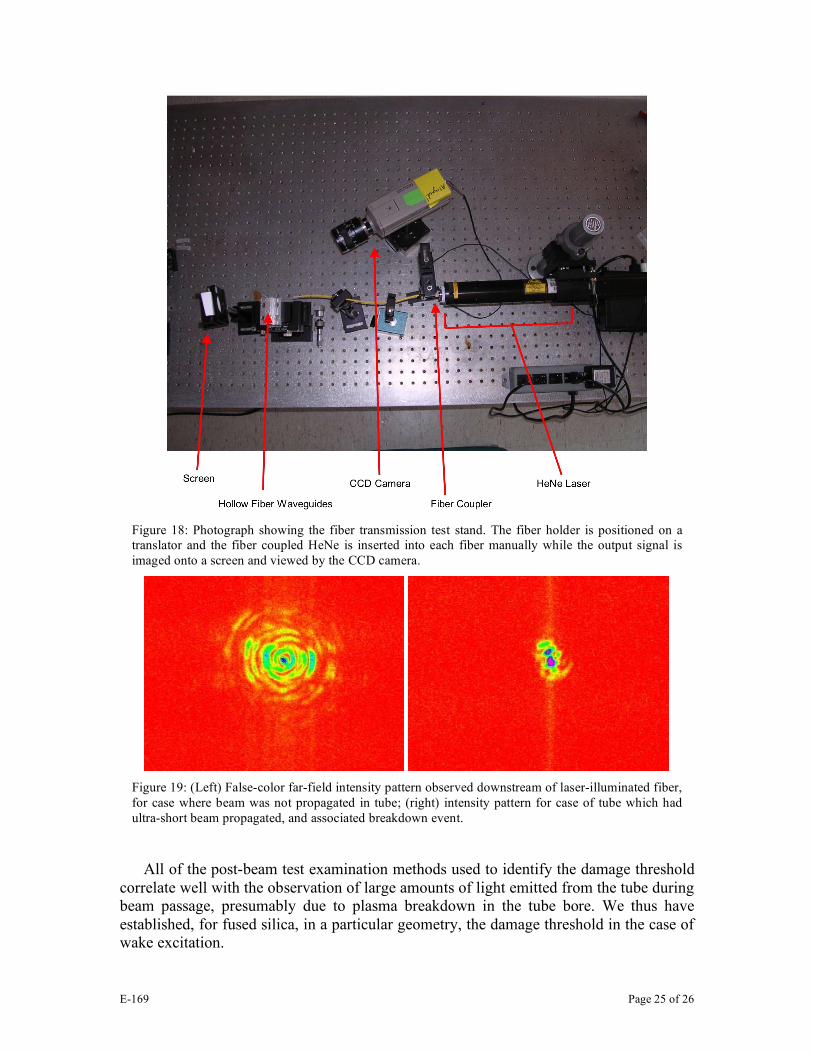
The method developed to couple the laser light into the dielectric tube by inserting a solid single-mode optical fiber connected to a He-Ne laser, as shown in Figure 18. Using an 80 µm cladding (OD) fiber the stripped end of the fiber (2 µm) is manually inserted into the dielectric tube’s bore. The laser output of the inspection fiber is coupled to the dielectric tube through its inner wall, thus giving a sensitive measure of the quality of this surface. Since the single mode fiber produces only a Gaussian distribution (fundamental mode), this method is highly repeatable.
For laser analysis, a set of ten fibers is positioned on a translation stage, with the output of each fiber tip imaged onto a screen. A CCD camera is used to capture images which are analyzed and compared with virgin fibers offline. The losses in the fiber as well as the change of the far-field intensity pattern after the fiber are found to be dependent upon the occurrence of breakdown event-induced damage in the fiber, as illustrated in Figure 19. Damaged tubes do not act as high quality optical fibers, as the laser light is coupled poorly to the bulk dielectric, where the guided mode intensity is preferentially located.
E-169 Page 25 of 26
Figure 18: Photograph showing the fiber transmission test stand. The fiber holder is positioned on a translator and the fiber coupled HeNe is inserted into each fiber manually while the output signal is imaged onto a screen and viewed by the CCD camera.
Figure 19: (Left) False-color far-field intensity pattern observed downstream of laser-illuminated fiber, for case where beam was not propagated in tube; (right) intensity pattern for case of tube which had ultra-short beam propagated, and associated breakdown event.
All of the post-beam test examination methods used to identify the damage threshold
correlate well with the observation of large amounts of light emitted from the tube during beam passage, presumably due to plasma breakdown in the tube bore. We thus have established, for fused silica, in a particular geometry, the damage threshold in the case of wake excitation.
E-169 Page 26 of 26
References 1. “Report of the HEPAP Subpanel on the Assessment of Advanced Accelerator Research and
Development” http://www.science.doe.gov/hep/AARDsubpanelreportfinalamendedAug21.pdf.
2. M. J. Hogan et al., Phys. Rev. Lett. 95, 054802 (2005) 3. S. P. D. Mangles et al, Nature 431, 535 (2004). C. G. R. Geddes et al, Nature 431, 538 (2004). J. Faure et al, Nature 431, 541 (2004). 4 M.E. Conde et al, Proceedings of 2005 Particle Accelerator Conference, 1485 (2005). 5. Thompson, et al., Proc. PAC 2005, p. 3067. 6 P. Sprangle, B. Hafizi, & R. F. Hubbard, Phys. Rev. E 55, 5964 (1997). 7. C.Wang, V.P.Yakovlev and J.L.Hirshfield. Proceedings Particle Accelerator Conference PAC-
2005, pp.1282-1284, 2005. 8. A.Kanareykin et al. Proceedings AAC-2006, to be published. 9. R. Heidinger et al., IEEE Trans Plasma Sci 30 800 (2002) 10. http://www.ddk.com/propertiesofcvddiamond.htm 11. Handbook of Industrial Diamonds and Diamond Films, edited by M. A. Prelas, et al., (NY-
HK, Marcel Dekker, 1998) 12. Sussmann, R. S et al. Proc. SPIE Vol. 2286, p. 229-238, Window and Dome Technologies
and Materials IV, Paul Klocek; Ed. 1994. 13. Ben-Zvi et al, “Diamond Secondary Emitter Photocathodes”, Proc. workshop on the Phys.
and Appl. of High Brightness. Electron Beams, Erice, Sicily (WS, 2006).. 14. A.Kanareykin et al. Developments on a Diamond-based Cylindrical Dielectric Accelerating
Structure Proceedings EPAC-2006, to be published 15. A.Shih, J. Yater, P. Pehrsson, J. Butler, C. Hor, and R. Abrams. J. Appl Phys. 82, 1860-1867
(1997). 16 L. V. Keldysh, Sov. Phys. JETP 20, 1307 (1965). 17 See for example B. C. Stuart et al, Phys. Rev. B 53, 1749 (1996). 18 J. Seeman, W. Brunk, R. Early, M. Ross, E. Tillmann and D. Walz, SLC Energy Spectrum
Monitor using Synchrotron Radiation. 1986 Linear Accelerator Conference Proceedings, SLAC-PUB-3945, June 1986.
19 K. L. F. Bane & P. Emma, Proceedings of 2005 Particle Accelerator Conference, 4266 (2005) 20 D. L. Bruhwiler et al , Phys. Rev. ST Accel. Beams 4, 101302 (2001). 21 G. Dôme, Proceedings of the Second European Accelerator Conference 628 (1990). King-Yuen Ng, Phys. Rev D 42, 1819 (1990). M. Rosing and W. Gai, Phys. Rev D 42, 1829 (1990).