A photoelectron–photoion coincidence imaging apparatus for ...
29
Review of Scientific Instruments (2008), in print. A photoelectron–photoion coincidence imaging apparatus for femtosecond time-resolved molecular dynamics with electron TOF resolution of σ=18 ps and energy resolution ΔE/E=3.5% Arno Vredenborg, Wim G. Roeterdink, and Maurice H.M. Janssen * Laser Centre and Department of Chemistry, Vrije Universiteit, de Boelelaan 1083, 1081 HV Amsterdam, The Netherlands (Dated: May 29, 2008) 1
Transcript of A photoelectron–photoion coincidence imaging apparatus for ...
Review of Scientific Instruments (2008), in print.
A photoelectron–photoion coincidence imaging apparatus for
femtosecond time-resolved molecular dynamics with electron
TOF resolution of σ=18 ps and energy resolution ∆E/E=3.5%
Arno Vredenborg, Wim G. Roeterdink, and Maurice H.M. Janssen∗
Laser Centre and Department of Chemistry,
Vrije Universiteit, de Boelelaan 1083,
1081 HV Amsterdam, The Netherlands
(Dated: May 29, 2008)
1
Abstract
We report on the construction and performance of a novel photoelectron-photoion coincidence
machine in our laboratory in Amsterdam to measure the full three-dimensional momentum distri-
bution of correlated electrons and ions in femtosecond time-resolved molecular beam experiments.
We implemented sets of open electron and ion lenses to time stretch and velocity map the charged
particles. Time switched voltages are operated on the particle lenses to enable optimal electric
field strengths for velocity map focusing conditions of electrons and ions separately. The position
and time sensitive detectors employ micro-channel-plates (MCP) in front of delay line detectors.
A special effort was made to obtain the time-of-flight (TOF) of the electrons at high temporal
resolution using small pore (5µm) MCPs and implementing fast timing electronics.
We measured the TOF distribution of the electrons under our typical coincidence field strengths
with a temporal resolution down to σ=18 ps. We observed that our electron coincidence de-
tector has a timing resolution better than σ=16 ps, which is mainly determined by the residual
transit-time-spread of the MCPs. The typical electron energy resolution appears to be nearly laser
bandwidth limited with a relative resolution of ∆EFWHM/E = 3.5% for electrons with kinetic
energy near 2 eV. The mass resolution of the ion detector for ions measured in coincidence with
electrons is about ∆mFWHM/m = 1/4150. The velocity map focusing of our extended source
volume of particles, due to the overlap of the molecular beam with the laser beams, results in a
parent ion spot on our detector focused down to σ = 115 µm.
∗Corresponding author. E-mail: [email protected]
2
I. INTRODUCTION
The first application of spatially sensitive single particle detectors in molecular photodis-
sociation by Chandler and Houston two decades ago1 was the beginning of an new era in
molecular dynamics and spectroscopy.2 During the last decade there has been a strong in-
terest to measure the full three-dimensional momentum distribution of coincident ions and
electrons ejected in a molecular dynamical process.3–14 The detectors employed in these ex-
periments are usually based on position and time sensitive single particle detectors consisting
of micro-channel-plates (MCP) and delay line or cross-strip anodes.15–17
Recently, there have been various efforts to improve the spatial resolution of the measured
distributions of electrons and ions ejected from an extended source region of the particles
using additional focusing lenses. In many cases some form of velocity map imaging18 of
the charged particle trajectories is used to focus trajectories with the same momentum
originating from a source region several mm length onto a much smaller spot on the detector.
Besides the efforts to improve the spatial resolution there have been developments to
improve the temporal resolution of the MCPs and electronics used to measure the time-of-
flight (TOF) of the particle at the detector. In some cases the TOF is measured from the
transient signals of the delay lines using time-to-digital-converters (TDC). In those cases
fast multi-channel TDC electronics are needed to measure all the spatially encoding delay
line signals with high temporal resolution. Recent developments in highly accurate timing
clocks19 have been implemented in multi-channel (8 or 16 channels typically) timing boards
with a resolution down to 20 ps.20 Even though these timing boards have in principle a
very high resolution timing bin, the measured resolution of the TOF from the average of
the time-sum of delay line signals has usually been specified to be no better than about
100 ps.21 A second technique to measure the TOF of the particles is to use an additional
pickup signal from the MCP when the particle hits the detector. This pickup signal is
amplified and usually processed by a constant-fraction-discriminator (CFD) and a high
resolution time-to-amplitude (TAC) device. State-of-the-art integrated CFD/TAC boards
were reported to have electronic resolutions down to σ = 4.1 ps.22 The ultimate single
particle temporal detection resolution is determined by the transit-time-spread of micro-
channel-plate detectors23, the quality (i.e. low walk) of the CFD used to process the pickup
signal and the accuracy and resolution of the TAC.24
3
In this paper we report on the design and performance of a newly constructed
photoelectron-photoion coincidence detector for femtosecond time-resolved coincidence ex-
periments on molecules. The apparatus employs a doubly skimmed molecular beam which
is crossed by tunable multi-color femtosecond laser pulses and two position and time sen-
sitive detectors on opposite sides of a specially designed lens. We use pulsed electric fields
for optimum spatial and temporal resolution of electron and ion trajectories. We espe-
cially focussed to achieve a high temporal resolution of the TOF of the detected electrons
and combined improvements in implementation of ion focusing optics, temporal response of
small pore micro-channel-plates and state-of-the-art TAC and TDC electronics. The result
of these efforts is a timing resolution for the observed coincident single electron hits from
our extended source region down to σ=18 ps on a typical electron TOF of 15 ns. The high
resolution detection of the three-dimensional momentum coordinates of the electrons enables
the measurement of high resolution electron images in coincidence with high resolution ion
images.
The paper is structured as follows. In Section II we give a description of the design
of the new molecular beam apparatus and the implementation of the detection equipment
synchronized to our femtosecond laser system running at a repetition rate of 5 kHz. In
Section III we give a detailed report on the spatial and mass resolution of the ion images,
and the spatial and temporal specifications of our coincident electron detector. Furthermore,
we illustrate the performance of the new photoelectron-photoion coincidence apparatus with
representative images for femtosecond photodynamics in Xe, NO and NO2.
II. APPARATUS
A. The vacuum apparatus and molecular beam
The UHV vacuum machine consists of three differentially pumped chambers, a source,
buffer and imaging chamber, see Fig. 1. To reduce as much as possible any contamination of
the vacuum system we use oil free pumps in the whole vacuum apparatus. After the machine
has been vented and opened for modifications we typically bake the whole apparatus to about
1200C to reach optimum vacuum. The three chambers are pumped by magnetically levitated
turbo molecular pumps, the source chamber has a 1250 l/s turbo drag pump (Alcatel ATH
4
1300 MT), the buffer chamber a 400 l/s (ATH 400 MT) and the imaging chamber a 2100
l/s (ATH 2300 MT) pump. All turbo pumps are backed by a single five stage oil free roots
pump (Alcatel ACP28G). A removable liquid nitrogen trap between the turbo pumps and
the roots pump prevents corrosive gasses from entering the forepump. The last four stages of
the forepump are continuously purged with nitrogen gas. With the molecular beam off the
base pressures are 5.10−9 mbar in the source chamber, 1.10−9 mbar in the buffer chamber
and <5.10−10 mbar in the detection chamber.
A nozzle with a diameter of 100 µm is located in the source chamber to produce a
continuous molecular beam. The typical backing pressure behind the nozzle is 1.0 bar. The
molecular beam is doubly skimmed (BeamDynamics) with the first skimmer (diameter 1
mm) positioned about 2 cm downstream of the nozzle. The second skimmer (diameter 200
µm), which separates the buffer chamber from the imaging chamber, is located about 12 cm
downstream of the first skimmer. With the molecular beam on the pressure in the imaging
chamber increases to about 2-4×10⁻⁹ mbar. The molecular beam is crossed about 45 cm
downstream of the nozzle by the femtosecond laser pulses. A lens (typically with focal length
of 30-50 cm) focusses the laser waist down to about 100-150 micron in diameter. From the
geometry and location of our skimmers we estimate that the laser crosses the molecular
beam in the direction of the laser propagation along a length of about 1 mm. Light baffles
are mounted at the entrance and exit ports of the laser beams to reduce scattered UV laser
light from reaching the detectors. The incoming laser beam is doubly skimmed using home
built conical skimmers with a diameter of 2 mm.
B. Photoelectron-photoion coincidence detector
After interaction of the molecules with the femtosecond laser pulses, the electrons and
ions are extracted by lenses into two opposite TOF tubes. In Fig. 2 we give a schematic
drawing of the geometry of our lenses and the TOF tubes. The electron TOF tube and the
lenses are shielded from the earth magnetic field by a 1 mm thick µ-metal tube.
All electrodes are open and the TOF tubes and the front MCP plate of both detectors
are at ground potential. Besides the standard repeller and extractor lenses for velocity map
imaging we added for both the electrons and the ions an extra lens, Le and Li, respectively,
to enable lower extraction voltages in the region where the electrons and ions are formed.
5

Furthermore, these lenses make it possible to compensate for the somewhat distorted field
for velocity map imaging due to the relatively large open diameter on the repeller lenses.
In principle, when setting the voltages for optimal electron velocity mapping the ion lens
Li can be operated at higher negative voltage to make the field at the open position of the
electron repeller Re (is also ion extractor plate Ei, see Fig. 2) more homogeneous. For the
results presented in this paper we did not implement this extra feature yet, and switched
the ion lens Li from zero voltage when we detect the electrons.
In order to have optimal voltages and extraction field strength for both electrons and
ions we operate the lenses in a pulsed mode at the 5 kHz repetition rate of our experiment.
Because the typical electron TOF is about 15 ns and the ion TOF is of the order of several
µs for each laser shot we initially set the lenses Re, Ee and Le for the voltages to image
the electrons. Typically, Re=-520 V, Ee=-385V, Le=-270 V and the voltages are carefully
adjusted for optimum electron images. These lens voltages enables the detection of electrons
with kinetic energies up to 3-3.5 eV perpendicular to the TOF axis. Subsequently, about 50
ns after detection of the electron, the polarity of the lenses Re=Ei and Ee=Ri are switched
to velocity map the coincident ion on the second detector. The HV-switches consist of
Behlke switches (HTS-51) and within 100 ns the polarity is completely reversed to maintain
optimum voltages for the ion trajectories. The lenses remain at positive voltages for about
15 microseconds and subsequently the polarity is switched back again within 100-150 µs
to the initial settings for optimum electron imaging. The ions are most efficiently detected
by MCPs with significant impact energy (>1000 eV).25 Therefore, the ions are accelerated
typically with Ri=2000 V, Ei=1550 V and Li=750 V on the ion lens. These acceleration
voltages in combination with our ion TOF length allows the measurement of fragments with
a kinetic energy up to 2 eV. For higher kinetic energies the acceleration voltages can be
increased.
At the end of the TOF tubes two position- and time-sensitive particle delay line detectors
(Roentdek21 large anode DLD40X) are mounted with the TOF axis perpendicular to the
molecular beam. Both detectors have 40 mm active diameter MCPs mounted in a Chevron
configuration. The front of the input MCP of both detectors is grounded to prevent stray
electric fields from penetrating the field free TOF region. The MCPs for the electron de-
tector, Dete, have 5µm pore channels (L:D=60:1) biased at 12 degrees and the front plate
has an additional MgO coating for optimum electron detection. The extra benefit of the
6
MgO coating is the reduced sensitivity of the MCP for scattered UV radiation from the laser
pulses. The MCPs of the ion detector, Deti, have 12.5µm pore channels (L:D=80:1). To
compensate for the translation of the ion sphere because of the center-of-mass movement
of the ions in the direction of the molecular beam velocity we moved the ion detector Deti
about 7-8 mm relative to the electron detector Dete.
The delay line signals are processed by a differential input 8 channel front-end CFD
(ATR19-8-NIM) and the 8 NIM output signals are fed into a high-resolution TDC board
using the CERN HPTDC19 chip (TDC8HP). The least-significant-bit (LSB) of this TDC is
specified as 25.0 ps and the TDC has a double hit dead-time of less than 10 ns.21 The common
trigger of the TDC channels is produced by a photodiode with an integrated CFD producing
a NIM output pulse (Becker&Hickl OCF-401). A homebuilt fast OR-gate processes the
optical trigger and one of the ion delay line signals into a single channel of the 8-channel
TDC. The position information in x or y direction is obtained for each detector by using the
time difference of the two x or y TDC delay line signals and a conversion of 1.9 ns / mm.21
To obtain a better accuracy of the electron TOF signal than can be obtained from the
time sum of the TDC signals, we use a pickup signal from the back MCP plate of the electron
detector. This signal is AC-coupled by a capacitor into a 50 Ohm cable to a SMA vacuum
feedthrough. The pickup signal has a typical amplitude of about 15 mV in 50 Ohm. The
signal is pre-amplified and processed by an integrated CFD/TAC (Becker&Hickl SPC-130).
We operate the TAC in reverse start-stop mode, i.e. the electron pickup signal starts the
TAC and a delayed trigger from a fast photodiode is used as the stop signal. Because the
travel time of the pickup signal may be dependent on the exact position of the impact on
the MCP relative to the position of the pickup lead, we correct for each electron event the
measured TAC TOF value for the distance between the impact on the MCP (known from
the delay line position coordinates) and the pickup lead from the back plate. The maximum
difference in the distance between two events with our diameter MCPs is 40 mm. If we
assume that the travel time of this transient MCP back potential to the pickup lead on the
MCP is determined by the linear distance between these two points a distance of 40 mm
corresponds to a difference in travel time for the voltage pickup pulse of 40 mm / propagation
speed. In our data analysis we find an optimum correction of our electron TOF from the
asymmetry in the arrival time distribution using a pickup propagation speed of 0.7 times
the speed of light. It means for a maximum position difference of 40 mm it can amount to
7
a TOF correction of 190 ps maximum.
The signals from the TDC and TAC boards are synchronized using time stamps in our
home written data acquisition programme. A valid photoelectron-photoion coincident event
is received when all 8 channels of the TDC and the single TAC channel have an event
recorded. The typical coincidence rate in our experiments is about 0.02-0.05 per laser shot,
which means we have a typical number of coincidence events of 100-250 events/s at the 5
kHz repetition rate of our femtosecond laser system.
C. The femtosecond laser system
The femtosecond laser system (Spectra Physics) consists of a Titanium-Sapphire oscillator
(Mai-Tai) which seeds the chirped regenerative amplifier (Spitfire Pro). The regen amplifies
the seed oscillator pulses to 500 µJ at a repetition rate of 5 kHz. A small percentage of
the regen is split off and monitored online with a homebuilt single shot SHG autocorrelator
equipped with a CCD camera. The shortest pulse obtainable from the regen system is about
130 fs. The color of the frequency doubled and frequency tripled pulses is monitored with a
spectrum analyzer (Ocean Optics). Typical pulse energies used are 4 µJ for the probe laser
(266 nm) and 15 µJ for the pump laser (400 nm). A CCD camera is used to estimate the size
of the focus of about 90 µm of both pump and probe laser. The 800 nm regen pulses can
also be used to pump two independent homebuilt noncollinear-opto-parametric-amplifiers
(NOPA) to generate short (25-30 fs) tunable laser pulses in the visible wavelength region.
To demonstrate the performance of the coincidence detector we will present in this paper
only data using the second (400 nm) and third (266 nm) harmonic of the 800 nm regen laser.
III. RESULTS AND DISCUSSION
A. Spatial and mass resolution of coincident ions
The pitch of the wires of the DLD40X delay line is 1 mm. With the minimal digitizing
resolution of the TDC of 25 ps and the time to position conversion of 1.90 ns/mm21 the
theoretical spatial resolution of the detectors is about 25/1.9 = 13 µm, close to the 12.5 µm
pore diameter of the ion MCPs. This assumes that the quality of the delay line signal, that is
formed by the overlapping contributions of multiple wires spaced at the 1 mm pitch from the
8
extended electron footprint from the exit of the MCP, and the quality of the ATR-19 CFD is
so good as to not contribute to additional broadening of the spatial resolution. It has been
shown before that cross-strip anodes with a pitch of 500 µm can reach a spatial resolution
of about 1/100 of the pitch diameter and were limited by the ultimate pore diameter of the
entrance MCP of about 7 µm.26
However, in our application the spatial resolution is limited by the quality of the velocity
map imaging of the ion trajectories due to the extended source of the ions and electrons.
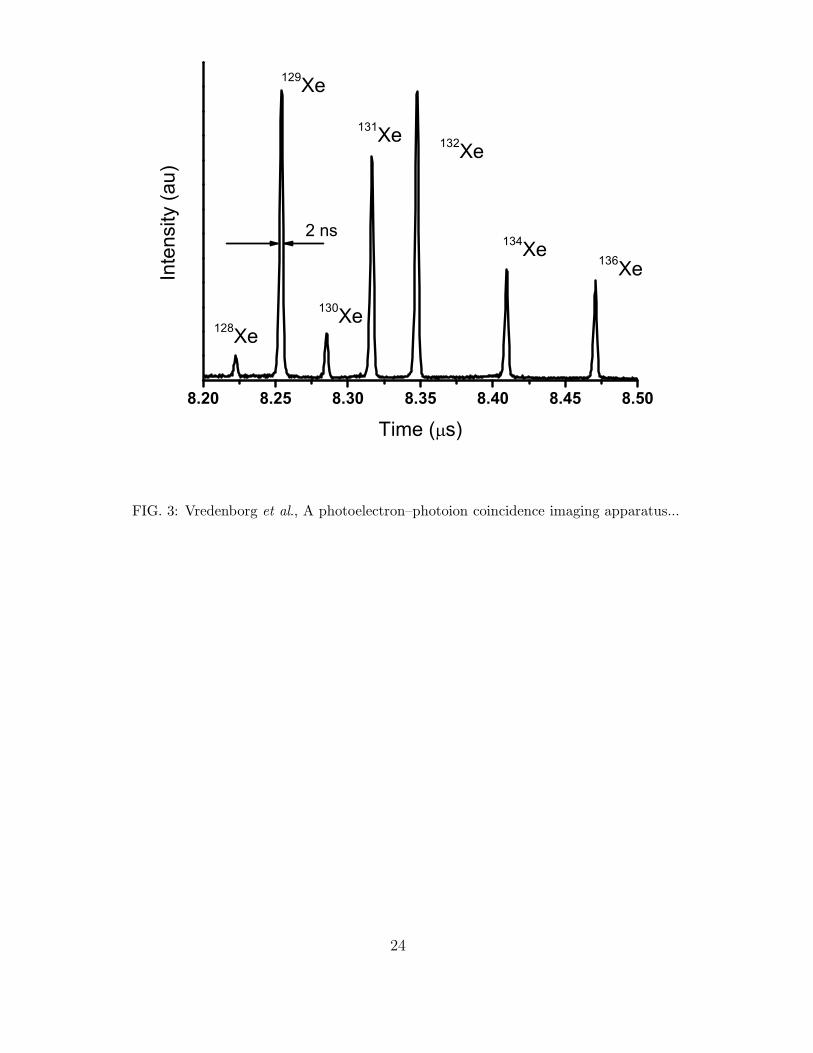
In Fig. 3 we show the Time-Of-Flight spectrum of the Xenon isotopes as determined from
the time-sum of the delay line signals of the ion detector. The ions were produced by a four
photon absorption of a 400 nm femtosecond laser pulse and were measured in coincidence
with electrons by switching the voltages on the ion lenses as discussed in Section IIB. The
individual isotope peaks have a FHWM of 2 ns giving a mass resolution at the Xe mass
of ∆m/m = 1/4150. This mass resolution can be up to a factor of two better, ∆m/m ≈1/8000, in static conditions. This is due to some additional spreading introduced by the
changing voltages on the ion lenses when the voltages are switched to the ion geometry after
the arrival of the coincident electron.
The lack of internal degrees of freedom in Xenon ensures that all the excess energy is
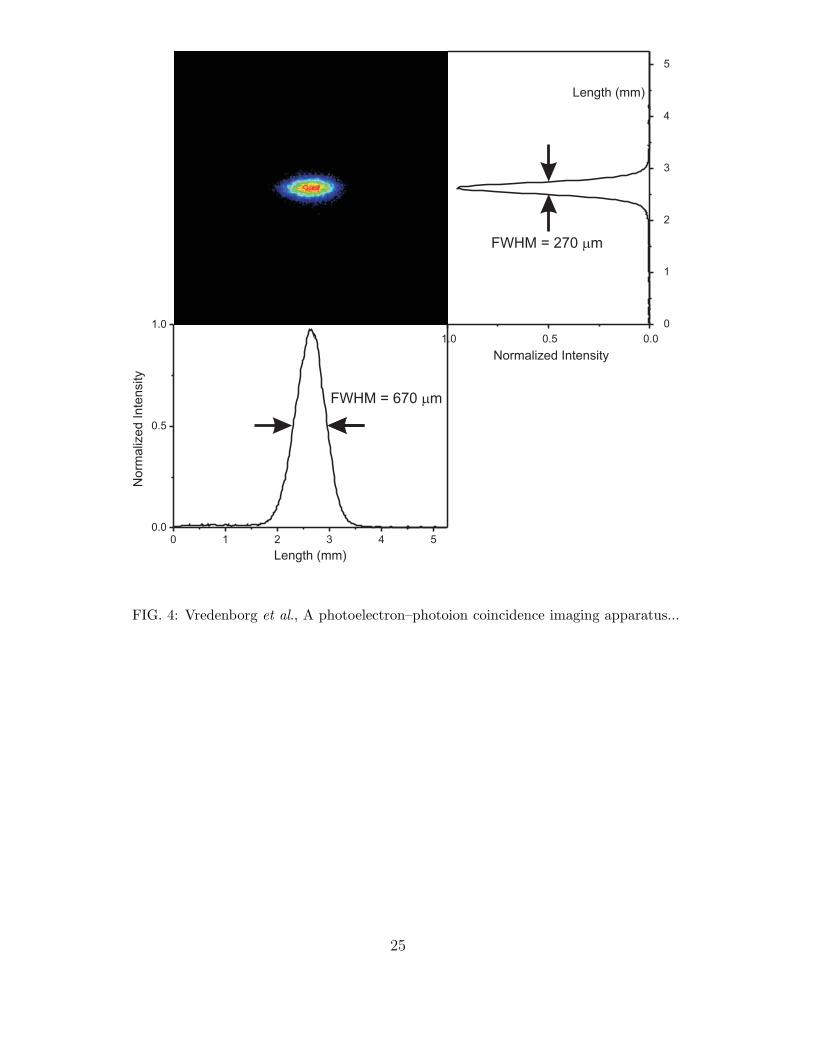
converted into kinetic energy of the electron. The ion image of Xenon reflects the focusing
resolution of the ion optics and is shown in Fig. 4. The spatial size of the parent ion in x
and y-directions are indicated in the graphs next to the x-y image. The image size in the
direction of the laser propagation direction, y-direction, can be fitted to a Gaussian with
σ = 115 µm (FWHM = 270 µm).27 This represents the best focussing conditions of our
velocity map apparatus in coincident imaging mode. This means that we focus the initial
spot of about 1 mm length, due to the crossing of the laser beam with the molecular beam,
to a spot size about 5 times smaller on the ion detector.
The best possible resolution for both the time and position detection of the charged
particles is achieved with a point source of particles. However, experimentally the source
is determined by the interaction region of the molecular beam with the laser, which crosses
the molecular beam at 90 degrees. In our case, the laser beams are typically focussed to
about 90 µm (FWHM of the focus of the intensity distribution fitted to a Gaussian shape)
or somewhat less. The calculated Rayleigh length is about 7 cm for a Gaussian laser beam
with 90 µm waist at a wavelength of 400 nm. In case of multiphoton transitions the effective
9
length of the laser focus will be shorter, but under all our experimental conditions the
effective source region along the laser propagation direction is bounded by the diameter of
the molecular beam at the laser crossing which is about 1 mm. This crossing of the focussed
laser beam with the molecular beam at 90 degrees results in a cylindrically shaped source
region. It defines an upper bound to the size of the source along the time-of-flight axis
and in the direction of the molecular beam of about 90 µm. This effective source region of
ions may even be smaller than 90 µm for multiphoton excitations. Along the propagation
direction of the laser beam the source region has a length of about 1 mm, i.e about ten times
larger. Decreasing the size of the molecular beam improves the spatial resolution as well
as the time resolution, but also decreases the number of molecules due to a smaller source
volume of particles.
Velocity map imaging partially solves the problem of the relatively large spatial extension
of the source region along the laser propagation direction. From SIMION simulations of our
ion lenses we find that the TOF-difference of two Xe-ion trajectories starting in the source
region ±50 µm displaced along the TOF axis on either side of the centre point of our
source region is about 2 ns for Xe+ ions with a forward molecular beam velocity of 0.213
eV (Xe seeded in Ar going at 560 m/s). The time difference is equal to the experimentally
obtained value and is not compromised much under the velocity map imaging conditions. For
extensions up to about ±500 µm on either side of the centre along the propagation direction
of the laser it increases to about 2.5 ns according to SIMION simulations. Therefore, no
special Wiley-McLaren conditions28 have to be applied to achieve a better time resolution
as was done by Lebech et al.8 However, for larger interaction regions in both directions the
velocity mapping condition starts to reduce the time resolution more strongly. Therefore, it
is recommended to limit the length of the velocity map region to 1 mm or less by properly
skimming the molecular beam. In our set-up we have positioned a rather small second
skimmer of 200 µm diameter (see Section IIA).
The velocity distribution along the direction of the molecular beam is limiting the spatial
resolution in the x-direction. The molecules of study are typically seeded in Argon and
are traveling at a final speed of about 560 m/s. As can be seen in Fig. 4 a Gaussian fit
to the spatial distribution along the molecular beam direction gives a spatial resolution
of σ = 285 µm (FWHM = 670 µm). From the displacement on the ion detector of the
position of the focussed parent ion spot (ions from ionization of moving Xe atoms in the
10
seeded beam) relative to the position of the ion spot from ionization of thermal background
gas, we can calculate the conversion from distance to ion velocity. The width of the ion
focus in the direction of the molecular beam represents a FWHM velocity spread of about
85 m/s. This is a very typical velocity spread for a continuous molecular beam expansion
with 1 bar behind a 100 µm nozzle. In principle, this extension along the molecular beam
can be reduced by using beams with better longitudinal translational cooling. This can be
achieved for instance with higher backing pressures and we are currently working to develop
a pulsed molecular valve for operation at 5 kHz to obtain higher beam intensities and lower
translational velocity spread along the molecular beam direction. However, for experiments
employing femtosecond velocity map ion imaging29–31 it appears that the fragment ion kinetic
energy distribution in femtosecond time-resolved experiments of polyatomic molecules is
rather broad without sharp features due to the many internal degrees of freedom in the
polyatomic fragment where the residual of the energy can be deposited. This means that
the presently obtained velocity resolution for the ionic fragment is sufficient.
B. Electron single hit TOF resolution
Recently, there have been reports on the implementation17,32 and design performance
goals33 of a high resolution TOF and momentum detector for photons and electrons. The
realized TOF resolution of this cross-strip anode for the detection of scattered photons from
a synchrotron source was reported to be σ = 55 ps (FWHM = 130 ps).32 In the high-energy
physics community there is presently an effort to develop fast MCP based multi-anode
photon detectors for Cherenkov radiation from high energy particles with the ultimate goal
of a time-of-flight resolution of a multi-photon event near σ = 1 ps.34 At present the best
reported result for detection of the TOF of multiple photons from a single high energy 3GeV
pion-beam particle is about σ=6 ps.22
In the development of our new photoelectron-photoion coincidence imaging apparatus we
put a strong effort to obtain a high-resolution for the TOF of the coincident single electron as
measured with our MCP delay line electron detector. The typical acceleration voltages that
are employed to measure the three-dimensional momentum distribution of photoelectrons
with energies up to 2 eV are Re=-520 V, Ee=-385V, Le=-270 V. If electrons with 3-3.5 eV
are ejected in a direction perpendicular to the TOF axis they will still fall within the 40 mm
11

diameter of our MCP using these lens voltages. We measured the electron TOF resolution
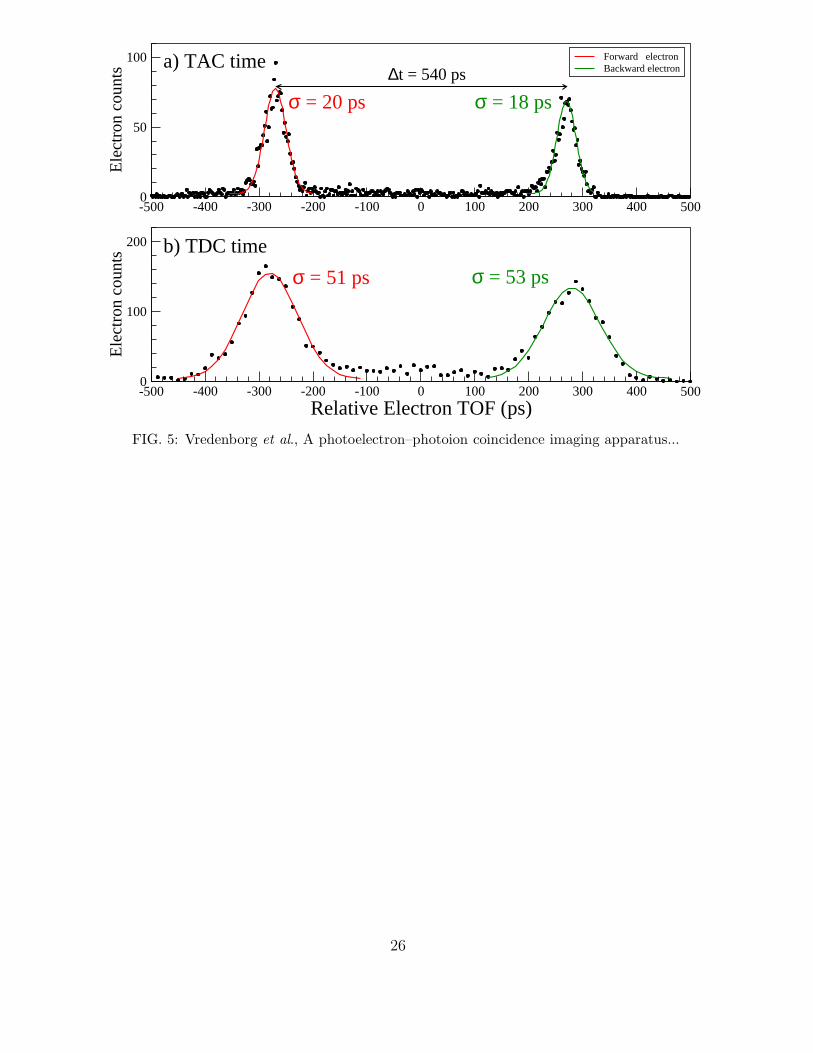
under these normal acceleration conditions. In Fig. 5 we show the arrival time distribution of
electrons in coincidence with Xe+ ions as obtained (for the same events) by the pickup signal
and the TAC (panel a) versus the delay line signal and the TDC (panel b). The electrons are
produced by 4-photon ionization of Xe by a 130 fs laser pulse at 400 nm. The polarization
of the laser was oriented along the TOF direction. This results in the production of forward
(in the direction of the electron detector) ejected electrons and backward (in the direction
of the ion detector) ejected electrons. So for each coincident (e,Xe+) event we have for the
electron TOF 4 delay line timing signals obtained by the TDC (2 for the x-position and 2
for the y-position) and 1 pickup signal processed by the TAC.
The time difference between the forward and backward ejected electrons is mainly deter-
mined by the extraction field strength, Eextract. A lower extraction field leads to a larger
difference in arrival time between particles of mass m ejected in the forward (towards detec-
tor) or backward (away from detector) direction, TFB. This time difference TFB, due to an
initial kinetic energy Ekin of the charged particle of mass m, can be estimated with the help of
a simple formula TFB ≈√
8 ∗ m ∗ Ekin/qEextract. This means that the lower the extraction
field the larger the forward-backward time difference TFB. This is the reason we added an
extra lens, Le, to the standard velocity map lenses, see Fig. 2. It enables us to do ‘slow‘ field
extraction of the electrons, and at the same time preserve velocity map imaging conditions.
For instance, using the formula above (and also supported by more exact SIMION trajectory
simulations), we find for a coincident (with Xe+ ions) electron with kinetic energy of Ekin =
0.285 eV, formed in an extraction field of Eextract = 6.7 V/mm, that the time difference is
TFB = 540 ps. This field of 6.7 V/mm is the field, according to SIMION simulations, in the
laser interaction region of our lenses using the voltages of Re=-520 V, Ee=-385V, Le=-270
V on the lenses, see Fig. 2. Note that due to the rather open structure of our repeller and
extractor electrodes the field in the centre between repeller and extractor is lower than the
field calculated for a simple fully closed parallel plate capacitor spaced at a distance between
repeller and extractor of 15 mm (≈135 V/15 mm = 9 V/mm). We observe experimentally
a forward-backward time of TFB = 540 ps (Fig. 5), exactly as calculated. We used our
same physical electrodes also in standard velocity map mode, i.e. with only a repeller and
an extractor and no extra lens electrode. For standard velocity map mode we observed
experimentally velocity map imaging of the electrons for Re=-520 V, Ee=-315 V, Le=0 V,
12
and a forward-backward time difference of only TFB ≈ 320 ps. It means the slow extraction
geometry, as implemented here using the extra lens Le, in comparison to standard velocity
map imaging with repeller and extractor plates only, enables us to reduce the extraction
field substantially. The lower field stretches the forward-backward time difference from 320
ps to 540 ps, i.e. by almost 70% and still enables us to do velocity map imaging of electrons
with similar maximum kinetic energy up to 3-3.5 eV. We have taken electron images (not
shown here) with the three lenses, Re, Ee and Le, set at an even lower extraction field of 4.8
V/mm, which is close to the minimum field strength needed to still be able to velocity map
electrons with Ekin = 2.0 eV on the detector with sufficient spatial resolution. This lower
field results in a forward-backward time stretched to 750 ps for electrons with 0.285 eV.
In summary, the extra electrode Le, lengthens the forward-backward time while preserving
velocity map imaging conditions and as such provides a better time resolution.
As can be seen in panel a) of Fig. 5 the arrival time distribution of the electrons as mea-
sured from the pick-up signal and the TAC can be fitted to a Gaussian shaped distribution
with a resolution of σ = 18 ps for the backward ejected electrons and σ = 20 ps for the
forward ejected electrons. The coincident electrons were selected to arrive within a spatial
region of about 1.37 mm2 (a radius of 50 TDC units = 50 · 25 / 1.9 = 660 µm) centered
around the TOF normal of the electron detector. The (x,y) position of the electron events
were obtained from the delay line signals and the time difference of the TDC flight times.
In panel b) we show the TOF for the same selected electron events as obtained from the
average of the two x-direction delay line TDC measurements. As can be seen by comparison
the TAC measurement gives about a factor of 2.5 better timing resolution than the TDC. We
believe that our electron TOF resolution of σ = 18 ps is the best TOF resolution reported
so far for detection of electrons in a coincidence imaging set-up. For the slow electrons of
0.285 eV with a TFB = 540 ps it represents a relative time resolution of 18/540 = 3.3%
along the TOF direction. For electrons with much higher kinetic energy up to about 3 eV
the TFB increases to ≈√
10· 540 = 1700 ps at our typical lens voltages. It means that
for 3 eV electrons ejected along the TOF axis our coincidence detector has a relative time
resolution of about 1%.
It is interesting to note that the forward electron peak has a slightly higher intensity. We
are operating at an average count rate of about 250 counts/s so the average time between
two electron hits is about 4 ms. If we assume that a single electron hit in the entrance
13
channel of the front MCP leads to the excitation of 7 channels of the back MCP plate of
the electron detector, we estimate that each hit occupies an area with a radius of about 8.5
µm of the back MCP. As most of the intensity of the signal is for events near the center
of the image this may lead to slightly less gain efficiency of the MCP for backward ejected
electrons due to the gain recovery time of several (tens of) ms of a single MCP channel.35
To test our limiting TOF resolution we also measured the distribution for much higher
acceleration voltages. These voltages are normally not needed in our experiments, but if
one would have a molecular or atomic system that produces electrons with much higher
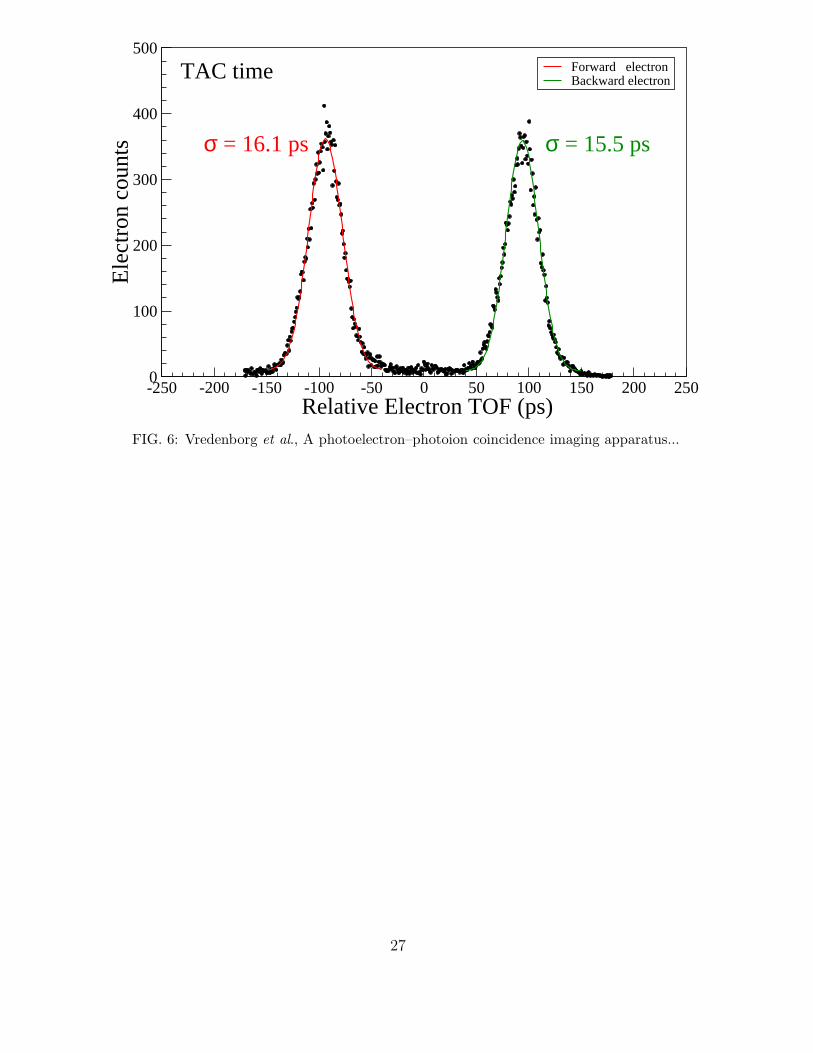
kinetic energy such higher voltages can be applied. In Fig. 6 we show the relative TOF
of the forward and backward ejected electrons produced in the same way as in Fig. 5 but
accelerated in velocity map mode with a field strength of about 19 V/mm. As can be seen
the forward-backward time is reduced to only 188 ps. And the resolution that is obtained
is slightly improved to σ = 16 ps. We think that the single electron TOF resolution of 16
ps is presently mainly limited by the transit-time-spread (TTS) of the MCPs used in our
electron detector and the residual TOF spread due to the extension of our source region of
electrons.
We have performed SIMION simulations to estimate the contribution of the extended
source region along the TOF axis. If we use a laser focus diameter of 100 µm and two forward
ejected electrons with either (0.285 + 0.019) eV or (0.285 - 0.019) eV at two positions spaced
∆l=100 µm apart the simulation calculates a difference in arrival time of 15 ps. If we take
this time difference to represent the FWHM contribution due to the spatial extension along
the TOF axis, we find the contribution to the resolution due to the spatial time difference
of σ∆l = 15/2.355 = 7 ps. If we subtract the contributions from the electronics (σTAC ≈ 4.1
ps22) and the ∆l=100 µm source region we obtain σTTS(experimental) =√
(162 − 4.12 − 72)
= 14 ps. The transit time in the MCP pores is equal to the sum of inter collision times in
the micro channels.36 The transit-time-spread (TTS) increases linearly with the length of
the plates and is inversely related to the square root of the acceleration field over the MCP
channel. Therefore, small pores and small Length-to-Diameter (L/D) ratio are prefered for a
good TOF temporal resolution, i.e. a Chevron configuration is preferred over a Z-stack. We
estimate the theoretical TTS of our 5 µm, L:D=60:1 Chevron MCP set by comparison with
the scaling laws23 and find σTTS(theoretical,Chevron,5µm, L:D=60:1)= 20 ps (FWHM = 46
ps). This is in reasonable agreement with the experimentally estimated σTTS(experimental)
14
= 14 ps, and it appears that the TTS largely accounts for the total resolution σ = 16 ps
observed in the electron detection of our coincidence imaging spectrometer.
C. Electron energy resolution
In Fig. 7 we show two electron images obtained in two different experiments on Xe atoms
(panel A) and NO molecules (panel B) with femtosecond pulses near 400 nm and 266 nm
at time overlap. The electron images were measured using our typical acceleration voltages
(see Fig. 5) with the polarization of both lasers along the detector plane. Various rings can
be observed due to various multi-photon processes. Xe is often used to calibrate our electron
images. The typical FWHM bandwith of our femtosecond pulses is about 19 meV at 400
nm and 26 meV at 266 nm. The electron peak at E=0.28 eV, labeled (a) in panel C, results
from ionization of Xe by a 2 photon excitation with 266 nm photons plus a one photon
excitation with 400 nm photons. The experimentally observed FWHM = 41 meV. This is
exactly the width that would be expected for this multi-photon excitation process due to
the finite width of our fs laser pulses, FWHM =√
(192 + 262 + 262) = 41 meV. It means
the resolution at these low energies is purely laser bandwidth limited. For the electron peak
at 1.87 eV, labeled (c) in panel C, which results from an ionization of Xe with 1 photon
of 266 nm and 3 photons of 400 nm (or 3 photons of 266 nm and 0 photons of 400 nm,
this is equal in energy) we observe an experimental resolution of FWHM = 65 meV. From
the photon process we would expect FWHM =√
(3 · 192 + 262) = 42 meV or FWHM =√
(3 · 262) = 45 meV. In this case the measured resolution is about 40% worse than the
total energy uncertainty due to the bandwidth of the short femtosecond laser pulses. Still
the relative energy resolution of our electron imaging detection for electrons near 2 eV of
∆EFWHM/E = 65/1870 = 3.5% is very good and it shows that our lenses operate at good
energy resolution and only slightly above the laser bandwidth limit.
In the lower part of panel C various photoelectron peaks, labeled (d)-(e), are observed
resulting from the photoionization of NO. A progression of Franck-Condon off-diagonal
∆v=1,2,3 peaks are observed when the centre wavelength of the laser pulses are carefully
tuned to 399.8 nm and 266.3 nm. The probable cause for the strong ∆v6=0 progression is
the excitation of a superexcited state at these wavelengths.
15
D. Photoelectron-photoion energy correlation
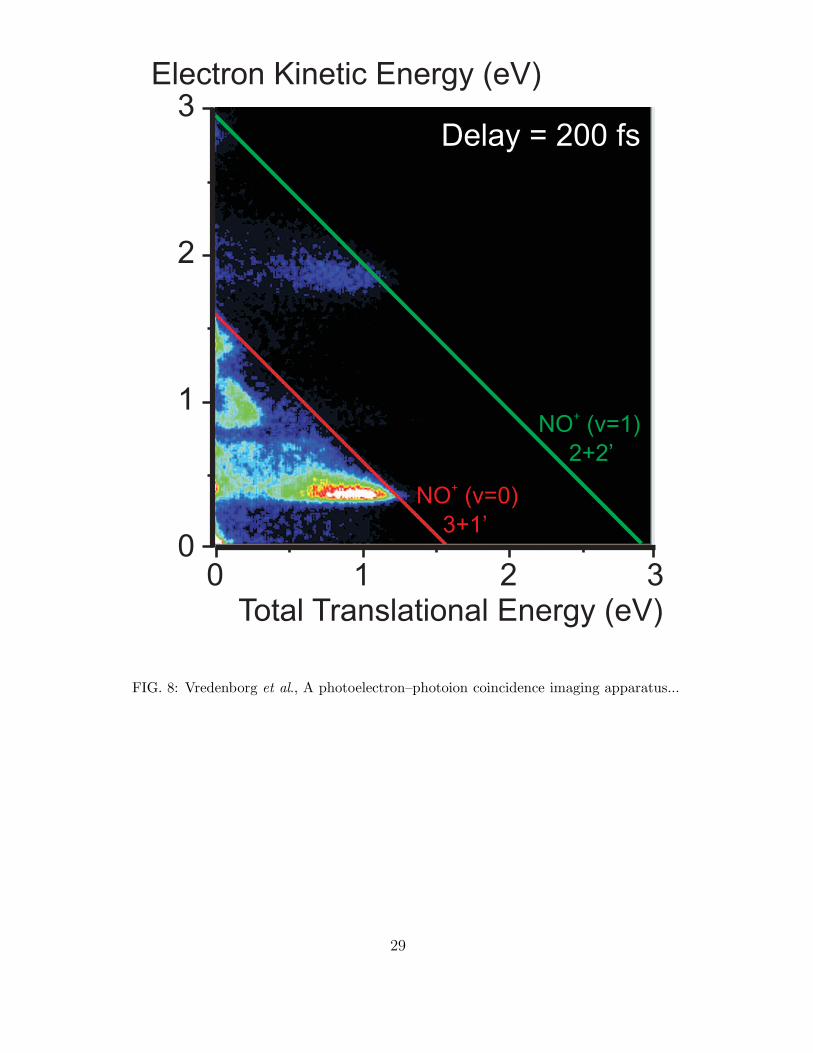
In Fig. 8 we show the correlated photoelectron-photoion electron distribution of electrons
and NO+ ions from the multi-photon multi-channel photoexcitation in NO2. The femtosec-
ond laser pulses were time delayed by about 200 fs, with the 400 nm laser pulse before the
266 nm pulse. As can be seen in Fig. 8 many features are observed in the energy correla-
tion plot, which are due to various multi-photon processes. For a detailed discussion of the
molecular processes in NO2 we refer to a recently published paper.37
Acknowledgments
This research has been financially supported by the council for Chemical Sciences of
the Netherlands Organization for Scientific research (NWO–CW VICI program). WGR
gratefully acknowledges the support of the European Union through a Marie Curie Outgoing
International Fellowship under contract OIF 021907. The authors would like to thank dr.
C.C. Hayden for many helpful discussions on coincidence imaging. WGR would like to
thank dr. D. W. Chandler and dr. C. C. Hayden for the opportunity to visit and work at
the Combustion Research Facility of Sandia National Laboratories Livermore. The authors
would like to thank MSc. D. Irimia for extensive experiments on the MCP pickup signal.
MHMJ would like to thank dr. A. Bergmann (Becker&Hickl) for the initial loan of the
SPC-130 board for compatibility testing in our apparatus, dr. A. S. Tremsin for discussions
on MCP electron cloud footprints, and mr. R. Cochran (Photonis) for discussions on MCP
responses.
16
1 D. W. Chandler and P. L. Houston, J. Chem. Phys. 87, 1445 (1987).
2 M. N. R. Ashfold, N. H. Nahler, A. J. Orr-Ewing, O. P. J. Vieuxmaire, R. L. Toomes, T. N.
Kitsopoulos, I. A. Garcia, D. A. Chestakov, S.-M. Wu, and D. H. Parker, Phys. Chem. Chem.
Phys 8, 26 (2006).
3 J.A. Davies, J.E. LeClaire, R.E. Continetti and C.C. Hayden, J. Chem. Phys. 111, 1 (1999).
4 R.E. Continetti, Ann. Rev. Phys. Chem. 52, 165 (2001).
5 A. M. Rijs, M. H. M. Janssen, E. T. H. Chrysostom, and C. C. Hayden, Phys. Rev. Lett. 92,
123002 (2004).
6 O. Gessner, A. M. D. Lee, J. P. Shaffer, S. V. Reisler, S. V. Levchenko, A. I. Krylov, J. G.
Underwood, H. Shi, A. L. L. East, D. M. Wardlaw, et al., Science 311, 219 (2006).
7 M. Takahashi, J.P. Cave and J.H.D. Eland, Rev. Sci. Instrum. 71, 1337 (2000).
8 M. Lebech, J.C. Houver and D. Dowek, Rev. Sci. Instrum. 73, 1866 (2002).
9 R. E. Continetti and C. C. Hayden, Coincidence imaging techniques, in Modern Trends in
Reaction Dynamics, Eds. X. Yang and K. Liu, World Scientific (Singapore), 2004, pp 475-528.
10 K. Ueda, J. Electron Spectrosc. Relat. Phenom. 141, 73 (2004).
11 G. A. Garcia, L. Nahon, C. J. Harding, E. A. Mikajlo, and I. Powis, Rev. Sci. Instrum. 76,
053302 (2005).
12 K. Hosaka, J. Adachi, A. V. Golovin, M. Takahashi, N. Watanabe, and A. Yagashita, Jap. J.
Applied Physics 45, 1841 (2006).
13 G. Prumper, H. Fukuzawa, T. Lischke, and K. Ueda, Rev. Sci. Instrum. 78, 083104 (2007).
14 D. Ceolin, G. Chaplier, M. Lemonnier, G. A. Garcia, C. Miron, L. Nahon, M. Simon, N. Leclercq,
and P. Morin, Rev. Sci. Instrum. 76, 043302 (2005).
15 O. H. W. Siegmund, A. Tremsin, J. V. Vallerga, R. Abiad, and J. S. Hull, Nucl. Instr. Meth.
Phys. Res. A 504, 177 (2003).
16 I. Ali, R. Dorner, O. Jagutzki, S. Nuttgens, V. Mergel, L. Spielberger, K. Khayyat, T. Vogt,
H. Brauning, K. Ullmann, et al., Nucl. Instr. Meth. Phys. Res. B 149, 490 (1999).
17 A. Tremsin, G. Lebedev, O. Siegmund, J. Vallerga, J. Hull, J. McPhate, C. Jozwiak, Y. Chen,
J. Guo, Z. Shen, et al., Nucl. Instr. Meth. Phys. Res. A 580, 853 (2007).
18 A. T. J. B. Eppink and D. H. Parker, Rev. Sci. Instrum. 68, 3477 (1997).
17
19 http://doc.cern.ch//archive/electronic/other/generic/public/cer-002723234.pdf.
20 A. V. Akindinov and et al., Nucl. Instr. Meth. Phys. Res. A 533, 178 (2004).
21 http://www.roentdek.com/.
22 K. Inami, N. Kishimoto, Y. Enari, M. Nagamine, and T. Ohshima, Nucl. Instr. Meth. Phys.
Res. A 560, 303 (2006).
23 A. Martindale, J. S. Lapington, and G. W. Fraser, Nucl. Instr. Meth. Phys. Res. A 573, 111
(2007).
24 http://www.becker-hickl.de/handbook.htm.
25 R.S. Gao, P.S. Gibner, J.H. Newman, K.A. Smith and R.F. Stebbings, Rev. Sci. Instr. 55, 1756
(1984).
26 A. Tremsin, O. H. W. Siegmund, J. V. Vallerga, J. S. Hull, and R. Abiad, IEEE Trans. Nucl.
Science 71, 1707 (2003).
27 In this paper we use, as is commonly done, a Gaussian distribution defined by f(x) ∝
exp(−x2/2σ2), from which the Full-Width-Half-Maximum can be obtained, FWHM = 2.355σ.
28 W. C. Wiley and I. H. Mclaren, Rev. Sci. Instrum 16, 1150 (1955).
29 W. G. Roeterdink and M. H. M. Janssen, Phys. Chem. Chem. Phys. 4, 601 (2002).
30 W. G. Roeterdink and M. H. M. Janssen, J. Chem. Phys. 117, 6500 (2002).
31 W. G. Roeterdink, A. M. Rijs, and M. H. M. Janssen, J. Am. Chem. Soc. 128, 576 (2006).
32 A. Tremsin, O. Siegmund, J. Hull, J. Vallerga, J. McPhate, J. Soderstrom, J.-W. Chiou, J. Guo,
and Z. Hussain, IEEE Trans. Nucl. Science 54, 706 (2007).
33 G. Lebedev, A. Tremsin, O. Siegmund, Y. Chen, Z. Shen, and Z. Hussain, Nucl. Instr. Meth.
Phys. Res. A 582, 168 (2007).
34 T. Credo, H. Frisch, H. Sanders, R. Schroll, and F. Tang, Proceedings of the IEEE (Rome),
Nuclear Science Symposium Conference Record 1 (2004).
35 J.L. Wiza, Nucl. Instrum. Methods 162, 587 (1979).
36 G.W. Fraser, Nucl. Instr. Meth. Phys. Res. A291, 595 (1990).
37 A. Vredenborg, W. G. Roeterdink, and M. H. M. Janssen, J. Chem. Phys. 128, issue 7 June
(2008).
18

FIGURE CAPTIONS
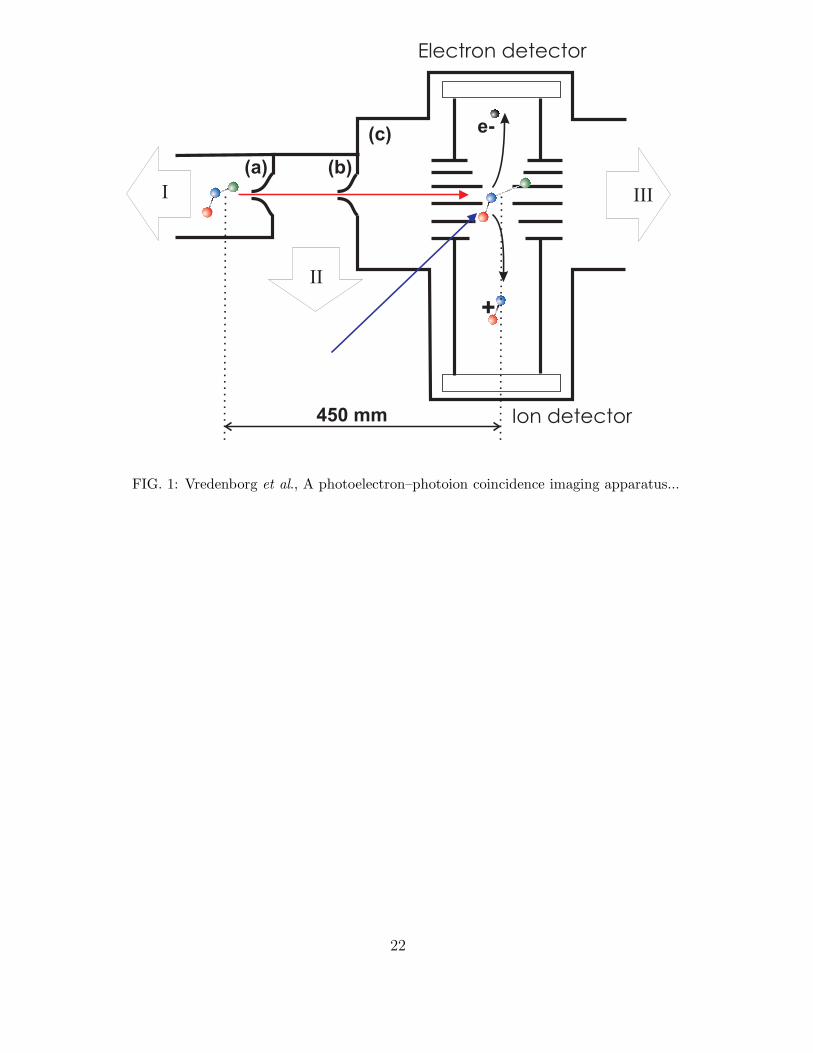
FIG.1 : (Color online) Schematic overview of the coincidence imaging machine for
femtosecond time-resolved experiments in a molecular beam. The apparatus consists of
three differentially pumped chambers, labeled (a) source chamber, (b) buffer chamber, (c)
detection chamber. The total distance between the exit of the molecular beam nozzle and
the laser interaction zone is 450 mm. Note that the dimensions in this overview are not
to scale. On the ports labeled I, II and III the magnetically levitated turbo pumps are
mounted with pumping speeds of 1250, 400 and 2100 l/s, respectively.
FIG.2 : Schematic overview of the charged particle lenses and the TOF-tube for ions and
electrons. The plates are 2 mm thick. All lenses are open and no grids are used anywhere
in the apparatus. All indicated distances are in mm. The subscript e labels the electron
lenses and detector, the subscript i labels the ion lenses and detector. The centre of the
ion detector is displaced by about 7-8 mm relative to the centre of the electron detector to
compensate for the forward center-of-mass velocity of the molecular beam when detecting
ions.
FIG.3 : Time-Of-Flight spectrum of Xenon isotopes recorded in coincidence with
electrons, i.e. with switching the electric fields on the lenses. The arrival time is measured
from the average of the time-sum from the delay line signals as obtained with the TDC.
The TOF peaks have a typical FWHM ∆t = 2 ns, the total TOF time is about t = 8.3 µs.
This means we have a mass resolution, ∆mFWHM/m = 1/4150 for masses near m = 130 amu.
FIG.4 : (Color online) The focus of the Xe+ parent ion spot as measured in coincidence
on the ion detector with our typical voltages used on the lenses for coincidence imaging. The
vertical axis gives the velocity map focus perpendicular to the direction of the molecular
beam. We obtain a smallest focussed spot of about σ = 115 µm (FWHM = 270 µm) from
the initially extended source region, defined by the crossing of the molecular beam with the
laser, which is estimated to be about 1 mm along the laser propagation direction. The spot
size of σ = 285 µm (FWHM = 670 µm) in the horizontal direction reflects the longitudinal
19
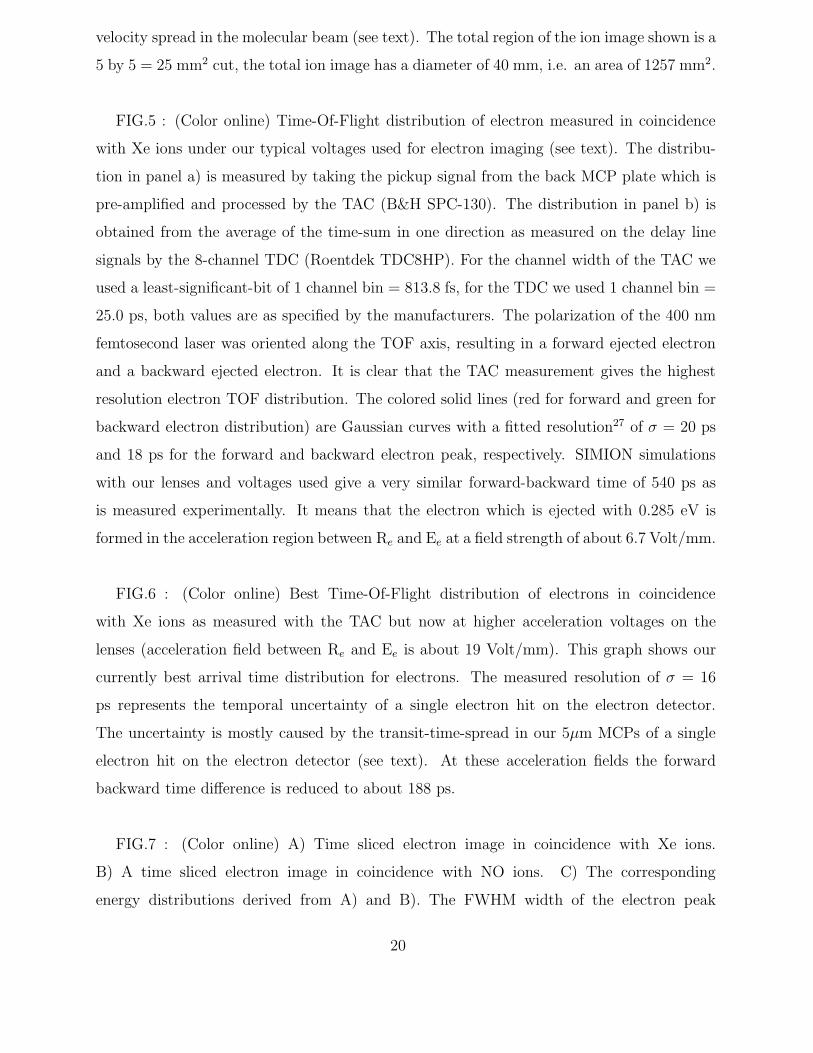
velocity spread in the molecular beam (see text). The total region of the ion image shown is a
5 by 5 = 25 mm2 cut, the total ion image has a diameter of 40 mm, i.e. an area of 1257 mm2.
FIG.5 : (Color online) Time-Of-Flight distribution of electron measured in coincidence
with Xe ions under our typical voltages used for electron imaging (see text). The distribu-
tion in panel a) is measured by taking the pickup signal from the back MCP plate which is
pre-amplified and processed by the TAC (B&H SPC-130). The distribution in panel b) is
obtained from the average of the time-sum in one direction as measured on the delay line
signals by the 8-channel TDC (Roentdek TDC8HP). For the channel width of the TAC we
used a least-significant-bit of 1 channel bin = 813.8 fs, for the TDC we used 1 channel bin =
25.0 ps, both values are as specified by the manufacturers. The polarization of the 400 nm
femtosecond laser was oriented along the TOF axis, resulting in a forward ejected electron
and a backward ejected electron. It is clear that the TAC measurement gives the highest
resolution electron TOF distribution. The colored solid lines (red for forward and green for
backward electron distribution) are Gaussian curves with a fitted resolution27 of σ = 20 ps
and 18 ps for the forward and backward electron peak, respectively. SIMION simulations
with our lenses and voltages used give a very similar forward-backward time of 540 ps as
is measured experimentally. It means that the electron which is ejected with 0.285 eV is
formed in the acceleration region between Re and Ee at a field strength of about 6.7 Volt/mm.
FIG.6 : (Color online) Best Time-Of-Flight distribution of electrons in coincidence
with Xe ions as measured with the TAC but now at higher acceleration voltages on the
lenses (acceleration field between Re and Ee is about 19 Volt/mm). This graph shows our
currently best arrival time distribution for electrons. The measured resolution of σ = 16
ps represents the temporal uncertainty of a single electron hit on the electron detector.
The uncertainty is mostly caused by the transit-time-spread in our 5µm MCPs of a single
electron hit on the electron detector (see text). At these acceleration fields the forward
backward time difference is reduced to about 188 ps.
FIG.7 : (Color online) A) Time sliced electron image in coincidence with Xe ions.
B) A time sliced electron image in coincidence with NO ions. C) The corresponding
energy distributions derived from A) and B). The FWHM width of the electron peak
20
near 1.87 eV, labeled (c), represents an energy resolution of ∆EFWHM/E = 65/1870 = 3.5%.
FIG.8 : (Color online) Energy correlation plot of electrons and coincident NO+ ions
produced in a two-color femtosecond pump-probe experiment on NO2. The time delay
between the 400 nm pump and the 266 nm probe is 200 fs. The red line represents the
maximum available energy for a process involving 3 photons of 400 nm and 1 photon of
266 nm, a (3+1’) process, leading to NO+(v=0) + O(3P); the green line represents the
maximum available energy for a process involving 2 photons of 400 nm and 2 photons of
266 nm, a (2+2’) process, leading to NO+(v=1) + O(3P). A detailed discussion of the
various multi-photon multi-channel dissociation and pathways leading to the formation of
the specific photoelectron-photoion regions is presented elsewhere.37
21
Ion detector
Electron detector
e-
+
(a) (b)
(c)
450 mm
I
II
III
FIG. 1: Vredenborg et al., A photoelectron–photoion coincidence imaging apparatus...
22
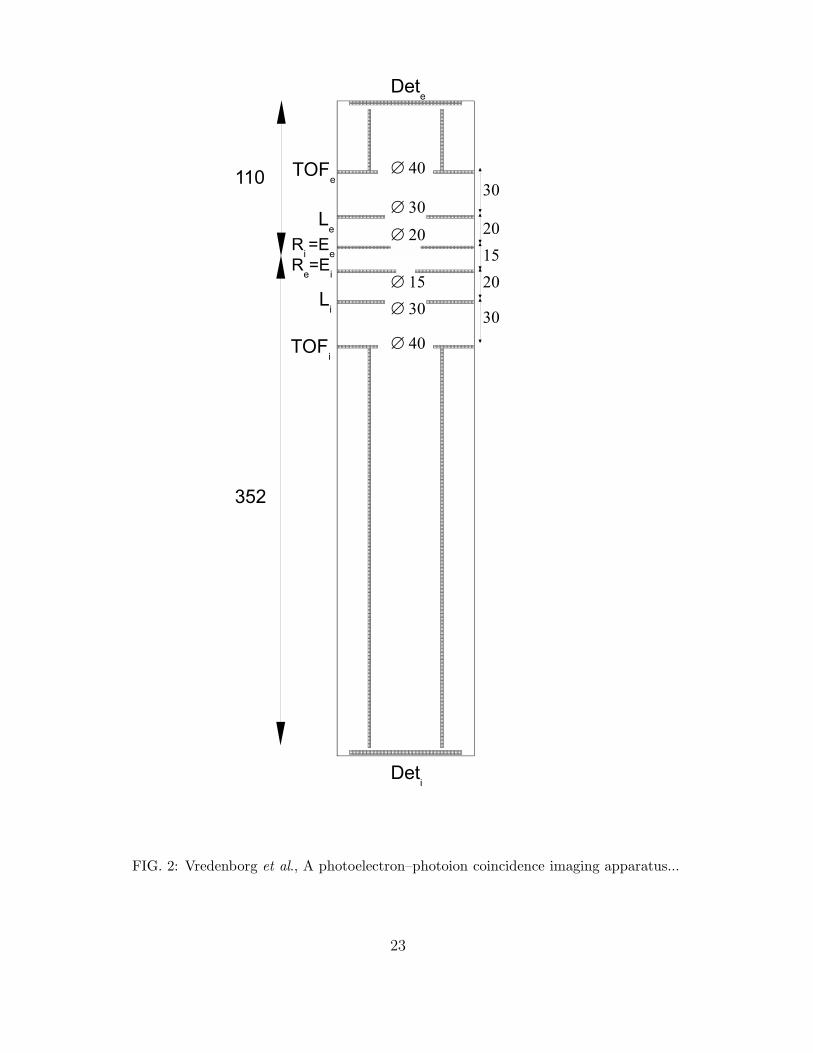
FIG. 2: Vredenborg et al., A photoelectron–photoion coincidence imaging apparatus...
23
8.20 8.25 8.30 8.35 8.40 8.45 8.50
Inte
nsity
(au)
Time ( s)
136Xe134Xe
132Xe131Xe
130Xe
129Xe
128Xe
2 ns
FIG. 3: Vredenborg et al., A photoelectron–photoion coincidence imaging apparatus...
24
0
1
2
3
4
5
0.00.51.0
Normalized Intensity
Length (mm)
0 1 2 3 4 50.0
0.5
1.0
Norm
aliz
ed
Inte
nsity
Length (mm)
FWHM = 670 mm
FWHM = 270 mm
FIG. 4: Vredenborg et al., A photoelectron–photoion coincidence imaging apparatus...
25
-500 -400 -300 -200 -100 0 100 200 300 400 5000
50
100
Ele
ctro
n co
unts
Forward electron Backward electron
-500 -400 -300 -200 -100 0 100 200 300 400 500
Relative Electron TOF (ps)
0
100
200
Ele
ctro
n co
unts
∆t = 540 ps
σ = 20 ps σ = 18 ps
a) TAC time
b) TDC time
σ = 51 ps σ = 53 ps
FIG. 5: Vredenborg et al., A photoelectron–photoion coincidence imaging apparatus...
26
-250 -200 -150 -100 -50 0 50 100 150 200 250 Relative Electron TOF (ps)
0
100
200
300
400
500
Ele
ctro
n co
unts
Forward electronBackward electron
σ = 16.1 ps σ = 15.5 ps
TAC time
FIG. 6: Vredenborg et al., A photoelectron–photoion coincidence imaging apparatus...
27

A B
C
FWHM = 41 meV
FWHM = 65 meV
0.0 0.5 1.0 1.5 2.0
(g)(f)
(e)(d)
(c)
(b)
Xenon
Norm
aliz
ed
Inte
nsity
Electron Kinetic Energy (eV)
NO
(a)
FIG. 7: Vredenborg et al., A photoelectron–photoion coincidence imaging apparatus...
28
0 1 2 30
1
2
3
3+1’
2+2’
Delay = 200 fs
NO (v=1)+
NO (v=0)+
Electron Kinetic Energy (eV)
Total Translational Energy (eV)
FIG. 8: Vredenborg et al., A photoelectron–photoion coincidence imaging apparatus...
29