› ILCPA.47.1.pdf · Thermo-Acoustical Study of Biologically Active 1,1 -Bis(3 ...free energy of...
14
Thermo-acoustical study of biologically active 1,1’-bis(3-methyl-4-carboxyethylphenoxy) cyclohexane at four different temperatures Bhavin B. Dhaduk, P. H. Parsania * Polymer Chemistry Division, Department of Chemistry, Saurashtra University, Rajkot - 360 005, Gujarat, India * E-mail address: [email protected] ABSTRACT Density (ρ), viscosity (η), ultrasonic speed (U), and thermo-acoustical parameters such as specific acoustical impedance (Z), adiabatic compressibility ( a ), internal pressure (π), free volume (V f ), inter molecular free path length (L f ), Van der Waals constant (b), viscous relaxation time (), classical absorption coefficient (α/f 2 ) cl , Rao’s molar sound function (R m ), solvation number (S n ), Gibbs free energy of activation (ΔG*), enthalpy of activation (ΔH*) and entropy of activation (ΔS*) of biologically active 1,1’-bis(3-methyl-4-carboxyethylphenoxy)cyclohexane (BMCPC) in 1,4-dioxane (DO), ethyl acetate (EA), tetrahydrofuran (THF) have been studied at four different temperatures: 298, 303, 308 and 313 K to understand the molecular interactions in the solutions. A good to excellent correlation between a given parameter and concentration is observed at all temperatures and solvent systems studied. Linear increase or decrease [except (α/f 2 ) cl ] of acoustical parameters with concentration and temperature indicated the existence of strong molecular interactions. ΔG* decreased linearly with increasing concentration and temperature in DO and EA systems and increased with temperature in THF system. ΔH* and ΔS* are found practically concentration independent in case of DO and EA system but both are found concentration dependent in THF system Keywords: Ultrasonic speed; acoustical parameters; thermodynamic parameters 1. INTRODUCTION ‘‘Ultrasonic sound’’ refers to sound waves of such a high frequency that they cannot be heard. These waves are also known as silent sound waves having frequencies beyond the range of human hearing i.e. above 20 KHz (20,000 cycles per second). These waves are also part of a characterization technique of a fluid. A fluid can be defined as a substance that deforms continuously under the action of a shear stress of any amount. Fluid properties can be characterized by variables such as pressure, velocity, density, and temperature. These properties will form a continuous function of position/time and therefore the fluid can be treated as a continuum. Ultrasonic sound is a viable technology because it is readily available and can be used for wide range of applications in different fields including consumer industries, pharmaceutical industries, medical field, process industries and chemical industries etc [1–4]. International Letters of Chemistry, Physics and Astronomy Online: 2015-02-24 ISSN: 2299-3843, Vol. 47, pp 1-14 doi:10.18052/www.scipress.com/ILCPA.47.1 2015 SciPress Ltd, Switzerland SciPress applies the CC-BY 4.0 license to works we publish: https://creativecommons.org/licenses/by/4.0/
Transcript of › ILCPA.47.1.pdf · Thermo-Acoustical Study of Biologically Active 1,1 -Bis(3 ...free energy of...

Thermo-acoustical study of biologically active 1,1’-bis(3-methyl-4-carboxyethylphenoxy)
cyclohexane at four different temperatures
Bhavin B. Dhaduk, P. H. Parsania*
Polymer Chemistry Division, Department of Chemistry, Saurashtra University, Rajkot - 360 005, Gujarat, India
*E-mail address: [email protected]
ABSTRACT
Density (ρ), viscosity (η), ultrasonic speed (U), and thermo-acoustical parameters such as
specific acoustical impedance (Z), adiabatic compressibility (a), internal pressure (π), free volume
(Vf), inter molecular free path length (Lf), Van der Waals constant (b), viscous relaxation time (), classical absorption coefficient (α/f
2)cl, Rao’s molar sound function (Rm), solvation number (Sn), Gibbs
free energy of activation (ΔG*), enthalpy of activation (ΔH*) and entropy of activation (ΔS*) of
biologically active 1,1’-bis(3-methyl-4-carboxyethylphenoxy)cyclohexane (BMCPC) in 1,4-dioxane
(DO), ethyl acetate (EA), tetrahydrofuran (THF) have been studied at four different temperatures: 298,
303, 308 and 313 K to understand the molecular interactions in the solutions. A good to excellent
correlation between a given parameter and concentration is observed at all temperatures and solvent
systems studied. Linear increase or decrease [except (α/f2)cl ] of acoustical parameters with
concentration and temperature indicated the existence of strong molecular interactions. ΔG* decreased
linearly with increasing concentration and temperature in DO and EA systems and increased with
temperature in THF system. ΔH* and ΔS* are found practically concentration independent in case of
DO and EA system but both are found concentration dependent in THF system
Keywords: Ultrasonic speed; acoustical parameters; thermodynamic parameters
1. INTRODUCTION
‘‘Ultrasonic sound’’ refers to sound waves of such a high frequency that they cannot be
heard. These waves are also known as silent sound waves having frequencies beyond the
range of human hearing i.e. above 20 KHz (20,000 cycles per second). These waves are also
part of a characterization technique of a fluid. A fluid can be defined as a substance that
deforms continuously under the action of a shear stress of any amount. Fluid properties can be
characterized by variables such as pressure, velocity, density, and temperature. These
properties will form a continuous function of position/time and therefore the fluid can be
treated as a continuum. Ultrasonic sound is a viable technology because it is readily available
and can be used for wide range of applications in different fields including consumer
industries, pharmaceutical industries, medical field, process industries and chemical industries
etc [1–4].
International Letters of Chemistry, Physics and Astronomy Online: 2015-02-24ISSN: 2299-3843, Vol. 47, pp 1-14doi:10.18052/www.scipress.com/ILCPA.47.12015 SciPress Ltd, Switzerland
SciPress applies the CC-BY 4.0 license to works we publish: https://creativecommons.org/licenses/by/4.0/

Recently ultrasonic sound radiations are used in synthetic organic chemistry, which
cause a decrease of reaction time, increase of yield, lower reaction temperature, and
avoidance of phase transfer catalysis [5–7]. Further ultrasonic sound velocity measurements
have been used to study the nature of molecular interactions in various liquid mixtures and
solution of organic and inorganic compounds [8-10], solutions of polymers [11,12], pharma
materials [13, 14] and ionic interactions in electrolytes solutions [15,16].
To the best of our knowledge no work has been reported on ultrasonic speed and related
acoustical parameters of biologically active 1,1’-bis(3-methyl-4-carboxyethylphenoxy)
cyclohexane (BMCPC) (Figure 1). In present work we have reported measurement of density,
viscosity, ultrasonic speed and related thermo-acoustical parameters of biologically active 1,
1’-bis(3-methyl-4-carboxyethylphenoxy) cyclohexane in 1, 4-dioxane (DO), ethyl acetate
(EA), tetrahydrofuran (THF) solutions (0.01 to 0.1 M) at four different temperatures: 298,
303, 308 and 313 K. The derived parameters are correlated with concentration in different
solvents and at different temperatures.
2. EXPERIMENTAL DETAILS
2.1. Materials
1,1’-Bis(3-methyl-4-carboxyethylphenoxy) cyclohexane (BMCPC) used in this study
was synthesized and crystallized according to our recent publication [17]. 1, 4-Dioxane (DO),
ethyl acetate (EA) and tetrahydrofuran (THF) were supplied by Spectrochem Pvt. Ltd.
Mumbai and were purified according to literature methods [18]. The density (ρ), viscosity (η)
and ultrasonic speed (U) of pure solvents were compared with the literature values [19-29]
and are shown in Table 1.
2.2. Measurements
0.1 M fresh stock solutions of 1,1’-bis(3-methyl-4-carboxyethylphenoxy)cyclohexane
(BMCPC) was prepared in DO, EA and THF at room temperature. From the stock solutions a
series of dilute solutions ranging from 0.1 to 0.01 M were prepared and thermally equilibrated
at specified temperatures prior to density, viscosity and ultrasonic speed measurements. The
and U measurements were carried out on a Density and Sound Velocity Meter (DSA-5000 M)
supplied by Anton Paar, Gmbh, Graz, Austria. The repeatability in density, ultrasonic speed,
and temperature measurements were ± 1·10−6
kg·m−3
, ± 1·10−1
m·s−1
, and ± 1·10−3
K,
respectively. The standard uncertainties for the density, ultrasonic speed, and temperatures
were better than 2.9·10−2
kg·m−3
, 1.3·10−1
m·s−1
, and 1·10−2
K, respectively. The calibration
of DSA-5000 was done over a temperature range from 25–40 °C. DSA-5000 was
thermostated within ±0.002 °C with Peltier heating device. Viscometric measurements were
carried out by using Ubbelohde type viscometer. The repeatability in the viscosity
measurements was ± 0.1 %. The viscosity measurements were repeated at least three times for
each sample. A constant temperature bath (Nova Instruments, Ahmedabad, Model NV8550E)
with an accuracy of ±0.1 K was used for maintaining constant temperature during viscosity
measurements. The flow times of pure solvents and solutions were measured with a digital
RACER HS 10W stop watch with an accuracy of ±0.01 s. The solutions were prepared by
mass using an analytical balance (AB 204-S; Mettler Toledo, Switzerland) with an uncertainty
of ± 1∙10-4
kg.
2 ILCPA Volume 47

2.3. Data processing
Various acoustical and thermodynamic parameters were determined according to
following theoretical equations:
Specific acoustical impedance (Z):
Z U (1)
Adiabatic compressibility (a):
2
1a
U
(2)
Internal pressure (π) [30]:
1
2 2/3
7/6
''
Kb RT
U M
(3)
Where 'b is the packing factor (2), K’ is a constant (4.28 x 10
9) and R is the gas constant
{8.314 / (JK-1
mol-1
)}.
Free volume (Vf) [30]:
3/2
f
MUV
K
(4)
Inter molecular free path length (Lf) [31]:
1/2( )f J aL K (5)
Where KJ is the Jacobson’s constant [K = (93.875+0.375T) x10-8
] and it is temperature
dependent.
Van der Waals constant (b) [32]:
2
1 1 12 3
M RT MUb
RTMU
(6)
Where M is the apparent molecular weight of the solution, R is the gas constant and T is
the absolute temperature.
Viscous relaxation time () : The resistance offered by viscous force in the flow of sound wave appears as a classical
absorption associated with it is the viscous relaxation time:
423 U
(7)
International Letters of Chemistry, Physics and Astronomy Vol. 47 3
Classical absorption coefficient (α/f2)cl [33]:
282 33f Ucl
(8)
Rao’s molar sound function [34]:
1/3
m
MR U
(9)
Solvation number (Sn):
The number of grams of solvent connected in the apparent solvation of 1 g of solute assuming
the solvent molecules participating in the solvation are effectively incompressible due to
strong localized electronic fields is expressed as:
1
1001
a
a
Xn
X
(10)
Where X is the number of grams of solute in 100 g of the solution.
The solvation number (Sn) can be expressed as:
1
2
1001
1a
a
MSn
XM
X
(11)
Where M1 and M2 are the molecular weights of solvent and solute, respectively.
Thermodynamic parameters:
Free energy of activation (ΔG*), enthalpy of activation (ΔH*) and entropy of activation (ΔS*)
can be determined by using viscous relaxation time data at different concentrations and
temperatures:
*1
GkT RTeh
(12)
1 * *ln ln
k S H
T h R RT
(13)
Where k is the Boltzmann constant and h is the Planck’s constant.
4 ILCPA Volume 47

3. RESULTS AND DISCUSSION
3.1. Density, viscosity and ultrasonic speed
Experimentally derived quantities such as ρ, η and U of pure solvents: DO, EA, THF
and BMCPC solutions at four different temperatures: 298, 303, 308 and 313 K are presented
in Table 2. The densities of BMCPC solutions increased linearly with concentration (C) and
decreased linearly with temperature because of rule of additivity indicating that the density of
BMCPC is greater than those of solvents used in the present study. Both η and U of BMCPC
solutions increased linearly with C and decreased with T. The ρ, η and U data were correlated
with C and T, and excellent correlation of these parameters with C and T is found (regression
coefficient R2
0.9914-0.999). The variation of η and U with C and T are considerably more
than that of ρ due to specific solvent and solute interactions. The nature of solvent and the
solute play an important role on molecular interactions such as association, dissociation, H-
bonding, etc. occurring in the solutions. Strong intermolecular H-bond formation is expected
in THF system as compared to EA and DO. Thus, THF has more solvating tendency than EA
and DO. Solvation causes change in apparent molecular mass and volume of the compound
and hence change in density, viscosity and ultrasonic speed.
Various acoustical and thermodynamic parameters such as specific acoustical
impedance (Z), adiabatic compressibility (a), internal pressure (π), free volume (Vf), inter
molecular free path length (Lf), Van der Waals constant (b), viscous relaxation time (),
classical absorption coefficient (α/f2)cl, Rao’s molar sound function (Rm), solvation number
(Sn), Gibbs free energy of activation (ΔG*), enthalpy of activation (ΔH*) and entropy of
activation (ΔS*) of BMCPC solutions were derived according to above mentioned theoretical
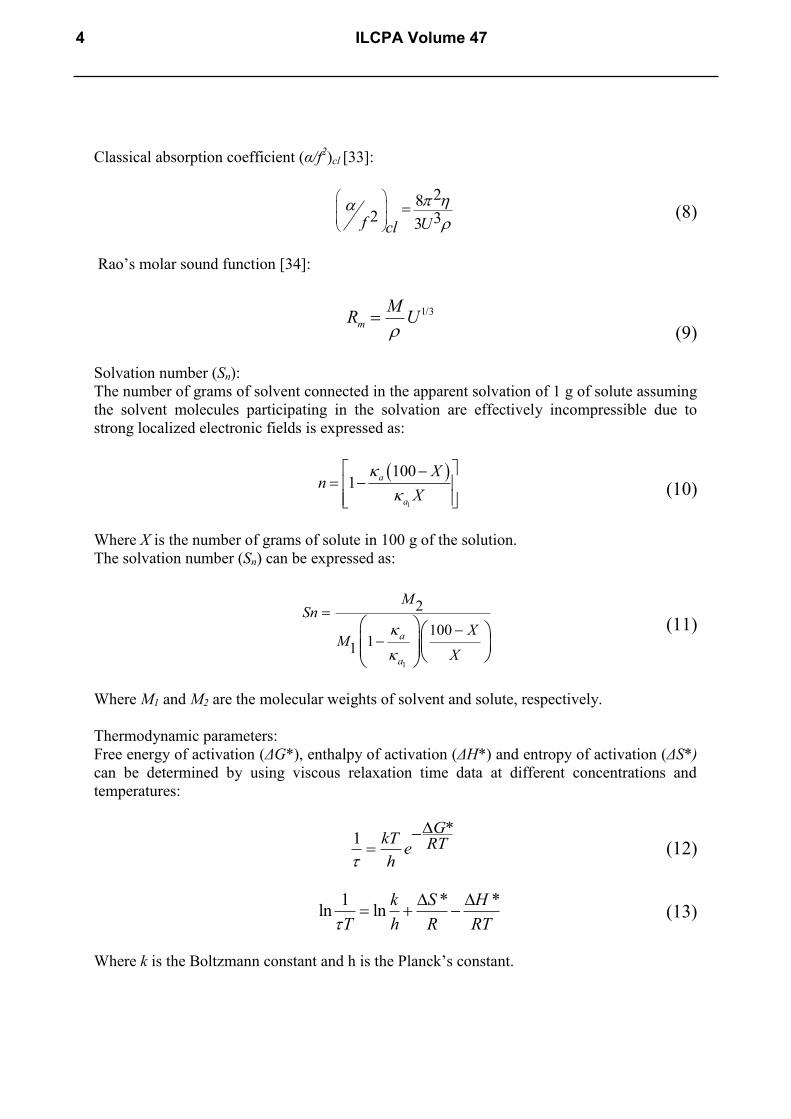
relations and were correlated with C and T. The least-squares equations along with regression
coefficients (R2) are reported in Tables 3-5 from which it is observed that excellent
correlation between a given parameter and concentration of BMCPC is found at different
temperatures.
Both U and Z increased with C and decreased with T due to strong molecular
interactions. a of solutions is decreased with C and increased with T in all solvents. This can
be attributed to the fact that the solvated molecules were fully compressed by the electrical
forces of the solute. The strong solvent-solute interactions lead to compressibility. Variation
of U in the solution depends upon intermolecular free path length. Due to molecular
association (solvent-solute interactions) compressibility of the solution is decreased with the
increasing solute concentration. Inter molecular free path length is inversely proportional to
ultrasonic speed. It was observed from the results that Lf decreased with C and increased with
T further supported the presence of strong molecular interactions. The presence of solvent -
solute interactions can also be confirmed from dispersion of ultrasonic speed, which is
characterized by relaxation process. According to Eyring rate theory is inversely
proportional to temperature and hence, increased in the temperature of system caused to
decrease in relaxation process. is decreased with C and T. Rm and b increased with C and T
indicated that no complex formation taken place in all the systems. The internal pressure (π)
decreased with C and increased with T. The results of π also confirmed our observations for
a and Lf. The internal pressure (π) decreased with C and increased with T. The results of π
also confirmed our observation for a and Lf, which are are temperature dependent. The
internal pressure depends on temperature, density, ultrasonic speed and specific heat at a
International Letters of Chemistry, Physics and Astronomy Vol. 47 5

constant pressure, while Lf is temperature dependent. A variation in the values of π is due to
different orientations of BMAPC in DO, EA and THF. The free volume (Vf) is inversely
proportional to the internal pressure and vice-versa. The ordered structural arrangement is due
to decreasing entropy of the system.
Solvation phenomenon results into modification of the structure of the solution. The
plots of Sn against C for BMCPC at different temperatures are presented in Figures 2-4 from
which it is observed that Sn increased nonlinearly with C and decreased with T indicating
competing solvent-solute and solute- solute interactions in the solutions. Thus, Sn values also
supported stronger molecular interactions. Minimum solvation is observed in case of DO
system. The lone pairs of electrons of THF, DO, ester group of EA interact with ether, ester
and methyl groups of BMCPC and structural modification takes place in the solutions. Due to
the structural modification both apparent molecular mass and molecular volume found to
change and consequently the density, viscosity and ultrasonic speed in the solutions also
changed.
When ultrasonic waves are incident on the solution, the molecules get perturbed. Since
the medium has some elasticity and hence perturbed molecules regain their equilibrium
positions. When a solute is added to a solvent, its molecules attract certain solvent molecules
toward them. The phenomenon is known as compression and also as limiting compressibility.
The aggregation of solvent molecules around solute molecules supports strong solvent-solute
interactions and considerable change in structural arrangement. Molecular interactions such as
solvent-solute interactions, quantum mechanical dispersive forces and dielectric force may
cause high degree of contraction or expansion. The time lag between the excitation and de-
excitation processes is observed as an acoustical relaxation. This relaxation process is
observed as either an increase in speed with frequency or a decrease in the (α/f 2)cl with
frequency.
Increasing temperature has two opposite effects namely structure formation
(intermolecular association) and structure destruction. The structure forming tendency is
primarily due to solvent-solute interactions, while destruction of structure formed previously
is due to thermal fluctuations. When thermal energy is greater than that of interaction energy,
it causes destruction of the structure formed previously [11, 12]. Dipole-dipole interactions of
the opposite type favours structure formation, while of the same type favour structure
breaking tendency. The decreasing cohesive forces lead to increasing free length and free
volume of the system.
Thermodynamic parameters such as ΔG*, ΔH* and ΔS* were determined according to
Eqns. 12 and 13 using viscous relaxation time data as a function of concentration and
temperature are shown in Table 6. In DO system, ΔG* decreased with increasing C (R2 0.993-
0.998) and T, while both ΔH* and ΔS* are found practically concentration independent. In EA
and THF systems, ΔG* decreased linearly with increasing C (R2
0.990-0.999) and increased
linearly with increasing T, In EA system it remained practically constant with increasing C. In
THF system both ΔH* and ΔS* are found concentration dependent. Derived thermodynamic
parameters indicated that condensation and evaporation processes are concentration and
temperature dependent. The negative values of ΔH* and ΔS* indicated that activated
complexes are highly in ordered state, i.e. condensation process is predominant over
evaporation process, which is further supported by positive values of Sn with C. Thus,
thermodynamic parameters supported presence of strong molecular interactions occurring in
the solutions of different polarity
6 ILCPA Volume 47

Table 1. Comparison of measured density (ρ), viscosity (η) and ultrasonic speed (U) data for DO,
EA and THF with literature values at 298, 303, 308 and 313 K.
T
(K)
ρ
(kgm-3
) Lit
η
(mPas) Lit
U
(ms-1
) Lit
expt Expt Expt
DO
298 1027.60 1027.99a 1.222 1.212
a 1344.87 1345.1
a
303 1021.82 1022.33a 1.094 1.115
a 1322.99 1323.1
a
308 1016.21 1016.36a 1.010 1.028
a 1301.14 1301.3
a
313 1010.46 1010.97a 0.927 0.952
a 1279.42 1279.7
a
EA
298 894.79 894.81
f
894.6g
0.427 0.421
f
0.424g
1140.53 1137.7h
303 888.65 887.14
f
888.5g
0.405 0.399
f
0.400g
1118.07 1115.3h
308 882.47 882.21
f
882.5g
0.384 0.381
f
0.385g
1095.64 1093.0h
313 876.23 878.92f 0.364 0.363
f 1073.41 1070.7
h
THF
298 882.33 882.50
i
882.01j
0.463 0.459
i
0.449j
1278.30 1278.24j
303 876.83 877.0k 0.4466 0.42
k 1254.25 1254.00
k
308 871.34 - 0.4305 - 1230.27 -
313 865.03 865.93i 0.4133 0.4007
i 1206.46 1202.00
k
861.2k 0.39
k
a Reference [19].
b Reference [20].
c Reference [21].
d Reference [22].
e Reference [23].
f Reference [24].
g Reference [25].
h Reference [26].
i Reference [27].
j Reference [28].
k Reference [29]
Table 2. The density (ρ), viscosity (η), and ultrasonic speed (U) data for BMCPC in DO, EA and
THF at 298 K, 303 K, 308 K and 313 K.
Conc.a
(molL-1
)
Density ρb /
(kg m–3
)
Viscocity ηc /
(mPa s)
Ultrasonic speed Ub /
(m s–1
)
298 K 303 K 308K 313K 298 K 303 K 308K 313K 298 K 303 K 308K 313K
DO + BMCPC
0.00 1027.6 1021.8 1016.2 1010.5 1.2224 1.0939 1.0100 0.9269 1344.9 1323.0 1301.1 1279.4
0.01 1028.1 1022.5 1016.9 1011.2 1.2234 1.0948 1.0109 0.9280 1345.3 1323.3 1301.4 1279.8
International Letters of Chemistry, Physics and Astronomy Vol. 47 7
0.02 1028.6 1023.2 1017.6 1011.9 1.2257 1.0961 1.0125 0.9293 1347.0 1324.2 1302.4 1280.7
0.04 1029.5 1024.5 1018.9 1013.2 1.2271 1.0984 1.0143 0.9313 1347.3 1325.4 1303.6 1282.2
0.06 1030.5 1025.9 1020.3 1014.7 1.2299 1.1008 1.0166
0.9335 1348.6 1326.8 1305.1 1283.5
0.08 1031.5 1027.2 1020.6 1016.0 1.2324 1.1033 1.0190 0.9358 1350.1 1328.2 1306.5 1285.0
0.10 1032.7 1028.6 1023.0 1017.4 1.2353 1.1064 1.0221 0.9385 1351.8 1330.0 1308.3 1286.8
EA+ BMCPC
0.00 894.8 888.7 882.5 876.2 0.4274 0.4045 0.3846 0.3644 1140.5 1118.1 1095.6 1073.4
0.01 895.5 889.5 883.2 877.0 0.4283 0.4060 0.3854 0.3651 1142.5 1119.1 1096.8 1074.5
0.02 896.7 890.5 884.4 878.2 0.4292 0.4071 0.3865 0.3661 1143.0 1120.5 1098.1 1076.0
0.04 898.8 892.7 886.6 880.4 0.4310 0.4091 0.3882 0.3676 1145.5 1123.3 1100.9 1078.7
0.06 901.7 895.0 888.9 882.7 0.4327 0.4111 0.3901 0.3693
1148.4 1125.9 1103.7 1081.7
0.08 903.2 897.1 891.0 884.9 0.4346 0.4133 0.3921 0.3713 1151.2 1128.7 1106.4 1084.3
0.10 905.5 899.4 893.4 887.3 0.4369 0.4157 0.3945 0.3736 1154.9 1131.4 1109.2 1087.3
THF+ BMCPC
0.00 882.3 876.8 871.3 865.7 0.4625 0.4474 0.4299
0.4129 1278.3 1254.3 1230.3 1206.5
0.01 884.4 879.0 873.4 867.9 0.4641 0.4489 0.4316 0.4149 1279.7 1255.7 1231.9 1208.2
0.02 885.9 880.4 874.9 869.3 0.4653 0.4500 0.4331 0.4164 1280.7 1256.9 1233.0 1209.2
0.04 888.8 883.4 877.9 672.4 0.4676 0.4520 0.4356 0.4192 1283.0 1259.0 1235.3 1211.8
0.06 891.5 886.1 880.6 875.1 0.4696 0.4543 0.4382 0.4217 1285.0 1261.3 1237.6 1214.1
0.08 894.4 889.0 883.5 878.0 0.4715 0.4568 0.4410 0.4245 1287.4 1263.6 1240.0 1216.7
0.10 897.6 892.2 886.7 881.2 0.4741 0.4598 0.4439 0.4273 1289.6 1266.1 1242.5 1219.1
Table 3. The least-square equations and regression coefficients for BMCPC solutions in DO at 298
K, 303 K, 308 K and 313K.
Parameter
Least square equations (regression coefficients, R2) [DO+ BMCPC]
298 K 303 K 308 K 313 K
ρ
(kgm-3
)a
66.04 C + 1027
(0.999)
67.08 C + 1021
(0.999)
68.08 C + 1016
(0.999)
69.15 C + 1010
(0.999)
η
(mPas)b
0.1255 C + 1.2224
(0.991)
0.1245 C + 1.0936
(0.997)
0.118 C + 1.0098
(0.995)
0.1142 C + 0.9268
(0.998)
U
(ms-1
)a
95.35 C + 1346
(0.999)
98.51 C + 1324
(0.999)
100.8 C + 1302
(0.999)
102.9 C + 1280
(0.999)
Z × 10-6
(kgm-2s
-1)
c
0.1359 C + 1.382
(0.993)
0.1612 C + 1.3516
(0.999)
0.1622 C + 1.3219
(0.999)
0.1636 C + 1.2926
(0.999)
a × 1010 -0.7859 C + 5.3803 -0.9512 C + 5.5934 -1.0219 C + 5.815 -1.0975 + 6.0473
8 ILCPA Volume 47

( Pa
-1)
d (0.9888) (0.998) (0.998) (0.9991)
Lf × 1011
(m)e
-0.356 C + 4.8566
(0.9888)
-0.4228 C + 4.9518
(0.998)
-0.4456 C + 5.049
(0.998)
-0.4694 C + 5.4188
(0.9991)
Rm × 104
(m10/3
s-1/3mol
-1)
f
15.733 C + 9.4653
(1)
15.63 C + 9.4659
(1)
15.711 C + 9.466
(1)
15.789 C + 9.4663
(1)
b × 105
(m3)
g
13.662 C + 8.0779
(1)
13.624 C + 8.1137
(1)
13.757 C + 8.1487
(1)
13.885 C + 8.1845
(1)
π × 10-8
(Pa)h
-8.7163 C + 5.3333
(0.998)
-8.3847 C + 5.1525
(0.9977)
-8.2632 C + 5.0561
(0.998)
-8.1071 C + 4.9453
(0.998)
Vf × 107
(m3)
i
2.7565 C + 1.077
(1)
3.1736 C + 1.2415
(1)
3.5069 C + 1.3646
(1)
3.9003 C + 1.5134
(1)
× 1013
(s)j
-0.3941 C + 8.7696
(0.981)
-0.4746 C + 8.1561
(0.995)
-0.4771 C + 7.8267
(0.996)
-0.4524 C + 7.4734
(0.996)
(α/f2)cl × 10
15
(s2m
-1)
k
-1.2073 C + 12.858
(0.979)
-1.3462 C + 12.159
(0.995)
-1.3741 C + 11.869
(0.997)
-1.3521 C + 11.52
(0.997)
Snl
-1E+09 C5 + 3E+08
C4 - 3E+07 C
3 +
1E+06 C2 - 24933
C + 156
(1)
-2E+06 C4 +
314584 C3 – 12274
C2 + 381.98 C +
16.852
(0.996)
-1E+06 C4 +
182013 C3 - 2445
C2 + 86.372 C +
19.064
(0.997)
-852961 C4 +
148780 C3 – 6417.6
C2 + 439.54 C +
12.438
(0.991)
Table 4. The least-square equations and regression coefficients for BMCPC solutions in EA at 298
K, 303 K, 308 K and 313K.
Parameter
Least square equations (regression coefficients, R2) [EA+ BMCPC]
298 K 303 K 308 K 313 K
ρ
(kgm-3
)a
66.04 C + 1027 (0.999)
67.08 C + 1021 (0.999)
68.08 C + 1016 (0.999)
69.15 C + 1010 (0.999)
η
(mPas)b
0.0934 C + 0.4573 (0.998)
0.1061 C + 0.4049 (0.999)
0.0976 C + 0.3845 (0.997)
0.0904 C + 0.3642 (0.994)
U
(ms-1
)a
95.35 C + 1346 (0.999)
98.51 C + 1324 (0.999)
100.8 C + 1302 (0.999)
102.9 C + 1280 (0.999)
Z × 10-6
(kgm-2s
-1)
c
0.2519 C + 1.0199 (0.998)
0.2433 C + 0.9932 (0.999)
0.2432 C + 0.9665 (0.999)
0.2434 C + 0.9401 (0.999)
a × 1010
( Pa
-1)
d
-3.1041 C + 8.5982 (0.998)
-3.2046 C + 9.0059 (0.999)
-3.4573 C + 9.4441 (0.999)
-3.7434 + 9.9096 (0.999)
Lf × 1011
(m)e
-1.1184 C + 6.1396 (0.998)
-1.1279 C + 6.2834 (0.999)
-1.1886 C + 6.4345 (0.999)
-1.2567 C + 6.5912 (0.999)
Rm × 104
(m10/3
s-1/3mol
-1)
f
19.004 C + 10.291 (1)
19.107 C + 10.294 (1)
19.237 C + 10.297 (1)
19.374 C + 10.3 (1)
b × 105
(m3)
g
17.116 C + 9.2035 (0.999)
17.319 C + 9.2531 (0.999)
17.526 C + 9.3039 (0.999)
17.74 C + 9.3554 (0.999)
π × 10-8
(Pa)h
-5.5416 C + 3.1196 (0.997)
-5.485 C + 3.1041 (0.997)
-5.5077 C + 3.0912 (0.997)
-5.5214 C + 3.0742 (0.996)
Vf × 107
(m3)
i
11.742 C + 4.0628 (1)
11.997 C + 4.2822 (1)
12.776 C + 4.4898 (1)
13.633 C + 4.7221 (0.9999)
× 1013
(s)j
-0.7367 C + 4.8994 (0.994)
-0.5012 C + 4.8627 (0.994)
-0.5876 C + 4.8417 (0.992)
-0.6679 C + 4.8125 (0.986)
(α/f2)cl × 10
15
(s2m
-1)
k
-2.2999 C + 8.4732 (0.996)
-1.898 C + 8.5774 (0.9982)
-2.1218 C + 8.715 (0.998)
-2.3479 C + 8.8421 (0.995)
Snl
-3E+06 C4 +
521833C3 - 33353
C2 + 969.86 C + 2.7983 C (0.991)
-2E+06 C4 +
472708 C3 – 32260
C2 + 995.37 C +
2.114 (0.99)
-3E+06 C4 +
543776 C3 - 37010
C2 + 1107.9 C +
1.1364 (0.9896)
-4E+06 C4 +
737107 C3 – 47909
C2 + 1308.4 C +
1.1364 (1)
International Letters of Chemistry, Physics and Astronomy Vol. 47 9

Table 5. The least-square equations and regression coefficients for BMCPC solutions in THF at
298 K, 303 K, 308 K and 313K.
Parameter Least square equations (regression coefficients, R
2) [THF+ BMCPC]
298 K 303 K 308 K 313 K
ρ
(kgm-3
)a
66.04 C + 1027
(0.999)
67.08 C + 1021
(0.999)
68.08 C + 1016
(0.999)
69.15 C + 1010
(0.999)
η
(mPas)b
0.1118 C + 0.4629
(0.997)
0.1196 C + 0.4474
(0.996)
0.1366 C + 0.4301
(0.999)
0.1399 C + 0.4134
(0.998)
U
(ms-1
)a
95.35 C + 1346
(0.999)
98.51 C + 1324
(0.999)
100.8 C + 1302
(0.999)
102.9 C + 1280
(0.999)
Z × 10-6
(kgm-2s
-1)
c
0.2887 C + 1.1285
(0.999)
0.2098 C + 1.1004
(0.999)
0.29 C + 1.0726
(0.999)
0.2909 C + 1.0452
(0.999)
a × 1010
( Pa
-1)
d
-2.3132 + 6.9305
(0.999)
-2.5061 C + 7.2437
(0.999)
-2.7061 C + 7.5758
(0.999)
-2.9339 C + 7.9276
(0.998)
Lf × 1011
(m)e
-0.9275 C + 5.5121
(0.999)
-0.9832 C + 5.6352
(0.999)
-1.0383 C + 5.763
(0.999)
-1.1008 C + 5.8953
(0.998)
Rm × 104
(m10/3
s-1/3mol
-1)
f
20.674 C + 8.8715
(1)
20.802 C + 8.8709
(1)
20.93 C + 8.8702
(1)
21.062 C + 8.8695
(1)
b × 105
(m3)
g
18.119 C + 7.6424
(1)
18.315 C + 7.6793
(1)
18.516 C + 7.7167
(1)
18.722 C + 7.7547
(1)
π × 10-8
(Pa)h
-8.2901 C + 3.8295
(0.996)
-8.3421 C + 3.8487
(0.995)
-8.3301 C + 3.8564
(0.995)
-8.3611 C + 3.8628
(0.995)
Vf × 107
(m3)
i
11.628 C + 3.1714
(1)
11.831C + 3.2438
(1)
11.986 C + 3.3443
(1)
12.344 C + 3.4475
(0.9999)
× 1013
(s)j
-0.4284 C + 4.2777
(0.994)
-0.3793 C + 4.3221
(0.973)
-0.2205 C + 4.3454
(0.983)
-0.1911 C + 4.37
(0.975)
(α/f2)cl × 10
15
(s2m
-1)
k
-1.2245 C + 6.5979
(0.998)
-1.2129 C + 6.7941
(0.993)
-1.0201 C + 6.9635
(0.996)
-1.0359 C + 7.141
(0.998)
Snl
-4E+06 C4 + 858859
C3 - 65747 C
2 +
2261.1 C – 8.9486
(0.9585)
-5E+06 C4 + 1E+06
C3 – 79845 C
2 +
2581.3 C + 11.595
(0.9815)
-5E+06 C4 + 1E+06
C3 – 88776 C
2 +
2827.6 C – 13.692
(0.981)
-5E+06 C4 + 1E+06
C3 – 80784 C
2 +
2645 C – 12.453
(0.955)
Table 7. Thermodynamic parameters (ΔG*, ΔH* and ΔS*) derived using data for BMAPC in DO,
EA and THF solutions.
System ΔG* / (J mol
-1)
a ΔH* /
(kJ mol-1
)
ΔS* /
(J K-1
mol-1
) Conc. 298 K 303 K 308 K 313 K
DO+
BMCPC
0.01 4199.0 4196.4 4133.8 4119.5 5.56 4.63
0.02 4196.4 4193.9 4132.3 4117.8 5.54 4.57
0.04 4195.6 4191.7 4128.8 4114.2 5.60 4.76
0.06 4193.4 4188.4 4125.3 4111.5 5.60 4.80
0.08 4191.1 4185.4 4122.4 4107.7 5.63 4.89
0.1 4187.9 4182.2 4119.3 4104.9 5.62 4.87
EA+
BMCPC
0.01 2753.5 2870.3 2900.7 2972.8 -1.65 -14.75
0.02 2749.5 2868.0 2898.4 2969.4 -1.66 -14.80
0.04 2742.9 2862.0 2890.5 2959.8 -1.61 -14.59
0.06 2734.2 2855.6 2883.7 2950.7 -1.60 -14.55
0.08 2726.9 2850.8 2877.4 2946.0 -1.65 -14.68
0.1 2718.0 2846.2 2873.7 2941.0 -1.73 -14.94
10 ILCPA Volume 47

Fig. 1. Structure of 1,1’-Bis(3-methyl-4-carboxyethylphenoxy)cyclohexane (BMCPC).
Fig. 2. The plots of solvation number (Sn) against concentration (C) for BMCPC in DO at 298K
(■), 303 K (▲) and 308 K (×), 313 K (◊).
THF+
BMCPC
0.01 2416.9 2568.5 2624.2 2722.5 -3.56 -20.07
0.02 2415.7 2565.5 2624.4 2723.2 -3.65 -20.37
0.04 2410.8 2559.7 2620.7 2720.4 -3.76 -20.69
0.06 2405.9 2555.3 2618.3 2717.6 -3.81 -20.86
0.08 2398.9 2552.0 2616.6 2715.3 -3.91 -21.17
0.1 2395.5 2549.7 2613.3 2712.4 -3.92 -21.19
International Letters of Chemistry, Physics and Astronomy Vol. 47 11

Fig. 3. The plots of solvation number (Sn) against concentration (C) for BMCPC in EA at 298K
(■), 303 K (▲) and 308 K (×), 313 K (◊).
Fig. 4. The plots of solvation number (Sn) against concentration (C) for BMCPC in THF at 298K
(■), 303 K (▲) and 308 K (×), 313 K (◊).
12 ILCPA Volume 47

4. CONCLUSIONS
Excellent correlation between studied acoustical and thermodynamic parameters with
concentration and temperature was observed. Derived acoustical and thermodynamic
parameters confirmed existence of strong molecular interactions in the solutions. ΔG* is
decreased with increasing concentration of BMCPC in all the system studied. ΔH* and ΔS*
are found concentration independent in DO and EA but they are concentration dependent in
THF system.
Acknowledgements
The authors are thankful to UGC-SAP, New Delhi and DST-FIST, New Delhi for the instrumentation grants.
Bhavin is thankful to UGC-New Delhi for BSR Fellowship in Science.
References
[1] T. J. Mason, Sonochemistry: The uses of ultrasound in chemistry. Royal Soc. of Chem.,
(1990).
[2] T. N. Pashovkin, D. G. Sadikova, M. S. Pashovkin, G. V. Shilnikov, Bull. Exp. Bio
Med. 144 (2007) 118-122.
[3] B. A. Scheven, R. M. Shelton, P. R. Cooper, A. D. Walmsley, A. J. Smith, Med.
Hypotheses. 73 (2009) 591-593.
[4] A. Carovac, F. Smajlovic, D. Junuzovic, Acta. Inform. Med. 19 (2011), 168-171.
[5] Price,G. J., Current Trends in Sonochemistry, Royal Society of Chemistry, Cambridge,
1992
[6] M. Mexiarova, M. Kiripolsky, S. Toma, Ultra. Sonochem. 12 (2005) 401–403.
[7] C. E. Sherlock, T. S. Mari, T. F. Braake, Vet. Radio Ultrasound, 50 (2009) 13–20.
[8] S. J. Askar Ali, J. Chem. Pharm. Res. 4 (2012) 617-632.
[9] S. Baluja, F. Karia, J. Chem. Bio. Phys. Sci. Sec. A. 2 (2012) 101-107.
[10] S. Nishikawa, J. Phys. Chem. B. 117 (2013) 896-900.
[11] B. D. Bhuva, P.H. Parsania, J. Sol. Chem. 40 (2011) 719-726.
[12] U. G. Pathak, J. V. Patel, P. H. Parsania, J. Sol. Chem. 41 (2012) 755-765.
[13] M. Levina, M. H. Rubinstein, J. Pharm. Sci. 89 (2000) 705–723.
[14] M. Enriquez-Sarano, V. T. Nkomo, H. Michelena, Card. Surg. Adult. 3 (2008) 315-348.
[15] K. Jerie, A. Baranowski, J. Przybylski, J. Gliński, Phys. Lett. A. 323(2004) 148-153.
[16] B. R. Shinde, K. M. Jadhav, J. Eng. Res. Stud. 1 (2010) 128-137.
[17] B. B. Dhaduk, C. B. Patel, P.H. Parsania, Lett. Drug. Des.Discov. 12 (2015), 152-157.
International Letters of Chemistry, Physics and Astronomy Vol. 47 13
[18] A. I. Vogel, A. R. Tatchell, B. S. Furnis, A. J. Hannaford, P. W.G. Smith, Vogel’s
Textbook of Practical Organic Chemistry, 5th edn., Addison Wesley Longman, London
395 (1998).
[19] M. Habibullah, I. M. Rahman, M. A. Uddin, M. Anowar, M. Alam, K. Iwakabe, H.
Hasegawa, J. Chem. Eng. Data 58 (2013) 2887-2897.
[20] R. A. Clará, A. C. Gomez Marigliano, D. Morales, H. N. Sólimo, J. Chem. Eng. Data
55 (2010) 5862-5867.
[21] M. N. Sovilj, J. Chem. Eng. Data 40 (1995) 1058-1061.
[22] U. B. Kadam, A. P. Hiray, A. B. Sawant, M. Hasan, J. Chem. Eng. Data 51 (2006) 60-
63.
[23] G. Savaroǧlu, E. Aral, J. Mol. Liq. 105 (2003) 79-92.
[24] H. Djojoputro, S. Ismadji, J. Chem. Eng. Data 50 (2005) 727-731.
[25] P. S. Nikam, T. R. Mahale, M. Hasan, J. Chem. Eng. Data 41 (1996) 1055-1058.
[26] J. Resa, C. Gonzalez, J. Goenaga, M. Iglesias, Phys. Chem. Liq. 43 (2005) 65-89.
[27] A. Mariano, A. Camacho, M. Postigo, A. Valen, H. Artigas, F. Royo, J. Urieta, J. Chem.
Eng. 17 (2000) 459-470.
[28] M. T. Zafarani-Moattar, R. Majdan-Cegincara, J. Chem. Eng. Data 52 (2007), 2359-
2364.
[29] M. Gupta, I. Vibhu, J. Shukla, Fluid Phase Equilibr. 244 (2006) 26-32.
[30] C. V. Suryanarayana, J. J. Kuppuswamy, J. Acoust. Soc. India 4 (1976) 75-82.
[31] B. Jacobson, W. A. Anderson, J. T. Arnold, Nature 173 (1954) 772-773.
[32] P, Vigoureux, Ultrasonic, Chapman and Hall, London, 112 (1952).
[33] C.V. Suryanarayana, J. Acoust. Soc. India 5 (1977) 11-26.
[34] S. Bagchi, S.K. Nema, R.P. Singh, Eur. Polym. J. 22 (1989) 851–860.
( Received 31 December 2014; accepted 12 January 2015 )
14 ILCPA Volume 47