A Half-Circular Distribution on a Circle Adzhar Rambli.pdf · of 23 patients were taken using the...
6
Sains Malaysiana 48(4)(2019): 887–892 http://dx.doi.org/10.17576/jsm-2019-4804-21 A Half-Circular Distribution on a Circle (Taburan Separa-Bulat dalam Bulatan) ADZHAR RAMBLI*, IBRAHIM MOHAMED, KUNIO SHIMIZU & NORLINA MOHD RAMLI ABSTRACT Up to now, circular distributions are defined in [0,2 π), except for axial distributions on a semicircle. However, some circular data lie within just half of this range and thus may be better fitted by a half-circular distribution, which we propose and develop in this paper using the inverse stereographic projection technique on a gamma distributed variable. The basic properties of the distribution are derived while its parameters are estimated using the maximum likelihood estimation method. We show the practical value of the distribution by applying it to an eye data set obtained from a glaucoma clinic at the University of Malaya Medical Centre, Malaysia. Keywords: Gamma distribution; inverse stereographic projection; maximum likelihood estimation; trigonometric moments; unimodality ABSTRAK Sehingga kini, taburan bulatan ditakrifkan dalam [0,2 π), kecuali untuk taburan paksi aksial pada semi-bulatan. Walau bagaimanapun, terdapat data bulatan berada hanya separuh daripada julat ini dan ia lebih sesuai dengan taburan separuh-bulatan, maka kami mencadang dan membangunkan dalam kertas ini menggunakan teknik unjuran stereografik songsang pada pemboleh ubah taburan gamma. Sifat asas taburan diperoleh manakala parameter dinilai menggunakan kaedah anggaran kebolehjadian maksimum. Nilai praktikal taburan ini dipraktiskan pada set data mata yang diperoleh daripada klinik glaukoma di Pusat Kesihatan, Universiti Malaya, Malaysia. Kata kunci: Anggaran kebolehjadian maksimum; momen trigonometrik; taburan Gamma; unimodaliti; unjuran stereografik songsang INTRODUCTION Circular data refer to observations measured in radians or degrees. Such data can be found in many different fields such as meteorology, biology and medical sciences (Gatto & Jammalamdaka 2003; Jammalamadaka & SenGupta 2001; Lund 1999). It is useful to visualize the data as being distributed on the circumference of a unit circle. The most commonly used circular distribution is the two-parameter von Mises distribution, which can be approximated by a normal distribution under large sampling theory. Other simple distributions have also been proposed by wrapping linear distributions to obtain, for example, the wrapped normal and wrapped Cauchy distributions. Good reviews on circular distributions with their properties can be found in Fisher (1993), Jammalamadaka and SenGupta (2001), Mardia (1972) and Mardia and Jupp (2000). In recent years, more elaborate circular distributions have been proposed and successfully applied to real data. Minh and Farnum (2003) proposed new distributions defined on the real line to induce distributions on the circle using inverse stereographic projection. They showed that a linear variable X induced by a uniformly distributed variable θ on [–π, π) has a Cauchy distribution in (–∞, ∞). Jones and Pewsey (2005) proposed a new family of symmetric unimodal distributions on the unit circle that contains the uniform, von Mises, cardioid and wrapped Cauchy distributions, among others, as special cases. The basic form of the densities of this family is very simple, although its normalization constant involves an associated Legendre function. Kato and Jones (2010) invented a family of four-parameter distributions on the unit circle via a Möbius transformation that contains the von Mises and wrapped Cauchy distributions as special cases. The distributions are useful for asymmetrically distributed data sets. Later, Abe et al. (2010) proposed a new family of circular distributions which extends both the Jones and Pewsey (2005) and unimodal modified Minh and Farnum (2003) distributions based on stereographic projection. The model can be extended to a family of rotationally symmetric distributions on the sphere. Its normalizing constant is in terms of Appell’s function. In 2012, Phani et al. proposed asymmetric circular model. It is also known as stereographic extreme-value distribution and is developed using inverse stereographic projection. In this paper, we are interested to develop a new distribution restricted in a certain range of a circle. One such distribution is the axial distribution which assumes angles θ and θ + 180° to be equivalent, see Alldredge et al. (1974) and Mardia and Jupp (2000). However, we
Transcript of A Half-Circular Distribution on a Circle Adzhar Rambli.pdf · of 23 patients were taken using the...
Sains Malaysiana 48(4)(2019): 887–892 http://dx.doi.org/10.17576/jsm-2019-4804-21
A Half-Circular Distribution on a Circle(Taburan Separa-Bulat dalam Bulatan)
ADZHAR RAMBLI*, IBRAHIM MOHAMED, KUNIO SHIMIZU & NORLINA MOHD RAMLI
ABSTRACT
Up to now, circular distributions are defined in [0,2 π), except for axial distributions on a semicircle. However, some circular data lie within just half of this range and thus may be better fitted by a half-circular distribution, which we propose and develop in this paper using the inverse stereographic projection technique on a gamma distributed variable. The basic properties of the distribution are derived while its parameters are estimated using the maximum likelihood estimation method. We show the practical value of the distribution by applying it to an eye data set obtained from a glaucoma clinic at the University of Malaya Medical Centre, Malaysia.
Keywords: Gamma distribution; inverse stereographic projection; maximum likelihood estimation; trigonometric moments; unimodality
ABSTRAK
Sehingga kini, taburan bulatan ditakrifkan dalam [0,2 π), kecuali untuk taburan paksi aksial pada semi-bulatan. Walau bagaimanapun, terdapat data bulatan berada hanya separuh daripada julat ini dan ia lebih sesuai dengan taburan separuh-bulatan, maka kami mencadang dan membangunkan dalam kertas ini menggunakan teknik unjuran stereografik songsang pada pemboleh ubah taburan gamma. Sifat asas taburan diperoleh manakala parameter dinilai menggunakan kaedah anggaran kebolehjadian maksimum. Nilai praktikal taburan ini dipraktiskan pada set data mata yang diperoleh daripada klinik glaukoma di Pusat Kesihatan, Universiti Malaya, Malaysia.
Kata kunci: Anggaran kebolehjadian maksimum; momen trigonometrik; taburan Gamma; unimodaliti; unjuran stereografik songsang
INTRODUCTION
Circular data refer to observations measured in radians or degrees. Such data can be found in many different fields such as meteorology, biology and medical sciences (Gatto & Jammalamdaka 2003; Jammalamadaka & SenGupta 2001; Lund 1999). It is useful to visualize the data as being distributed on the circumference of a unit circle. The most commonly used circular distribution is the two-parameter von Mises distribution, which can be approximated by a normal distribution under large sampling theory. Other simple distributions have also been proposed by wrapping linear distributions to obtain, for example, the wrapped normal and wrapped Cauchy distributions. Good reviews on circular distributions with their properties can be found in Fisher (1993), Jammalamadaka and SenGupta (2001), Mardia (1972) and Mardia and Jupp (2000). In recent years, more elaborate circular distributions have been proposed and successfully applied to real data. Minh and Farnum (2003) proposed new distributions defined on the real line to induce distributions on the circle using inverse stereographic projection. They showed that a linear variable X induced by a uniformly distributed variable θ on [–π, π) has a Cauchy distribution in (–∞, ∞). Jones and Pewsey (2005) proposed a new family of
symmetric unimodal distributions on the unit circle that contains the uniform, von Mises, cardioid and wrapped Cauchy distributions, among others, as special cases. The basic form of the densities of this family is very simple, although its normalization constant involves an associated Legendre function. Kato and Jones (2010) invented a family of four-parameter distributions on the unit circle via a Möbius transformation that contains the von Mises and wrapped Cauchy distributions as special cases. The distributions are useful for asymmetrically distributed data sets. Later, Abe et al. (2010) proposed a new family of circular distributions which extends both the Jones and Pewsey (2005) and unimodal modified Minh and Farnum (2003) distributions based on stereographic projection. The model can be extended to a family of rotationally symmetric distributions on the sphere. Its normalizing constant is in terms of Appell’s function. In 2012, Phani et al. proposed asymmetric circular model. It is also known as stereographic extreme-value distribution and is developed using inverse stereographic projection. In this paper, we are interested to develop a new distribution restricted in a certain range of a circle. One such distribution is the axial distribution which assumes angles θ and θ + 180° to be equivalent, see Alldredge et al. (1974) and Mardia and Jupp (2000). However, we

888
are interested in finding a distribution with observations that lie strictly on a half circle, say in the range [0, π) radians, using the inverse stereographic projection. It is important to have a half-circular distribution by itself since other models so far have the range (0, 2π]. On top of that, periodic property for circular data is not useful for half-circular data since 0° is not the same as 180°. This paper is arranged as follows. The probability density function of the new half-circular distribution is presented in the next section. We provide the distribution function, unimodality and trigonometric moments of the proposed model next. We then discuss the parameter estimation using the maximum likelihood method in the section that follows. The paper also includes a practical example based on an eye data set obtained from a glaucoma clinic at the University of Malaya Medical Centre, Malaysia in the last section.
THE NEW PROBABILITY DISTRIBUTION
Assume that a continuous variable X follows a gamma distribution, denoted by Γ(α, β), where α is the shape parameter and β the scale parameter. The probability density function of the variable X is given by
f (x) = xα–1 exp(–x/β), x > 0 (1)
for α > 0 and β > 0. The distribution is skewed, with skewness measure given by (2/ ). The Half-Circular Transformed Gamma distribution, denoted by CTG(α,β), is obtained by applying a transformation θ = 2 tan–1 x giving θ in the range (0, π). Let m(θ) = tan (θ/2). By using inverse stereographic projection, the probability density function of the CTG distribution is given by g(θ) = |m´(θ)| f (m(θ)). We have
(2)
and
(3)
Consequently, the probability density function of CTG(α,β) is given by
for 0 < θ < π. (4)
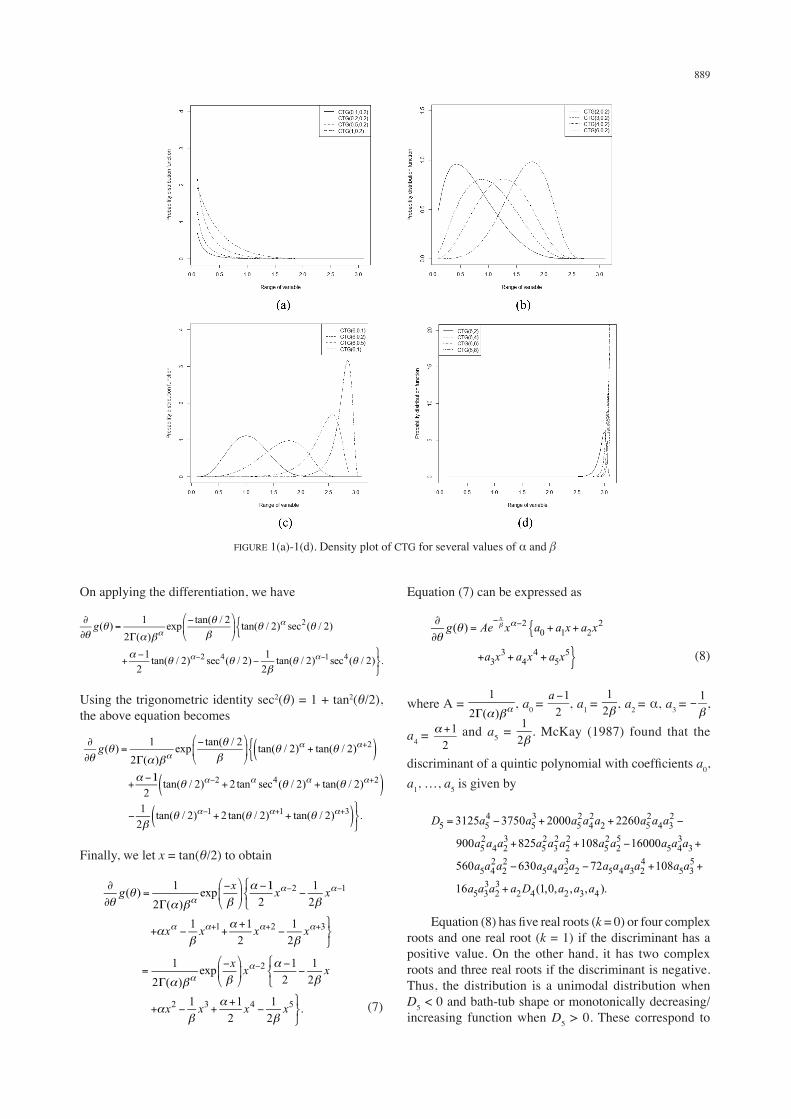
Figure 1 shows the density plots of the distribution. We can see that, for morderate α value and small β value, the
distributions are unimodal as shown in Figure 1(b). Figure 1(a) shows that the shapes are monotonically decreasing when α and β are small. From Figure 1(c), the distributions are skewed to the left as the value of β becomes larger. On the other hand, the distributions are U-shaped when both α and β values are large as shown in Figure 1(d). The parameters are classified as small in interval (0, 1], moderate in interval (1, 6] or large value in interval (6, ∞]. The shapes of CTG distribution for a given sample are known once the estimated values of the parameters are obtained.
PROPERTIES OF CTG DISTRIBUTION
DISTRIBUTION FUNCTION
In this section, we discuss the distribution function and conditional unimodality of CTG(α,β). For 0 ≤ Θ < π, the distribution function of CTG(α,β), denoted by G(θ), is given by
G(θ) = Pr(Θ ≤ θ) = Pr(2tan–1 X ≤ θ) = Pr(X ≤ tan(θ/2))
= exp(–x/β)dx
= (5)
where γ(α, x) is the incomplete gamma function defined by
γ(α, x) = (6)
UNIMODALITY
Next, we discuss the conditions for the unimodality of CTG(α, β). As in Kato and Jones (2010) and Wang and Shimizu (2012), the derivative of the probability density function which is represented by quartic polynomial is a unimodal distribution only if the discriminant is negative. Note that when the discriminant is negative, a quartic polynomial has two real roots and two complex roots. However, we will show here that the derivative of the CTG distribution is a quintic polynomial. Now, the derivative of (4) with respect to θ is given by
.
We substitute 1 + cos(θ) with 2 cos2(θ/2) to give
889
On applying the differentiation, we have
Using the trigonometric identity sec2(θ) = 1 + tan2(θ/2), the above equation becomes
Finally, we let x = tan(θ/2) to obtain
(7)
Equation (7) can be expressed as
(8)
where A = , a0 = , a1 = , a2 = α, a3 = ,
a4 = and a5 = . McKay (1987) found that the
discriminant of a quintic polynomial with coefficients a0, a1, …, a5 is given by
Equation (8) has five real roots (k = 0) or four complex roots and one real root (k = 1) if the discriminant has a positive value. On the other hand, it has two complex roots and three real roots if the discriminant is negative. Thus, the distribution is a unimodal distribution when D5 < 0 and bath-tub shape or monotonically decreasing/increasing function when D5 > 0. These correspond to
FIGURE 1(a)-1(d). Density plot of CTG for several values of α and β
890
cases with small and large values of α as noted in the new probability distribution section. Note that aj, j = 0, 1, …, 5 are in terms of α and β, so that the conditions for unimodality are defined in terms of these parameters.
THE TRIGONOMETRIC MOMENTS OF THE CTG DISTRIBUTION
The trigonometric moments of a distribution are given by {ϕm : m = 1,2,3,…}, where ϕm = αm + iβm, with αm = E(cos mΘ) and βm = E(sin mΘ) being the mth order cosine and sine moments of the random angle Θ, respectively. The real part of the mth trigonometric moment is given by
and the imaginary part by
Thus the mth trigonometric moment is given by
(9)
THE MAXIMUM LIKELIHOOD ESTIMATION (MLE) OF PARAMETERS IN THE CTG DISTRIBUTION
We will estimate the parameters of CTG(α, β) using the maximum likelihood estimation method. Suppose that θ1,θ2,…,θn are a random sample of size n from CTG(α, β). Transform θi(i = 1, 2, …, n) into xi = tan(θi /2). Then, xi are considered to be from Γ(α, β) and the maximum likelihood estimates for α and β are obtained by maximizing the likelihood function for Γ(α, β). The likelihood function for a random sample of size n for Γ(α, β) is given by
(10)
and so the log-likelihood function is
(11)
For Gamma distribution, we are not able to get the closed-form maximum likelihood estimators. Hence, we may use the direct optimization of the log-likelihood, particularly the Nelder-Mead method, (Venables & Ripley 2002). This can be done using the fitdistr function available in MASS R-package.
APPLICATION TO A REAL DATA SET
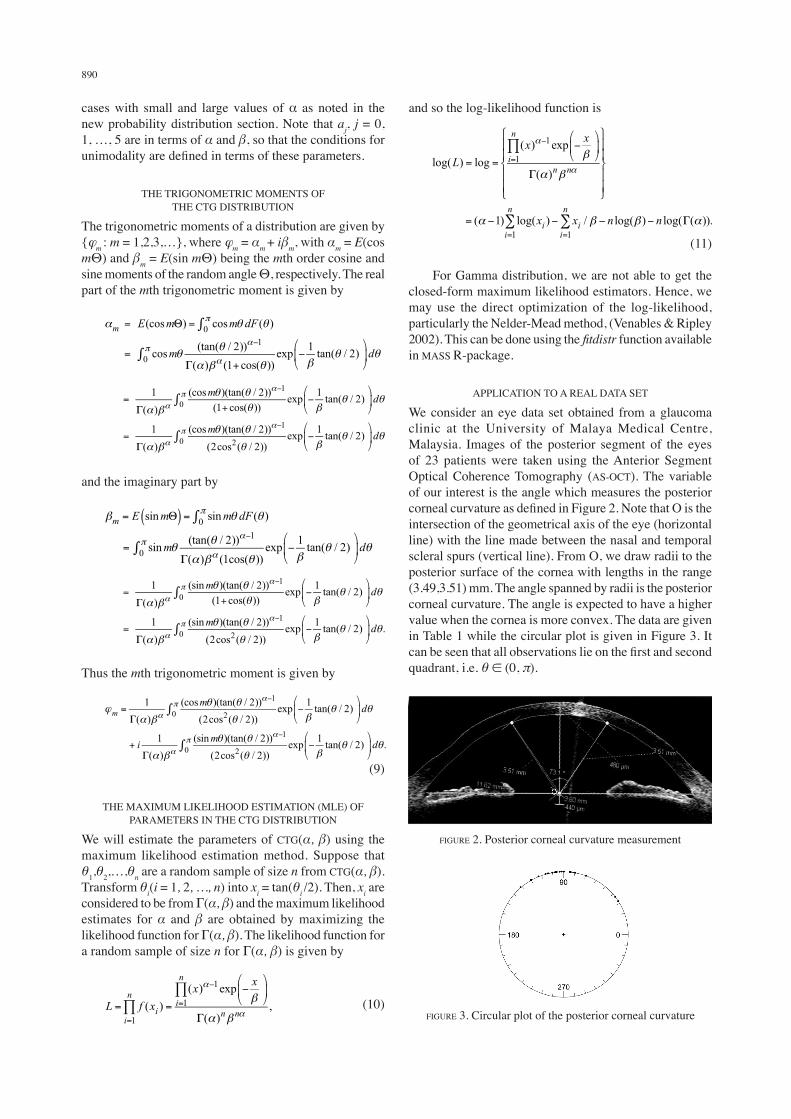
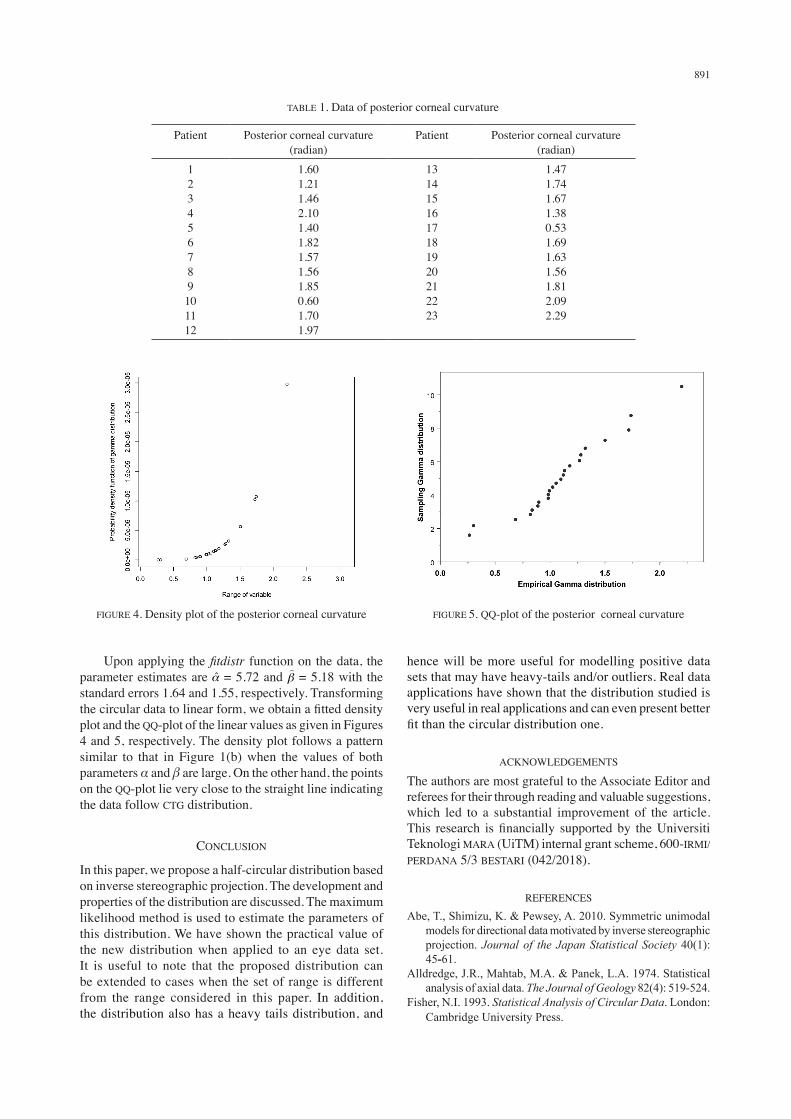
We consider an eye data set obtained from a glaucoma clinic at the University of Malaya Medical Centre, Malaysia. Images of the posterior segment of the eyes of 23 patients were taken using the Anterior Segment Optical Coherence Tomography (AS-OCT). The variable of our interest is the angle which measures the posterior corneal curvature as defined in Figure 2. Note that O is the intersection of the geometrical axis of the eye (horizontal line) with the line made between the nasal and temporal scleral spurs (vertical line). From O, we draw radii to the posterior surface of the cornea with lengths in the range (3.49,3.51) mm. The angle spanned by radii is the posterior corneal curvature. The angle is expected to have a higher value when the cornea is more convex. The data are given in Table 1 while the circular plot is given in Figure 3. It can be seen that all observations lie on the first and second quadrant, i.e. θ ∈ (0, π).
figure 2. Posterior corneal curvature measurement
figure 3. Circular plot of the posterior corneal curvature
891
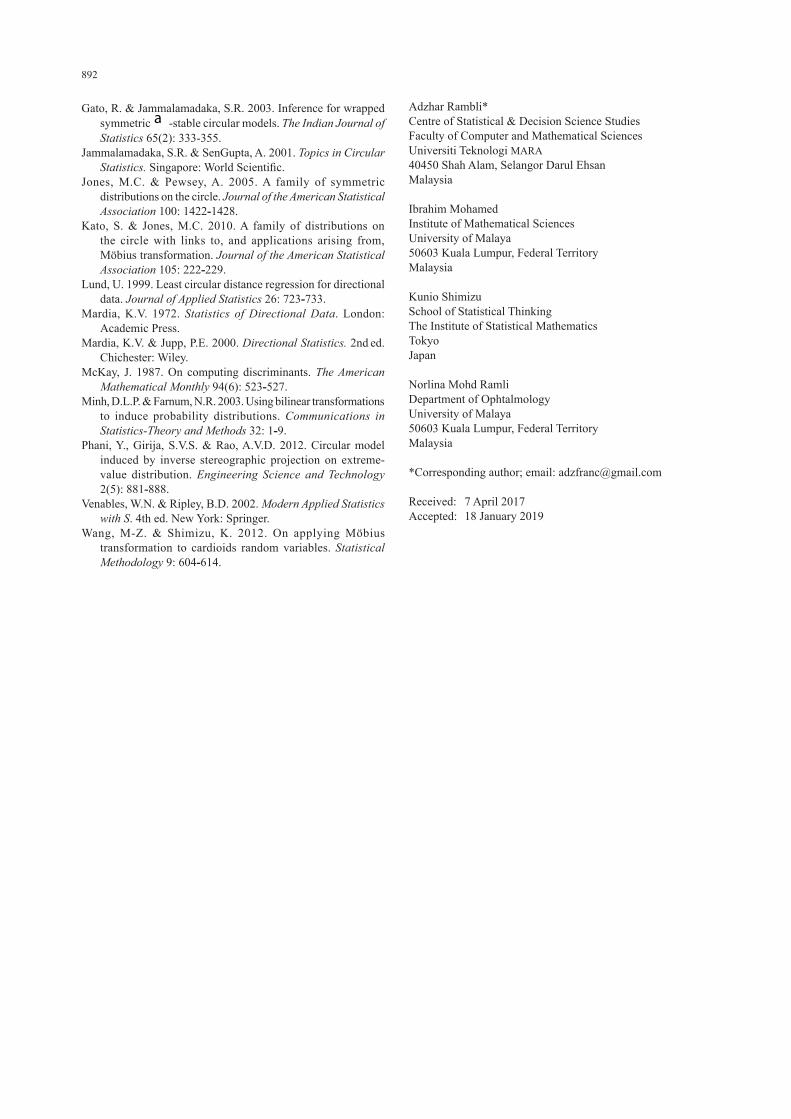
Upon applying the fitdistr function on the data, the parameter estimates are = 5.72 and = 5.18 with the standard errors 1.64 and 1.55, respectively. Transforming the circular data to linear form, we obtain a fitted density plot and the QQ-plot of the linear values as given in Figures 4 and 5, respectively. The density plot follows a pattern similar to that in Figure 1(b) when the values of both parameters α and β are large. On the other hand, the points on the QQ-plot lie very close to the straight line indicating the data follow CTG distribution.
CONCLUSION
In this paper, we propose a half-circular distribution based on inverse stereographic projection. The development and properties of the distribution are discussed. The maximum likelihood method is used to estimate the parameters of this distribution. We have shown the practical value of the new distribution when applied to an eye data set. It is useful to note that the proposed distribution can be extended to cases when the set of range is different from the range considered in this paper. In addition, the distribution also has a heavy tails distribution, and
hence will be more useful for modelling positive data sets that may have heavy-tails and/or outliers. Real data applications have shown that the distribution studied is very useful in real applications and can even present better fit than the circular distribution one.
ACKNOWLEDGEMENTS
The authors are most grateful to the Associate Editor and referees for their through reading and valuable suggestions, which led to a substantial improvement of the article. This research is financially supported by the Universiti Teknologi MARA (UiTM) internal grant scheme, 600-IRMI/PERDANA 5/3 BESTARI (042/2018).
REFERENCES
Abe, T., Shimizu, K. & Pewsey, A. 2010. Symmetric unimodal models for directional data motivated by inverse stereographic projection. Journal of the Japan Statistical Society 40(1): 45-61.
Alldredge, J.R., Mahtab, M.A. & Panek, L.A. 1974. Statistical analysis of axial data. The Journal of Geology 82(4): 519-524.
Fisher, N.I. 1993. Statistical Analysis of Circular Data. London: Cambridge University Press.
TABLE 1. Data of posterior corneal curvature
Patient Posterior corneal curvature (radian)
Patient Posterior corneal curvature (radian)
123456789101112
1.601.211.462.101.401.821.571.561.850.601.701.97
1314151617181920212223
1.471.741.671.380.531.691.631.561.812.092.29
FIGURE 4. Density plot of the posterior corneal curvature FIGURE 5. QQ-plot of the posterior corneal curvature
892
Gato, R. & Jammalamadaka, S.R. 2003. Inference for wrapped symmetric a -stable circular models. The Indian Journal of Statistics 65(2): 333-355.
Jammalamadaka, S.R. & SenGupta, A. 2001. Topics in Circular Statistics. Singapore: World Scientific.
Jones, M.C. & Pewsey, A. 2005. A family of symmetric distributions on the circle. Journal of the American Statistical Association 100: 1422-1428.
Kato, S. & Jones, M.C. 2010. A family of distributions on the circle with links to, and applications arising from, Möbius transformation. Journal of the American Statistical Association 105: 222-229.
Lund, U. 1999. Least circular distance regression for directional data. Journal of Applied Statistics 26: 723-733.
Mardia, K.V. 1972. Statistics of Directional Data. London: Academic Press.
Mardia, K.V. & Jupp, P.E. 2000. Directional Statistics. 2nd ed. Chichester: Wiley.
McKay, J. 1987. On computing discriminants. The American Mathematical Monthly 94(6): 523-527.
Minh, D.L.P. & Farnum, N.R. 2003. Using bilinear transformations to induce probability distributions. Communications in Statistics-Theory and Methods 32: 1-9.
Phani, Y., Girija, S.V.S. & Rao, A.V.D. 2012. Circular model induced by inverse stereographic projection on extreme-value distribution. Engineering Science and Technology 2(5): 881-888.
Venables, W.N. & Ripley, B.D. 2002. Modern Applied Statistics with S. 4th ed. New York: Springer.
Wang, M-Z. & Shimizu, K. 2012. On applying Möbius transformation to cardioids random variables. Statistical Methodology 9: 604-614.
Adzhar Rambli*Centre of Statistical & Decision Science Studies Faculty of Computer and Mathematical Sciences Universiti Teknologi MARA 40450 Shah Alam, Selangor Darul Ehsan Malaysia
Ibrahim MohamedInstitute of Mathematical SciencesUniversity of Malaya50603 Kuala Lumpur, Federal TerritoryMalaysia
Kunio ShimizuSchool of Statistical Thinking The Institute of Statistical Mathematics Tokyo Japan
Norlina Mohd RamliDepartment of Ophtalmology University of Malaya50603 Kuala Lumpur, Federal TerritoryMalaysia
*Corresponding author; email: [email protected]
Received: 7 April 2017Accepted: 18 January 2019