A dissertation by TAKESHI YAMAMOTO Submitted to
146
Charge symmetry breaking in ΛN interaction studied via the γ -ray spectroscopy of 4 Λ He A dissertation by TAKESHI YAMAMOTO Submitted to Department of Physics, Tohoku University in partial fulfillment of the requirements for the degree of Doctor of Science January, 2016
Transcript of A dissertation by TAKESHI YAMAMOTO Submitted to
Charge symmetry breaking in ΛN interaction
studied via the γ-ray spectroscopy of 4ΛHe
A dissertation
by
TAKESHI YAMAMOTO
Submitted to
Department of Physics, Tohoku University
in partial fulfillment of the requirements
for the degree of Doctor of Science
January, 2016

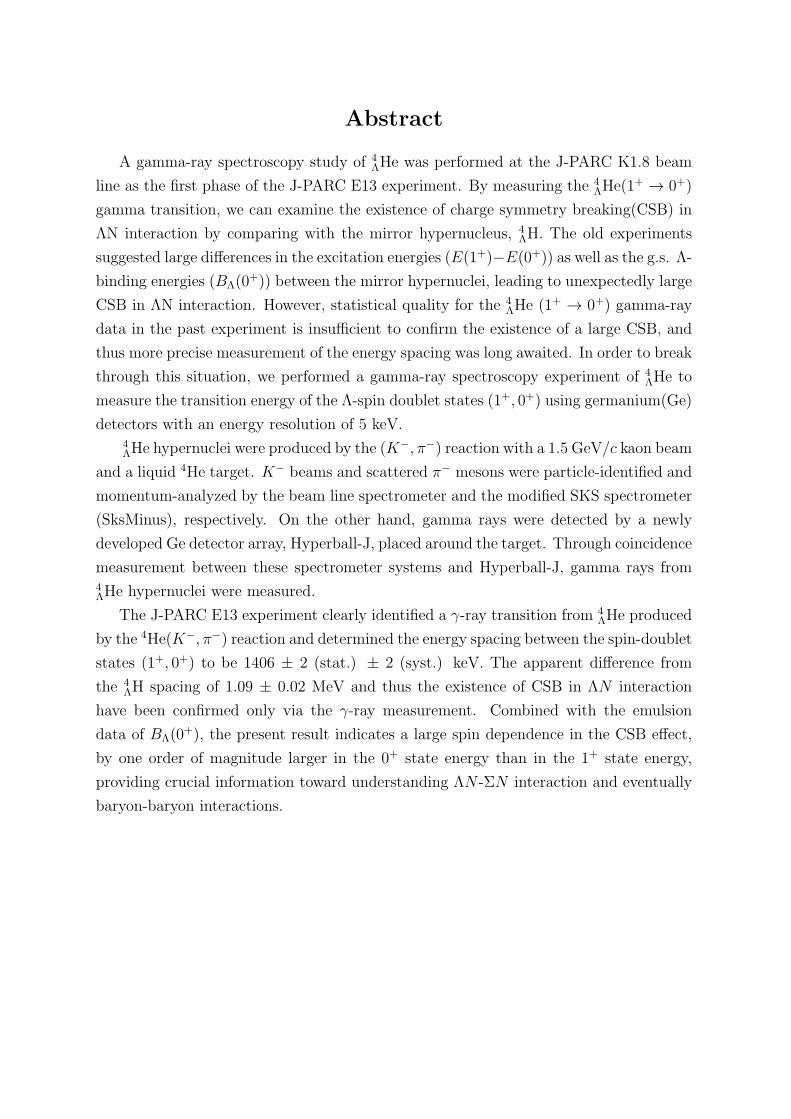
Abstract
A gamma-ray spectroscopy study of 4ΛHe was performed at the J-PARC K1.8 beam
line as the first phase of the J-PARC E13 experiment. By measuring the 4ΛHe(1
+ → 0+)
gamma transition, we can examine the existence of charge symmetry breaking(CSB) in
ΛN interaction by comparing with the mirror hypernucleus, 4ΛH. The old experiments
suggested large differences in the excitation energies (E(1+)−E(0+)) as well as the g.s. Λ-
binding energies (BΛ(0+)) between the mirror hypernuclei, leading to unexpectedly large
CSB in ΛN interaction. However, statistical quality for the 4ΛHe (1+ → 0+) gamma-ray
data in the past experiment is insufficient to confirm the existence of a large CSB, and
thus more precise measurement of the energy spacing was long awaited. In order to break
through this situation, we performed a gamma-ray spectroscopy experiment of 4ΛHe to
measure the transition energy of the Λ-spin doublet states (1+, 0+) using germanium(Ge)
detectors with an energy resolution of 5 keV.4ΛHe hypernuclei were produced by the (K−, π−) reaction with a 1.5 GeV/c kaon beam
and a liquid 4He target. K− beams and scattered π− mesons were particle-identified and
momentum-analyzed by the beam line spectrometer and the modified SKS spectrometer
(SksMinus), respectively. On the other hand, gamma rays were detected by a newly
developed Ge detector array, Hyperball-J, placed around the target. Through coincidence
measurement between these spectrometer systems and Hyperball-J, gamma rays from4ΛHe hypernuclei were measured.
The J-PARC E13 experiment clearly identified a γ-ray transition from 4ΛHe produced
by the 4He(K−, π−) reaction and determined the energy spacing between the spin-doublet
states (1+, 0+) to be 1406 ± 2 (stat.) ± 2 (syst.) keV. The apparent difference from
the 4ΛH spacing of 1.09 ± 0.02 MeV and thus the existence of CSB in ΛN interaction
have been confirmed only via the γ-ray measurement. Combined with the emulsion
data of BΛ(0+), the present result indicates a large spin dependence in the CSB effect,
by one order of magnitude larger in the 0+ state energy than in the 1+ state energy,
providing crucial information toward understanding ΛN -ΣN interaction and eventually
baryon-baryon interactions.

Contents
1 Introduction 1
1.1 Charge symmetry and CSB in NN interaction . . . . . . . . . . . . . . . 1
1.2 Λ hypernuclear structure and CSB in ΛN interaction . . . . . . . . . . . 3
1.3 Unexpectedly large CSB manifestation in A=4 hypernuclei . . . . . . . . 6
1.4 Theoretical studies for CSB effect in 4ΛH/
4ΛHe . . . . . . . . . . . . . . . . 8
1.5 Experimental improvement for the measurement of BΛ(0+) . . . . . . . . 10
1.6 Old γ-ray spectroscopic experiment of 4ΛH/
4ΛHe . . . . . . . . . . . . . . . 12
1.7 Purpose of the present work . . . . . . . . . . . . . . . . . . . . . . . . . 13
2 Experiment 17
2.1 Overview of the experiment . . . . . . . . . . . . . . . . . . . . . . . . . 17
2.2 J-PARC K1.8 beam line . . . . . . . . . . . . . . . . . . . . . . . . . . . 17
2.3 Spectrometer system . . . . . . . . . . . . . . . . . . . . . . . . . . . . . 21
2.3.1 Beam line spectrometer . . . . . . . . . . . . . . . . . . . . . . . 21
2.3.2 Scattered particle spectrometer with SKS (SksMinus setting) . . . 26
2.3.3 Beam-decay suppression detectors . . . . . . . . . . . . . . . . . . 32
2.4 Hyperball-J . . . . . . . . . . . . . . . . . . . . . . . . . . . . . . . . . . 35
2.4.1 Ge detectors . . . . . . . . . . . . . . . . . . . . . . . . . . . . . . 37
2.4.2 PWO counters . . . . . . . . . . . . . . . . . . . . . . . . . . . . 40
2.4.3 LSO pulser . . . . . . . . . . . . . . . . . . . . . . . . . . . . . . 42
2.5 KPI Trigger . . . . . . . . . . . . . . . . . . . . . . . . . . . . . . . . . 42
2.6 Data acquisition system . . . . . . . . . . . . . . . . . . . . . . . . . . . 43
2.7 Ge detector self-triggered data . . . . . . . . . . . . . . . . . . . . . . . . 45
2.8 Target . . . . . . . . . . . . . . . . . . . . . . . . . . . . . . . . . . . . . 47
2.9 Data summary . . . . . . . . . . . . . . . . . . . . . . . . . . . . . . . . 47
3 Analysis I - the (K−, π−) reaction 49
3.1 Outline . . . . . . . . . . . . . . . . . . . . . . . . . . . . . . . . . . . . . 49
3.2 Analysis of incident particle . . . . . . . . . . . . . . . . . . . . . . . . . 50
3.2.1 Momentum reconstruction for beam particle . . . . . . . . . . . . 50
3.2.2 Selection of K− . . . . . . . . . . . . . . . . . . . . . . . . . . . . 52
3.3 Analysis of scattered particle . . . . . . . . . . . . . . . . . . . . . . . . . 53
3.3.1 Momentum reconstruction for scattered particle . . . . . . . . . . 53
3.3.2 Selection of π− . . . . . . . . . . . . . . . . . . . . . . . . . . . . 54
3.4 Reconstruction of scattering angle and reaction vertex . . . . . . . . . . . 55
5
3.5 Calculation of missing mass . . . . . . . . . . . . . . . . . . . . . . . . . 583.6 Mass spectrum of Σ+ and 12
Λ C . . . . . . . . . . . . . . . . . . . . . . . . 593.7 Mass spectrum of 4
ΛHe . . . . . . . . . . . . . . . . . . . . . . . . . . . . 613.8 Information for the Doppler correction . . . . . . . . . . . . . . . . . . . 623.9 Performance of decay suppression counter . . . . . . . . . . . . . . . . . 67
4 Analysis II - γ rays 714.1 Outline . . . . . . . . . . . . . . . . . . . . . . . . . . . . . . . . . . . . . 714.2 Event selection . . . . . . . . . . . . . . . . . . . . . . . . . . . . . . . . 71
4.2.1 Coincidence events with the (K−, π−) reaction . . . . . . . . . . . 724.2.2 Background events . . . . . . . . . . . . . . . . . . . . . . . . . . 73
4.3 Energy calibration of Ge detectors . . . . . . . . . . . . . . . . . . . . . . 764.3.1 Calibration curve . . . . . . . . . . . . . . . . . . . . . . . . . . . 764.3.2 Peak shift . . . . . . . . . . . . . . . . . . . . . . . . . . . . . . . 78
4.4 Doppler-shift correction . . . . . . . . . . . . . . . . . . . . . . . . . . . 794.5 Performance of Hyperball-J . . . . . . . . . . . . . . . . . . . . . . . . . 80
4.5.1 Accuracy of the energy calibration . . . . . . . . . . . . . . . . . 804.5.2 Energy resolution . . . . . . . . . . . . . . . . . . . . . . . . . . . 814.5.3 Expected peak shape with Doppler-shift correction . . . . . . . . 824.5.4 Photo-peak efficiency . . . . . . . . . . . . . . . . . . . . . . . . . 82
5 Results 855.1 Mass selection . . . . . . . . . . . . . . . . . . . . . . . . . . . . . . . . . 855.2 γ-ray spectra . . . . . . . . . . . . . . . . . . . . . . . . . . . . . . . . . 865.3 1406-keV γ ray . . . . . . . . . . . . . . . . . . . . . . . . . . . . . . . . 885.4 Excitation energy of 4
ΛHe(1+) . . . . . . . . . . . . . . . . . . . . . . . . 95
5.5 Ratio of the yield of 4ΛHe(0
+) and 4ΛHe(1
+) . . . . . . . . . . . . . . . . . 95
6 Discussion 976.1 Comparison with the past γ-ray measurement . . . . . . . . . . . . . . . 976.2 Level scheme of 4
ΛH/4ΛHe . . . . . . . . . . . . . . . . . . . . . . . . . . . 100
6.3 CSB effect in 4ΛH/
4ΛHe . . . . . . . . . . . . . . . . . . . . . . . . . . . . 101
6.4 Theoretical calculations for the CSB effect . . . . . . . . . . . . . . . . . 1016.5 Present status of the study of 4
ΛH/4ΛHe . . . . . . . . . . . . . . . . . . . 106
7 Summary 109
A Past γ-ray spectroscopic experiments of 4ΛH/4
ΛHe 111A.1 Summary of γ-ray measurement for 4
ΛH/4ΛHe . . . . . . . . . . . . . . . . 111
A.2 On the assigned γ-lines . . . . . . . . . . . . . . . . . . . . . . . . . . . . 112A.3 On the unassigned γ-lines . . . . . . . . . . . . . . . . . . . . . . . . . . 119
B Study of the CSB effect in p-shell hypernuclei 125B.1 Emulsion experiments . . . . . . . . . . . . . . . . . . . . . . . . . . . . 125B.2 Experiments via the (e, e′K+) reaction . . . . . . . . . . . . . . . . . . . 126B.3 Recent theoretical calculation . . . . . . . . . . . . . . . . . . . . . . . . 128
List of Figures
1.1 Diagrams for the direct ΛN and ΣN channels . . . . . . . . . . . . . . . 2
1.2 Level scheme of 7ΛLi and its “core” nucleus. . . . . . . . . . . . . . . . . . 4
1.3 Diagrams for the direct ΛN and ΣN channels and the ΛN -ΣN coupledchannels. . . . . . . . . . . . . . . . . . . . . . . . . . . . . . . . . . . . . 5
1.4 Level schemes of the mirror hypernuclei, 4ΛH and 4
ΛHe. . . . . . . . . . . . 7
1.5 BΛ(0+) distribution for 4
ΛH and 4ΛHe measured by emulsion experiments. . 8
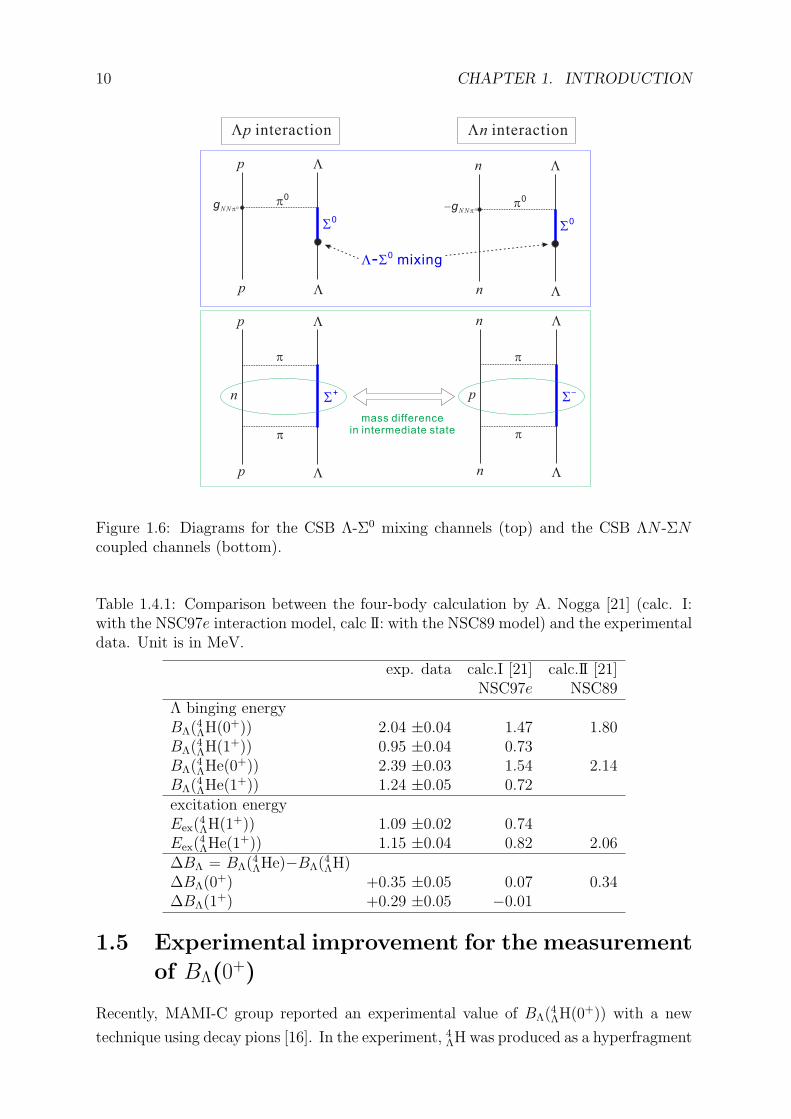
1.6 Diagrams for CSB ΛN -ΣN mixing channels. . . . . . . . . . . . . . . . . 10
1.7 Measured π− momentum in the 4ΛH → 4He + π− weak decay. . . . . . . . 11
1.8 Reported excitation energies of 1+ states of 4ΛH/
4ΛHe. . . . . . . . . . . . 13
1.9 γ-ray energy spectra reported by M. Bedjidian et al. (1979). . . . . . . . 14
2.1 The cross section of the K− + n → Λ + π− reaction . . . . . . . . . . . . 18
2.2 Schematic view of J-PARC Hadron Experimental Facility. . . . . . . . . 18
2.3 Schematic view of the J-PARC K1.8 beam line. . . . . . . . . . . . . . . 19
2.4 Typical beam profile at the experimental target. . . . . . . . . . . . . . 20
2.5 Schematic view of the K1.8/SksMinus spectrometers. . . . . . . . . . . . 22
2.6 A time-of-flight (=BH2−BH1) distribution with a typical beam condition. 23
2.7 Threshold of refractive index for Cerenkov radiation . . . . . . . . . . . . 24
2.8 Schematic view of BAC1,2. . . . . . . . . . . . . . . . . . . . . . . . . . . 25
2.9 Schematic view of BFT. . . . . . . . . . . . . . . . . . . . . . . . . . . . 26
2.10 Schematic view of BC3. . . . . . . . . . . . . . . . . . . . . . . . . . . . 26
2.11 Schematic view of the SksMinus setup. . . . . . . . . . . . . . . . . . . . 28
2.12 Accept probability map of the SksMinus. . . . . . . . . . . . . . . . . . . 29
2.13 Solid angle of the SksMinus for the hypernuclear production kinematics. . 29
2.14 Schematic view of SAC1. . . . . . . . . . . . . . . . . . . . . . . . . . . . 31
2.15 Schematic view of the beam-through veto counter (SFV and SAC3). . . . 32
2.16 Correlation between pscat. and θKπ. . . . . . . . . . . . . . . . . . . . . . 33
2.17 Schematic view of SP0. . . . . . . . . . . . . . . . . . . . . . . . . . . . . 34
2.18 Simulated stopped/absorbed position of µ− from the K− decay and π−
from hypernuclear production in iron . . . . . . . . . . . . . . . . . . . . 35
2.19 Schematic view of the lower half of Hyperball-J and the Ge + PWO de-tector units. . . . . . . . . . . . . . . . . . . . . . . . . . . . . . . . . . . 36
2.20 Schematic view of the Hyperball-J detector configuration. . . . . . . . . 36
2.21 Schematic side view of the detector system around the experimental tar-get. . . . . . . . . . . . . . . . . . . . . . . . . . . . . . . . . . . . . . . 37
7
8 LIST OF FIGURES
2.22 Schematic view of the mechanically-cooled Ge detector. . . . . . . . . . . 39
2.23 Block diagram for the Ge detector read-out and the control system. . . 39
2.24 Configurations of Ge + PWO detector units. . . . . . . . . . . . . . . . 41
2.25 Trigger logic diagram for the (K−, π−) reaction. . . . . . . . . . . . . . 43
2.26 Block diagram of the data acquisition system. . . . . . . . . . . . . . . . 44
2.27 Block diagram of the self-triggered data system. . . . . . . . . . . . . . 45
2.28 Schematic view of the liquid 4He target system. . . . . . . . . . . . . . . 46
3.1 The analysis procedure for the obtained data. . . . . . . . . . . . . . . . 50
3.2 Analysis of BFT. . . . . . . . . . . . . . . . . . . . . . . . . . . . . . . . 51
3.3 Momentum distribution of beam K− measured by the beam spectrometer. 51
3.4 Time-of-flight distribution between BH1 and BH2 for KPI triggered events. 52
3.5 χ2 distribution in the SKS tracking for scattered π−. . . . . . . . . . . . 54
3.6 Momentum distribution reconstructed in the SKS tracking for scattered π−. 54
3.7 Mass spectrum for scattered particles for the KPI triggered events. . . . 55
3.8 Z-axis projection of the reaction vertex position. . . . . . . . . . . . . . . 56
3.9 Contour plot of z-vertex points versus θKπ. . . . . . . . . . . . . . . . . . 57
3.10 Contour plots of calculated missing mass versus the horizontal and verticalangle. . . . . . . . . . . . . . . . . . . . . . . . . . . . . . . . . . . . . . 59
3.11 Missing mass spectra with a CH2 target. . . . . . . . . . . . . . . . . . . 60
3.12 The missing mass spectrum for the 4He(K−, π−)4ΛHe kinematics. . . . . . 62
3.13 Velocity and stopping time of the produced 4ΛHe. . . . . . . . . . . . . . . 63
3.14 Illustration of the Doppler-shift correction. . . . . . . . . . . . . . . . . 64
3.15 Distribution of a difference in the x- and y-position at the target. . . . . 65
3.16 Z-vertex distributions with the SUS target for the beam particle scatteringevents. . . . . . . . . . . . . . . . . . . . . . . . . . . . . . . . . . . . . . 66
3.17 z-vertex resolution as a function of θKπ. . . . . . . . . . . . . . . . . . . . 67
3.18 Missing mass square distributions for the KPI trigger with empty target. 68
3.19 Number of hit layers of SP0. . . . . . . . . . . . . . . . . . . . . . . . . . 69
3.20 Binding energy spectra with empty target. . . . . . . . . . . . . . . . . . 70
4.1 Typical correlation between the timing distribution (Ge detector−KPItrigger) and the measured γ-ray energy (Eγ). . . . . . . . . . . . . . . . 72
4.2 Typical timing distribution for an energy region of Eγ > 600 keV. . . . . 73
4.3 Typical correlation between the ADC value and the reset time. . . . . . . 74
4.4 Typical time distribution of the PWO counters. . . . . . . . . . . . . . . 75
4.5 γ-ray energy spectra for the KPI triggered events before/after the back-ground suppression . . . . . . . . . . . . . . . . . . . . . . . . . . . . . . 76
4.6 γ-ray energy spectrum with the Th-series source. . . . . . . . . . . . . . 77
4.7 Peak position drift of the 2.6 MeV (208Tl) γ ray. . . . . . . . . . . . . . . 78
4.8 Residuals of the fitting to obtain the energy calibration curve. . . . . . . 79
4.9 Residuals of the measured γ-ray energy position from known energies. . . 80
4.10 Energy resolution in FWHM as a function of the γ-ray energy. . . . . . . 81
4.11 Simulated peak shapes for the 1-MeV γ rays. . . . . . . . . . . . . . . . . 83
4.12 Simulated total photo-peak efficiency of Hyperball-J as a function of γ-rayenergy. . . . . . . . . . . . . . . . . . . . . . . . . . . . . . . . . . . . . . 84
5.1 The missing mass spectrum for the 4He(K−, π−)4ΛHe kinematics. . . . . . 855.2 γ-ray energy spectra measured by Hyperball-J in coincidence with the
4He(K−, π−) reaction. . . . . . . . . . . . . . . . . . . . . . . . . . . . . 875.3 A result of the peak search in the γ-ray energy spectrum before/after the
Doppler-shift correction. . . . . . . . . . . . . . . . . . . . . . . . . . . . 895.4 Fit of the simulated peak shape to the present data. . . . . . . . . . . . . 905.5 Results of the fitting with various background function. . . . . . . . . . . 925.6 Fit result in the missing mass spectrum with two Gaussian function. . . . 96
6.1 γ-ray energy spectra of the present data and the old experiment. . . . . . 986.2 Updated level schemes of the mirror hypernuclei. . . . . . . . . . . . . . 1006.3 Calculated level scheme of 4
ΛHe reported by Y. Akaishi. . . . . . . . . . . 103
A.1 Measured γ-ray energies from 4ΛH/
4ΛHe. . . . . . . . . . . . . . . . . . . . 112
A.2 γ-ray energy spectra reported by M. Bedjidian et al. (1976). . . . . . . . 114A.3 Detector setup of the experiment described by M. Bedjidian et al. (1979). 115A.4 γ-ray energy spectra reported by M. Bedjidian et al. (1979). . . . . . . . 116A.5 γ-ray energy spectra reported by A. Kawachi (1997). . . . . . . . . . . . 118A.6 γ-ray energy spectrum obtained in the experiment reported by A. Bam-
berger et al.. . . . . . . . . . . . . . . . . . . . . . . . . . . . . . . . . . . 120A.7 A γ-ray energy spectrum obtained in the experiment reported by M. Bed-
jidian et al.. . . . . . . . . . . . . . . . . . . . . . . . . . . . . . . . . . . 121A.8 γ-ray energy spectrum obtained in the experiment reported by M. May
et al.. . . . . . . . . . . . . . . . . . . . . . . . . . . . . . . . . . . . . . 122
B.1 BΛ values of A=7 mirror hypernuclei. . . . . . . . . . . . . . . . . . . . . 126

List of Tables
1.2.1 BΛ differences in the ground state of the s- and p-shell mirror hypernuclei. 6
1.3.1 Reported Λ binding energies (BΛ) of4ΛH/
4ΛHe. . . . . . . . . . . . . . . . 7
1.4.1 Comparison between the four-body calculation by A. Nogga and E. Hiyamaand the experimental data. . . . . . . . . . . . . . . . . . . . . . . . . . . 10
1.6.1 Reported γ-ray energies for 4ΛH/
4ΛHe. . . . . . . . . . . . . . . . . . . . . 13
1.7.1 Comparison between the present and the past experiment. . . . . . . . . 15
1.7.2 Comparison in identification methods of hypernuclei between the presentand the past experiment. . . . . . . . . . . . . . . . . . . . . . . . . . . . 15
2.2.1 Specifications of the K1.8 beam line. . . . . . . . . . . . . . . . . . . . . 20
2.2.2 Experimental beam condition. . . . . . . . . . . . . . . . . . . . . . . . . 20
2.3.1 Specifications of the beam line spectrometer. . . . . . . . . . . . . . . . . 21
2.3.2 Specifications of counters for particle identification . . . . . . . . . . . . . 24
2.3.3 Specifications of the tracking detectors. . . . . . . . . . . . . . . . . . . . 27
2.3.4 Specifications of SksMinus. . . . . . . . . . . . . . . . . . . . . . . . . . . 28
2.4.1 Specifications of the Ge detectors. . . . . . . . . . . . . . . . . . . . . . . 38
2.4.2 Characteristics of the BGO and PWO scintillator. . . . . . . . . . . . . . 41
2.5.1 The rates and prescale factors of the triggers. . . . . . . . . . . . . . . . 43
2.7.1 Specifications of the liquid 4He target system. . . . . . . . . . . . . . . . 47
2.9.1 The data summary. . . . . . . . . . . . . . . . . . . . . . . . . . . . . . . 48
3.9.1 Suppression efficiency of SP0 and SMF . . . . . . . . . . . . . . . . . . . 69
4.3.1 Selected γ rays from the Th-series source for the gain shift correction. . . 77
4.3.2 γ-ray peaks used in the fitting for accurate energy calibration. . . . . . . 79
5.3.1 Results of the fitting with different background functions. . . . . . . . . . 93
5.3.2 Systematic errors on measured energy position. . . . . . . . . . . . . . . 94
5.5.1 Yield of 4ΛHe(0
+) and 4ΛHe(1
+). . . . . . . . . . . . . . . . . . . . . . . . 96
6.1.1 Measured γ-ray energies for 4ΛH/
4ΛHe. . . . . . . . . . . . . . . . . . . . . 99
6.1.2 Measured Λ binding energies (BΛ) of4ΛH/
4ΛHe. . . . . . . . . . . . . . . . 100
6.4.1 Comparison between the four-body calculation by A. Nogga and E. Hiyamaand the experimental data. . . . . . . . . . . . . . . . . . . . . . . . . . . 104
6.4.2 Comparison between the shell model calculation by A. Gal and the exper-imental data. . . . . . . . . . . . . . . . . . . . . . . . . . . . . . . . . . 105
11
6.4.3 Comparison between the experimental data and the ab initio calculationby D. Gazda. . . . . . . . . . . . . . . . . . . . . . . . . . . . . . . . . . 106
A.1.1Measured γ-ray energy list for 4ΛH/
4ΛHe. . . . . . . . . . . . . . . . . . . . 113
A.1.2Averaged γ-ray energy of 4ΛH/
4ΛHe. . . . . . . . . . . . . . . . . . . . . . 113
A.2.1γ-ray peak positions for 4ΛH
∗ reported by A. Kawachi. . . . . . . . . . . . 119A.3.1γ-ray energies reported by A. Bamberger et al.. . . . . . . . . . . . . . . 120
B.1.1BΛ differences in the ground state of the p-shell mirror hypernuclei. . . . 125B.3.1BΛ differences in ground-state of the s- and p-shell mirror hypernuclei. . 129
Chapter 1
Introduction
Charge symmetry is a basic concept in nuclear physics. This symmetry holds almost
exactly in NN interaction; only quite small charge symmetry breaking (CSB) effects
have been reported. The CSB effect in NN interaction was studied as an important
subject for understanding hadronic interaction. Unlike NN interaction, experimental
data indicate an unexpectedly large CSB effect in ΛN interaction reflected in structures
of A=4 mirror Λ hypernuclei (4ΛH and 4ΛHe). The present work reaffirms this observation
by providing more solid experimental foundation. The study of the observed large CSB
effect in ΛN interaction is a good test for our current framework of baryon-baryon
interaction.
In this chapter, the studies of charge symmetry in NN interaction and then CSB
effects in Λ hypernuclei reported by the past studies will be discussed. The physics
motivation of the present work is given at the end.
1.1 Charge symmetry and CSB in NN interaction
Charge symmetry
Charge symmetry is a general concept in the nuclear and hadronic systems. Under
charge symmetry, hadronic state is invariant with respect to a rotation around y axis
by 180◦ in isospin (T ) space, which corresponds to an interchange of u and d quarks.
For example, p–n and Σ+–Σ− pairs are identical under charge symmetry (see Fig. 1.1).
Actually, charge symmetry is slightly broken due to the mass difference between u and d
quarks, resulting in the mass difference in p–n and Σ+–Σ− pairs. Charge symmetry also
holds in hadronic interaction as well as nuclear structure. On the other hand, charge
independence is a more general concept in strong interaction, in which hadronic state is
invariant under any rotation in isospin space (for example, Σ+–Σ0–Σ− isospin triplet is
identical under charge independence).
1
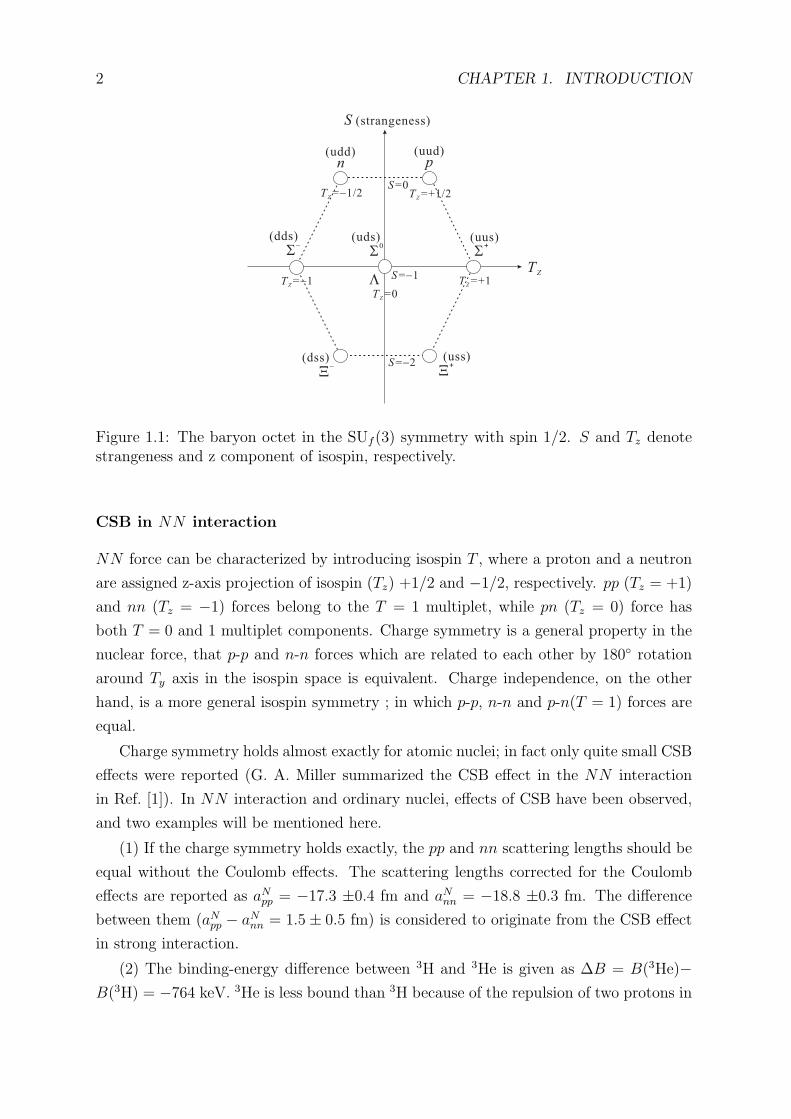
2 CHAPTER 1. INTRODUCTION
n(udd)
p(uud)
S-
(dds)
S (strangeness)
S0
(uds)
S+
(uus)
L
S=0
S=-1
S=-2
TZ
X-
(dss)X
+
(uss)
T =Z -1T =Z 0
T =Z +1
T =Z +1/2T =Z -1/2
Figure 1.1: The baryon octet in the SUf (3) symmetry with spin 1/2. S and Tz denotestrangeness and z component of isospin, respectively.
CSB in NN interaction
NN force can be characterized by introducing isospin T , where a proton and a neutron
are assigned z-axis projection of isospin (Tz) +1/2 and −1/2, respectively. pp (Tz = +1)
and nn (Tz = −1) forces belong to the T = 1 multiplet, while pn (Tz = 0) force has
both T = 0 and 1 multiplet components. Charge symmetry is a general property in the
nuclear force, that p-p and n-n forces which are related to each other by 180◦ rotation
around Ty axis in the isospin space is equivalent. Charge independence, on the other
hand, is a more general isospin symmetry ; in which p-p, n-n and p-n(T = 1) forces are
equal.
Charge symmetry holds almost exactly for atomic nuclei; in fact only quite small CSB
effects were reported (G. A. Miller summarized the CSB effect in the NN interaction
in Ref. [1]). In NN interaction and ordinary nuclei, effects of CSB have been observed,
and two examples will be mentioned here.
(1) If the charge symmetry holds exactly, the pp and nn scattering lengths should be
equal without the Coulomb effects. The scattering lengths corrected for the Coulomb
effects are reported as aNpp = −17.3 ±0.4 fm and aNnn = −18.8 ±0.3 fm. The difference
between them (aNpp − aNnn = 1.5± 0.5 fm) is considered to originate from the CSB effect
in strong interaction.
(2) The binding-energy difference between 3H and 3He is given as ∆B = B(3He)−B(3H) = −764 keV. 3He is less bound than 3H because of the repulsion of two protons in
1.2. Λ HYPERNUCLEAR STRUCTURE AND CSB IN ΛN INTERACTION 3
3He with the Coulomb interaction. From an exact three-body calculation applied to the
A=3 nuclear system, the contribution of the Coulomb interaction to the binging energy
difference was estimated to be ∆B = −693 ±19 ±5 keV [2], where the first uncertainty
comes from the error in the form factors and the second reflects model dependence of
the meson-exchange corrections to the measured form factors. The remaining difference
of ∆B = −71 ±24 keV was attributed to the CSB contribution in strong interaction.
The origin of such CSB effects is expected to originate from the current mass differ-
ence between u quark (Mu = 2.3+0.7−0.5 MeV) and d quark (Md = 4.8+0.5
−0.3 MeV), ∆Mud =
Mu − Md∼= −2.5 MeV. This difference leads to the differences in the hadron mass,
for example, the mass difference between proton and neutron of about 0.1% (∆Mpn =
Mp(938.27 MeV) −Mn(939.56 MeV) = −1.29 MeV). In addition, the asymmetry in
the ud quark mass causes the isospin mixing in mesons, such as π0(T=1)−η(T=0) and
ρ0(T=1)−ω(T=0) mixing. The effect of this isospin mixing appears in NN CSB in-
teraction with an opposite contribution between pp and nn interaction because of the
different sign in the π0NN coupling constant (gπ0pp = −gπ0nn) while the same sign in the
ηNN coupling constant in π0 − η mixing, for example. Meson-exchange models claimed
that ρ0 − ω mixing has a larger effect on NN CSB interaction than π0 − η mixing. The
observed CSB effects in the 3He-3H masses can be explained by ρ0 − ω mixing [1].
1.2 Λ hypernuclear structure and CSB in ΛN inter-
action
ΛN interaction has been indirectly studied through the structure of single Λ hypernu-
clei instead of direct ΛN scattering due to difficulties of such scattering experiments
associated with the short lifetime of Λ. This is not the case in studies of NN interaction.
The first observation of a Λ hypernucleus was reported by an experiment using nuclear
emulsion method [3]. Later, Λ hypernuclei were studied in more detail by reaction
spectroscopy using reactions such as the n(K−, π−)Λ and the n(π+, K+)Λ reactions with
an energy resolution of ∼2 MeV. Recently, the energy resolution was improved to ∼0.6
MeV by employing the p(e, e′K+)Λ reaction with an advantage of intensive primary e−
beams which allow for the use of a thin target. From these studies, the strength of the
central (spin-independent) part of ΛN interaction was determined. On the other hand,
the spin-dependent part of ΛN interaction was studied via γ-ray spectroscopy using NaI
detectors and then germanium (Ge) detectors. A better energy resolution of <0.1 MeV
was essential to resolve a small energy spacing of spin-doublet structures [for example,
26 keV for 16Λ O(1−1 , 0
−) [4]]. The spin-dependent ΛN interaction lifts energy degeneracy
between doublet states with an opposite alignment between “core” nucleus spin (J) and
4 CHAPTER 1. INTRODUCTION
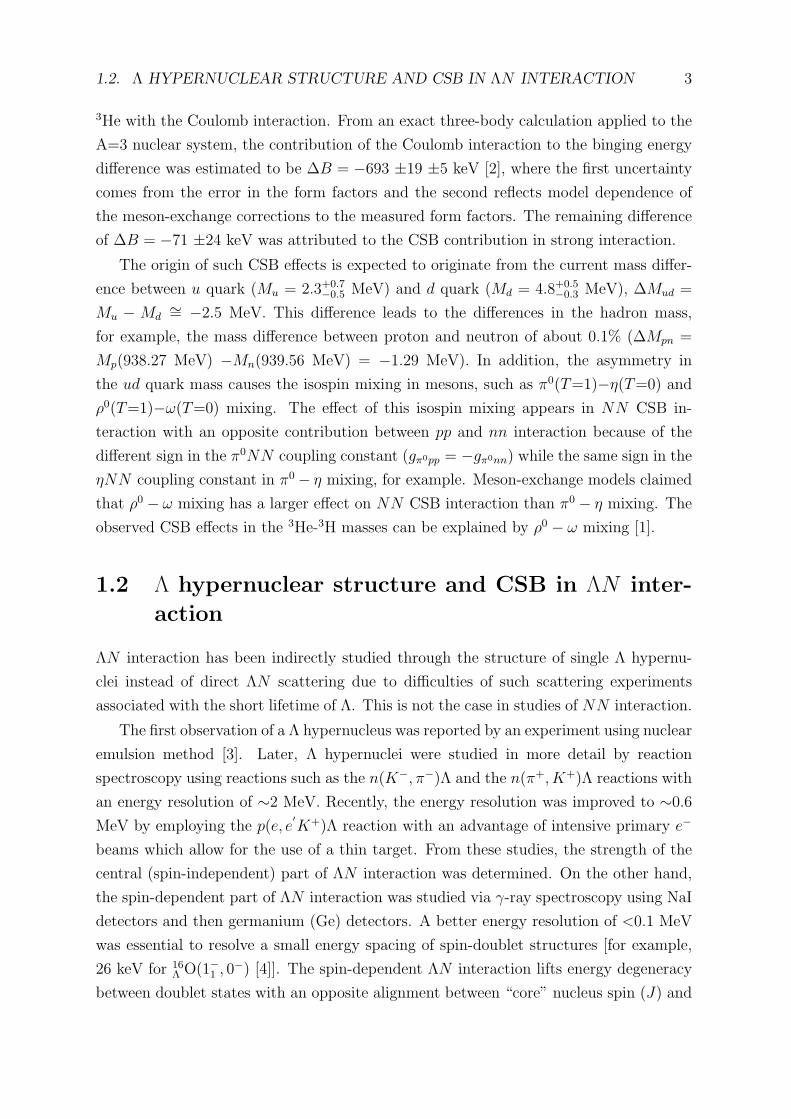
6Li
1+
3+
0 (T=1)+
7Li
0
2186
3563
Eex [keV]
1/2+
1/2 (T=1)+
0
692
2050
3/2+
5/2+
7/2+
Eex
[keV]
2521
3877
spin-doublet
“core”spin=J
L in -orbitsspin=1/2
L in -orbitpspin=1/2, 3/2
L
J+1/2
J-1/2
6Li+L
“core” nucleus
single L
hypernucleus
5220
BL
B =L 0 threshold for
emissionL
Figure 1.2: Level scheme of 7ΛLi and its “core” nucleus. The spin-doublet structure
appears from the spin-dependent part of the ΛN interaction. The excitation energieswere measured by γ-ray spectroscopy experiments using Ge detectors [5, 6].
a Λ spin (1/2), J ± 1/2, when J = 0. Figure 1.2 shows the level scheme of 7ΛLi, one
of the best studied hypernuclei, together with its “core” nucleus. The structure of 7ΛLi
was first studied via reaction spectroscopy. Subsequently, its fine structure such as spin-
doublet was measured via the γ-ray spectroscopy experiments using a Ge detector array
constructed in the Hyperball project [5, 6].
ΛN-ΣN coupling interaction
In ΛN interaction (S(strangeness) = −1 sector), ΛN -ΣN coupling may have a larger
effect than NN -∆N mixing in the S = 0 sector because of its smaller mass difference of
MΣ−MΛ∼= 80 MeV compared to M∆−MN
∼= 300 MeV. (The mixing effect is expected
to increase further in the S = −2 sector with the much smaller mass difference of
MΛΛ−MΣN∼= 30 MeV.) Experimental and theoretical studies of the p-shell hypernuclei
indicate a significant contribution of ΛN -ΣN coupling on hypernuclear structures (see
Ref. [7], for example).
The one-pion exchange is forbidden in ΛN interaction from isospin conservation. On
the other hand, with a two-pion exchange, ΛN -ΣN conversions in two-body channel
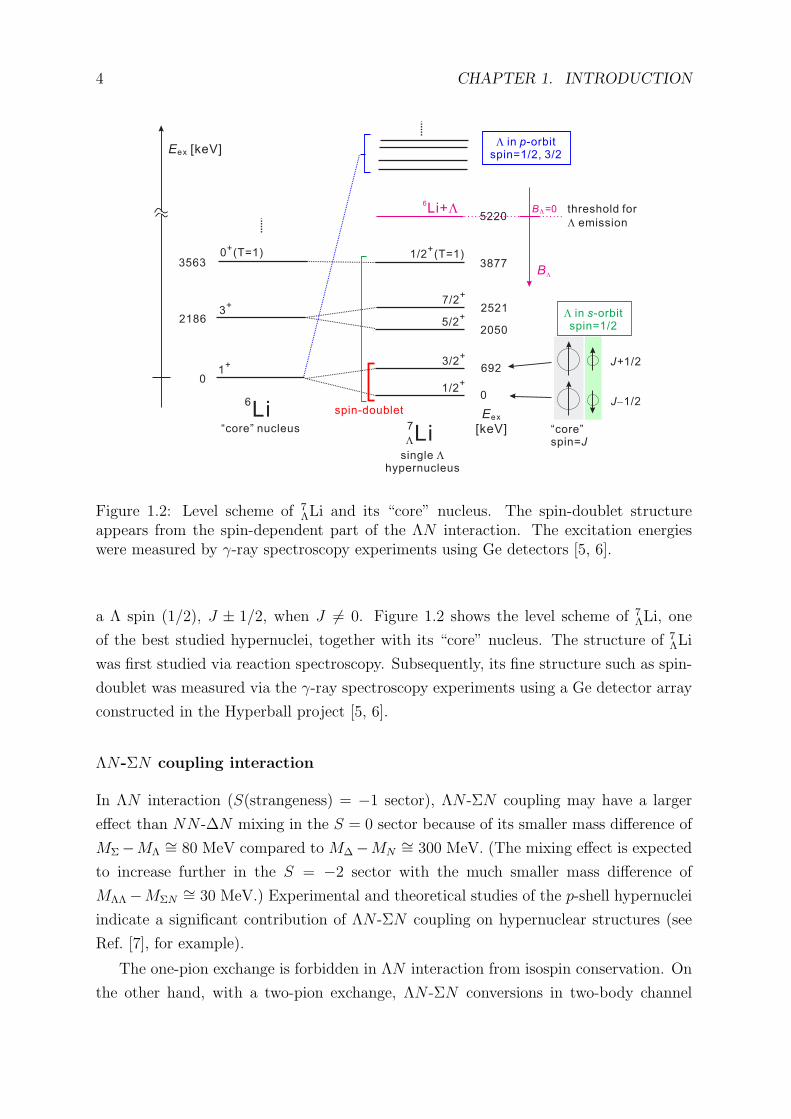
1.2. Λ HYPERNUCLEAR STRUCTURE AND CSB IN ΛN INTERACTION 5
N
N
L
L
no one p
exchange
T=0
N
N
L
L
p r,
T=1/2
N
N
L
S
K, K*
T=1
N
N
L
L
p
pN S
N
N
L
L
p
S
N
N
p
direct N and NL S
channel
L SN- N couplingchannel
Three-bodychannel
Two-bodychannel
Figure 1.3: Diagrams for the direct ΛN and ΣN channels (top) and the ΛN -ΣN coupledchannels (bottom). The one-pion exchange is forbidden in the direct ΛN interaction dueto isospin conservation. With two-pion exchange, ΛN -ΣN conversion is allowed. Thediagram for the three-body ΛNN interaction via ΛN -ΣN conversion is illustrated in thebottom right.
and three-body channel are allowed as illustrated in Fig. 1.3. Y. Akaishi claimed that
this three-body ΛN -ΣN coupling channel plays an important role in the hypernuclear
structure [8] as described in Section 6.4.
CSB effect in ΛN interaction
The charge symmetry should also hold in ΛN interaction and Λ hypernuclei; Λp and
Λn interactions and Λ binding energies (BΛ) between a pair of mirror Λ hypernuclei
such as 4ΛH and 4
ΛHe should be identical under this symmetry. The binding energy is
defined as BΛ = Mcore + MΛ − MHY P , where MHY P , Mcore, and MΛ denote the mass
of a hypernucleus, of the “core” nucleus, and of Λ, respectively. It should be noted
that BΛ does not directly involve any Coulomb interactions and the CSB effect in NN
interaction. First, there is no direct Coulomb interaction between charge-neutral Λ and
N . Second, the binding energy of the “core” nucleus, in which the CSB effect in NN
6 CHAPTER 1. INTRODUCTION
interaction appears, is canceled out in Mcore − MHY P . It means that the CSB effect
in ΛN interaction can be studied almost directly from the difference of BΛ in mirror
hypernuclei.
There has been a long standing CSB puzzle, however, for ΛN interaction; the reported
differences in BΛ are notably large in the A=4 hypernuclear systems, having yet to be
theoretically explained (see the next section).
The CSB effects reported for some s- and p-shell hypernuclei are listed in Table 1.2.1,
where all the measured BΛ values of the ground state, BΛ(g.s.), listed are reported from
emulsion experiments [9, 10]; the BΛ(g.s.) values of A≤15 hypernuclei were measured by
experiments using the emulsion technique, employing K− stopped in nuclear emulsion
stacks and absorbed by nuclei in emulsion. Only in the A=4 hypernuclei, 4ΛH/
4ΛHe, a
significant difference of 350 ±60 keV in BΛ(g.s.) was observed. It is noted that BΛ(g.s.)
values of 12Λ C and 12
Λ B were 10.80 ±0.18 MeV [11] and 11.37 ±0.06 MeV, respectively,
showing also a large CSB effect of ∆BΛ=−0.57 ±0.19 MeV. However, a recent systematic
study suggests that the quoted emulsion value of BΛ(12Λ C) should be shifted by ∼+0.5
MeV [12], which would give no significant CSB effect.
Table 1.2.1: BΛ differences in the ground state of the s- and p-shell mirror hypernucleimeasured by emulsion experiments [10] [see Ref. [11] for BΛ(
12Λ C)]. Unit is in keV.
mirror hypernuclei ∆BΛ(g.s.)4ΛHe−4
ΛH +350 ± 608ΛBe−8
ΛLi +40 ± 609ΛB−9
ΛLi −210 ± 22010Λ B−10
Λ Be −220 ± 25012Λ C−12
Λ B (−570 ± 190)
1.3 Unexpectedly large CSB manifestation in A=4
hypernuclei
The A=4 hypernuclear systems have drawn considerable interests related to CSB in ΛN
interaction. The existing experimental data for the ground-state BΛ and the excitation
energies of 4ΛH and 4
ΛHe suggest a much larger ΛN CSB effect than NN in A=3 ordinary
mirror nuclei. Because no direct Coulomb interaction arises in ΛN interaction, the CSB
effect in ΛN strong interaction should be reflected almost directly in the BΛ difference
in A=4 mirror hypernuclei. Theoretically, it is easier to calculate these hypernuclei in
exact few-body calculation frameworks.
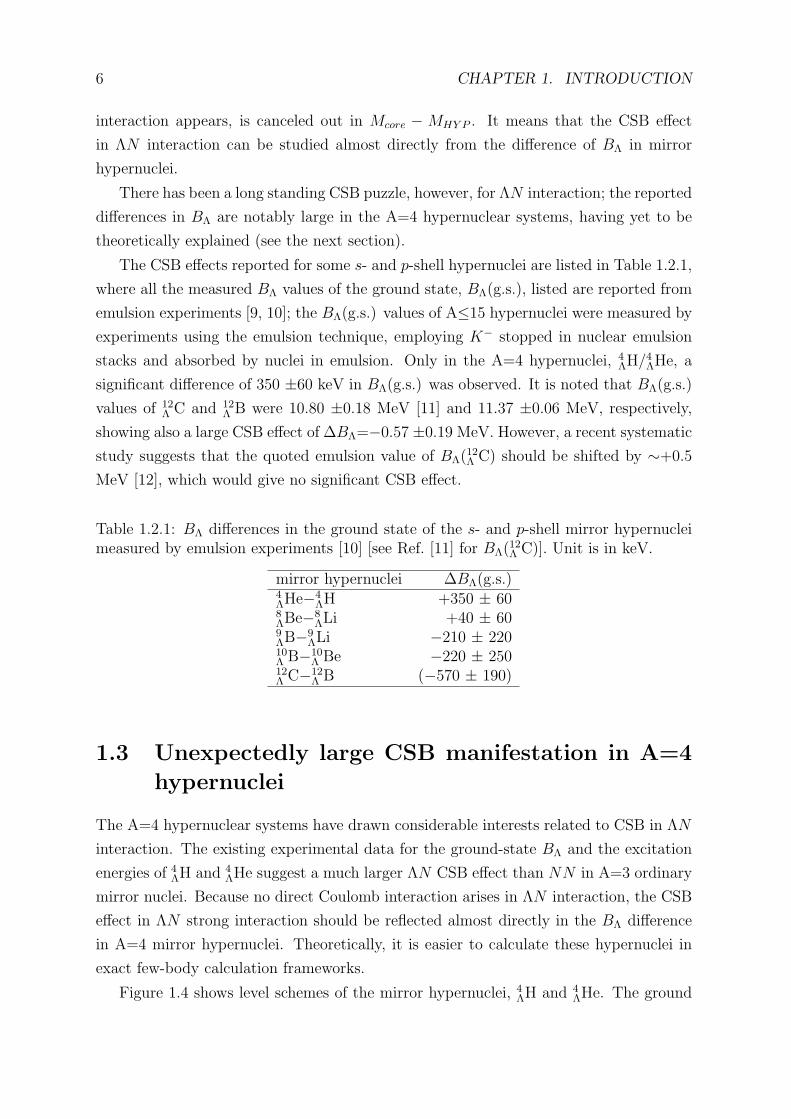
Figure 1.4 shows level schemes of the mirror hypernuclei, 4ΛH and 4
ΛHe. The ground
1.3. UNEXPECTEDLY LARGE CSB MANIFESTATION IN A=4 HYPERNUCLEI 7
1/2+
1+
1.09
0.02
0+
1/2+1+
0+2.04 0.04
2.39 0.03
4H
3H
3He
4He
B [MeV]
0.95 0.04
1.24 0.05
Eg=
03H + L
3He + L
1.15
0.04
Eg=
2.12 0.01 0.09± ±
[MAMI-C]
Figure 1.4: Level schemes of the mirror hypernuclei, 4ΛH and 4
ΛHe. Λ binding ener-gies (BΛ) of 4
ΛH(0+) and 4
ΛHe(0+) are taken from the past emulsion experiments [9].
BΛ(4ΛHe(1
+)) and BΛ(4ΛH(1
+)) are obtained using the past γ-ray data [13, 14, 15]. Re-cently, BΛ(
4ΛH(0
+)) = 2.12 ± 0.01 (stat) ± 0.09 (syst) MeV was obtained with an inde-pendent technique [16].
Table 1.3.1: Reported Λ binding energies (BΛ) of4ΛH/
4ΛHe. Unit is in MeV.
Ground state (0+) 1st-excited state (1+)with emulsion data [9]4ΛH 2.04 ±0.04 0.95 ±0.044ΛHe 2.39 ±0.03 1.24 ±0.05∆BΛ[
4ΛHe−4
ΛH] +0.35 ±0.05 +0.29 ±0.06with MAMI-C data [16]4ΛH 2.12 ±0.10 1.03 ±0.10∆BΛ[
4ΛHe−4
ΛH] +0.27 ±0.11 +0.21 ±0.11
0+ state and the 1st excited 1+ state are the members of the spin-doublet, and a major
part of its energy spacing originates from the Λ spin - “core” spin interaction. Only these
two states are below the Λ emission threshold (BΛ=0) and particle bound, and thus the
(1+ → 0+) γ-transition is allowed. The spin assignment for the ground state [Jg.s. = 0]
was made using helium bubble chamber technique [17]. The angular distribution of pions
from the 4ΛH→4He+π− weak decay with respect to the recoil momentum direction of the
hypernucleus was found to be isotropic, indicating the 0+ spin of 4ΛHe(g.s.) [18]. This
spin assignment is supported by an analysis for the branching ratio of the weak decay
[19].
8 CHAPTER 1. INTRODUCTION
Nu
mb
er
of
eve
nts
0
20
40
60
0 1 2 3 4 5
Nu
mb
er
of
eve
nts
0
20
40
60
80
100
BL [MeV]
(A)
(B)
BL ( H(0 ))4 +
= 2.04 0.04 MeV±
L
BL ( He(0 ))4 +
= 2.39 0.03 MeV±
L
4HL
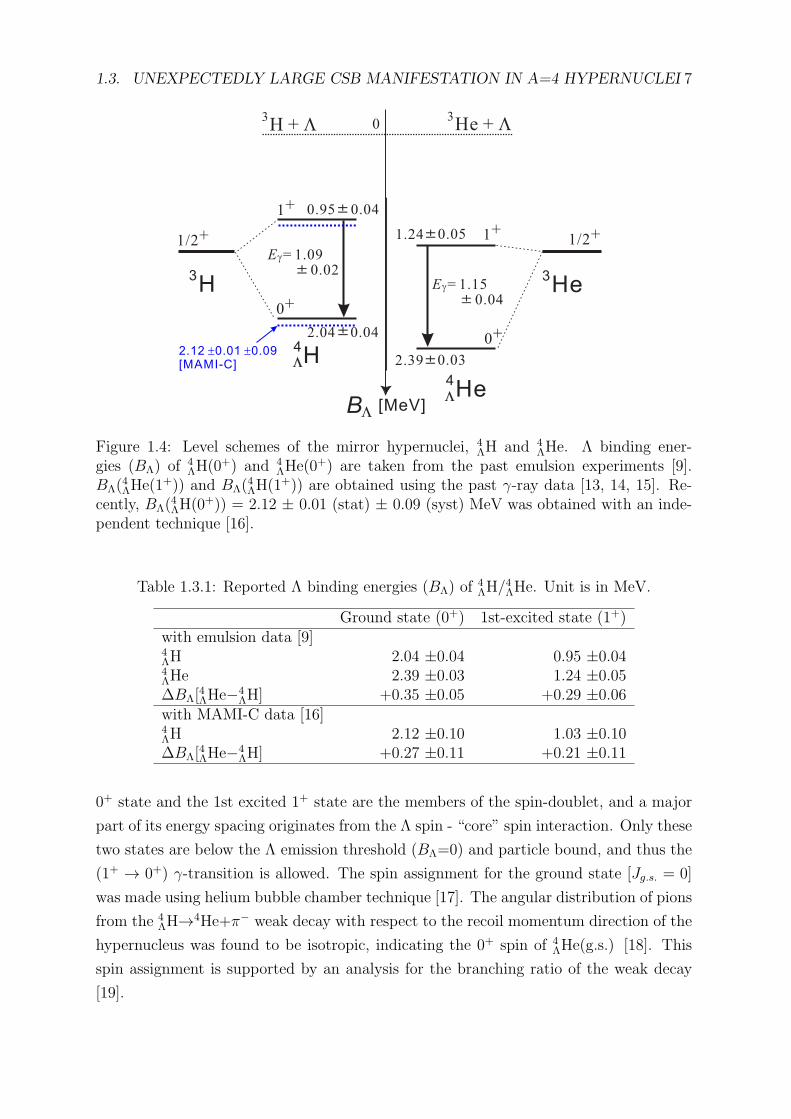
4HeL
Figure 1.5: BΛ(0+) distribution for 4
ΛH (spectrum (A)) and 4ΛHe (spectrum (B)) measured
by emulsion experiments [9]. Reported mean values are BΛ(4ΛH(0
+))=2.04 ± 0.04 MeVand BΛ(
4ΛHe(0
+))=2.39 ± 0.03 MeV.
The BΛ values of the ground state of A≤15 hypernuclei were measured by emulsion
experiments. Old emulsion experiments reported BΛ of the ground states of 4ΛH(0
+) and4ΛHe(0
+) to be 2.04 ± 0.04 MeV and 2.39 ± 0.03 MeV, respectively (see Fig. 1.5) [9].
The BΛ difference was ∆BΛ(0+) = BΛ(
4ΛHe(0
+)) − BΛ(4ΛH(0
+)) = 0.35 ± 0.05 MeV,
indicating a large CSB effect in ΛN interaction. On the other hand, the BΛ values for
the 1+ state were reported to be BΛ(4ΛH(1
+))=0.95 ±0.04 MeV and BΛ(4ΛHe(1
+))=1.24
±0.05 MeV via the measurements of the 1+ → 0+ γ-ray transition (see Appendix A for
a detailed description of these γ-ray measurements). The difference in BΛ(1+) is 0.29 ±
0.06 MeV, which also indicates a large CSB effect. In comparison, the difference in the
excitation energies of the 1+ states (∆Eex=0.06 ±0.05 MeV) was sizable but relatively
small. The reported BΛ values and their differences are summarized in Table 1.3.1.
1.4 Theoretical studies for CSB effect in 4ΛH/4
ΛHe
Theoretical efforts have been made since the 1960s [20] to account for the ∆BΛ(0+)
value, but contemporary quantitative studies all fail to give a ∆BΛ(0+) value larger than
100 keV. For example, a 4-body Y NNN coupled-channel calculation with Y = Λ and Σ
using the widely-accepted baryon-baryon interaction model (NSC97e) was performed by
1.4. THEORETICAL STUDIES FOR CSB EFFECT IN 4ΛH/
4ΛHE 9
A. Nogga in the 2000s. The comparison between this calculation and the experimental
data is summarized in Table 1.4.1. Nogga suggested that there are four components that
are responsible for the CSB energy shift on the 0+ state. These are
• the difference in Σ mass (mΣ) leading to +47-keV CSB energy difference as ∆TCSBMΣ
=
(PΣ+ − PΣ−) · (mΣ− − mΣ+) (this effect is slightly suppressed by a change in the
momentum dependent part of the kinetic energy),
• a contribution of strong CSB Y N interaction originating from the mass differences
of the baryons and mesons and Λ-Σ0 conversion, leading to +44-keV CSB energy
difference,
• a change of Coulomb interaction in pp pairs, leading to −9-keV CSB energy differ-
ence, due to a change in the structure of the ”core” nucleus induced by a hyperon,
• an additional Coulomb interaction between Σ+p and Σ−p pairs leading to −7-keV
CSB energy difference.
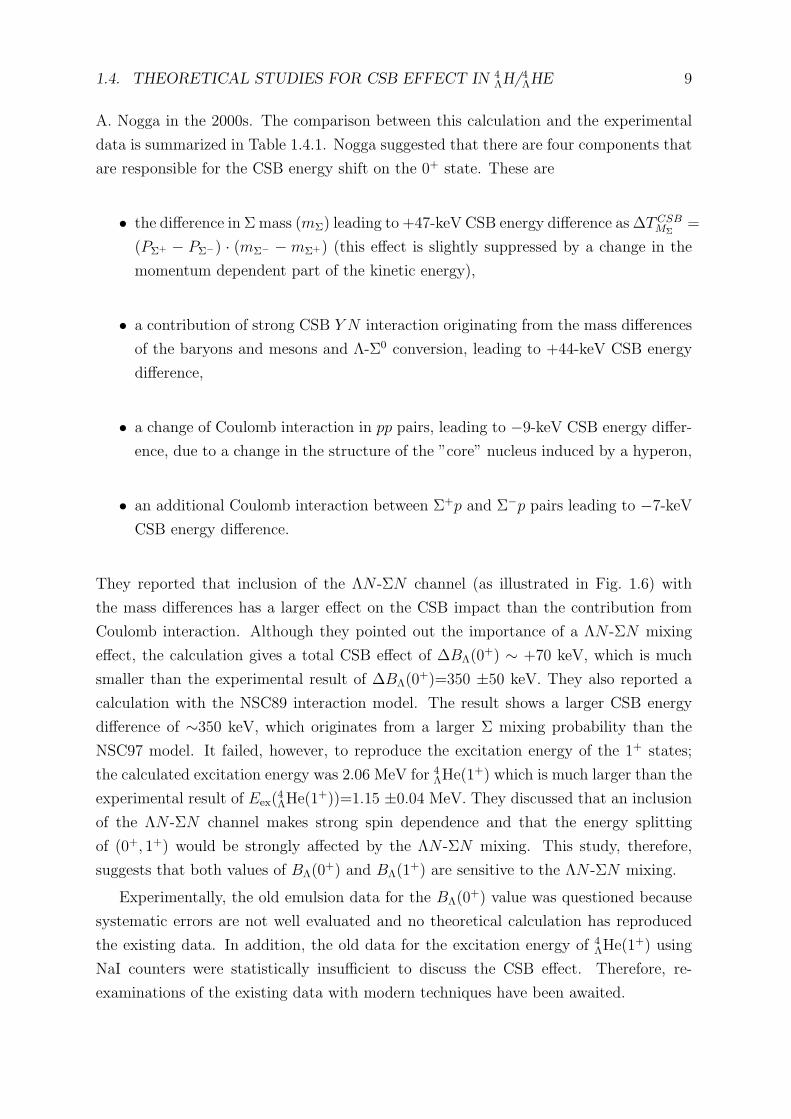
They reported that inclusion of the ΛN -ΣN channel (as illustrated in Fig. 1.6) with
the mass differences has a larger effect on the CSB impact than the contribution from
Coulomb interaction. Although they pointed out the importance of a ΛN -ΣN mixing
effect, the calculation gives a total CSB effect of ∆BΛ(0+) ∼ +70 keV, which is much
smaller than the experimental result of ∆BΛ(0+)=350 ±50 keV. They also reported a
calculation with the NSC89 interaction model. The result shows a larger CSB energy
difference of ∼350 keV, which originates from a larger Σ mixing probability than the
NSC97 model. It failed, however, to reproduce the excitation energy of the 1+ states;
the calculated excitation energy was 2.06 MeV for 4ΛHe(1
+) which is much larger than the
experimental result of Eex(4ΛHe(1
+))=1.15 ±0.04 MeV. They discussed that an inclusion
of the ΛN -ΣN channel makes strong spin dependence and that the energy splitting
of (0+, 1+) would be strongly affected by the ΛN -ΣN mixing. This study, therefore,
suggests that both values of BΛ(0+) and BΛ(1
+) are sensitive to the ΛN -ΣN mixing.
Experimentally, the old emulsion data for the BΛ(0+) value was questioned because
systematic errors are not well evaluated and no theoretical calculation has reproduced
the existing data. In addition, the old data for the excitation energy of 4ΛHe(1
+) using
NaI counters were statistically insufficient to discuss the CSB effect. Therefore, re-
examinations of the existing data with modern techniques have been awaited.
10 CHAPTER 1. INTRODUCTION
p
p
L
L
p
n S+
mass differencein intermediate state
p
n
n
L
L
p
p S-
p
p
p
L
L
S0
p0
L S- 0 mixing
gN Np 0
n
n
L
L
S0
p0
-gN Np 0
Lp interaction Ln interaction
Figure 1.6: Diagrams for the CSB Λ-Σ0 mixing channels (top) and the CSB ΛN -ΣNcoupled channels (bottom).
Table 1.4.1: Comparison between the four-body calculation by A. Nogga [21] (calc. I:with the NSC97e interaction model, calc II: with the NSC89 model) and the experimentaldata. Unit is in MeV.
exp. data calc.I [21] calc.II [21]NSC97e NSC89
Λ binging energyBΛ(
4ΛH(0
+)) 2.04 ±0.04 1.47 1.80BΛ(
4ΛH(1
+)) 0.95 ±0.04 0.73BΛ(
4ΛHe(0
+)) 2.39 ±0.03 1.54 2.14BΛ(
4ΛHe(1
+)) 1.24 ±0.05 0.72excitation energyEex(
4ΛH(1
+)) 1.09 ±0.02 0.74Eex(
4ΛHe(1
+)) 1.15 ±0.04 0.82 2.06∆BΛ = BΛ(
4ΛHe)−BΛ(
4ΛH)
∆BΛ(0+) +0.35 ±0.05 0.07 0.34
∆BΛ(1+) +0.29 ±0.05 −0.01
1.5 Experimental improvement for the measurement
of BΛ(0+)
Recently, MAMI-C group reported an experimental value of BΛ(4ΛH(0
+)) with a new
technique using decay pions [16]. In the experiment, 4ΛH was produced as a hyperfragment
1.5. EXPERIMENTAL IMPROVEMENT FOR THE MEASUREMENT OF BΛ(0+)11
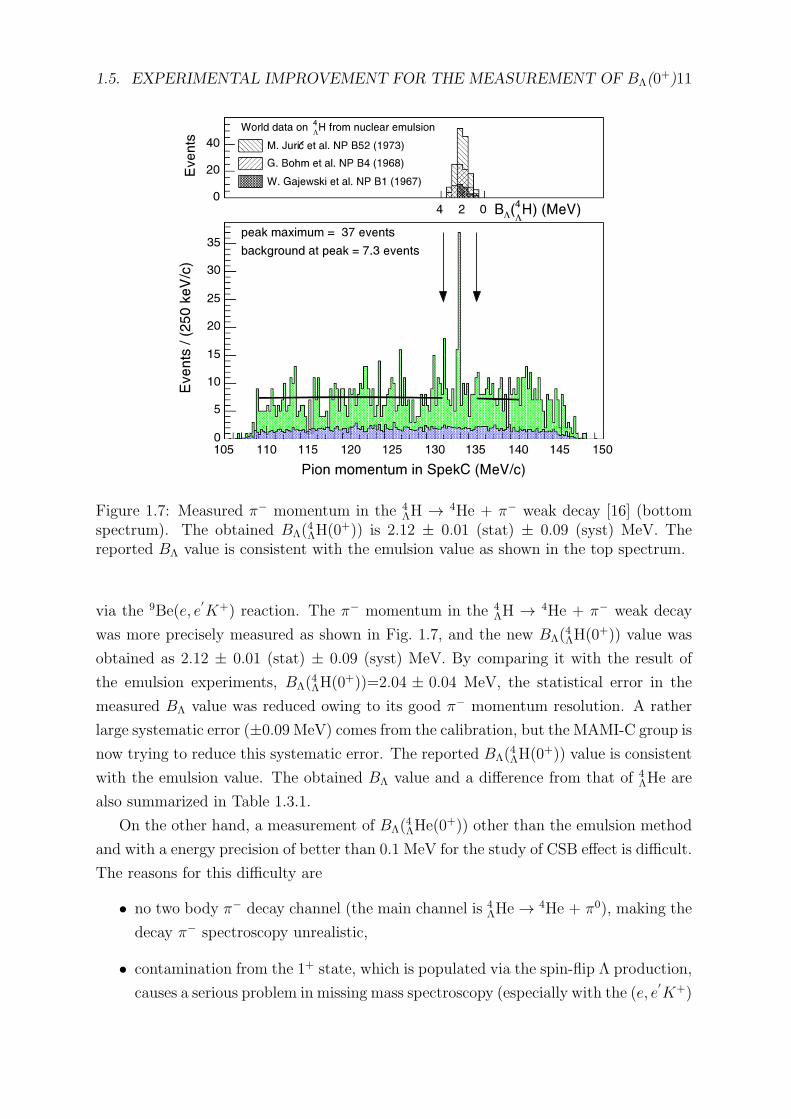
Figure 1.7: Measured π− momentum in the 4ΛH → 4He + π− weak decay [16] (bottom
spectrum). The obtained BΛ(4ΛH(0
+)) is 2.12 ± 0.01 (stat) ± 0.09 (syst) MeV. Thereported BΛ value is consistent with the emulsion value as shown in the top spectrum.
via the 9Be(e, e′K+) reaction. The π− momentum in the 4
ΛH → 4He + π− weak decay
was more precisely measured as shown in Fig. 1.7, and the new BΛ(4ΛH(0
+)) value was
obtained as 2.12 ± 0.01 (stat) ± 0.09 (syst) MeV. By comparing it with the result of
the emulsion experiments, BΛ(4ΛH(0
+))=2.04 ± 0.04 MeV, the statistical error in the
measured BΛ value was reduced owing to its good π− momentum resolution. A rather
large systematic error (±0.09 MeV) comes from the calibration, but the MAMI-C group is
now trying to reduce this systematic error. The reported BΛ(4ΛH(0
+)) value is consistent
with the emulsion value. The obtained BΛ value and a difference from that of 4ΛHe are
also summarized in Table 1.3.1.
On the other hand, a measurement of BΛ(4ΛHe(0
+)) other than the emulsion method
and with a energy precision of better than 0.1 MeV for the study of CSB effect is difficult.
The reasons for this difficulty are
• no two body π− decay channel (the main channel is 4ΛHe → 4He + π0), making the
decay π− spectroscopy unrealistic,
• contamination from the 1+ state, which is populated via the spin-flip Λ production,
causes a serious problem in missing mass spectroscopy (especially with the (e, e′K+)
12 CHAPTER 1. INTRODUCTION
reaction in which the 1+ state is expected to be predominantly populated),
• lack of calibration method in the (K−, π−) or the (π+, K+) reactions without re-
ferring to the emulsion data, because free neutrons are not available as a target.
Because of these difficulties, a precise measurement of BΛ(4ΛHe(0
+)) without using emul-
sion has yet to be realized.
1.6 Old γ-ray spectroscopic experiment of 4ΛH/4
ΛHe
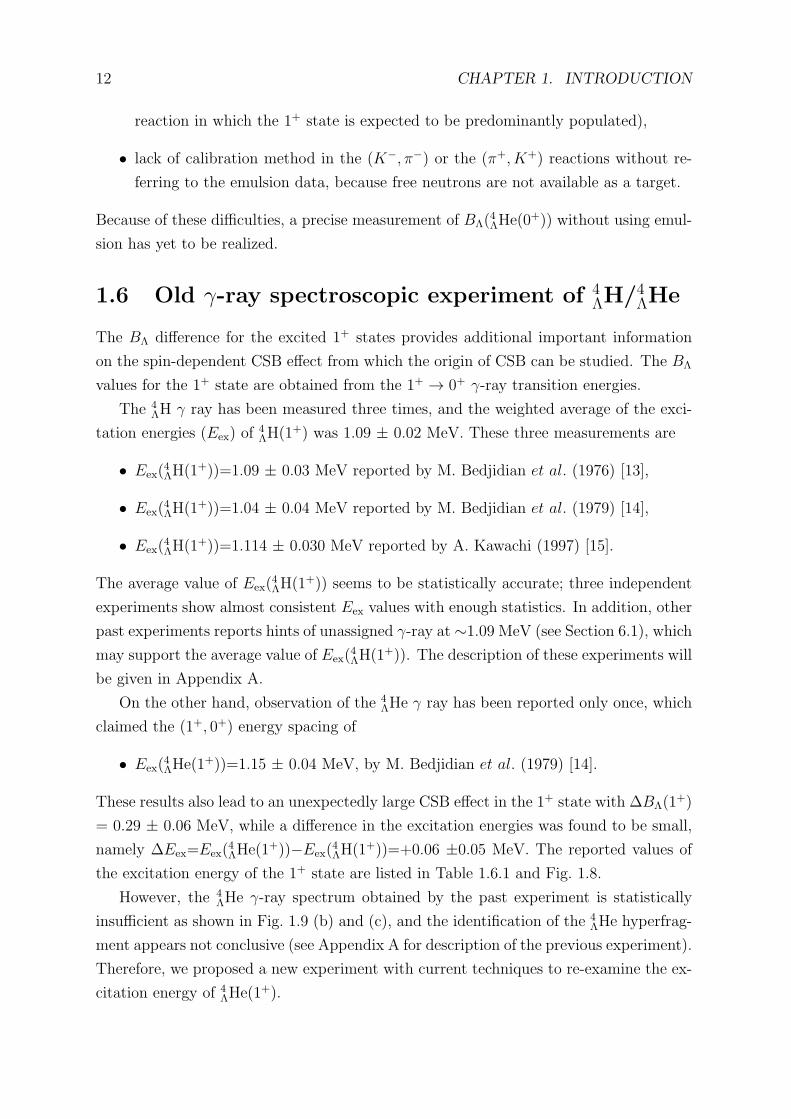
The BΛ difference for the excited 1+ states provides additional important information
on the spin-dependent CSB effect from which the origin of CSB can be studied. The BΛ
values for the 1+ state are obtained from the 1+ → 0+ γ-ray transition energies.
The 4ΛH γ ray has been measured three times, and the weighted average of the exci-
tation energies (Eex) of4ΛH(1
+) was 1.09 ± 0.02 MeV. These three measurements are
• Eex(4ΛH(1
+))=1.09 ± 0.03 MeV reported by M. Bedjidian et al. (1976) [13],
• Eex(4ΛH(1
+))=1.04 ± 0.04 MeV reported by M. Bedjidian et al. (1979) [14],
• Eex(4ΛH(1
+))=1.114 ± 0.030 MeV reported by A. Kawachi (1997) [15].
The average value of Eex(4ΛH(1
+)) seems to be statistically accurate; three independent
experiments show almost consistent Eex values with enough statistics. In addition, other
past experiments reports hints of unassigned γ-ray at ∼1.09 MeV (see Section 6.1), which
may support the average value of Eex(4ΛH(1
+)). The description of these experiments will
be given in Appendix A.
On the other hand, observation of the 4ΛHe γ ray has been reported only once, which
claimed the (1+, 0+) energy spacing of
• Eex(4ΛHe(1
+))=1.15 ± 0.04 MeV, by M. Bedjidian et al. (1979) [14].
These results also lead to an unexpectedly large CSB effect in the 1+ state with ∆BΛ(1+)
= 0.29 ± 0.06 MeV, while a difference in the excitation energies was found to be small,
namely ∆Eex=Eex(4ΛHe(1
+))−Eex(4ΛH(1
+))=+0.06 ±0.05 MeV. The reported values of
the excitation energy of the 1+ state are listed in Table 1.6.1 and Fig. 1.8.
However, the 4ΛHe γ-ray spectrum obtained by the past experiment is statistically
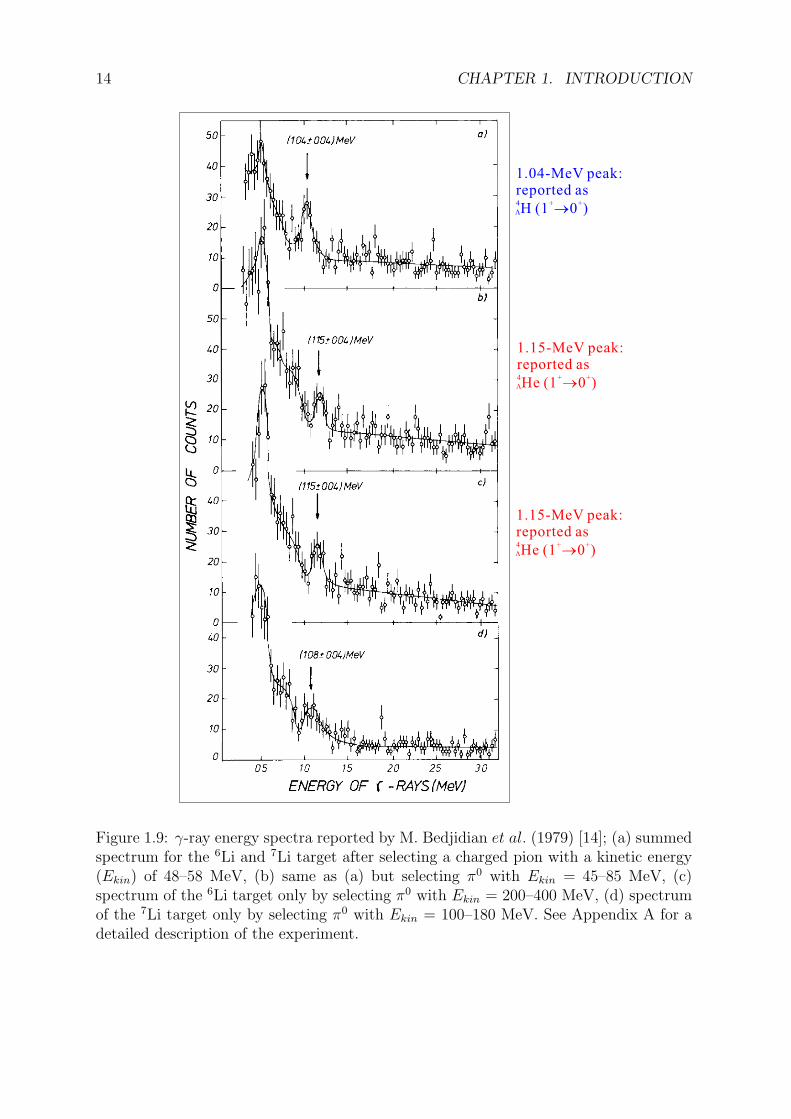
insufficient as shown in Fig. 1.9 (b) and (c), and the identification of the 4ΛHe hyperfrag-
ment appears not conclusive (see Appendix A for description of the previous experiment).
Therefore, we proposed a new experiment with current techniques to re-examine the ex-
citation energy of 4ΛHe(1
+).
1.7. PURPOSE OF THE PRESENT WORK 13
0.95
1
1.05
1.1
1.15
1.2
1.25
Be
djia
ne
t al.
(19
76
)
Be
djia
ne
t al.
(19
79
)
4
HeL
4
HL
Be
dj ia
ne
t al.
(19
79
)
Ka
wa
ch
i(1
99
7)
Average ofthree exp.
( H)4
60 keVdifference
Ee
x(1
) [
Me
V]
+
L
Figure 1.8: Reported excitation energies of 1+ states of 4ΛH/
4ΛHe.
Table 1.6.1: Reported γ-ray energies for 4ΛH/
4ΛHe. Unit is in MeV. A difference in the
averaged energies was ∆Eex=0.06 ± 0.05 MeV.
4ΛH(1
+ → 0+) 4ΛHe(1
+ → 0+)M. Bedjidian et al. (1976) [13] 1.09 ±0.03 -M. Bedjidian et al. (1979) [14] 1.04 ±0.04 1.15 ±0.04A. Kawachi (1997) [15] 1.114 ±0.030 -Weighted average 1.09 ±0.02 1.15 ±0.04
1.7 Purpose of the present work - precise measure-
ment of Eex(4ΛHe(1+))
We performed a γ-ray spectroscopic experiment of 4ΛHe at Japan Proton Accelerator Re-
search Complex (J-PARC) [22, 23, 24]. The single past experiment [14] which measured
the Eex(4ΛHe(1
+)) suffers from problems summarized below,
• insufficient statistical significance of the 1.15-MeV peak (less than 3σ) due to the
energy resolution of the NaI detector [12% (FWHM) at 0.98 MeV] as well as the
Doppler broadening responsible for the 50∼100-keV peak width [25],
• ambiguity in identifying hyperfragments,
14 CHAPTER 1. INTRODUCTION
1.15-MeV peak:reported as4 + +He (1 0 )®L
1.15-MeV peak:reported as4 + +He (1 0 )®L
1.04-MeV peak:reported as4 + +H (1 0 )®L
Figure 1.9: γ-ray energy spectra reported by M. Bedjidian et al. (1979) [14]; (a) summedspectrum for the 6Li and 7Li target after selecting a charged pion with a kinetic energy(Ekin) of 48–58 MeV, (b) same as (a) but selecting π0 with Ekin = 45–85 MeV, (c)spectrum of the 6Li target only by selecting π0 with Ekin = 200–400 MeV, (d) spectrumof the 7Li target only by selecting π0 with Ekin = 100–180 MeV. See Appendix A for adetailed description of the experiment.
1.7. PURPOSE OF THE PRESENT WORK 15
– indirect production as hyperfragments following the stopped K− absorption
on 7Li,
– selection of a kinetic energy of π0 from the 4ΛHe→4He + π0 weak decay by
measuring an opening angle between two γ rays from π0 → γγ,
• difficulty in energy calibration due to a possible gain shift of the NaI detector for
change of crystal temperature.
The present experiment achieved much higher sensitivity with the following features.
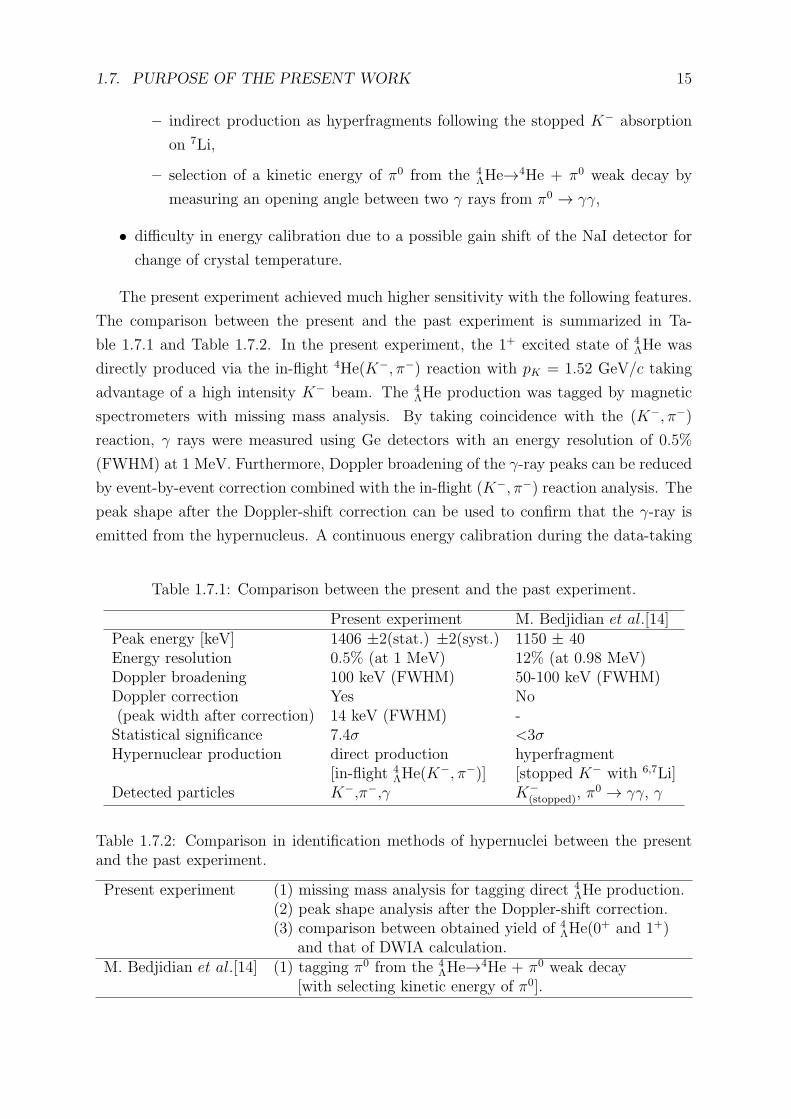
The comparison between the present and the past experiment is summarized in Ta-
ble 1.7.1 and Table 1.7.2. In the present experiment, the 1+ excited state of 4ΛHe was
directly produced via the in-flight 4He(K−, π−) reaction with pK = 1.52 GeV/c taking
advantage of a high intensity K− beam. The 4ΛHe production was tagged by magnetic
spectrometers with missing mass analysis. By taking coincidence with the (K−, π−)
reaction, γ rays were measured using Ge detectors with an energy resolution of 0.5%
(FWHM) at 1 MeV. Furthermore, Doppler broadening of the γ-ray peaks can be reduced
by event-by-event correction combined with the in-flight (K−, π−) reaction analysis. The
peak shape after the Doppler-shift correction can be used to confirm that the γ-ray is
emitted from the hypernucleus. A continuous energy calibration during the data-taking
Table 1.7.1: Comparison between the present and the past experiment.
Present experiment M. Bedjidian et al.[14]Peak energy [keV] 1406 ±2(stat.) ±2(syst.) 1150 ± 40Energy resolution 0.5% (at 1 MeV) 12% (at 0.98 MeV)Doppler broadening 100 keV (FWHM) 50-100 keV (FWHM)Doppler correction Yes No(peak width after correction) 14 keV (FWHM) -Statistical significance 7.4σ <3σHypernuclear production direct production hyperfragment
[in-flight 4ΛHe(K
−, π−)] [stopped K− with 6,7Li]Detected particles K−,π−,γ K−
(stopped), π0 → γγ, γ
Table 1.7.2: Comparison in identification methods of hypernuclei between the presentand the past experiment.
Present experiment (1) missing mass analysis for tagging direct 4ΛHe production.
(2) peak shape analysis after the Doppler-shift correction.(3) comparison between obtained yield of 4
ΛHe(0+ and 1+)
and that of DWIA calculation.M. Bedjidian et al.[14] (1) tagging π0 from the 4
ΛHe→4He + π0 weak decay[with selecting kinetic energy of π0].
16 CHAPTER 1. INTRODUCTION
period can remove problems from gain drifts. Finally, obtained yield of the 4ΛHe(1
+ and
0+) can be used to assign a γ-ray peak by comparing it with the expected yield from a
DWIA calculation [26].
With these experimental advances, the present work succeeded in conclusively mea-
suring the γ-ray transition energy to be 1406 ±2 (stat.) ±2 (syst.) keV, which supersedes
the previously reported energy of 1150 ±40 keV [14] and established the level scheme of4ΛHe.
Chapter 2
Experiment
2.1 Overview of the experiment
A γ-ray spectroscopic experiment (J-PARC E13) was carried out at the K1.8 beam line
in the J-PARC Hadron Experimental Facility [27]. The 4He(K−, π−) reaction was used
to produce 4ΛHe(1
+), which was populated via the spin-flip component of the elementary
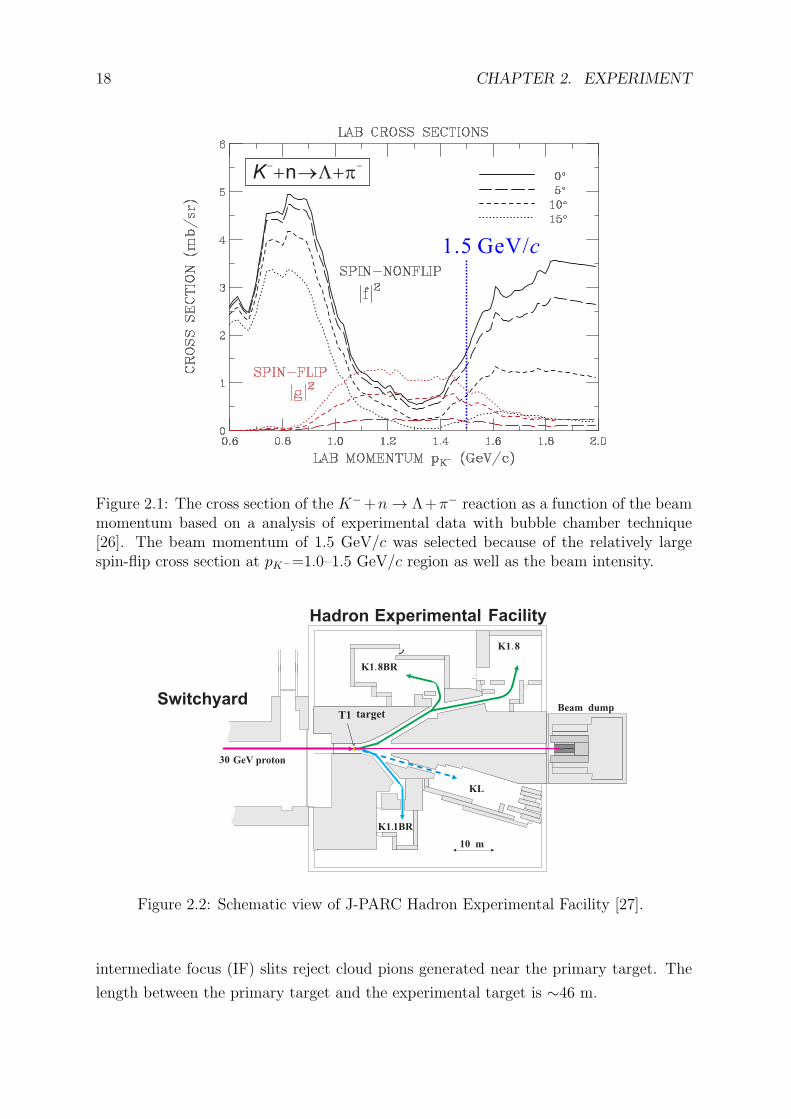
process, K− + n → Λ + π−. A beam momentum of 1.5 GeV/c was chosen considering
the elementary cross section of the spin-flip Λ production (see Fig.2.1) and the available
beam intensity. A 2.8 g/cm2-thick liquid 4He was used as the experimental target.
Incident K− and outgoing π− mesons were particle-identified and momentum-analyzed
by the beam line spectrometer and the Superconducting Kaon Spectrometer (SKS) [28]
(SksMinus setup), respectively. In addition, γ rays were detected by a Ge detector array
(Hyperball-J) surrounding the target. Through a coincidence measurement between
these spectrometer systems and Hyperball-J, γ rays from hypernuclei were measured. In
total, 2.3×10¹⁰ kaons were irradiated to the target during ∼5 days beam time.
2.2 J-PARC K1.8 beam line
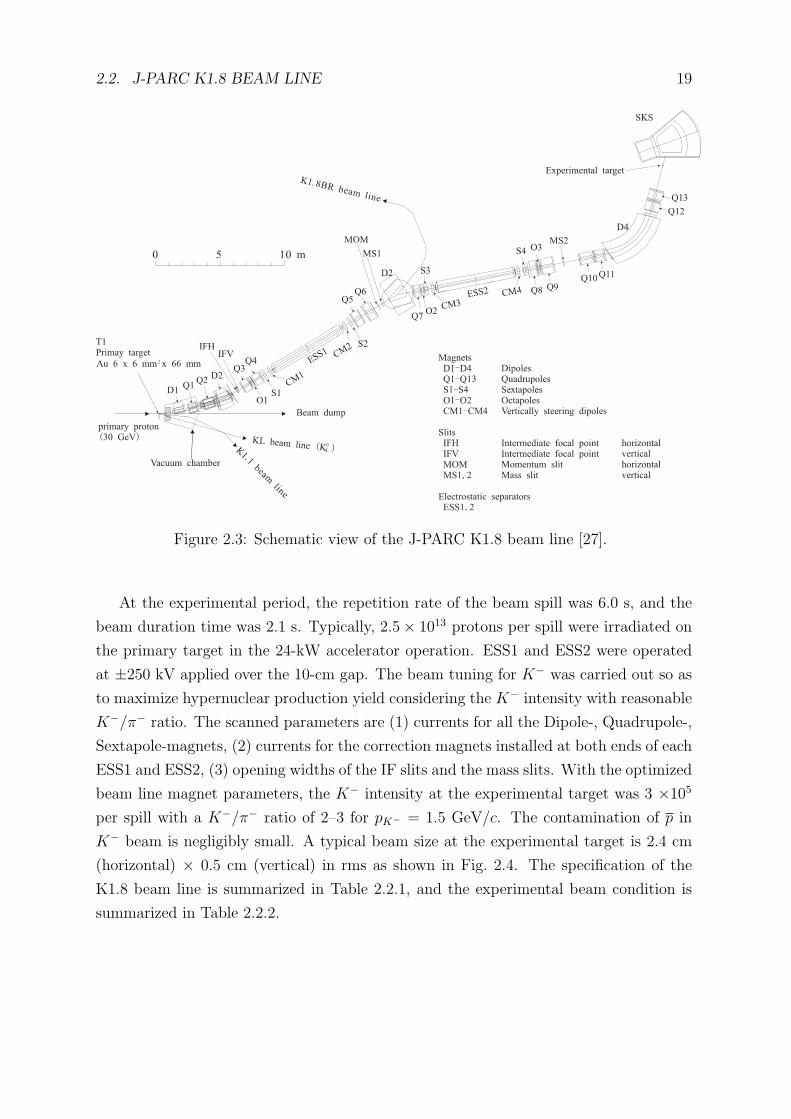
The J-PARC K1.8 beam line was constructed to carry out missing-mass spectroscopy
of hypernuclei both for S = −1 and −2 sectors and exotic hadrons [28]. Secondary
meson beams are produced at a primary target (Au, 66 mm thickness) placed at the
most upstream in Hadron Experimental Facility (see Fig.2.2) by irradiating proton beam
from J-PARC 30-GeV synchrotron. Secondary beams are delivered to the K1.8 beam
line which was designed to provide separated pions and kaons with the momentum up to
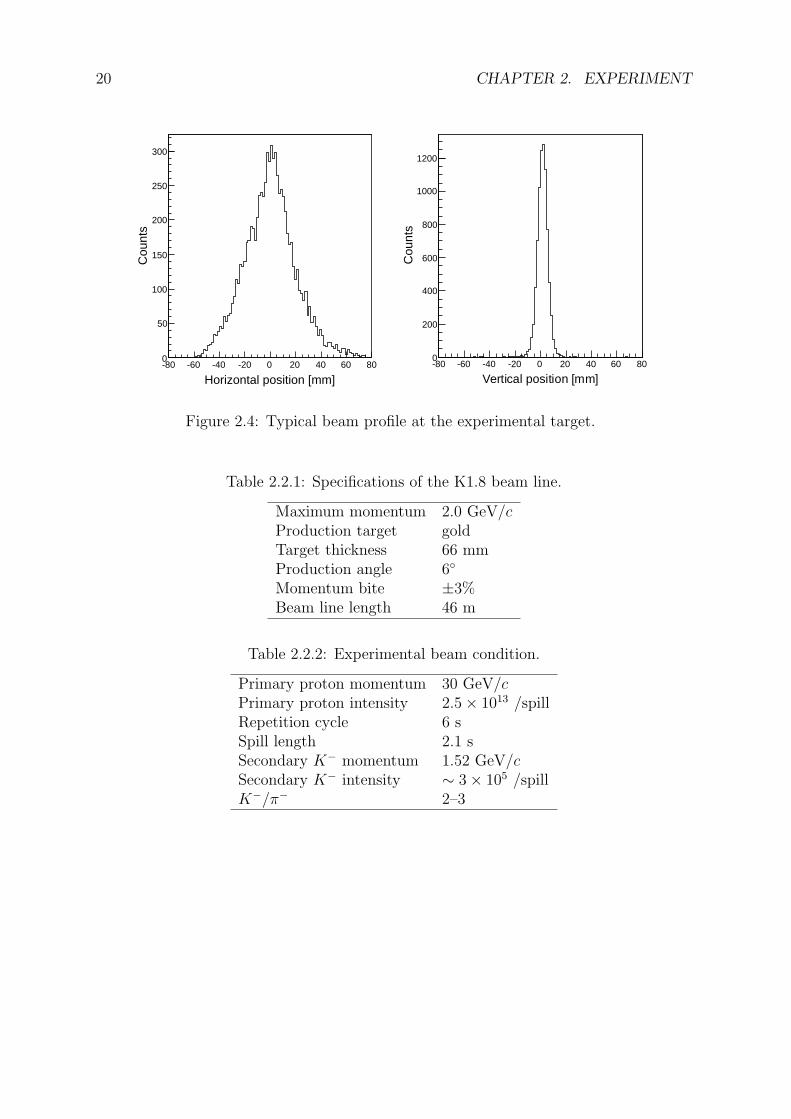
2 GeV/c having ±3% momentum bite. The K1.8 beam line is illustrated in Fig.2.3. For
the kaon beam, good K/π separation with reasonable intensities is realized by removing
pion contamination using two electrostatic separators (ESS1, ESS2) with a length of 6
m each and with mass slits installed at downstream of each separator. Furthermore,
17
18 CHAPTER 2. EXPERIMENT
K- -
+ +n®L p
1.5 GeV/c
Figure 2.1: The cross section of the K−+n → Λ+π− reaction as a function of the beammomentum based on a analysis of experimental data with bubble chamber technique[26]. The beam momentum of 1.5 GeV/c was selected because of the relatively largespin-flip cross section at pK−=1.0–1.5 GeV/c region as well as the beam intensity.
Figure 2.2: Schematic view of J-PARC Hadron Experimental Facility [27].
intermediate focus (IF) slits reject cloud pions generated near the primary target. The
length between the primary target and the experimental target is ∼46 m.
2.2. J-PARC K1.8 BEAM LINE 19
Figure 2.3: Schematic view of the J-PARC K1.8 beam line [27].
At the experimental period, the repetition rate of the beam spill was 6.0 s, and the
beam duration time was 2.1 s. Typically, 2.5× 10¹³ protons per spill were irradiated on
the primary target in the 24-kW accelerator operation. ESS1 and ESS2 were operated
at ±250 kV applied over the 10-cm gap. The beam tuning for K− was carried out so as
to maximize hypernuclear production yield considering the K− intensity with reasonable
K−/π− ratio. The scanned parameters are (1) currents for all the Dipole-, Quadrupole-,
Sextapole-magnets, (2) currents for the correction magnets installed at both ends of each
ESS1 and ESS2, (3) opening widths of the IF slits and the mass slits. With the optimized
beam line magnet parameters, the K− intensity at the experimental target was 3 ×10⁵
per spill with a K−/π− ratio of 2–3 for pK− = 1.5 GeV/c. The contamination of p in
K− beam is negligibly small. A typical beam size at the experimental target is 2.4 cm
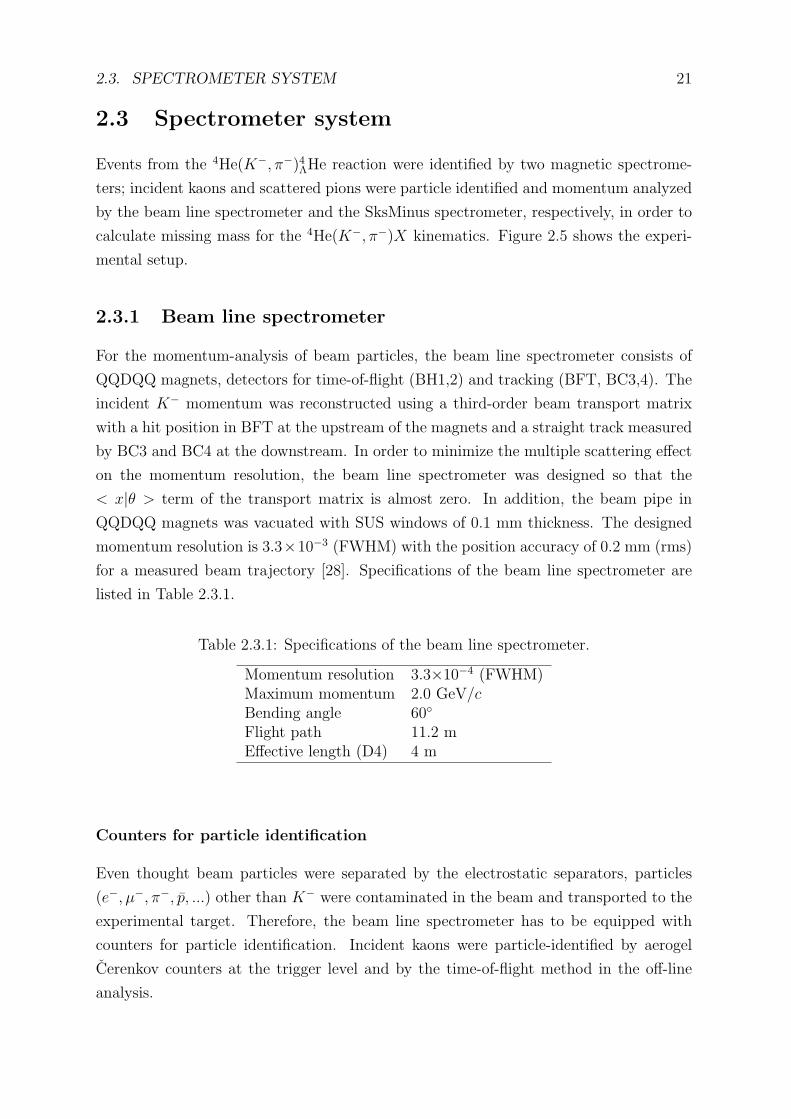
(horizontal) × 0.5 cm (vertical) in rms as shown in Fig. 2.4. The specification of the
K1.8 beam line is summarized in Table 2.2.1, and the experimental beam condition is
summarized in Table 2.2.2.
20 CHAPTER 2. EXPERIMENT
Horizontal position [mm]-80 -60 -40 -20 0 20 40 60 80
Cou
nts
0
50
100
150
200
250
300
Vertical position [mm]-80 -60 -40 -20 0 20 40 60 80
Cou
nts
0
200
400
600
800
1000
1200
Figure 2.4: Typical beam profile at the experimental target.
Table 2.2.1: Specifications of the K1.8 beam line.
Maximum momentum 2.0 GeV/cProduction target goldTarget thickness 66 mmProduction angle 6◦
Momentum bite ±3%Beam line length 46 m
Table 2.2.2: Experimental beam condition.
Primary proton momentum 30 GeV/cPrimary proton intensity 2.5× 10¹³ /spillRepetition cycle 6 sSpill length 2.1 sSecondary K− momentum 1.52 GeV/cSecondary K− intensity ∼ 3× 10⁵ /spillK−/π− 2–3
2.3. SPECTROMETER SYSTEM 21
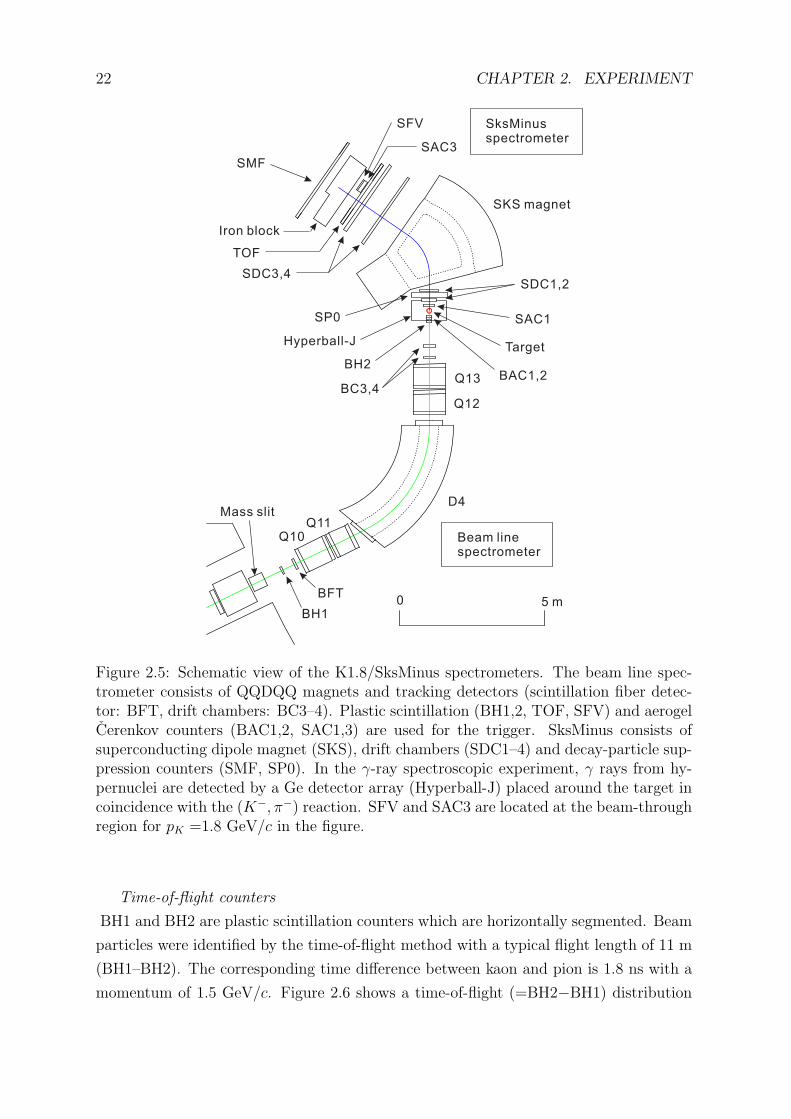
2.3 Spectrometer system
Events from the 4He(K−, π−)4ΛHe reaction were identified by two magnetic spectrome-
ters; incident kaons and scattered pions were particle identified and momentum analyzed
by the beam line spectrometer and the SksMinus spectrometer, respectively, in order to
calculate missing mass for the 4He(K−, π−)X kinematics. Figure 2.5 shows the experi-
mental setup.
2.3.1 Beam line spectrometer
For the momentum-analysis of beam particles, the beam line spectrometer consists of
QQDQQ magnets, detectors for time-of-flight (BH1,2) and tracking (BFT, BC3,4). The
incident K− momentum was reconstructed using a third-order beam transport matrix
with a hit position in BFT at the upstream of the magnets and a straight track measured
by BC3 and BC4 at the downstream. In order to minimize the multiple scattering effect
on the momentum resolution, the beam line spectrometer was designed so that the
< x|θ > term of the transport matrix is almost zero. In addition, the beam pipe in
QQDQQ magnets was vacuated with SUS windows of 0.1 mm thickness. The designed
momentum resolution is 3.3×10⁻³ (FWHM) with the position accuracy of 0.2 mm (rms)
for a measured beam trajectory [28]. Specifications of the beam line spectrometer are
listed in Table 2.3.1.
Table 2.3.1: Specifications of the beam line spectrometer.
Momentum resolution 3.3×10⁻⁴ (FWHM)Maximum momentum 2.0 GeV/cBending angle 60◦
Flight path 11.2 mEffective length (D4) 4 m
Counters for particle identification
Even thought beam particles were separated by the electrostatic separators, particles
(e−, µ−, π−, p, ...) other than K− were contaminated in the beam and transported to the
experimental target. Therefore, the beam line spectrometer has to be equipped with
counters for particle identification. Incident kaons were particle-identified by aerogel
Cerenkov counters at the trigger level and by the time-of-flight method in the off-line
analysis.
22 CHAPTER 2. EXPERIMENT
BH1
Mass slit
Beam linespectrometer
0 5 mBFT
D4
Q12
Q13BC3,4
Q10Q11
BH2
SksMinusspectrometer
SKS magnet
BAC1,2
SAC1
TargetHyperball-J
SDC1,2
SP0
TOF
SDC3,4
SFV
SAC3
Iron block
SMF
Figure 2.5: Schematic view of the K1.8/SksMinus spectrometers. The beam line spec-trometer consists of QQDQQ magnets and tracking detectors (scintillation fiber detec-tor: BFT, drift chambers: BC3–4). Plastic scintillation (BH1,2, TOF, SFV) and aerogelCerenkov counters (BAC1,2, SAC1,3) are used for the trigger. SksMinus consists ofsuperconducting dipole magnet (SKS), drift chambers (SDC1–4) and decay-particle sup-pression counters (SMF, SP0). In the γ-ray spectroscopic experiment, γ rays from hy-pernuclei are detected by a Ge detector array (Hyperball-J) placed around the target incoincidence with the (K−, π−) reaction. SFV and SAC3 are located at the beam-throughregion for pK =1.8 GeV/c in the figure.
Time-of-flight counters
BH1 and BH2 are plastic scintillation counters which are horizontally segmented. Beam
particles were identified by the time-of-flight method with a typical flight length of 11 m
(BH1–BH2). The corresponding time difference between kaon and pion is 1.8 ns with a
momentum of 1.5 GeV/c. Figure 2.6 shows a time-of-flight (=BH2−BH1) distribution
2.3. SPECTROMETER SYSTEM 23
Co
un
ts /
20
ps
0
500
1000
1500
Time-of-flight [ns]
-1 0 1 2 3
K-
p-
BH2 trig.
BH2 BAC trig.´
Figure 2.6: A time-of-flight (=BH2−BH1) distribution with a typical beam condition.Black and red lines show the distributions with the BH2 trigger and the BH2×BAC1×BAC2 trigger, respectively.
with a typical beam condition. The time-of-flight resolution is 155 ps (rms) for the
K− peak. BH2 is used as a timing reference counter for all other detectors. For BH2,
photomultiplier tubes (PMTs) are mounted only on the bottom side in order to avoid
interference with the cryogenic system of the liquid He target. Specifications of these
counters are listed in Table 2.3.2.
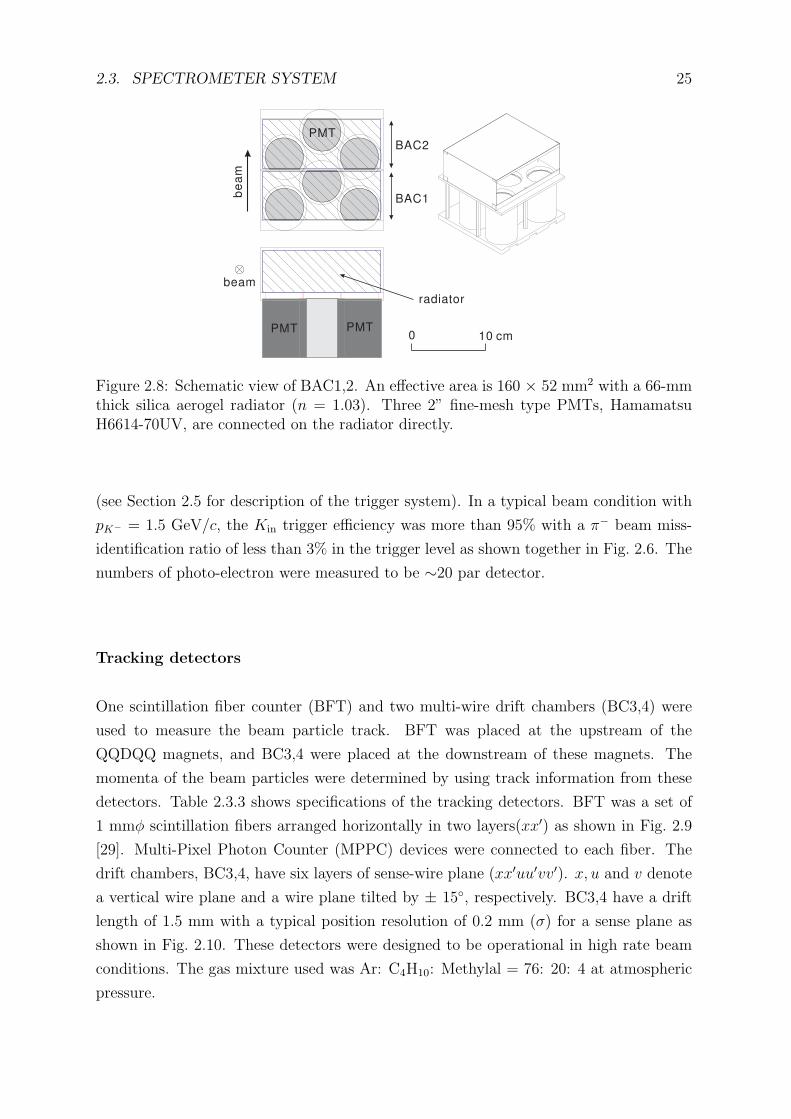
Aerogel Cerenkov counters
Threshold-type aerogel Cerenkov counters (BAC1 and BAC2) were installed at the
upstream of the experimental target. These counters are placed as close to the target as
possible to minimize contamination from beamK− decay events in the trigger. Figure 2.7
shows the refractive index threshold for Cerenkov radiation as a function of momentum.
The refractive index was chosen to be 1.03, corresponding to the threshold momentum
of 0.6 GeV/c for pions and 2.0 GeV/c for kaons. Figure 2.8 shows a schematic view of
BAC1,2. BACs cover 160 × 52 mm2 area with a 66-mm thick silica aerogel radiator,
of which length was optimized. Polytetrafluoroethylene (CF2)n was chosen as an inner
diffused-type reflector. For BACs, three 2” fine-mesh type PMTs, Hamamatsu H6614-
70UV, were connected to the radiator directly. By summing up analog signals from PMTs
before discriminators, K/π separation was improved. Two counters (BAC1 and BAC2)
were used because beam pions that were miss-identified as kaons directly increase the
trigger rate. The beam K− trigger (“Kin trigger”) was defined as BH2×BAC1× BAC2
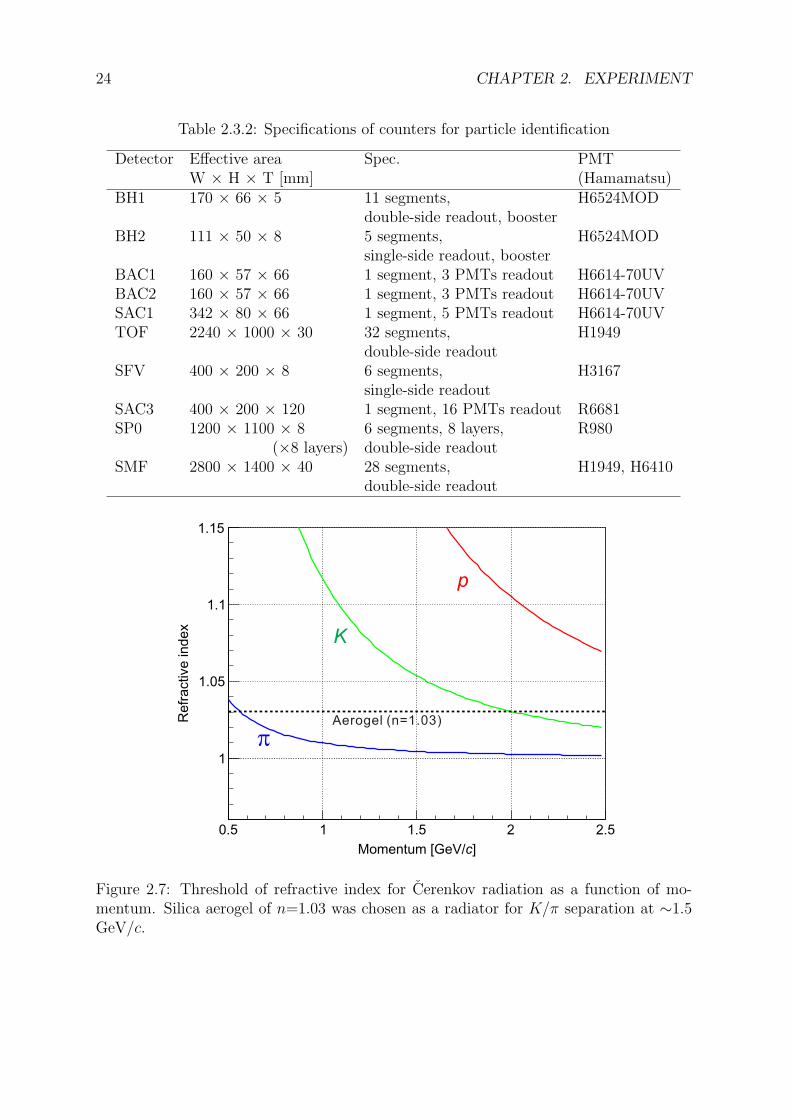
24 CHAPTER 2. EXPERIMENT
Table 2.3.2: Specifications of counters for particle identification
Detector Effective area Spec. PMTW × H × T [mm] (Hamamatsu)
BH1 170 × 66 × 5 11 segments, H6524MODdouble-side readout, booster
BH2 111 × 50 × 8 5 segments, H6524MODsingle-side readout, booster
BAC1 160 × 57 × 66 1 segment, 3 PMTs readout H6614-70UVBAC2 160 × 57 × 66 1 segment, 3 PMTs readout H6614-70UVSAC1 342 × 80 × 66 1 segment, 5 PMTs readout H6614-70UVTOF 2240 × 1000 × 30 32 segments, H1949
double-side readoutSFV 400 × 200 × 8 6 segments, H3167
single-side readoutSAC3 400 × 200 × 120 1 segment, 16 PMTs readout R6681SP0 1200 × 1100 × 8 6 segments, 8 layers, R980
(×8 layers) double-side readoutSMF 2800 × 1400 × 40 28 segments, H1949, H6410
double-side readout
Momentum [GeV/ ]c
0.5 1 1.5 2 2.5
Ref
index
ractive
1
1.05
1.1
1.15
Aerogel (n=1.03)
p
K
p
Figure 2.7: Threshold of refractive index for Cerenkov radiation as a function of mo-mentum. Silica aerogel of n=1.03 was chosen as a radiator for K/π separation at ∼1.5GeV/c.
2.3. SPECTROMETER SYSTEM 25
10 cm0
be
am
beam
radiator
PMT
BAC1
BAC2
PMT
PMT
Figure 2.8: Schematic view of BAC1,2. An effective area is 160 × 52 mm2 with a 66-mmthick silica aerogel radiator (n = 1.03). Three 2” fine-mesh type PMTs, HamamatsuH6614-70UV, are connected on the radiator directly.
(see Section 2.5 for description of the trigger system). In a typical beam condition with
pK− = 1.5 GeV/c, the Kin trigger efficiency was more than 95% with a π− beam miss-
identification ratio of less than 3% in the trigger level as shown together in Fig. 2.6. The
numbers of photo-electron were measured to be ∼20 par detector.
Tracking detectors
One scintillation fiber counter (BFT) and two multi-wire drift chambers (BC3,4) were
used to measure the beam particle track. BFT was placed at the upstream of the
QQDQQ magnets, and BC3,4 were placed at the downstream of these magnets. The
momenta of the beam particles were determined by using track information from these
detectors. Table 2.3.3 shows specifications of the tracking detectors. BFT was a set of
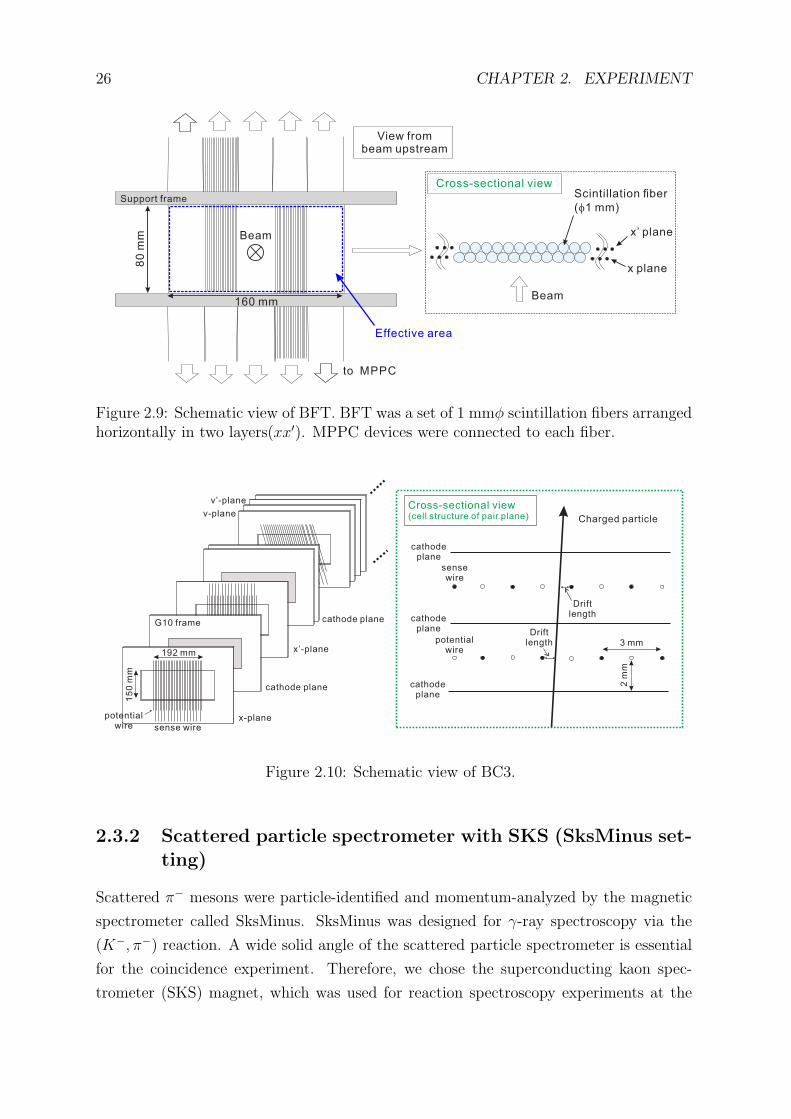
1 mmϕ scintillation fibers arranged horizontally in two layers(xx′) as shown in Fig. 2.9
[29]. Multi-Pixel Photon Counter (MPPC) devices were connected to each fiber. The
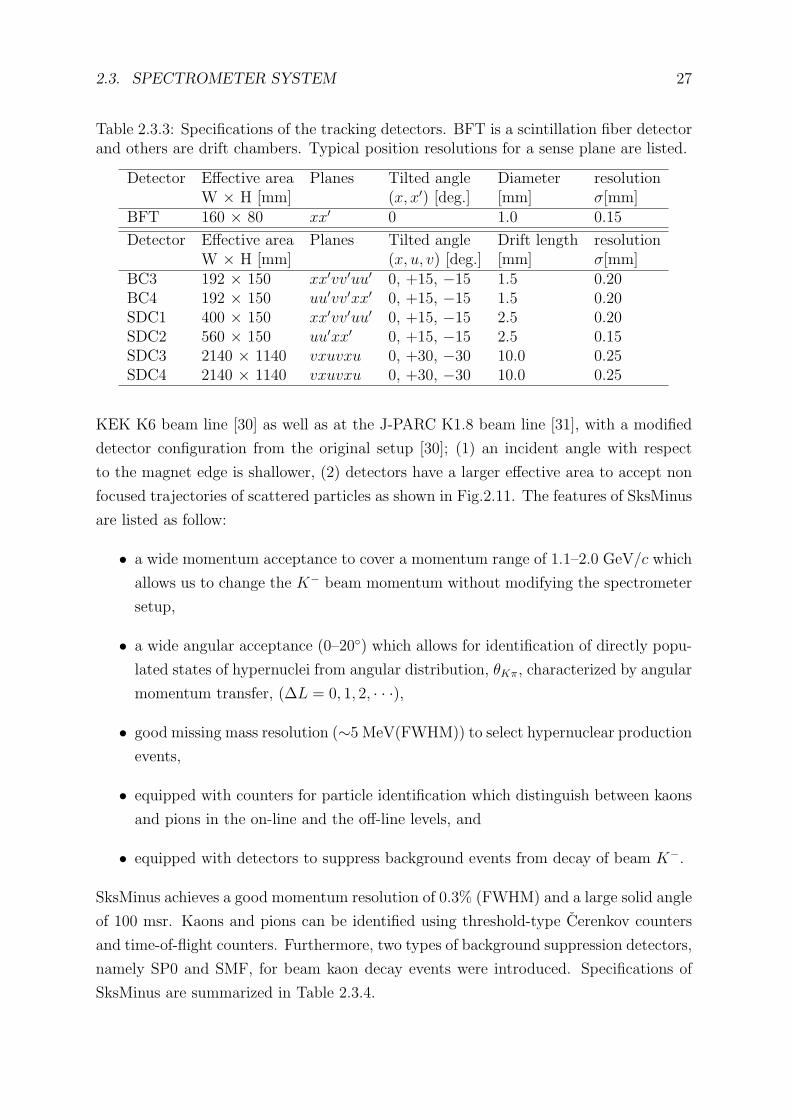
drift chambers, BC3,4, have six layers of sense-wire plane (xx′uu′vv′). x, u and v denote
a vertical wire plane and a wire plane tilted by ± 15◦, respectively. BC3,4 have a drift
length of 1.5 mm with a typical position resolution of 0.2 mm (σ) for a sense plane as
shown in Fig. 2.10. These detectors were designed to be operational in high rate beam
conditions. The gas mixture used was Ar: C4H10: Methylal = 76: 20: 4 at atmospheric
pressure.
26 CHAPTER 2. EXPERIMENT
to MPPC
80
mm
Support frame
Beam
160 mm
Effective area
Beam
x plane
x’ plane
Scintillation fiber
( 1 mm)f
View frombeam upstream
Cross-sectional view
Figure 2.9: Schematic view of BFT. BFT was a set of 1 mmϕ scintillation fibers arrangedhorizontally in two layers(xx′). MPPC devices were connected to each fiber.
sense wire
192 mm
15
0 m
m
potentialwire
G10 frame
x-plane
cathode plane
x’-plane
cathode plane
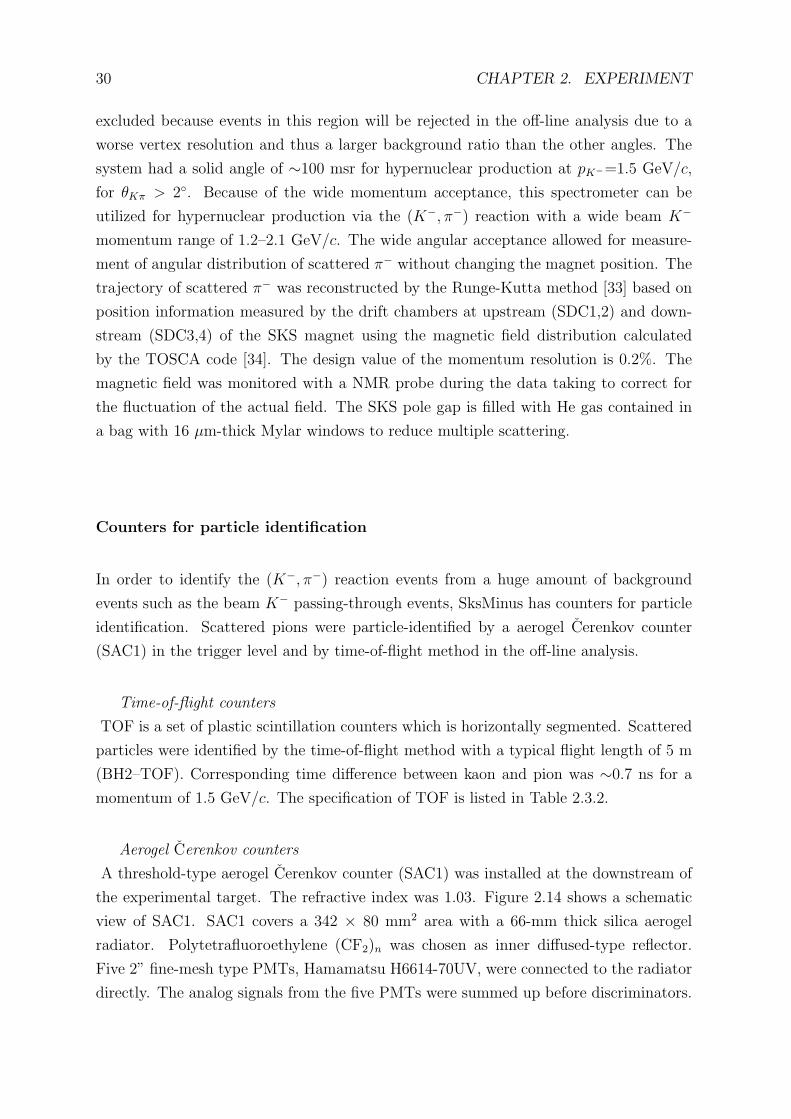
v’-plane
v-plane
cathodeplane
3 mm
2 m
m
sensewire
potentialwire
Charged particle
Driftlength
Driftlength
Cross-sectional view(cell structure of pair plane)
cathodeplane
cathodeplane
Figure 2.10: Schematic view of BC3.
2.3.2 Scattered particle spectrometer with SKS (SksMinus set-ting)
Scattered π− mesons were particle-identified and momentum-analyzed by the magnetic
spectrometer called SksMinus. SksMinus was designed for γ-ray spectroscopy via the
(K−, π−) reaction. A wide solid angle of the scattered particle spectrometer is essential
for the coincidence experiment. Therefore, we chose the superconducting kaon spec-
trometer (SKS) magnet, which was used for reaction spectroscopy experiments at the
2.3. SPECTROMETER SYSTEM 27
Table 2.3.3: Specifications of the tracking detectors. BFT is a scintillation fiber detectorand others are drift chambers. Typical position resolutions for a sense plane are listed.
Detector Effective area Planes Tilted angle Diameter resolutionW × H [mm] (x, x′) [deg.] [mm] σ[mm]
BFT 160 × 80 xx′ 0 1.0 0.15
Detector Effective area Planes Tilted angle Drift length resolutionW × H [mm] (x, u, v) [deg.] [mm] σ[mm]
BC3 192 × 150 xx′vv′uu′ 0, +15, −15 1.5 0.20BC4 192 × 150 uu′vv′xx′ 0, +15, −15 1.5 0.20SDC1 400 × 150 xx′vv′uu′ 0, +15, −15 2.5 0.20SDC2 560 × 150 uu′xx′ 0, +15, −15 2.5 0.15SDC3 2140 × 1140 vxuvxu 0, +30, −30 10.0 0.25SDC4 2140 × 1140 vxuvxu 0, +30, −30 10.0 0.25
KEK K6 beam line [30] as well as at the J-PARC K1.8 beam line [31], with a modified
detector configuration from the original setup [30]; (1) an incident angle with respect
to the magnet edge is shallower, (2) detectors have a larger effective area to accept non
focused trajectories of scattered particles as shown in Fig.2.11. The features of SksMinus
are listed as follow:
• a wide momentum acceptance to cover a momentum range of 1.1–2.0 GeV/c which
allows us to change the K− beam momentum without modifying the spectrometer
setup,
• a wide angular acceptance (0–20◦) which allows for identification of directly popu-
lated states of hypernuclei from angular distribution, θKπ, characterized by angular
momentum transfer, (∆L = 0, 1, 2, · · ·),
• good missing mass resolution (∼5 MeV(FWHM)) to select hypernuclear production
events,
• equipped with counters for particle identification which distinguish between kaons
and pions in the on-line and the off-line levels, and
• equipped with detectors to suppress background events from decay of beam K−.
SksMinus achieves a good momentum resolution of 0.3% (FWHM) and a large solid angle
of 100 msr. Kaons and pions can be identified using threshold-type Cerenkov counters
and time-of-flight counters. Furthermore, two types of background suppression detectors,
namely SP0 and SMF, for beam kaon decay events were introduced. Specifications of
SksMinus are summarized in Table 2.3.4.
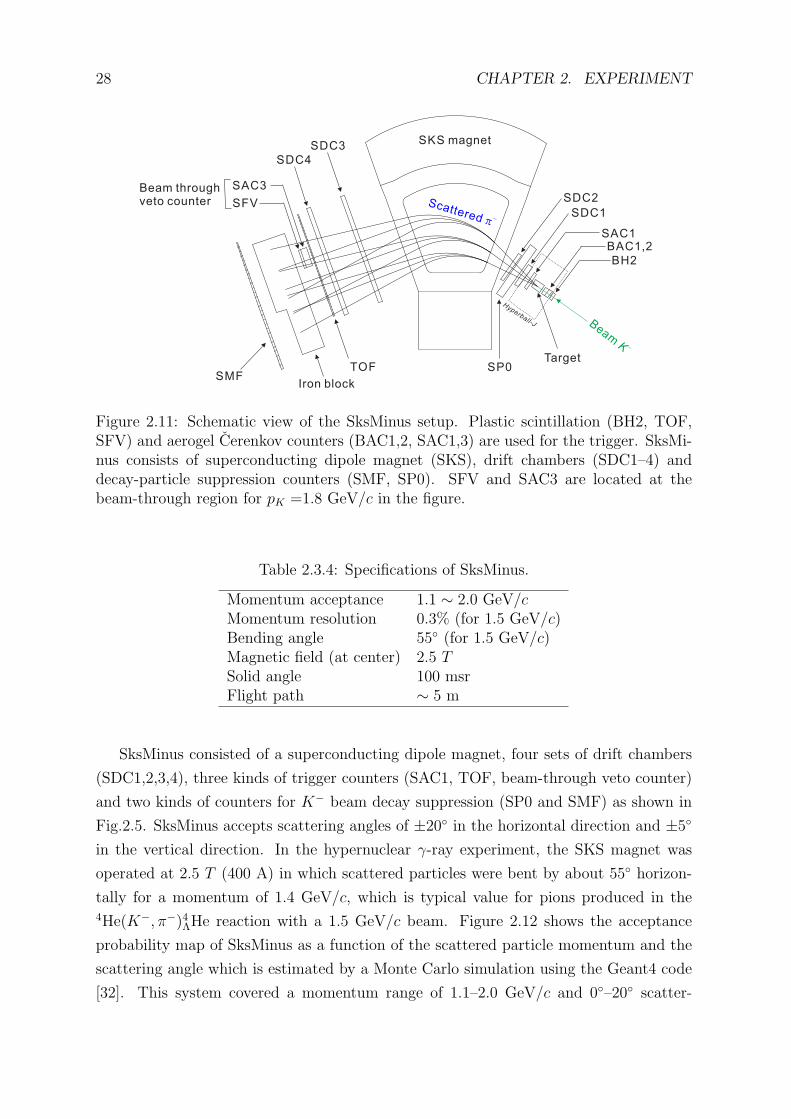
28 CHAPTER 2. EXPERIMENT
SKS magnetSDC3
SDC4
SAC3
SFV
Beam throughveto counter
TOF
Iron blockSMF
SDC2
SDC1
TargetSP0
SAC1BAC1,2
BH2
Hyperball-J BeamK -
Scatteredp
-
Figure 2.11: Schematic view of the SksMinus setup. Plastic scintillation (BH2, TOF,SFV) and aerogel Cerenkov counters (BAC1,2, SAC1,3) are used for the trigger. SksMi-nus consists of superconducting dipole magnet (SKS), drift chambers (SDC1–4) anddecay-particle suppression counters (SMF, SP0). SFV and SAC3 are located at thebeam-through region for pK =1.8 GeV/c in the figure.
Table 2.3.4: Specifications of SksMinus.
Momentum acceptance 1.1 ∼ 2.0 GeV/cMomentum resolution 0.3% (for 1.5 GeV/c)Bending angle 55◦ (for 1.5 GeV/c)Magnetic field (at center) 2.5 TSolid angle 100 msrFlight path ∼ 5 m
SksMinus consisted of a superconducting dipole magnet, four sets of drift chambers
(SDC1,2,3,4), three kinds of trigger counters (SAC1, TOF, beam-through veto counter)
and two kinds of counters for K− beam decay suppression (SP0 and SMF) as shown in
Fig.2.5. SksMinus accepts scattering angles of ±20◦ in the horizontal direction and ±5◦
in the vertical direction. In the hypernuclear γ-ray experiment, the SKS magnet was
operated at 2.5 T (400 A) in which scattered particles were bent by about 55◦ horizon-
tally for a momentum of 1.4 GeV/c, which is typical value for pions produced in the4He(K−, π−)4ΛHe reaction with a 1.5 GeV/c beam. Figure 2.12 shows the acceptance
probability map of SksMinus as a function of the scattered particle momentum and the
scattering angle which is estimated by a Monte Carlo simulation using the Geant4 code
[32]. This system covered a momentum range of 1.1–2.0 GeV/c and 0◦–20◦ scatter-
2.3. SPECTROMETER SYSTEM 29
[deg.]Scat.θ0 5 10 15 20 25
[MeV
/c]
Sca
t.p
1000
1200
1400
1600
1800
0
0.1
0.2
0.3
0.4
0.5
0.6
0.7
0.8
0.9
1
Figure 2.12: Accept probability map of the SksMinus as a function of the scatteringangle (θKπ) and the momentum (pscat.) of scattering particles. The spectrometer has aangular acceptance of 0◦–20◦ and a momentum acceptance of 1.1–2.0 GeV/c.
Momentum [GeV/c]1 1.5 2 2.5 3
Acc
epta
nce
[m
sr]
0
20
40
60
80
100
120
= 2~25 deg.πKθ
= 2~8 deg.πKθ
Figure 2.13: Solid angle of the SksMinus for the hypernuclear production kinematics asa function of the beam momentum, shown for all scattering angles (black solid line) andforward angles (red dotted line).
ing angles. Figure 2.13 shows the solid angle of SksMinus for hypernuclear production
kinematics as a function of the beam momentum; the forward angles less than 2◦ were
30 CHAPTER 2. EXPERIMENT
excluded because events in this region will be rejected in the off-line analysis due to a
worse vertex resolution and thus a larger background ratio than the other angles. The
system had a solid angle of ∼100 msr for hypernuclear production at pK−=1.5 GeV/c,
for θKπ > 2◦. Because of the wide momentum acceptance, this spectrometer can be
utilized for hypernuclear production via the (K−, π−) reaction with a wide beam K−
momentum range of 1.2–2.1 GeV/c. The wide angular acceptance allowed for measure-
ment of angular distribution of scattered π− without changing the magnet position. The
trajectory of scattered π− was reconstructed by the Runge-Kutta method [33] based on
position information measured by the drift chambers at upstream (SDC1,2) and down-
stream (SDC3,4) of the SKS magnet using the magnetic field distribution calculated
by the TOSCA code [34]. The design value of the momentum resolution is 0.2%. The
magnetic field was monitored with a NMR probe during the data taking to correct for
the fluctuation of the actual field. The SKS pole gap is filled with He gas contained in
a bag with 16 µm-thick Mylar windows to reduce multiple scattering.
Counters for particle identification
In order to identify the (K−, π−) reaction events from a huge amount of background
events such as the beam K− passing-through events, SksMinus has counters for particle
identification. Scattered pions were particle-identified by a aerogel Cerenkov counter
(SAC1) in the trigger level and by time-of-flight method in the off-line analysis.
Time-of-flight counters
TOF is a set of plastic scintillation counters which is horizontally segmented. Scattered
particles were identified by the time-of-flight method with a typical flight length of 5 m
(BH2–TOF). Corresponding time difference between kaon and pion was ∼0.7 ns for a
momentum of 1.5 GeV/c. The specification of TOF is listed in Table 2.3.2.
Aerogel Cerenkov counters
A threshold-type aerogel Cerenkov counter (SAC1) was installed at the downstream of
the experimental target. The refractive index was 1.03. Figure 2.14 shows a schematic
view of SAC1. SAC1 covers a 342 × 80 mm2 area with a 66-mm thick silica aerogel
radiator. Polytetrafluoroethylene (CF2)n was chosen as inner diffused-type reflector.
Five 2” fine-mesh type PMTs, Hamamatsu H6614-70UV, were connected to the radiator
directly. The analog signals from the five PMTs were summed up before discriminators.
2.3. SPECTROMETER SYSTEM 31
0 10 cm
Be
am
Beam
radiator
PMT
PMT
Figure 2.14: Schematic view of SAC1. An effective area was 342 × 80 mm2 with a 66-mm thick silica aerogel radiator (n = 1.03). Five 2” fine-mesh type PMTs, HamamatsuH6614-70UV, were connected on the radiator directly.
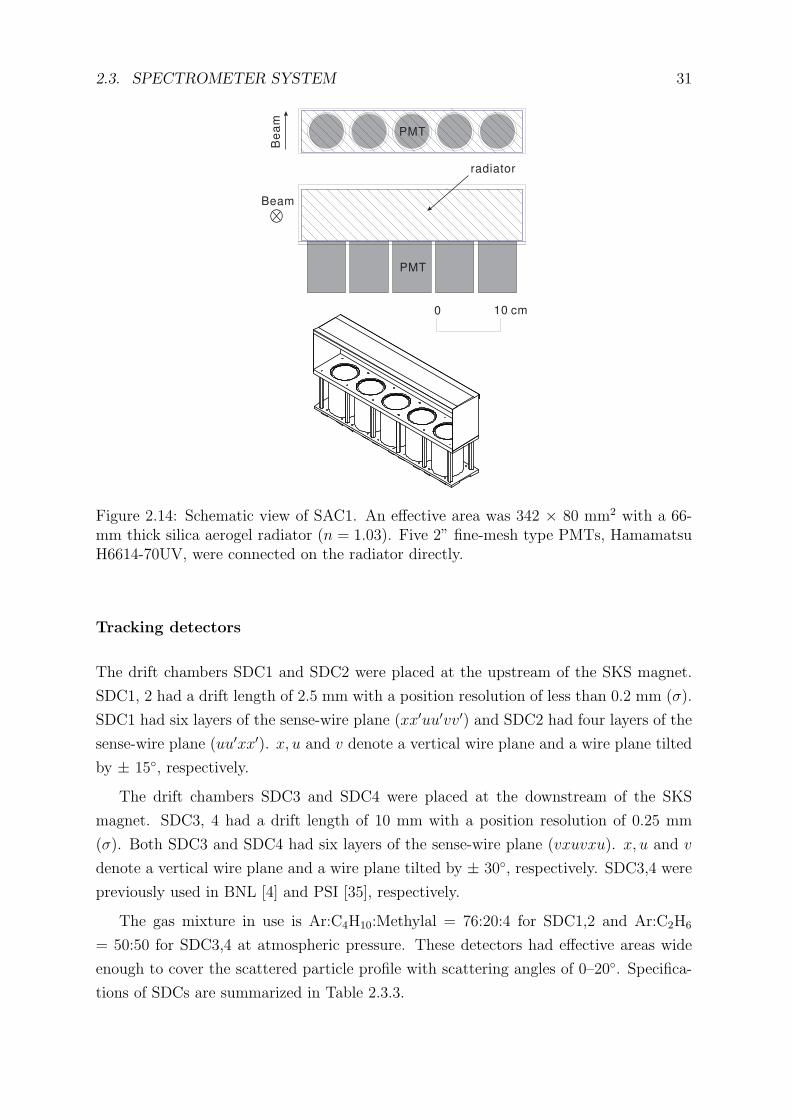
Tracking detectors
The drift chambers SDC1 and SDC2 were placed at the upstream of the SKS magnet.
SDC1, 2 had a drift length of 2.5 mm with a position resolution of less than 0.2 mm (σ).
SDC1 had six layers of the sense-wire plane (xx′uu′vv′) and SDC2 had four layers of the
sense-wire plane (uu′xx′). x, u and v denote a vertical wire plane and a wire plane tilted
by ± 15◦, respectively.
The drift chambers SDC3 and SDC4 were placed at the downstream of the SKS
magnet. SDC3, 4 had a drift length of 10 mm with a position resolution of 0.25 mm
(σ). Both SDC3 and SDC4 had six layers of the sense-wire plane (vxuvxu). x, u and v
denote a vertical wire plane and a wire plane tilted by ± 30◦, respectively. SDC3,4 were
previously used in BNL [4] and PSI [35], respectively.
The gas mixture in use is Ar:C4H10:Methylal = 76:20:4 for SDC1,2 and Ar:C2H6
= 50:50 for SDC3,4 at atmospheric pressure. These detectors had effective areas wide
enough to cover the scattered particle profile with scattering angles of 0–20◦. Specifica-
tions of SDCs are summarized in Table 2.3.3.
32 CHAPTER 2. EXPERIMENT
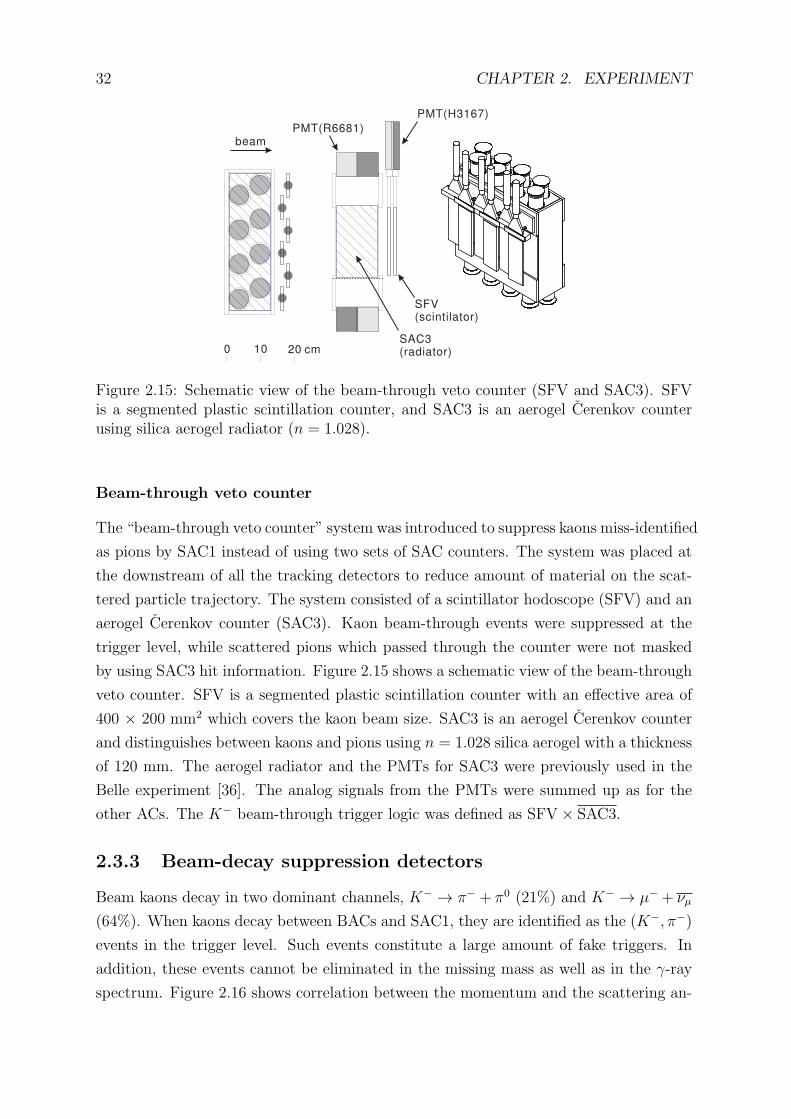
beam
PMT(H3167)
PMT(R6681)
SFV(scintilator)
SAC3(radiator)0 10 20 cm
Figure 2.15: Schematic view of the beam-through veto counter (SFV and SAC3). SFVis a segmented plastic scintillation counter, and SAC3 is an aerogel Cerenkov counterusing silica aerogel radiator (n = 1.028).
Beam-through veto counter
The “beam-through veto counter” system was introduced to suppress kaons miss-identified
as pions by SAC1 instead of using two sets of SAC counters. The system was placed at
the downstream of all the tracking detectors to reduce amount of material on the scat-
tered particle trajectory. The system consisted of a scintillator hodoscope (SFV) and an
aerogel Cerenkov counter (SAC3). Kaon beam-through events were suppressed at the
trigger level, while scattered pions which passed through the counter were not masked
by using SAC3 hit information. Figure 2.15 shows a schematic view of the beam-through
veto counter. SFV is a segmented plastic scintillation counter with an effective area of
400 × 200 mm2 which covers the kaon beam size. SAC3 is an aerogel Cerenkov counter
and distinguishes between kaons and pions using n = 1.028 silica aerogel with a thickness
of 120 mm. The aerogel radiator and the PMTs for SAC3 were previously used in the
Belle experiment [36]. The analog signals from the PMTs were summed up as for the
other ACs. The K− beam-through trigger logic was defined as SFV × SAC3.
2.3.3 Beam-decay suppression detectors
Beam kaons decay in two dominant channels, K− → π− + π0 (21%) and K− → µ− + νµ
(64%). When kaons decay between BACs and SAC1, they are identified as the (K−, π−)
events in the trigger level. Such events constitute a large amount of fake triggers. In
addition, these events cannot be eliminated in the missing mass as well as in the γ-ray
spectrum. Figure 2.16 shows correlation between the momentum and the scattering an-
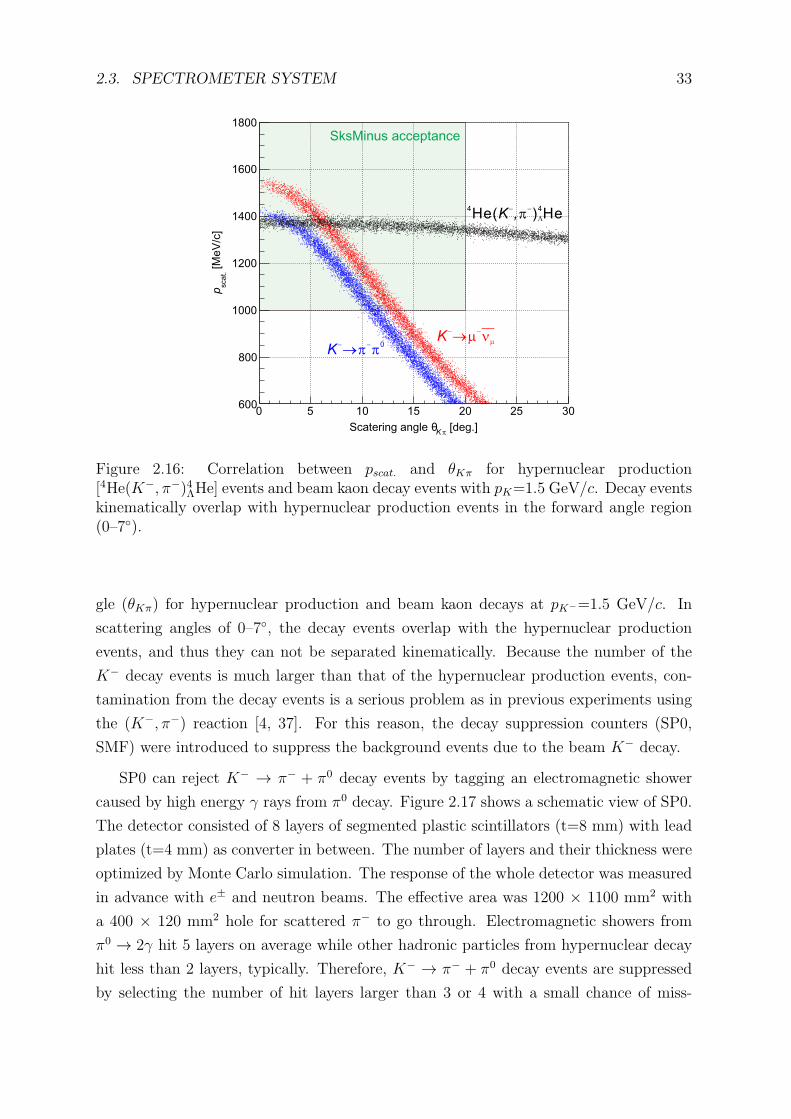
2.3. SPECTROMETER SYSTEM 33
[deg.]pK
θScatering angle
0 5 10 15 20 25 30
[MeV
/c]
sca
t.p
600
800
1000
1200
1400
1600
1800
SksMinus acceptance
K- -®p p
0K
- -®m nm
4 4He( ) HeK ,
- -p L
Figure 2.16: Correlation between pscat. and θKπ for hypernuclear production[4He(K−, π−)4ΛHe] events and beam kaon decay events with pK=1.5 GeV/c. Decay eventskinematically overlap with hypernuclear production events in the forward angle region(0–7◦).
gle (θKπ) for hypernuclear production and beam kaon decays at pK−=1.5 GeV/c. In
scattering angles of 0–7◦, the decay events overlap with the hypernuclear production
events, and thus they can not be separated kinematically. Because the number of the
K− decay events is much larger than that of the hypernuclear production events, con-
tamination from the decay events is a serious problem as in previous experiments using
the (K−, π−) reaction [4, 37]. For this reason, the decay suppression counters (SP0,
SMF) were introduced to suppress the background events due to the beam K− decay.
SP0 can reject K− → π− + π0 decay events by tagging an electromagnetic shower
caused by high energy γ rays from π0 decay. Figure 2.17 shows a schematic view of SP0.
The detector consisted of 8 layers of segmented plastic scintillators (t=8 mm) with lead
plates (t=4 mm) as converter in between. The number of layers and their thickness were
optimized by Monte Carlo simulation. The response of the whole detector was measured
in advance with e± and neutron beams. The effective area was 1200 × 1100 mm2 with
a 400 × 120 mm2 hole for scattered π− to go through. Electromagnetic showers from
π0 → 2γ hit 5 layers on average while other hadronic particles from hypernuclear decay
hit less than 2 layers, typically. Therefore, K− → π− + π0 decay events are suppressed
by selecting the number of hit layers larger than 3 or 4 with a small chance of miss-
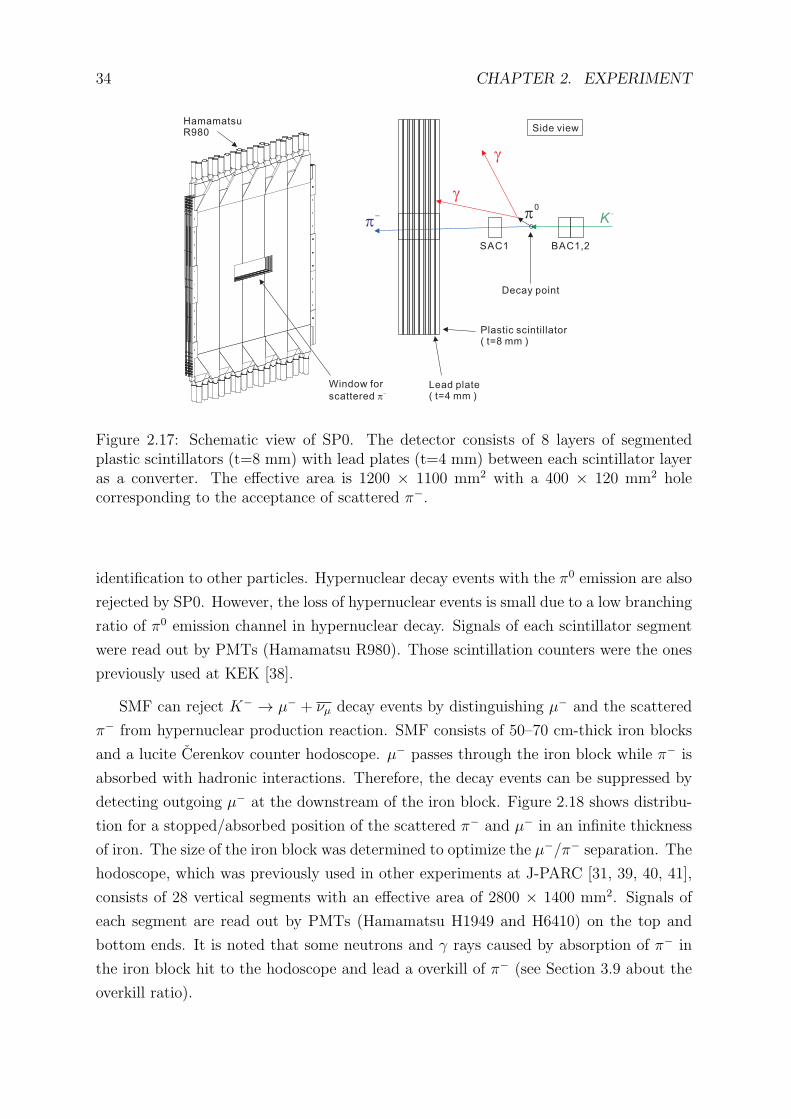
34 CHAPTER 2. EXPERIMENT
Window for
scattered p-
HamamatsuR980
Plastic scintillator( t=8 mm )
Lead plate( t=4 mm )
Side view
p0
K-
p-
Decay point
g
g
SAC1 BAC1,2
Figure 2.17: Schematic view of SP0. The detector consists of 8 layers of segmentedplastic scintillators (t=8 mm) with lead plates (t=4 mm) between each scintillator layeras a converter. The effective area is 1200 × 1100 mm2 with a 400 × 120 mm2 holecorresponding to the acceptance of scattered π−.
identification to other particles. Hypernuclear decay events with the π0 emission are also
rejected by SP0. However, the loss of hypernuclear events is small due to a low branching
ratio of π0 emission channel in hypernuclear decay. Signals of each scintillator segment
were read out by PMTs (Hamamatsu R980). Those scintillation counters were the ones
previously used at KEK [38].
SMF can reject K− → µ− + νµ decay events by distinguishing µ− and the scattered
π− from hypernuclear production reaction. SMF consists of 50–70 cm-thick iron blocks
and a lucite Cerenkov counter hodoscope. µ− passes through the iron block while π− is
absorbed with hadronic interactions. Therefore, the decay events can be suppressed by
detecting outgoing µ− at the downstream of the iron block. Figure 2.18 shows distribu-
tion for a stopped/absorbed position of the scattered π− and µ− in an infinite thickness
of iron. The size of the iron block was determined to optimize the µ−/π− separation. The
hodoscope, which was previously used in other experiments at J-PARC [31, 39, 40, 41],
consists of 28 vertical segments with an effective area of 2800 × 1400 mm2. Signals of
each segment are read out by PMTs (Hamamatsu H1949 and H6410) on the top and
bottom ends. It is noted that some neutrons and γ rays caused by absorption of π− in
the iron block hit to the hodoscope and lead a overkill of π− (see Section 3.9 about the
overkill ratio).
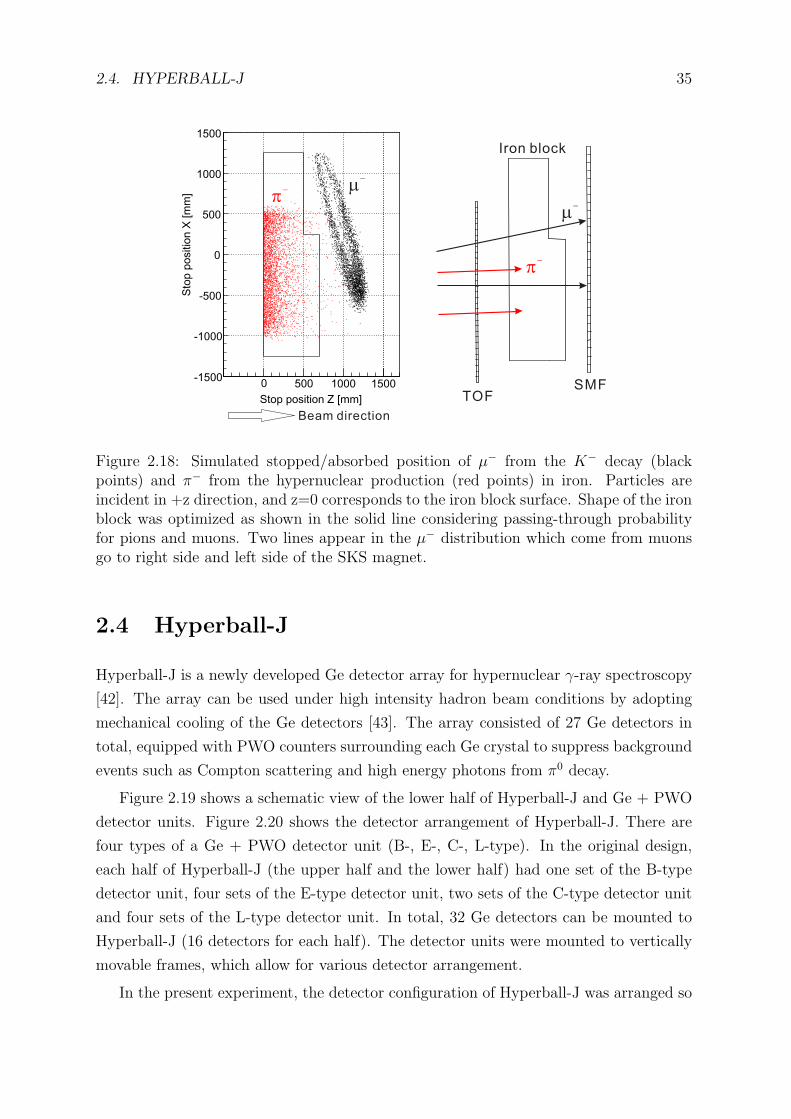
2.4. HYPERBALL-J 35
Stop position Z [mm]
0
Sto
p p
ositio
n X
[m
m]
-1500
-1000
-500
0
500
1000
1500
500 1000 1500
Beam direction
SMFTOF
Iron block
m-
p-
p- m
-
Figure 2.18: Simulated stopped/absorbed position of µ− from the K− decay (blackpoints) and π− from the hypernuclear production (red points) in iron. Particles areincident in +z direction, and z=0 corresponds to the iron block surface. Shape of the ironblock was optimized as shown in the solid line considering passing-through probabilityfor pions and muons. Two lines appear in the µ− distribution which come from muonsgo to right side and left side of the SKS magnet.
2.4 Hyperball-J
Hyperball-J is a newly developed Ge detector array for hypernuclear γ-ray spectroscopy
[42]. The array can be used under high intensity hadron beam conditions by adopting
mechanical cooling of the Ge detectors [43]. The array consisted of 27 Ge detectors in
total, equipped with PWO counters surrounding each Ge crystal to suppress background
events such as Compton scattering and high energy photons from π0 decay.
Figure 2.19 shows a schematic view of the lower half of Hyperball-J and Ge + PWO
detector units. Figure 2.20 shows the detector arrangement of Hyperball-J. There are
four types of a Ge + PWO detector unit (B-, E-, C-, L-type). In the original design,
each half of Hyperball-J (the upper half and the lower half) had one set of the B-type
detector unit, four sets of the E-type detector unit, two sets of the C-type detector unit
and four sets of the L-type detector unit. In total, 32 Ge detectors can be mounted to
Hyperball-J (16 detectors for each half). The detector units were mounted to vertically
movable frames, which allow for various detector arrangement.
In the present experiment, the detector configuration of Hyperball-J was arranged so
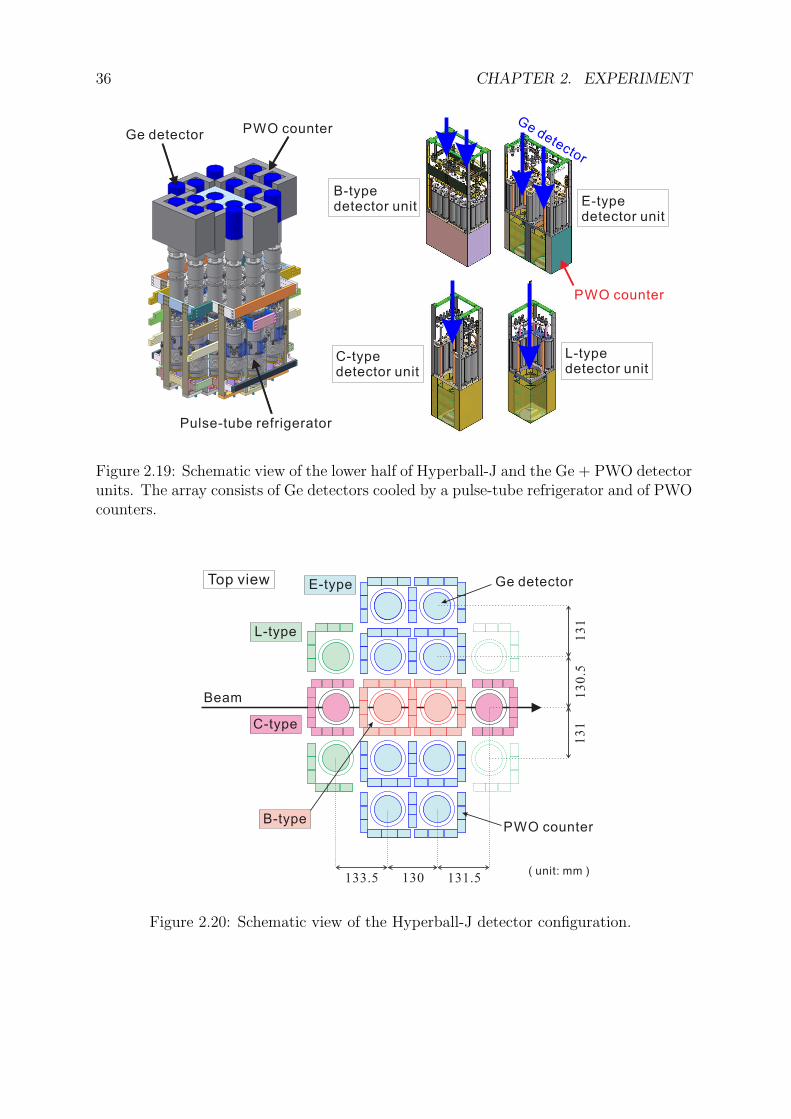
36 CHAPTER 2. EXPERIMENT
Ge detector PWO counter
Pulse-tube refrigerator
B-typedetector unit
C-typedetector unit
E-typedetector unit
L-typedetector unit
Ge detector
PWO counter
Figure 2.19: Schematic view of the lower half of Hyperball-J and the Ge + PWO detectorunits. The array consists of Ge detectors cooled by a pulse-tube refrigerator and of PWOcounters.
Beam
Ge detector
PWO counter
C-type
L-type
E-type
B-type
13
11
31
13
0.5
131.5130133.5
Top view
( unit: mm )
Figure 2.20: Schematic view of the Hyperball-J detector configuration.
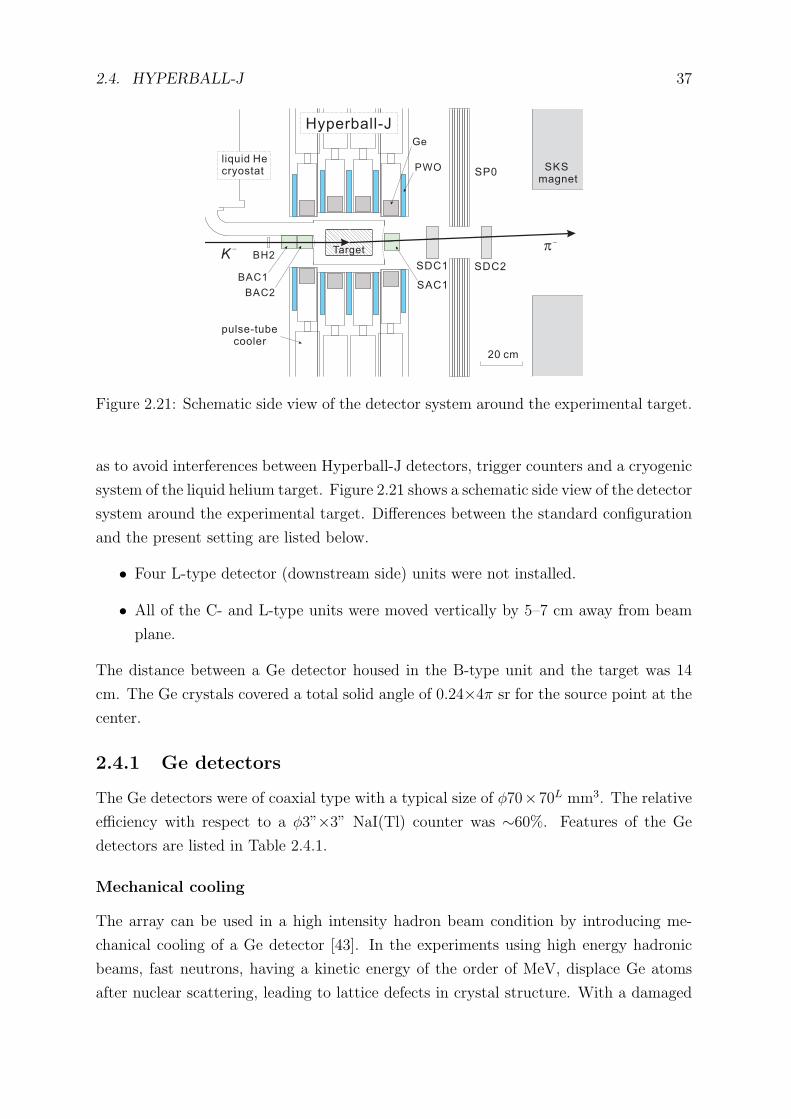
2.4. HYPERBALL-J 37
K - p
-
PWO
Ge
BH2SDC1 SDC2
SKSmagnet
SP0
SAC1BAC2
BAC1
Target
pulse-tubecooler
Hyperball-J
liquid Hecryostat
20 cm
Figure 2.21: Schematic side view of the detector system around the experimental target.
as to avoid interferences between Hyperball-J detectors, trigger counters and a cryogenic
system of the liquid helium target. Figure 2.21 shows a schematic side view of the detector
system around the experimental target. Differences between the standard configuration
and the present setting are listed below.
• Four L-type detector (downstream side) units were not installed.
• All of the C- and L-type units were moved vertically by 5–7 cm away from beam
plane.
The distance between a Ge detector housed in the B-type unit and the target was 14
cm. The Ge crystals covered a total solid angle of 0.24×4π sr for the source point at the
center.
2.4.1 Ge detectors
The Ge detectors were of coaxial type with a typical size of ϕ70×70L mm3. The relative
efficiency with respect to a ϕ3”×3” NaI(Tl) counter was ∼60%. Features of the Ge
detectors are listed in Table 2.4.1.
Mechanical cooling
The array can be used in a high intensity hadron beam condition by introducing me-
chanical cooling of a Ge detector [43]. In the experiments using high energy hadronic
beams, fast neutrons, having a kinetic energy of the order of MeV, displace Ge atoms
after nuclear scattering, leading to lattice defects in crystal structure. With a damaged
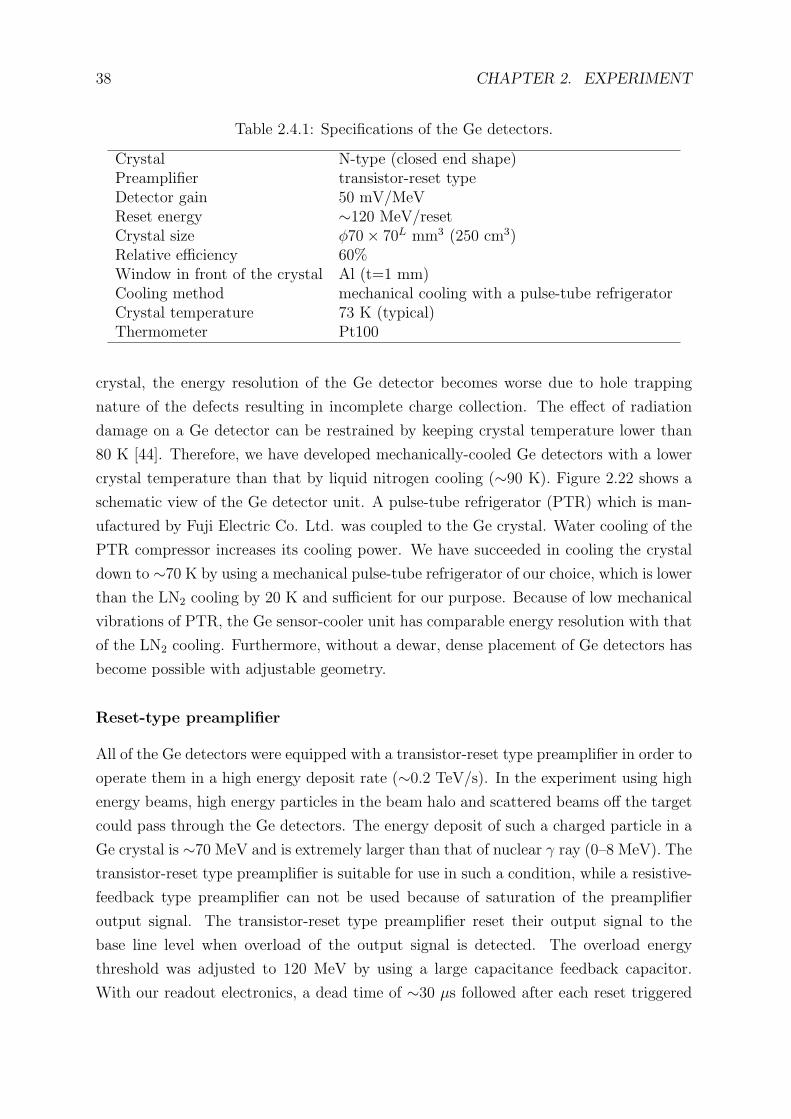
38 CHAPTER 2. EXPERIMENT
Table 2.4.1: Specifications of the Ge detectors.
Crystal N-type (closed end shape)Preamplifier transistor-reset typeDetector gain 50 mV/MeVReset energy ∼120 MeV/resetCrystal size ϕ70× 70L mm3 (250 cm3)Relative efficiency 60%Window in front of the crystal Al (t=1 mm)Cooling method mechanical cooling with a pulse-tube refrigeratorCrystal temperature 73 K (typical)Thermometer Pt100
crystal, the energy resolution of the Ge detector becomes worse due to hole trapping
nature of the defects resulting in incomplete charge collection. The effect of radiation
damage on a Ge detector can be restrained by keeping crystal temperature lower than
80 K [44]. Therefore, we have developed mechanically-cooled Ge detectors with a lower
crystal temperature than that by liquid nitrogen cooling (∼90 K). Figure 2.22 shows a
schematic view of the Ge detector unit. A pulse-tube refrigerator (PTR) which is man-
ufactured by Fuji Electric Co. Ltd. was coupled to the Ge crystal. Water cooling of the
PTR compressor increases its cooling power. We have succeeded in cooling the crystal
down to ∼70 K by using a mechanical pulse-tube refrigerator of our choice, which is lower
than the LN2 cooling by 20 K and sufficient for our purpose. Because of low mechanical
vibrations of PTR, the Ge sensor-cooler unit has comparable energy resolution with that
of the LN2 cooling. Furthermore, without a dewar, dense placement of Ge detectors has
become possible with adjustable geometry.
Reset-type preamplifier
All of the Ge detectors were equipped with a transistor-reset type preamplifier in order to
operate them in a high energy deposit rate (∼0.2 TeV/s). In the experiment using high
energy beams, high energy particles in the beam halo and scattered beams off the target
could pass through the Ge detectors. The energy deposit of such a charged particle in a
Ge crystal is ∼70 MeV and is extremely larger than that of nuclear γ ray (0–8 MeV). The
transistor-reset type preamplifier is suitable for use in such a condition, while a resistive-
feedback type preamplifier can not be used because of saturation of the preamplifier
output signal. The transistor-reset type preamplifier reset their output signal to the
base line level when overload of the output signal is detected. The overload energy
threshold was adjusted to 120 MeV by using a large capacitance feedback capacitor.
With our readout electronics, a dead time of ∼30 µs followed after each reset triggered
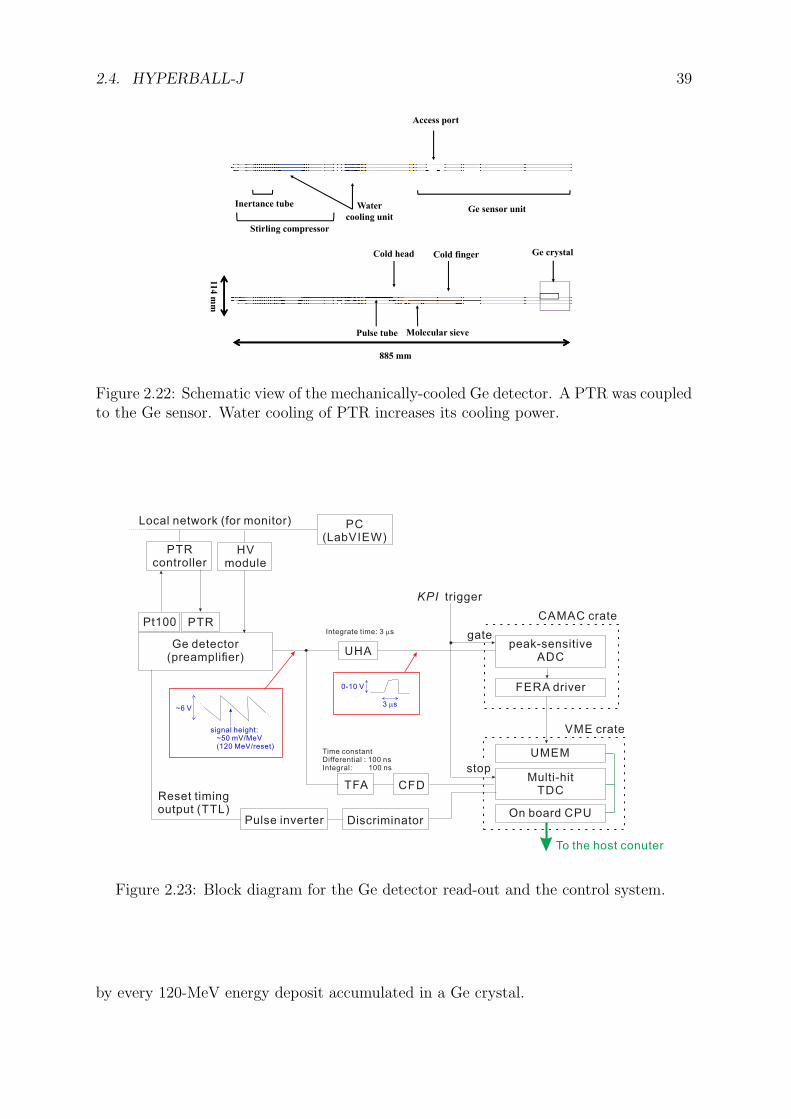
2.4. HYPERBALL-J 39
Figure 2.22: Schematic view of the mechanically-cooled Ge detector. A PTR was coupledto the Ge sensor. Water cooling of PTR increases its cooling power.
Ge detector(preamplifier)
UHA
TFA
~6 V
signal height:~50 mV/MeV(120 MeV/reset)
Integrate time: 3 sm
Time constantDifferential : 100 nsIntegral: 100 ns
peak-sensitiveADC
FERA driver
UMEM
CAMAC crate
KPI trigger
Multi-hitTDCCFD
0-10 V
3 sm
Pt100 PTR
PTRcontroller
HVmodule
Local network (for monitor) PC(LabVIEW)
gate
On board CPU
VME crate
stop
Pulse inverter Discriminator
Reset timingoutput (TTL)
To the host conuter
Figure 2.23: Block diagram for the Ge detector read-out and the control system.
by every 120-MeV energy deposit accumulated in a Ge crystal.
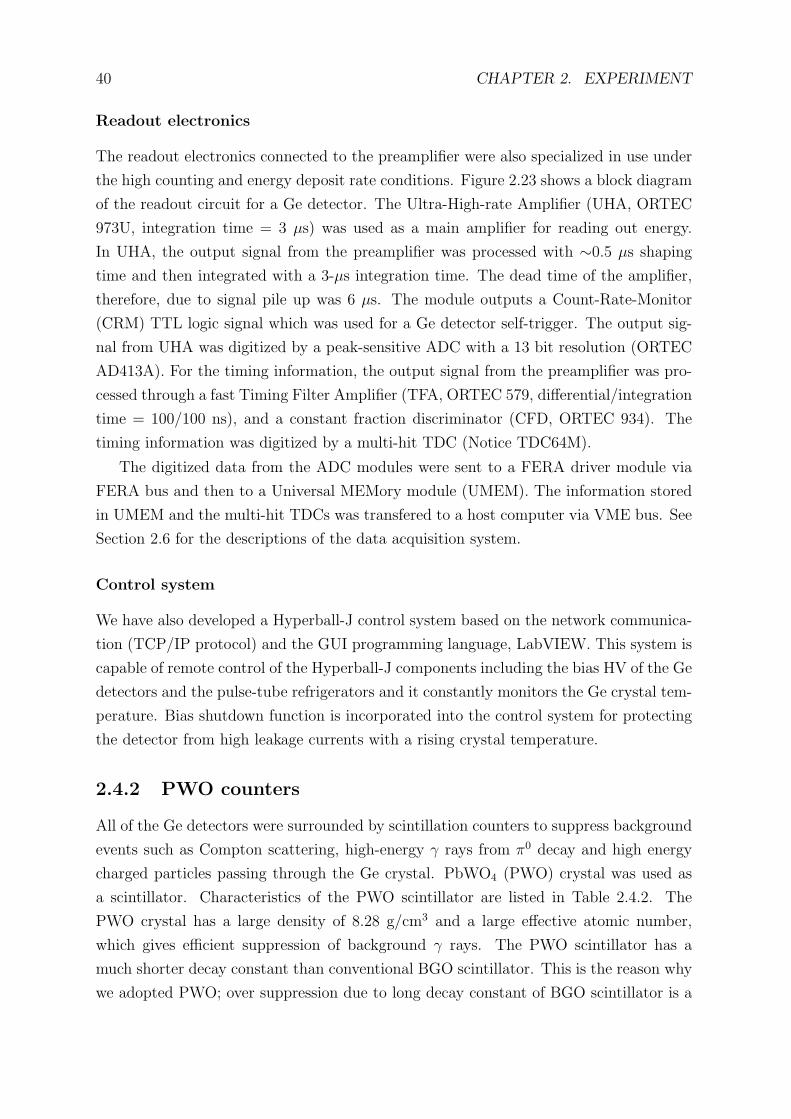
40 CHAPTER 2. EXPERIMENT
Readout electronics
The readout electronics connected to the preamplifier were also specialized in use under
the high counting and energy deposit rate conditions. Figure 2.23 shows a block diagram
of the readout circuit for a Ge detector. The Ultra-High-rate Amplifier (UHA, ORTEC
973U, integration time = 3 µs) was used as a main amplifier for reading out energy.
In UHA, the output signal from the preamplifier was processed with ∼0.5 µs shaping
time and then integrated with a 3-µs integration time. The dead time of the amplifier,
therefore, due to signal pile up was 6 µs. The module outputs a Count-Rate-Monitor
(CRM) TTL logic signal which was used for a Ge detector self-trigger. The output sig-
nal from UHA was digitized by a peak-sensitive ADC with a 13 bit resolution (ORTEC
AD413A). For the timing information, the output signal from the preamplifier was pro-
cessed through a fast Timing Filter Amplifier (TFA, ORTEC 579, differential/integration
time = 100/100 ns), and a constant fraction discriminator (CFD, ORTEC 934). The
timing information was digitized by a multi-hit TDC (Notice TDC64M).
The digitized data from the ADC modules were sent to a FERA driver module via
FERA bus and then to a Universal MEMory module (UMEM). The information stored
in UMEM and the multi-hit TDCs was transfered to a host computer via VME bus. See
Section 2.6 for the descriptions of the data acquisition system.
Control system
We have also developed a Hyperball-J control system based on the network communica-
tion (TCP/IP protocol) and the GUI programming language, LabVIEW. This system is
capable of remote control of the Hyperball-J components including the bias HV of the Ge
detectors and the pulse-tube refrigerators and it constantly monitors the Ge crystal tem-
perature. Bias shutdown function is incorporated into the control system for protecting
the detector from high leakage currents with a rising crystal temperature.
2.4.2 PWO counters
All of the Ge detectors were surrounded by scintillation counters to suppress background
events such as Compton scattering, high-energy γ rays from π0 decay and high energy
charged particles passing through the Ge crystal. PbWO4 (PWO) crystal was used as
a scintillator. Characteristics of the PWO scintillator are listed in Table 2.4.2. The
PWO crystal has a large density of 8.28 g/cm3 and a large effective atomic number,
which gives efficient suppression of background γ rays. The PWO scintillator has a
much shorter decay constant than conventional BGO scintillator. This is the reason why
we adopted PWO; over suppression due to long decay constant of BGO scintillator is a
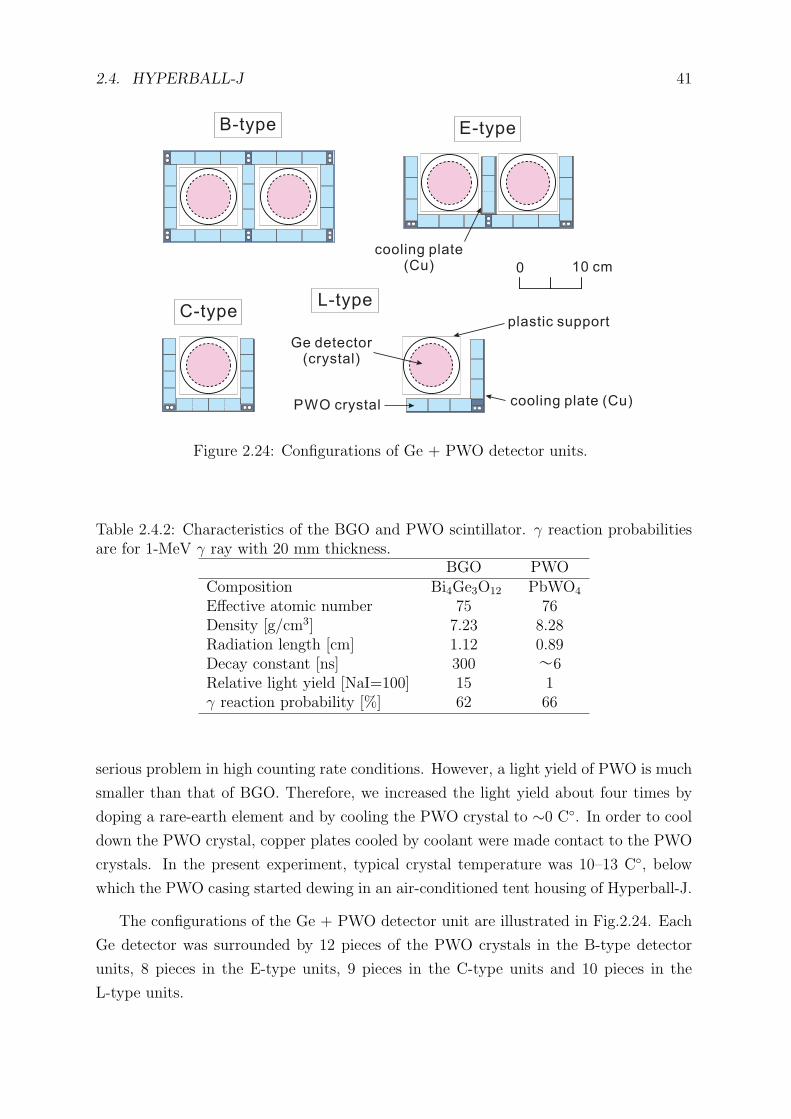
2.4. HYPERBALL-J 41
B-type E-type
C-typeL-type
0 10 cm
Ge detector(crystal)
PWO crystal cooling plate (Cu)
plastic support
cooling plate(Cu)
Figure 2.24: Configurations of Ge + PWO detector units.
Table 2.4.2: Characteristics of the BGO and PWO scintillator. γ reaction probabilitiesare for 1-MeV γ ray with 20 mm thickness.
BGO PWOComposition Bi4Ge3O12 PbWO4
Effective atomic number 75 76Density [g/cm3] 7.23 8.28Radiation length [cm] 1.12 0.89Decay constant [ns] 300 ~6Relative light yield [NaI=100] 15 1γ reaction probability [%] 62 66
serious problem in high counting rate conditions. However, a light yield of PWO is much
smaller than that of BGO. Therefore, we increased the light yield about four times by
doping a rare-earth element and by cooling the PWO crystal to ∼0 C◦. In order to cool
down the PWO crystal, copper plates cooled by coolant were made contact to the PWO
crystals. In the present experiment, typical crystal temperature was 10–13 C◦, below
which the PWO casing started dewing in an air-conditioned tent housing of Hyperball-J.
The configurations of the Ge + PWO detector unit are illustrated in Fig.2.24. Each
Ge detector was surrounded by 12 pieces of the PWO crystals in the B-type detector
units, 8 pieces in the E-type units, 9 pieces in the C-type units and 10 pieces in the
L-type units.
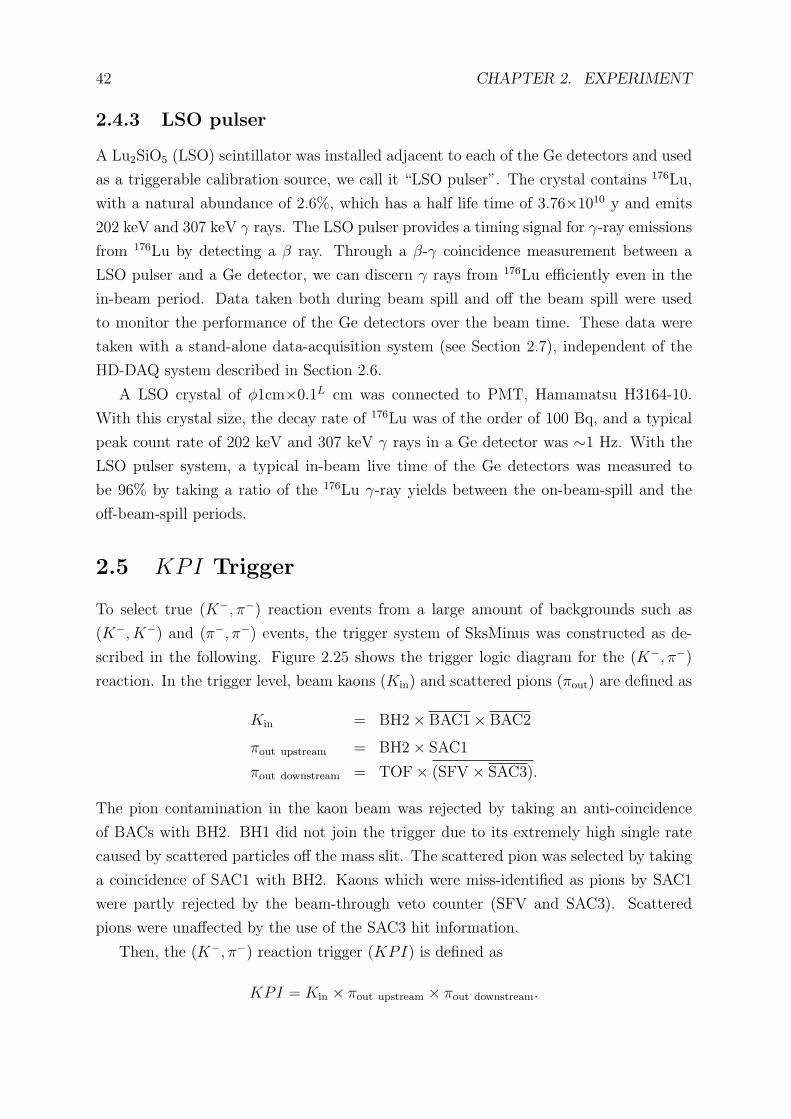
42 CHAPTER 2. EXPERIMENT
2.4.3 LSO pulser
A Lu2SiO5 (LSO) scintillator was installed adjacent to each of the Ge detectors and used
as a triggerable calibration source, we call it “LSO pulser”. The crystal contains 176Lu,
with a natural abundance of 2.6%, which has a half life time of 3.76×10¹⁰ y and emits
202 keV and 307 keV γ rays. The LSO pulser provides a timing signal for γ-ray emissions
from 176Lu by detecting a β ray. Through a β-γ coincidence measurement between a
LSO pulser and a Ge detector, we can discern γ rays from 176Lu efficiently even in the
in-beam period. Data taken both during beam spill and off the beam spill were used
to monitor the performance of the Ge detectors over the beam time. These data were
taken with a stand-alone data-acquisition system (see Section 2.7), independent of the
HD-DAQ system described in Section 2.6.
A LSO crystal of ϕ1cm×0.1L cm was connected to PMT, Hamamatsu H3164-10.
With this crystal size, the decay rate of 176Lu was of the order of 100 Bq, and a typical
peak count rate of 202 keV and 307 keV γ rays in a Ge detector was ∼1 Hz. With the
LSO pulser system, a typical in-beam live time of the Ge detectors was measured to
be 96% by taking a ratio of the 176Lu γ-ray yields between the on-beam-spill and the
off-beam-spill periods.
2.5 KPI Trigger
To select true (K−, π−) reaction events from a large amount of backgrounds such as
(K−, K−) and (π−, π−) events, the trigger system of SksMinus was constructed as de-
scribed in the following. Figure 2.25 shows the trigger logic diagram for the (K−, π−)
reaction. In the trigger level, beam kaons (Kin) and scattered pions (πout) are defined as
Kin = BH2× BAC1× BAC2
πout upstream = BH2× SAC1
πout downstream = TOF× (SFV × SAC3).
The pion contamination in the kaon beam was rejected by taking an anti-coincidence
of BACs with BH2. BH1 did not join the trigger due to its extremely high single rate
caused by scattered particles off the mass slit. The scattered pion was selected by taking
a coincidence of SAC1 with BH2. Kaons which were miss-identified as pions by SAC1
were partly rejected by the beam-through veto counter (SFV and SAC3). Scattered
pions were unaffected by the use of the SAC3 hit information.
Then, the (K−, π−) reaction trigger (KPI) is defined as
KPI = Kin × πout upstream × πout downstream.
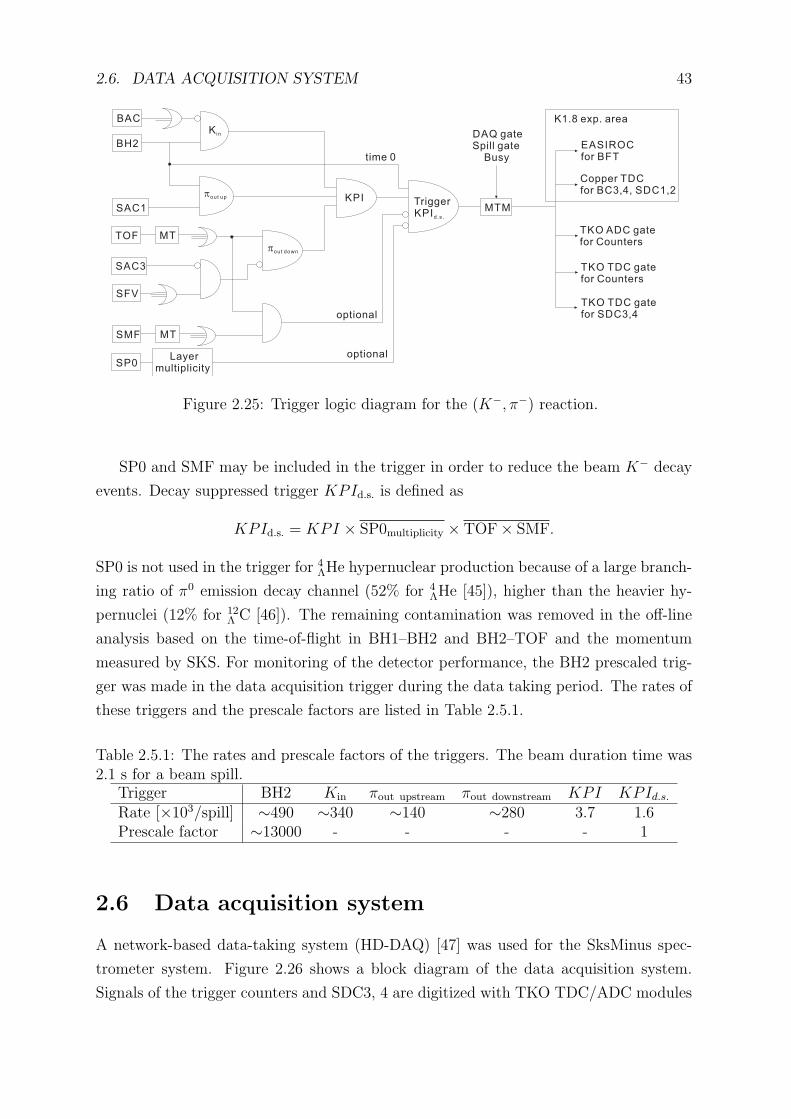
2.6. DATA ACQUISITION SYSTEM 43
BH2
SAC1
BAC
TOF MT
SAC3
SFV
K in
pout up KPI TriggerKPId.s .
time 0
SP0
SMF
Layermultiplicity
optional
optional
MTM
DAQ gateSpill gate
Busy
Copper TDCfor BC3,4, SDC1,2
EASIROCfor BFT
TKO ADC gatefor Counters
TKO TDC gatefor Counters
TKO TDC gatefor SDC3,4
K1.8 exp. area
MT
pout down
Figure 2.25: Trigger logic diagram for the (K−, π−) reaction.
SP0 and SMF may be included in the trigger in order to reduce the beam K− decay
events. Decay suppressed trigger KPId.s. is defined as
KPId.s. = KPI × SP0multiplicity × TOF× SMF.
SP0 is not used in the trigger for 4ΛHe hypernuclear production because of a large branch-
ing ratio of π0 emission decay channel (52% for 4ΛHe [45]), higher than the heavier hy-
pernuclei (12% for 12Λ C [46]). The remaining contamination was removed in the off-line
analysis based on the time-of-flight in BH1–BH2 and BH2–TOF and the momentum
measured by SKS. For monitoring of the detector performance, the BH2 prescaled trig-
ger was made in the data acquisition trigger during the data taking period. The rates of
these triggers and the prescale factors are listed in Table 2.5.1.
Table 2.5.1: The rates and prescale factors of the triggers. The beam duration time was2.1 s for a beam spill.
Trigger BH2 Kin πout upstream πout downstream KPI KPId.s.Rate [×103/spill] ∼490 ∼340 ∼140 ∼280 3.7 1.6Prescale factor ∼13000 - - - - 1
2.6 Data acquisition system
A network-based data-taking system (HD-DAQ) [47] was used for the SksMinus spec-
trometer system. Figure 2.26 shows a block diagram of the data acquisition system.
Signals of the trigger counters and SDC3, 4 are digitized with TKO TDC/ADC modules
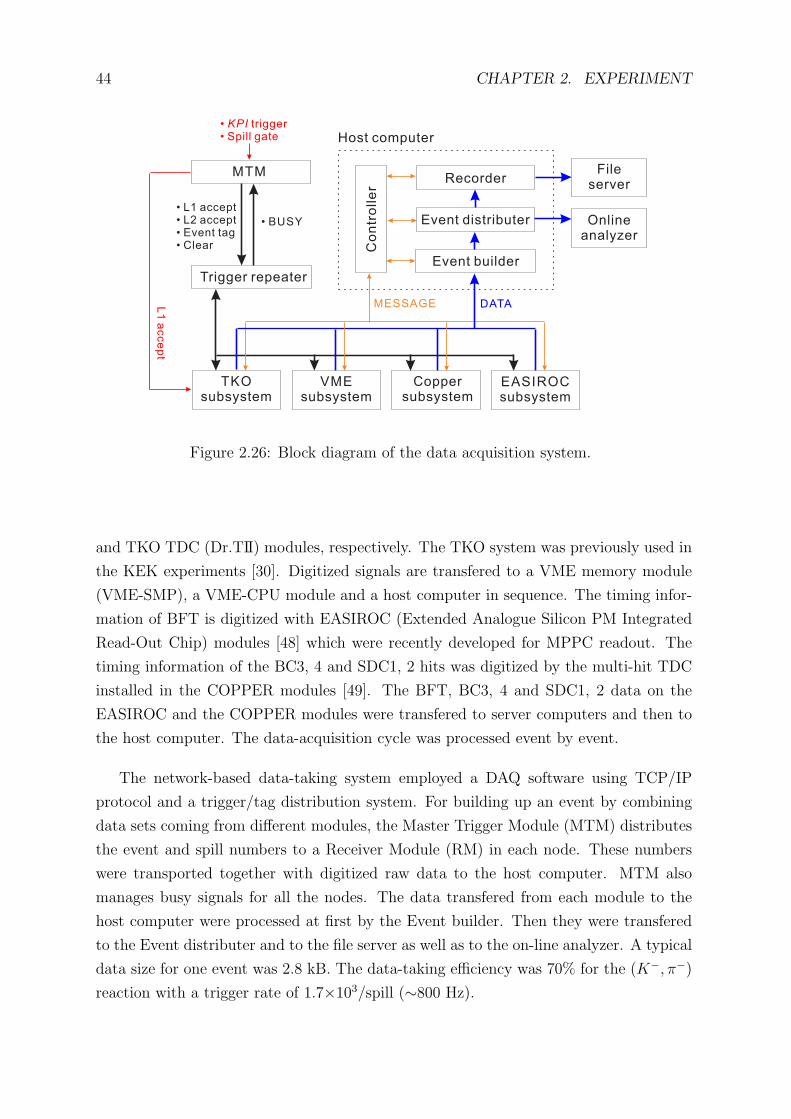
44 CHAPTER 2. EXPERIMENT
MTM
• KPI triggerSpill gate•
Trigger repeater
• L1 acceptL2 accept•
Event tag•
Clear•
• BUSY
Event builder
Event distributer
Recorder
Co
ntr
olle
r
Host computer
TKOsubsystem
L1
acce
pt
Onlineanalyzer
Fileserver
VMEsubsystem
Coppersubsystem
EASIROCsubsystem
DATAMESSAGE
Figure 2.26: Block diagram of the data acquisition system.
and TKO TDC (Dr.TII) modules, respectively. The TKO system was previously used in
the KEK experiments [30]. Digitized signals are transfered to a VME memory module
(VME-SMP), a VME-CPU module and a host computer in sequence. The timing infor-
mation of BFT is digitized with EASIROC (Extended Analogue Silicon PM Integrated
Read-Out Chip) modules [48] which were recently developed for MPPC readout. The
timing information of the BC3, 4 and SDC1, 2 hits was digitized by the multi-hit TDC
installed in the COPPER modules [49]. The BFT, BC3, 4 and SDC1, 2 data on the
EASIROC and the COPPER modules were transfered to server computers and then to
the host computer. The data-acquisition cycle was processed event by event.
The network-based data-taking system employed a DAQ software using TCP/IP
protocol and a trigger/tag distribution system. For building up an event by combining
data sets coming from different modules, the Master Trigger Module (MTM) distributes
the event and spill numbers to a Receiver Module (RM) in each node. These numbers
were transported together with digitized raw data to the host computer. MTM also
manages busy signals for all the nodes. The data transfered from each module to the
host computer were processed at first by the Event builder. Then they were transfered
to the Event distributer and to the file server as well as to the on-line analyzer. A typical
data size for one event was 2.8 kB. The data-taking efficiency was 70% for the (K−, π−)
reaction with a trigger rate of 1.7×10³/spill (∼800 Hz).
2.7. GE DETECTOR SELF-TRIGGERED DATA 45
2.7 Ge detector self-triggered data
The self-triggered data for the calibration and monitoring of the Ge detectors were taken
in the beam-spill period and off the beam-spill period. Figure 2.27 shows a block diagram
of the self-triggered data system.
Ge self trigger (off-beam-spill)
The Ge self-triggered data were taken off the beam-spill period (∼4 s), which were used
for a correction of Ge detector gain drift. In general, Ge detector gain depends on the
crystal temperature. With the mechanical cooling of Ge detectors, cooling power and
thus of the crystal temperature is affected by a change in room temperature and the
cryostat vacuum. The detector gain shifts according to the crystal temperature in our
Ge detectors. The trigger for the off-beam-spill data was made with the CRM signals
from the 973U modules. In the self-triggered data, γ-ray peaks from normal nuclei, such
as a β delayed nucleus having a lifetime longer than the order of 1 s and daughter nuclei
of the Th-series decay chain, were used for the calibration. A bundled thorium dioxide
Ge detector(preamplifier)
UHA
peak-sensitiveADC
FERA driver
UMEM
CAMAC crate
gate
On board CPU
VME crate
Main DAQsystem
CRM
LSO detector(PMT)
off-beam-spill self data system
peak-sensitiveADC (Hoshin)
On board CPU
CAMAC crategate
File server
Ge x LSO trigger data system
off-beam-spill gate
KPI trigger
on-beam-spill gate
Figure 2.27: Block diagram of the self-triggered data system.
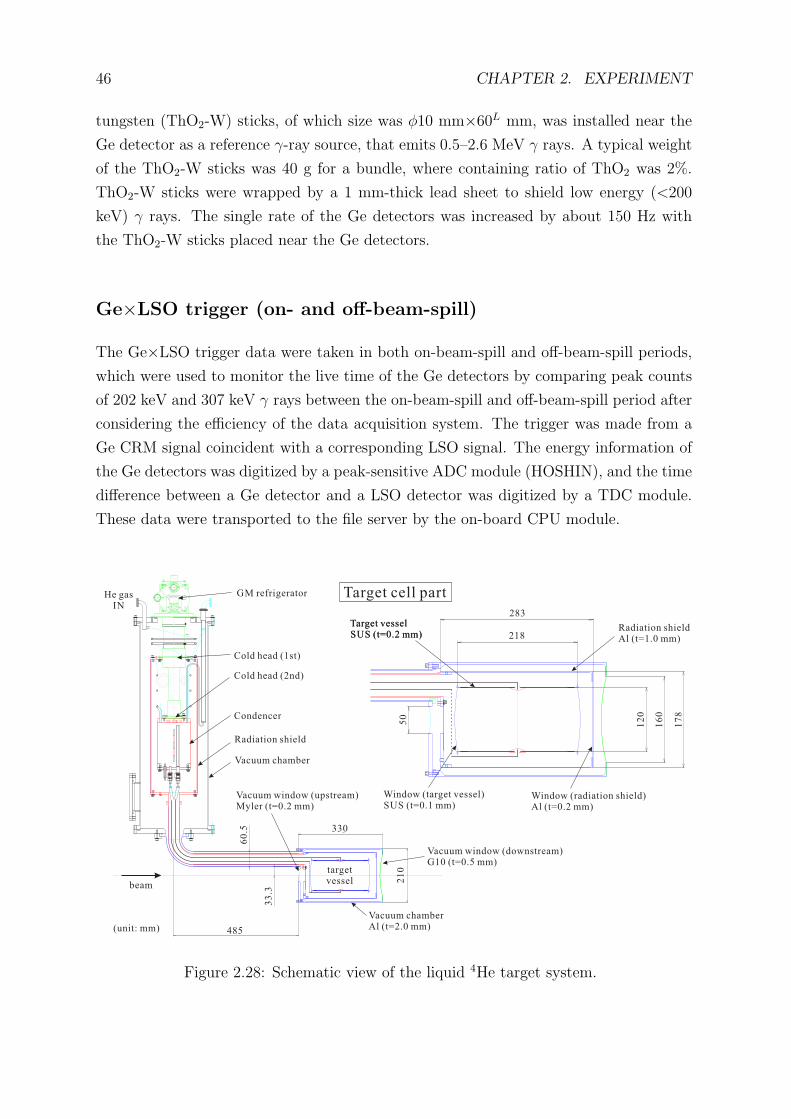
46 CHAPTER 2. EXPERIMENT
tungsten (ThO2-W) sticks, of which size was ϕ10 mm×60L mm, was installed near the
Ge detector as a reference γ-ray source, that emits 0.5–2.6 MeV γ rays. A typical weight
of the ThO2-W sticks was 40 g for a bundle, where containing ratio of ThO2 was 2%.
ThO2-W sticks were wrapped by a 1 mm-thick lead sheet to shield low energy (<200
keV) γ rays. The single rate of the Ge detectors was increased by about 150 Hz with
the ThO2-W sticks placed near the Ge detectors.
Ge×LSO trigger (on- and off-beam-spill)
The Ge×LSO trigger data were taken in both on-beam-spill and off-beam-spill periods,
which were used to monitor the live time of the Ge detectors by comparing peak counts
of 202 keV and 307 keV γ rays between the on-beam-spill and off-beam-spill period after
considering the efficiency of the data acquisition system. The trigger was made from a
Ge CRM signal coincident with a corresponding LSO signal. The energy information of
the Ge detectors was digitized by a peak-sensitive ADC module (HOSHIN), and the time
difference between a Ge detector and a LSO detector was digitized by a TDC module.
These data were transported to the file server by the on-board CPU module.
485
330
21
0
33
.3
60
.5
beam
283
2181
20
targetvessel
16
0
17
8
50
GM refrigeratorHe gasIN
Cold head (1st)
Cold head (2nd)
Radiation shield
Condencer
Vacuum chamber
Vacuum window (upstream)Myler (t=0.2 mm)
Vacuum window (downstream)G10 (t=0.5 mm)
Target cell part
Target vesselSUS (t=0.2 mm)
Window (target vessel)SUS (t=0.1 mm)
Window (radiation shield)Al (t=0.2 mm)
Target vesselSUS (t=0.2 mm)
Radiation shieldAl (t=1.0 mm)
Vacuum chamberAl (t=2.0 mm)(unit: mm)
Figure 2.28: Schematic view of the liquid 4He target system.
2.8. TARGET 47
Table 2.7.1: Specifications of the liquid 4He target system.
Size ϕ120× 218L mm3
Capacity 2466 cm3
Target cell stainless steel(t=0.2 mm ,cylinder) and (t=0.1, end cup)Radiation shield Al(t=0.2 mm, cylinder), Al(t=0.2 mm, end cup)Vacuum chamber window Mylar(t=0.3 mm, upstream),
G10(t=0.5 mm, downstream)Vacuum ∼ 8× 10⁻⁶ PaHelium temperature 4.4 KHelium gas pressure 0.103 MPaLiq. helium density 0.125 g/cm3
liq. 4He thickness 2.8 g/cm2
2.8 Target
In order to obtain a large yield of hypernuclear production events, a long liquid 4He target
was used. We decided the target thickness to be of ∼3 g/cm2, corresponding to the length
of 230 mm, to keep the missing mass resolution of ∼5 MeV (FWHM). Furthermore, a
longer length of the target causes a loss of effective solid angle of Hyperball-J and an
increase of contamination from beam K− decay with a longer distance between BACs
and SAC1.
Figure 2.28 shows a schematic view of the liquid 4He target system. The target vessel
was made of stainless steel (SUS) with a thickness of t=0.2 mm for cylindrical part and
t=0.1 mm for an entrance and exit windows. We selected stainless steel as a material
so that its large size vessel has enough mechanical strength in the low temperature
condition. The diameter of the vessel was ϕ120 mm in order to cover a horizontally-wide
beam K− profile. The length of the vessel was 218 mm. In the operation condition,
the target length became slightly (∼ 10 mm) longer due to inflation of the SUS window
in the vacuum chamber. The density of liquid helium was monitored by measuring
its temperature and the gas pressure. The stability of the liquid Helium density was
∆ρ/ρ < 10−5 over the experimental period. Specifications of the liquid 4He target
system are listed in Table 2.7.1.
2.9 Data summary
The total beam time we used for the data taking with the 4He target was about 130 hours.
In total, 2.3×10¹⁰ kaons were irradiated on the 4He target. We also took reference data
with an empty target vessel and without the target vessel. In the empty target vessel
run, we took data with the KPI trigger to check the contamination from material
48 CHAPTER 2. EXPERIMENT
other than helium. With a polyethylene (CH2, 2.9 g/cm2) target, we took data of the
p(K−, π−)Σ+ and 12C(K−, π−)12Λ C reactions for validating the missing mass analysis.
With a thin plate (t=3 mm) of stainless steel target, we took data of beam particle
scattering events for estimation of the reaction vertex resolution. Without any material
at the target position, beam particles were let through both the beam line spectrometer
and SksMinus for calibration of these magnetic spectrometers. This beam-through data
was taken with the BH2 trigger. The data acquired in the experiment are summarized
in Table 2.9.1.
Table 2.9.1: The data summary.
Target Beam momentum [GeV/c] Number of K−
Liquid 4He 1.5 2.3× 10¹⁰
Emptied target vessel 1.5 6.0× 10⁸
Polyethylene (CH2) 1.5 1.0× 10⁹
Stainless steel (t=3 mm) 1.5 8.7× 10⁷
No target installed 1.8, 1.5, 1.37, 1.2 -(beam-through)
Chapter 3
Analysis I - the (K−, π−) reaction
The analysis procedure is separated into two parts: the analysis of the magnetic spec-
trometers and the analysis of the Ge detectors. In the former, the hypernuclear produc-
tion events were tagged by the spectrometer system. In the latter, γ-ray spectrum was
obtained with Hyperball-J. The analysis of the magnetic spectrometers, the beam line
spectrometer and SksMinus, is described in this chapter. The analysis of the Ge detector
is described in the next chapter.
3.1 Outline
The hypernuclear production events were identified by tagging true (K−, π−) reaction
events from particle identification and calculating mass of a produced hypernucleus
(MHY) as a missing mass for the 4He(K−, π−)X kinematics. The mass is calculated
by the following equation in the laboratory frame
MHY =√(EK +Mtarget − Eπ)2 − (p2K + p2π − 2pKpπcosθKπ),
where EK and pK are the energy and the momentum of the beam K−. Similarly, Eπ
and pπ are those of the scattered π−. Mtarget is the mass of the target nucleus (4He), and
θKπ is the angle between the measured momentum vector of the K− and that of the π−.
True 4He(K−, π−) events were also selected with the reaction vertex point information.
The off-line analysis procedure of the (K−, π−) reaction for data from the magnetic
spectrometers is listed below:
• particle identification with the time-of-flight counters,
• local tracking of the drift chambers,
• momentum reconstruction for beam K−,
• momentum reconstruction of scattered π−,
49
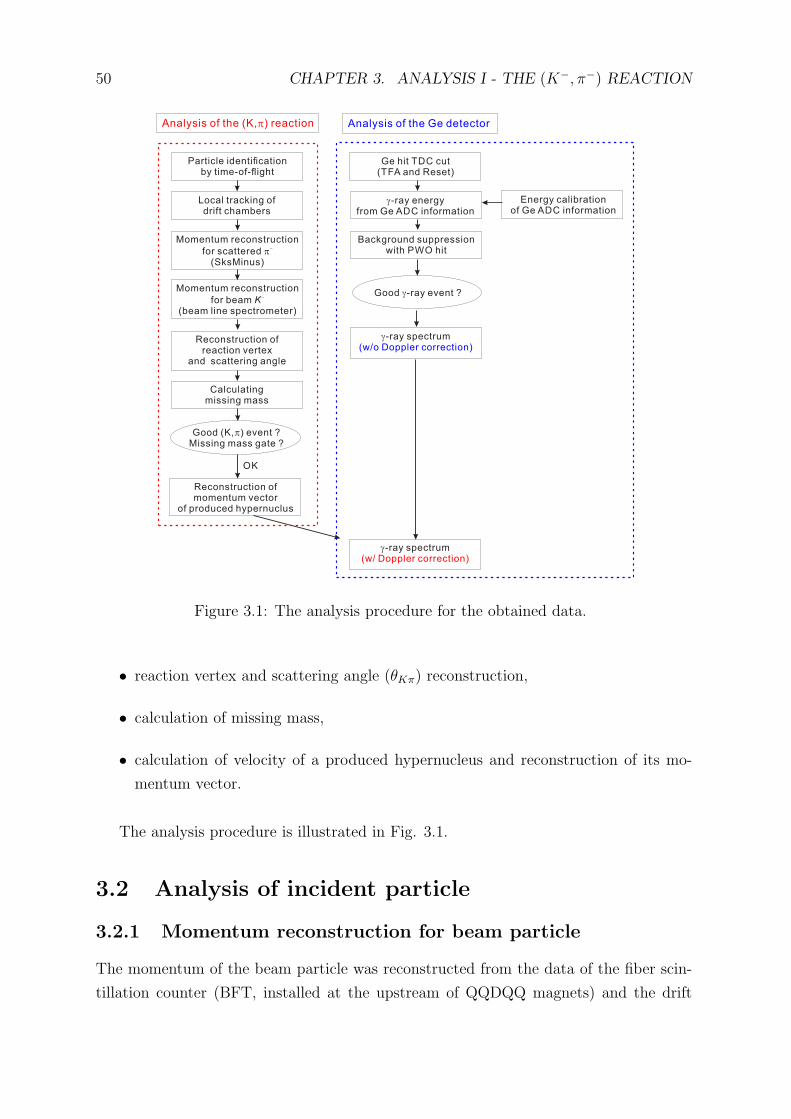
50 CHAPTER 3. ANALYSIS I - THE (K−, π−) REACTION
Particle identificationby time-of-flight
Local tracking ofdrift chambers
Momentum reconstruction
for beam K-
(beam line spectrometer)
Momentum reconstruction
for scattered p-
(SksMinus)
Reconstruction ofreaction vertex
and scattering angle
Calculatingmissing mass
Good (K, ) event ?p
Missing mass gate ?
Reconstruction ofmomentum vector
of produced hypernuclus
Ge hit TDC cut(TFA and Reset)
Energy calibrationof Ge ADC information
Background suppressionwith PWO hit
Good -ray event ?g
OK
g-ray energyfrom Ge ADC information
g-ray spectrum(w/o Doppler correction)
g-ray spectrum(w/ Doppler correction)
Analysis of the (K, ) reactionp Analysis of the Ge detector
Figure 3.1: The analysis procedure for the obtained data.
• reaction vertex and scattering angle (θKπ) reconstruction,
• calculation of missing mass,
• calculation of velocity of a produced hypernucleus and reconstruction of its mo-
mentum vector.
The analysis procedure is illustrated in Fig. 3.1.
3.2 Analysis of incident particle
3.2.1 Momentum reconstruction for beam particle
The momentum of the beam particle was reconstructed from the data of the fiber scin-
tillation counter (BFT, installed at the upstream of QQDQQ magnets) and the drift
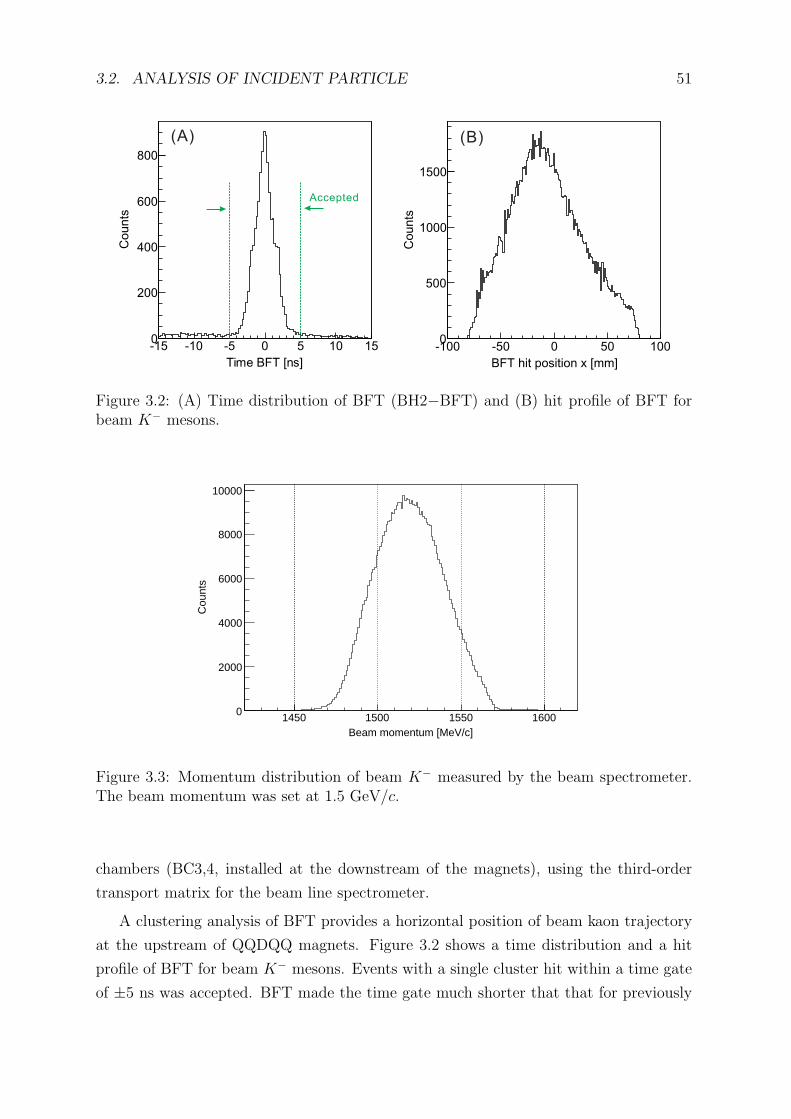
3.2. ANALYSIS OF INCIDENT PARTICLE 51
Time BFT [ns]
-15 -10 -5 0 5 10 15
Co
un
ts
0
200
400
600
800
BFT hit position x [mm]
-100 -50 0 50 100
Co
un
ts
0
500
1000
1500
Accepted
(A) (B)
Figure 3.2: (A) Time distribution of BFT (BH2−BFT) and (B) hit profile of BFT forbeam K− mesons.
Beam momentum [MeV/c]1450 1500 1550 1600
Cou
nts
0
2000
4000
6000
8000
10000
Figure 3.3: Momentum distribution of beam K− measured by the beam spectrometer.The beam momentum was set at 1.5 GeV/c.
chambers (BC3,4, installed at the downstream of the magnets), using the third-order
transport matrix for the beam line spectrometer.
A clustering analysis of BFT provides a horizontal position of beam kaon trajectory
at the upstream of QQDQQ magnets. Figure 3.2 shows a time distribution and a hit
profile of BFT for beam K− mesons. Events with a single cluster hit within a time gate
of ±5 ns was accepted. BFT made the time gate much shorter that that for previously
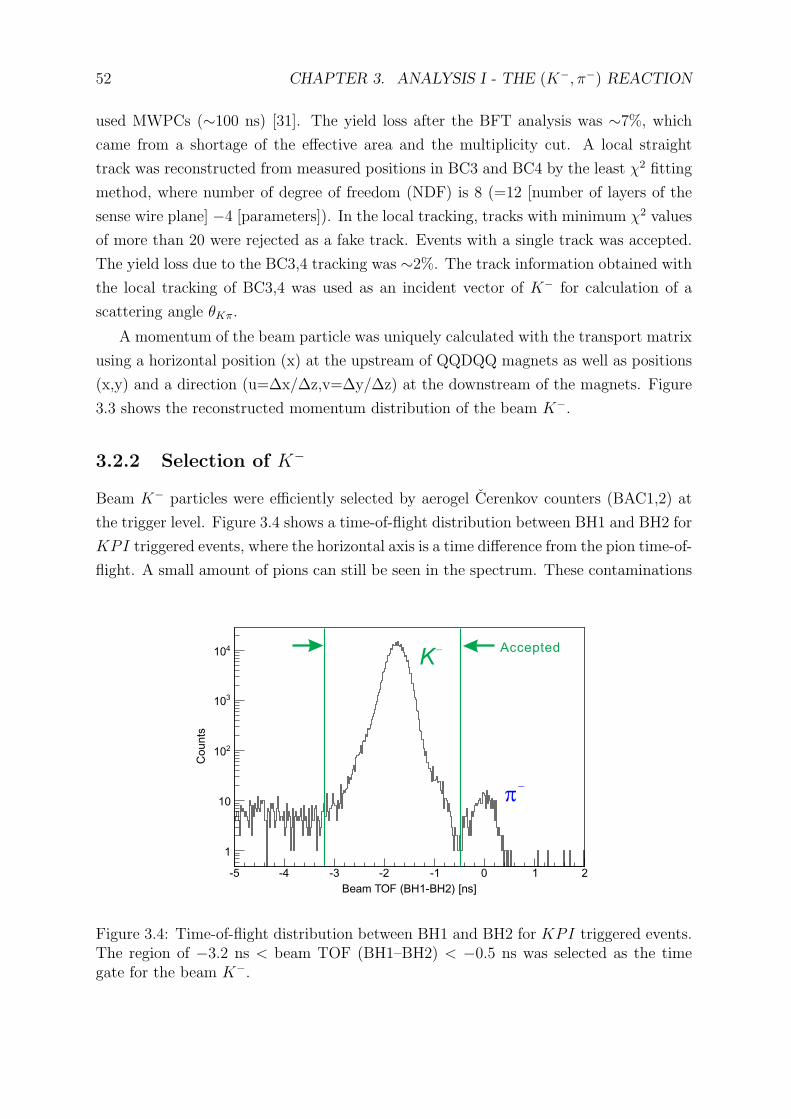
52 CHAPTER 3. ANALYSIS I - THE (K−, π−) REACTION
used MWPCs (∼100 ns) [31]. The yield loss after the BFT analysis was ∼7%, which
came from a shortage of the effective area and the multiplicity cut. A local straight
track was reconstructed from measured positions in BC3 and BC4 by the least χ2 fitting
method, where number of degree of freedom (NDF) is 8 (=12 [number of layers of the
sense wire plane] −4 [parameters]). In the local tracking, tracks with minimum χ2 values
of more than 20 were rejected as a fake track. Events with a single track was accepted.
The yield loss due to the BC3,4 tracking was ∼2%. The track information obtained with
the local tracking of BC3,4 was used as an incident vector of K− for calculation of a
scattering angle θKπ.
A momentum of the beam particle was uniquely calculated with the transport matrix
using a horizontal position (x) at the upstream of QQDQQ magnets as well as positions
(x,y) and a direction (u=∆x/∆z,v=∆y/∆z) at the downstream of the magnets. Figure
3.3 shows the reconstructed momentum distribution of the beam K−.
3.2.2 Selection of K−
Beam K− particles were efficiently selected by aerogel Cerenkov counters (BAC1,2) at
the trigger level. Figure 3.4 shows a time-of-flight distribution between BH1 and BH2 for
KPI triggered events, where the horizontal axis is a time difference from the pion time-of-
flight. A small amount of pions can still be seen in the spectrum. These contaminations
Beam TOF (BH1-BH2) [ns]
-5 -4 -3 -2 -1 0 1 2
Cou
nts
1
10
210
310
410K
-
p-
Accepted
Figure 3.4: Time-of-flight distribution between BH1 and BH2 for KPI triggered events.The region of −3.2 ns < beam TOF (BH1–BH2) < −0.5 ns was selected as the timegate for the beam K−.
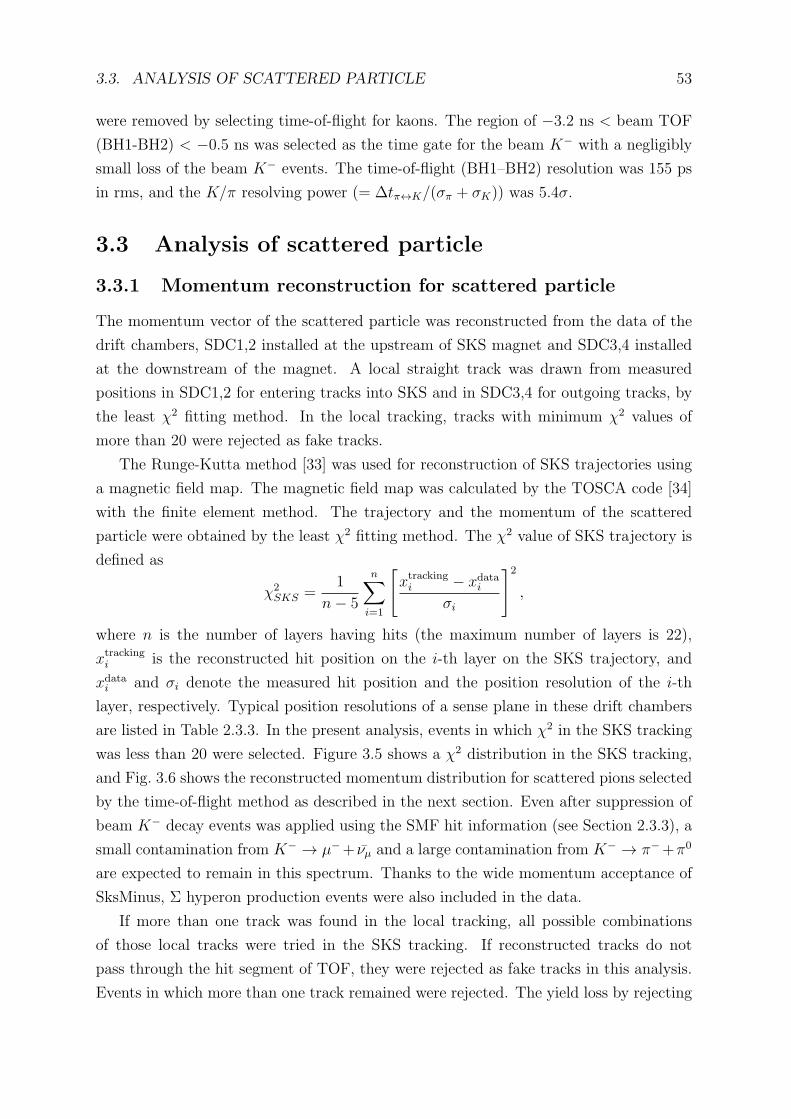
3.3. ANALYSIS OF SCATTERED PARTICLE 53
were removed by selecting time-of-flight for kaons. The region of −3.2 ns < beam TOF
(BH1-BH2) < −0.5 ns was selected as the time gate for the beam K− with a negligibly
small loss of the beam K− events. The time-of-flight (BH1–BH2) resolution was 155 ps
in rms, and the K/π resolving power (= ∆tπ↔K/(σπ + σK)) was 5.4σ.
3.3 Analysis of scattered particle
3.3.1 Momentum reconstruction for scattered particle
The momentum vector of the scattered particle was reconstructed from the data of the
drift chambers, SDC1,2 installed at the upstream of SKS magnet and SDC3,4 installed
at the downstream of the magnet. A local straight track was drawn from measured
positions in SDC1,2 for entering tracks into SKS and in SDC3,4 for outgoing tracks, by
the least χ2 fitting method. In the local tracking, tracks with minimum χ2 values of
more than 20 were rejected as fake tracks.
The Runge-Kutta method [33] was used for reconstruction of SKS trajectories using
a magnetic field map. The magnetic field map was calculated by the TOSCA code [34]
with the finite element method. The trajectory and the momentum of the scattered
particle were obtained by the least χ2 fitting method. The χ2 value of SKS trajectory is
defined as
χ2SKS =
1
n− 5
n∑i=1
[xtrackingi − xdata
i
σi
]2
,
where n is the number of layers having hits (the maximum number of layers is 22),
xtrackingi is the reconstructed hit position on the i-th layer on the SKS trajectory, and
xdatai and σi denote the measured hit position and the position resolution of the i-th
layer, respectively. Typical position resolutions of a sense plane in these drift chambers
are listed in Table 2.3.3. In the present analysis, events in which χ2 in the SKS tracking
was less than 20 were selected. Figure 3.5 shows a χ2 distribution in the SKS tracking,
and Fig. 3.6 shows the reconstructed momentum distribution for scattered pions selected
by the time-of-flight method as described in the next section. Even after suppression of
beam K− decay events was applied using the SMF hit information (see Section 2.3.3), a
small contamination from K− → µ−+ νµ and a large contamination from K− → π−+π0
are expected to remain in this spectrum. Thanks to the wide momentum acceptance of
SksMinus, Σ hyperon production events were also included in the data.
If more than one track was found in the local tracking, all possible combinations
of those local tracks were tried in the SKS tracking. If reconstructed tracks do not
pass through the hit segment of TOF, they were rejected as fake tracks in this analysis.
Events in which more than one track remained were rejected. The yield loss by rejecting
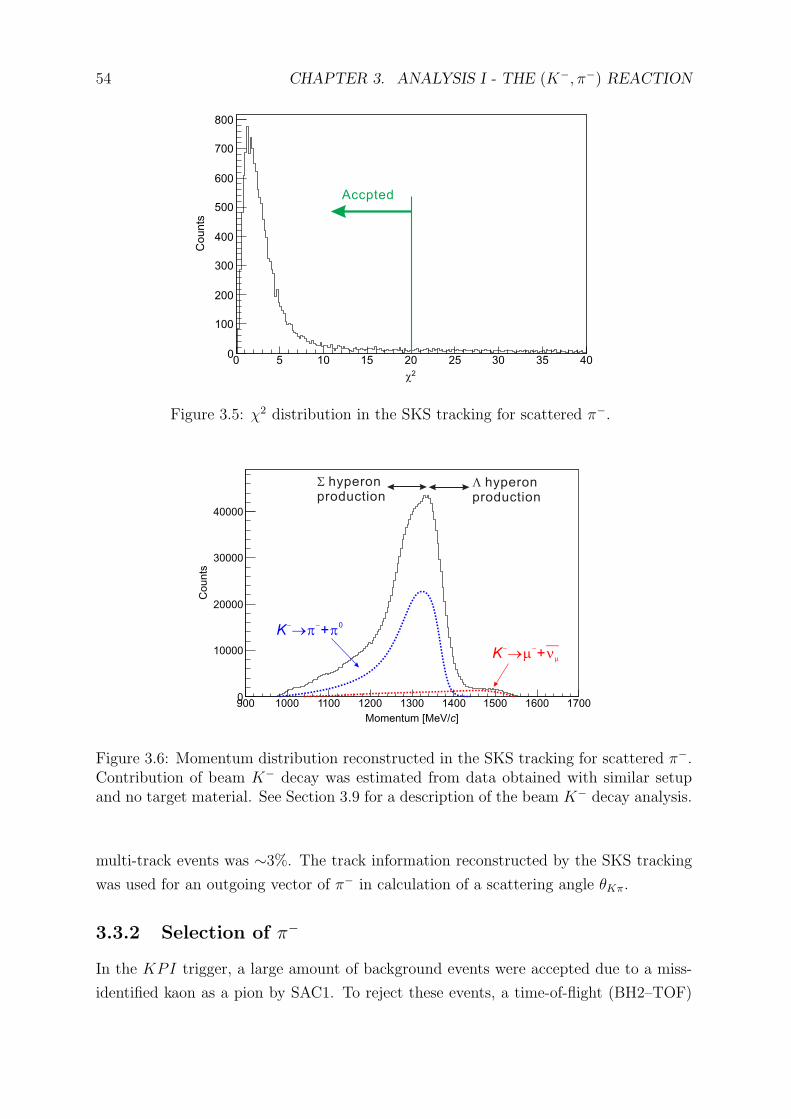
54 CHAPTER 3. ANALYSIS I - THE (K−, π−) REACTION
2c
0 5 10 15 20 25 30 35 40
Co
un
ts
0
100
200
300
400
500
600
700
800
Accpted
Figure 3.5: χ2 distribution in the SKS tracking for scattered π−.
Momentum [MeV/ ]c
900 1000 1100 1200 1300 1400 1500 1600 1700
Counts
0
10000
20000
30000
40000
K- -®p p+
0
K- -®m +nm
L hyperonproduction
S hyperonproduction
Figure 3.6: Momentum distribution reconstructed in the SKS tracking for scattered π−.Contribution of beam K− decay was estimated from data obtained with similar setupand no target material. See Section 3.9 for a description of the beam K− decay analysis.
multi-track events was ∼3%. The track information reconstructed by the SKS tracking
was used for an outgoing vector of π− in calculation of a scattering angle θKπ.
3.3.2 Selection of π−
In the KPI trigger, a large amount of background events were accepted due to a miss-
identified kaon as a pion by SAC1. To reject these events, a time-of-flight (BH2–TOF)
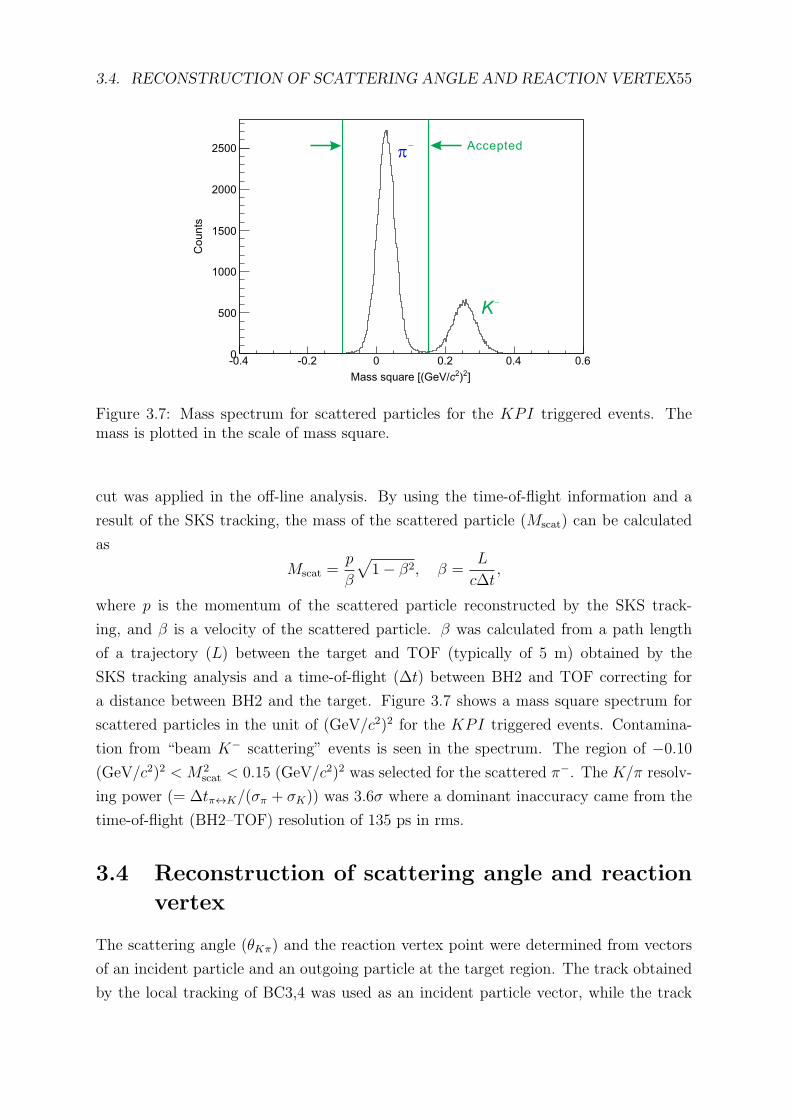
3.4. RECONSTRUCTION OF SCATTERING ANGLE AND REACTION VERTEX55
]2)2Mass square [(GeV/c
-0.4 -0.2 0 0.2 0.4 0.6
Co
un
ts
0
500
1000
1500
2000
2500
K-
p- Accepted
Figure 3.7: Mass spectrum for scattered particles for the KPI triggered events. Themass is plotted in the scale of mass square.
cut was applied in the off-line analysis. By using the time-of-flight information and a
result of the SKS tracking, the mass of the scattered particle (Mscat) can be calculated
as
Mscat =p
β
√1− β2, β =
L
c∆t,
where p is the momentum of the scattered particle reconstructed by the SKS track-
ing, and β is a velocity of the scattered particle. β was calculated from a path length
of a trajectory (L) between the target and TOF (typically of 5 m) obtained by the
SKS tracking analysis and a time-of-flight (∆t) between BH2 and TOF correcting for
a distance between BH2 and the target. Figure 3.7 shows a mass square spectrum for
scattered particles in the unit of (GeV/c2)2 for the KPI triggered events. Contamina-
tion from “beam K− scattering” events is seen in the spectrum. The region of −0.10
(GeV/c2)2 < M2scat < 0.15 (GeV/c2)2 was selected for the scattered π−. The K/π resolv-
ing power (= ∆tπ↔K/(σπ + σK)) was 3.6σ where a dominant inaccuracy came from the
time-of-flight (BH2–TOF) resolution of 135 ps in rms.
3.4 Reconstruction of scattering angle and reaction
vertex
The scattering angle (θKπ) and the reaction vertex point were determined from vectors
of an incident particle and an outgoing particle at the target region. The track obtained
by the local tracking of BC3,4 was used as an incident particle vector, while the track
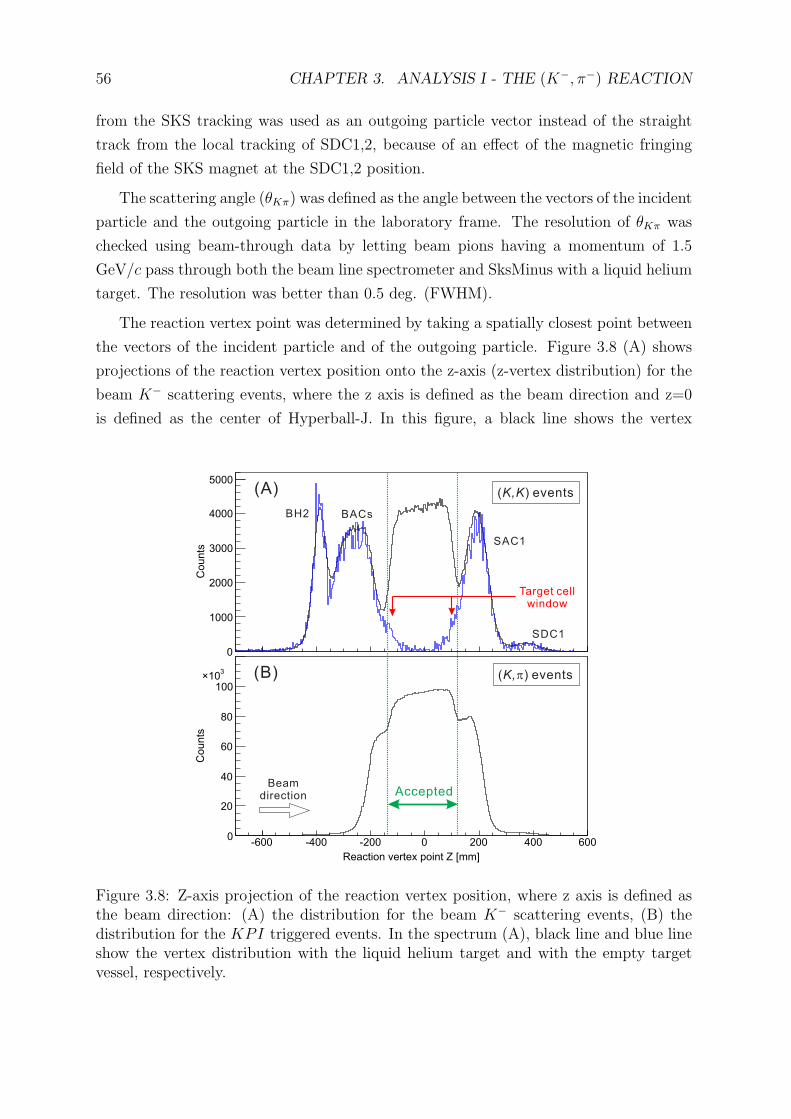
56 CHAPTER 3. ANALYSIS I - THE (K−, π−) REACTION
from the SKS tracking was used as an outgoing particle vector instead of the straight
track from the local tracking of SDC1,2, because of an effect of the magnetic fringing
field of the SKS magnet at the SDC1,2 position.
The scattering angle (θKπ) was defined as the angle between the vectors of the incident
particle and the outgoing particle in the laboratory frame. The resolution of θKπ was
checked using beam-through data by letting beam pions having a momentum of 1.5
GeV/c pass through both the beam line spectrometer and SksMinus with a liquid helium
target. The resolution was better than 0.5 deg. (FWHM).
The reaction vertex point was determined by taking a spatially closest point between
the vectors of the incident particle and of the outgoing particle. Figure 3.8 (A) shows
projections of the reaction vertex position onto the z-axis (z-vertex distribution) for the
beam K− scattering events, where the z axis is defined as the beam direction and z=0
is defined as the center of Hyperball-J. In this figure, a black line shows the vertex
0
Co
un
ts
1000
2000
3000
4000
5000
Reaction vertex point Z [mm]
-600 -400 -200 0 200 400 600
Co
un
ts
0
20
40
60
80
100
310×
( ) eventsK,K
SAC1
(A)
BACsBH2
SDC1
( ) eventsK,p
AcceptedBeam
direction
(B)
Target cellwindow
Figure 3.8: Z-axis projection of the reaction vertex position, where z axis is defined asthe beam direction: (A) the distribution for the beam K− scattering events, (B) thedistribution for the KPI triggered events. In the spectrum (A), black line and blue lineshow the vertex distribution with the liquid helium target and with the empty targetvessel, respectively.
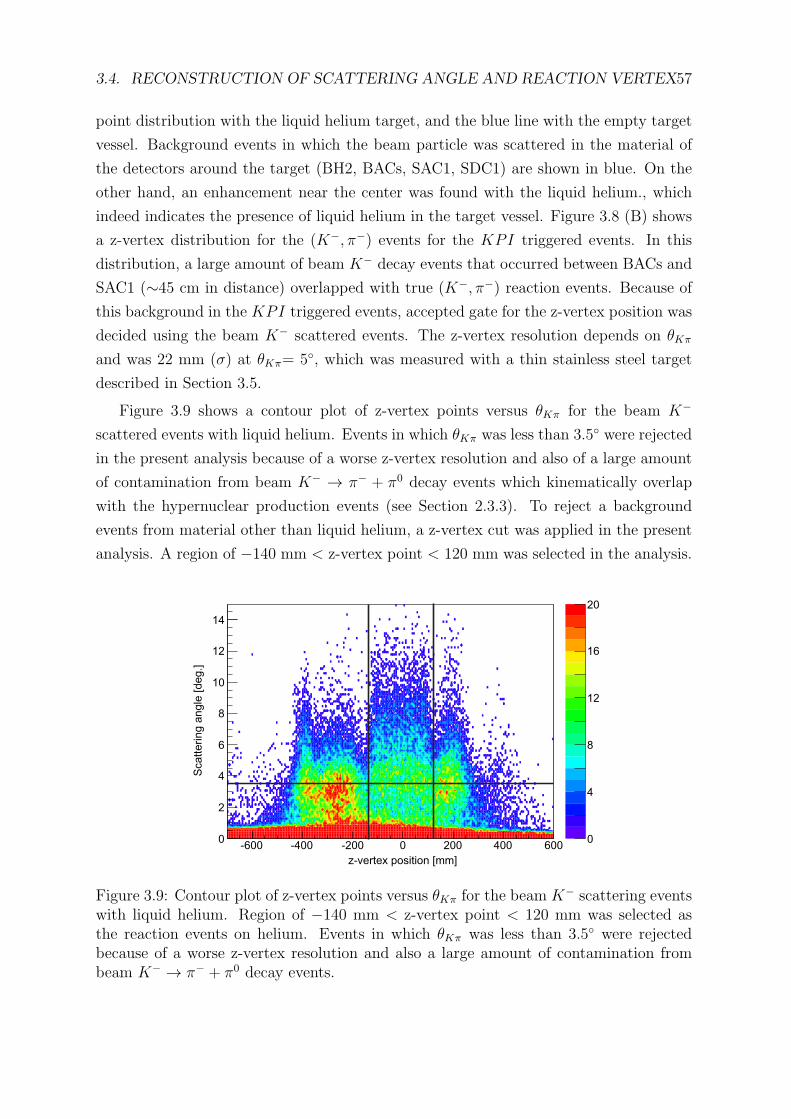
3.4. RECONSTRUCTION OF SCATTERING ANGLE AND REACTION VERTEX57
point distribution with the liquid helium target, and the blue line with the empty target
vessel. Background events in which the beam particle was scattered in the material of
the detectors around the target (BH2, BACs, SAC1, SDC1) are shown in blue. On the
other hand, an enhancement near the center was found with the liquid helium., which
indeed indicates the presence of liquid helium in the target vessel. Figure 3.8 (B) shows
a z-vertex distribution for the (K−, π−) events for the KPI triggered events. In this
distribution, a large amount of beam K− decay events that occurred between BACs and
SAC1 (∼45 cm in distance) overlapped with true (K−, π−) reaction events. Because of
this background in the KPI triggered events, accepted gate for the z-vertex position was
decided using the beam K− scattered events. The z-vertex resolution depends on θKπ
and was 22 mm (σ) at θKπ= 5◦, which was measured with a thin stainless steel target
described in Section 3.5.
Figure 3.9 shows a contour plot of z-vertex points versus θKπ for the beam K−
scattered events with liquid helium. Events in which θKπ was less than 3.5◦ were rejected
in the present analysis because of a worse z-vertex resolution and also of a large amount
of contamination from beam K− → π− + π0 decay events which kinematically overlap
with the hypernuclear production events (see Section 2.3.3). To reject a background
events from material other than liquid helium, a z-vertex cut was applied in the present
analysis. A region of −140 mm < z-vertex point < 120 mm was selected in the analysis.
z-v ex position [mm]ert
-600 -400 -200 0 200 400 600
Scattering a
ngle
[deg.]
0
2
4
6
8
10
12
14
0
4
8
12
16
20
Figure 3.9: Contour plot of z-vertex points versus θKπ for the beam K− scattering eventswith liquid helium. Region of −140 mm < z-vertex point < 120 mm was selected asthe reaction events on helium. Events in which θKπ was less than 3.5◦ were rejectedbecause of a worse z-vertex resolution and also a large amount of contamination frombeam K− → π− + π0 decay events.
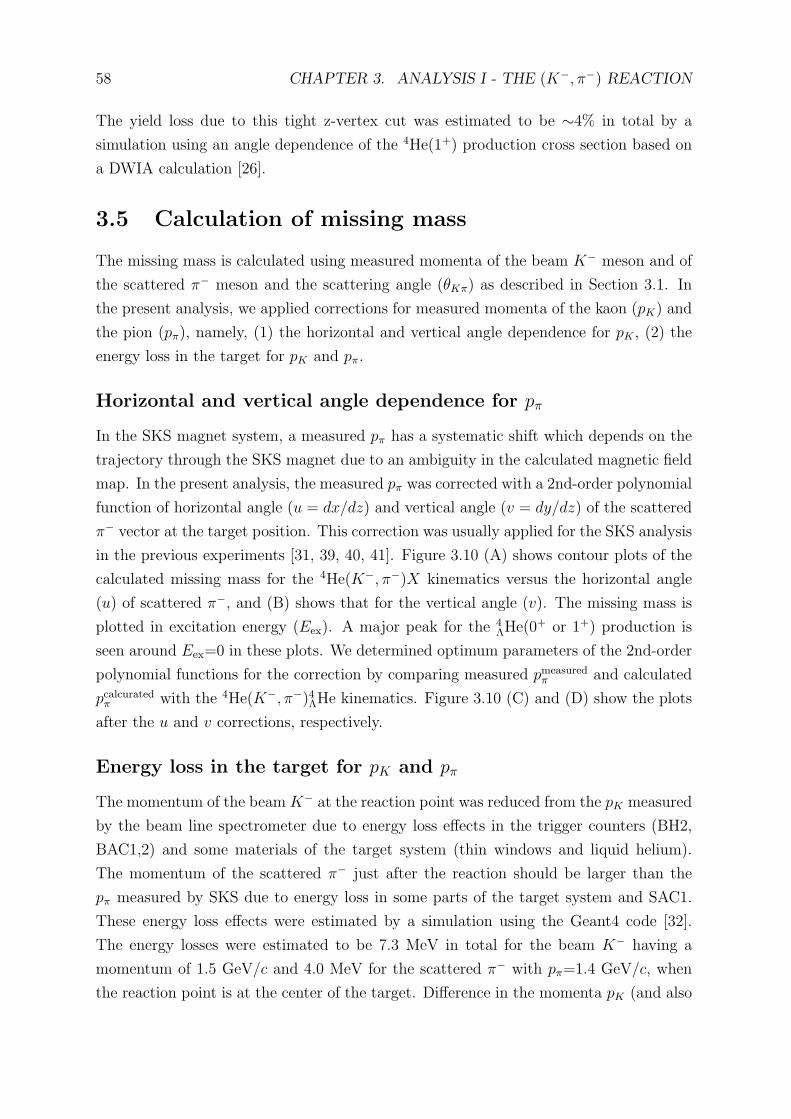
58 CHAPTER 3. ANALYSIS I - THE (K−, π−) REACTION
The yield loss due to this tight z-vertex cut was estimated to be ∼4% in total by a
simulation using an angle dependence of the 4He(1+) production cross section based on
a DWIA calculation [26].
3.5 Calculation of missing mass
The missing mass is calculated using measured momenta of the beam K− meson and of
the scattered π− meson and the scattering angle (θKπ) as described in Section 3.1. In
the present analysis, we applied corrections for measured momenta of the kaon (pK) and
the pion (pπ), namely, (1) the horizontal and vertical angle dependence for pK , (2) the
energy loss in the target for pK and pπ.
Horizontal and vertical angle dependence for pπ
In the SKS magnet system, a measured pπ has a systematic shift which depends on the
trajectory through the SKS magnet due to an ambiguity in the calculated magnetic field
map. In the present analysis, the measured pπ was corrected with a 2nd-order polynomial
function of horizontal angle (u = dx/dz) and vertical angle (v = dy/dz) of the scattered
π− vector at the target position. This correction was usually applied for the SKS analysis
in the previous experiments [31, 39, 40, 41]. Figure 3.10 (A) shows contour plots of the
calculated missing mass for the 4He(K−, π−)X kinematics versus the horizontal angle
(u) of scattered π−, and (B) shows that for the vertical angle (v). The missing mass is
plotted in excitation energy (Eex). A major peak for the 4ΛHe(0
+ or 1+) production is
seen around Eex=0 in these plots. We determined optimum parameters of the 2nd-order
polynomial functions for the correction by comparing measured pmeasuredπ and calculated
pcalcuratedπ with the 4He(K−, π−)4ΛHe kinematics. Figure 3.10 (C) and (D) show the plots
after the u and v corrections, respectively.
Energy loss in the target for pK and pπ
The momentum of the beamK− at the reaction point was reduced from the pK measured
by the beam line spectrometer due to energy loss effects in the trigger counters (BH2,
BAC1,2) and some materials of the target system (thin windows and liquid helium).
The momentum of the scattered π− just after the reaction should be larger than the
pπ measured by SKS due to energy loss in some parts of the target system and SAC1.
These energy loss effects were estimated by a simulation using the Geant4 code [32].
The energy losses were estimated to be 7.3 MeV in total for the beam K− having a
momentum of 1.5 GeV/c and 4.0 MeV for the scattered π− with pπ=1.4 GeV/c, when
the reaction point is at the center of the target. Difference in the momenta pK (and also
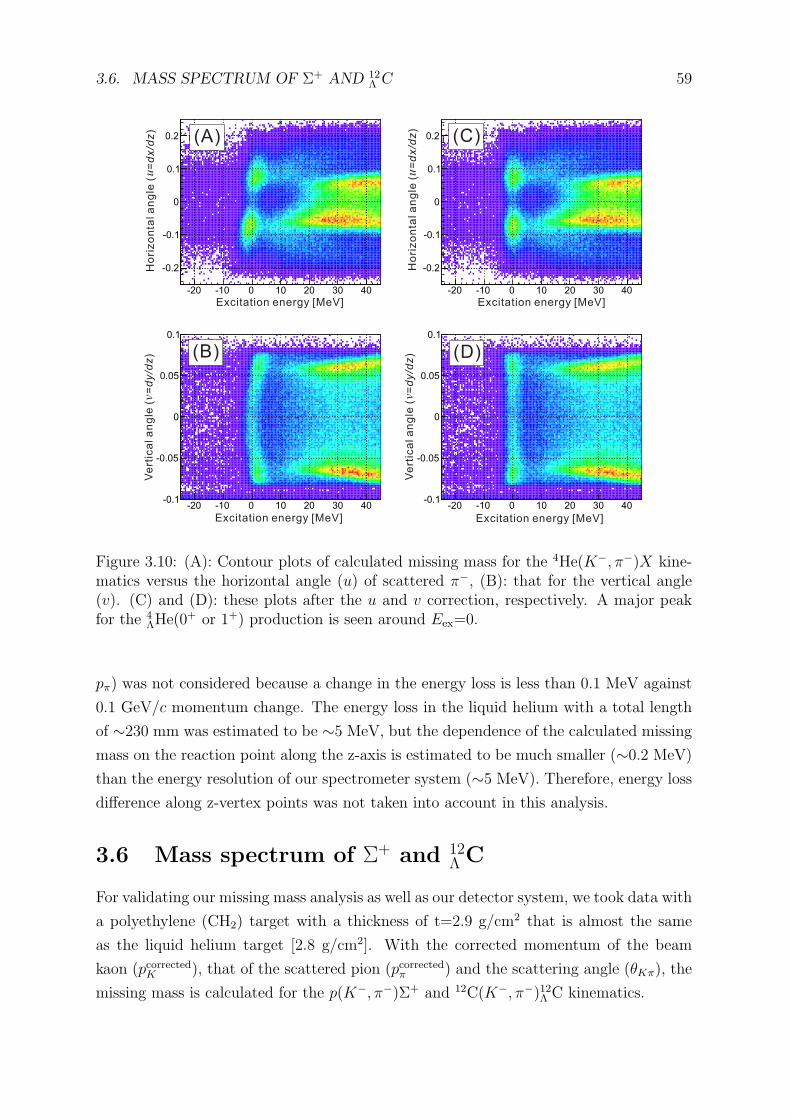
3.6. MASS SPECTRUM OF Σ+ AND 12Λ C 59
-20 -10 0 10 20 30 40
-0.2
-0.1
0
0.1
0.2
-20 -10 0 10 20 30 40
-0.2
-0.1
0
0.1
0.2
-20 -10 0 10 20 30 40-0.1
-0.05
0
0.05
0.1
-20 -10 0 10 20 30 40-0.1
-0.05
0
0.05
0.1
Excitation energy [MeV] Excitation energy [MeV]
Excitation energy [MeV] Excitation energy [MeV]
Ve
rtic
al a
ng
le (
)v=
dy/d
z
Ve
rtic
al a
ng
le (
)v=
dy/d
z
Ho
rizo
nta
l a
ng
le (
)u
=d
x/d
z
Ho
rizo
nta
l a
ng
le (
)u
=d
x/d
z
(D)
(A)
(B)
(C)u u
v v
Figure 3.10: (A): Contour plots of calculated missing mass for the 4He(K−, π−)X kine-matics versus the horizontal angle (u) of scattered π−, (B): that for the vertical angle(v). (C) and (D): these plots after the u and v correction, respectively. A major peakfor the 4
ΛHe(0+ or 1+) production is seen around Eex=0.
pπ) was not considered because a change in the energy loss is less than 0.1 MeV against
0.1 GeV/c momentum change. The energy loss in the liquid helium with a total length
of ∼230 mm was estimated to be ∼5 MeV, but the dependence of the calculated missing
mass on the reaction point along the z-axis is estimated to be much smaller (∼0.2 MeV)
than the energy resolution of our spectrometer system (∼5 MeV). Therefore, energy loss
difference along z-vertex points was not taken into account in this analysis.
3.6 Mass spectrum of Σ+ and 12Λ C
For validating our missing mass analysis as well as our detector system, we took data with
a polyethylene (CH2) target with a thickness of t=2.9 g/cm2 that is almost the same
as the liquid helium target [2.8 g/cm2]. With the corrected momentum of the beam
kaon (pcorrectedK ), that of the scattered pion (pcorrectedπ ) and the scattering angle (θKπ), the
missing mass is calculated for the p(K−, π−)Σ+ and 12C(K−, π−)12Λ C kinematics.
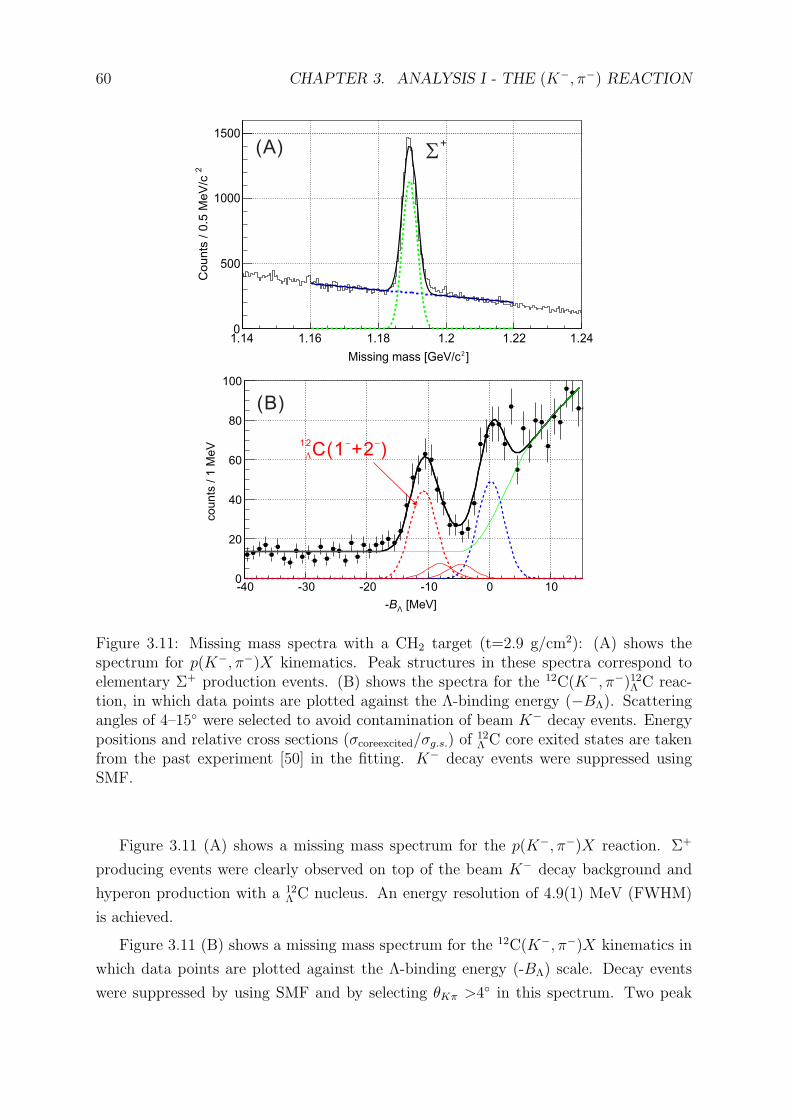
60 CHAPTER 3. ANALYSIS I - THE (K−, π−) REACTION
co
un
ts /
1 M
eV
0
20
40
60
80
100
[MeV]Λ-B
-40 -30 -20 -10 0 10
2C
ounts
/ 0
.5 M
eV
/c
0
500
1000
1500
]2Missing mass [GeV/c
1.14 1.16 1.18 1.2 1.22 1.24
( )A
( )B
S+
12C(1 +2 )
- -
L
Figure 3.11: Missing mass spectra with a CH2 target (t=2.9 g/cm2): (A) shows thespectrum for p(K−, π−)X kinematics. Peak structures in these spectra correspond toelementary Σ+ production events. (B) shows the spectra for the 12C(K−, π−)12Λ C reac-tion, in which data points are plotted against the Λ-binding energy (−BΛ). Scatteringangles of 4–15◦ were selected to avoid contamination of beam K− decay events. Energypositions and relative cross sections (σcoreexcited/σg.s.) of
12Λ C core exited states are taken
from the past experiment [50] in the fitting. K− decay events were suppressed usingSMF.
Figure 3.11 (A) shows a missing mass spectrum for the p(K−, π−)X reaction. Σ+
producing events were clearly observed on top of the beam K− decay background and
hyperon production with a 12Λ C nucleus. An energy resolution of 4.9(1) MeV (FWHM)
is achieved.
Figure 3.11 (B) shows a missing mass spectrum for the 12C(K−, π−)X kinematics in
which data points are plotted against the Λ-binding energy (-BΛ) scale. Decay events
were suppressed by using SMF and by selecting θKπ >4◦ in this spectrum. Two peak
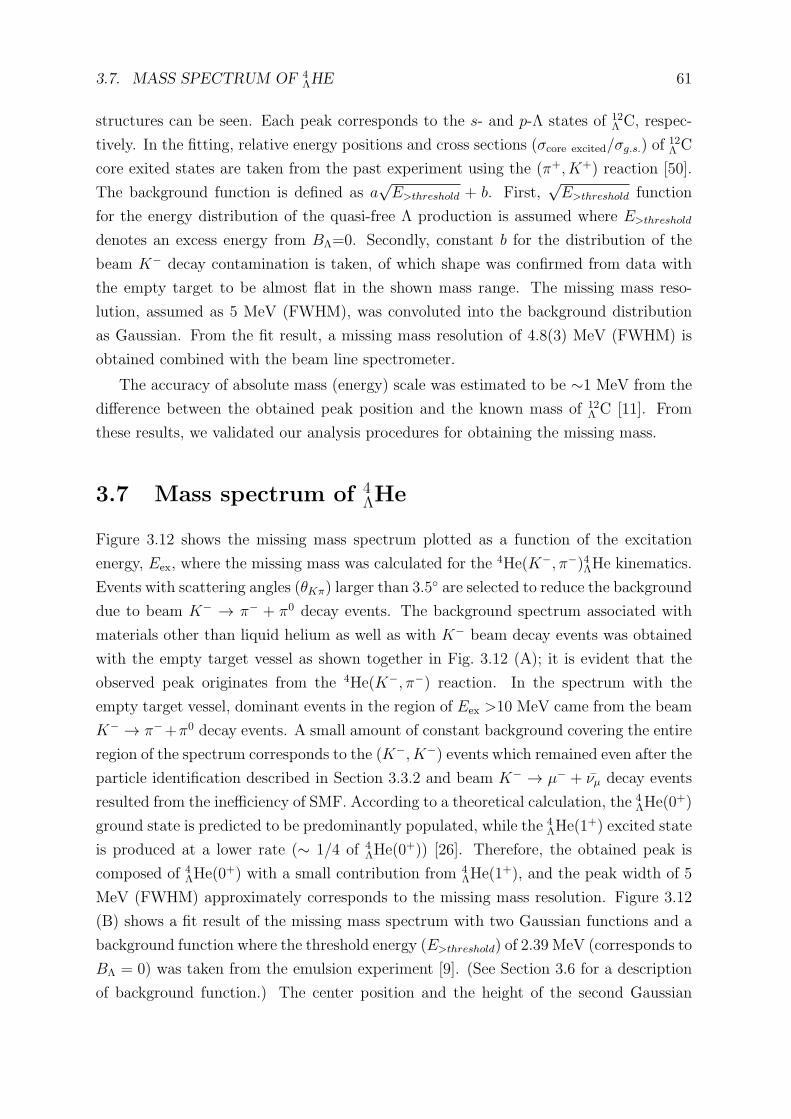
3.7. MASS SPECTRUM OF 4ΛHE 61
structures can be seen. Each peak corresponds to the s- and p-Λ states of 12Λ C, respec-
tively. In the fitting, relative energy positions and cross sections (σcore excited/σg.s.) of12Λ C
core exited states are taken from the past experiment using the (π+, K+) reaction [50].
The background function is defined as a√E>threshold + b. First,
√E>threshold function
for the energy distribution of the quasi-free Λ production is assumed where E>threshold
denotes an excess energy from BΛ=0. Secondly, constant b for the distribution of the
beam K− decay contamination is taken, of which shape was confirmed from data with
the empty target to be almost flat in the shown mass range. The missing mass reso-
lution, assumed as 5 MeV (FWHM), was convoluted into the background distribution
as Gaussian. From the fit result, a missing mass resolution of 4.8(3) MeV (FWHM) is
obtained combined with the beam line spectrometer.
The accuracy of absolute mass (energy) scale was estimated to be ∼1 MeV from the
difference between the obtained peak position and the known mass of 12Λ C [11]. From
these results, we validated our analysis procedures for obtaining the missing mass.
3.7 Mass spectrum of 4ΛHe
Figure 3.12 shows the missing mass spectrum plotted as a function of the excitation
energy, Eex, where the missing mass was calculated for the 4He(K−, π−)4ΛHe kinematics.
Events with scattering angles (θKπ) larger than 3.5◦ are selected to reduce the background
due to beam K− → π− + π0 decay events. The background spectrum associated with
materials other than liquid helium as well as with K− beam decay events was obtained
with the empty target vessel as shown together in Fig. 3.12 (A); it is evident that the
observed peak originates from the 4He(K−, π−) reaction. In the spectrum with the
empty target vessel, dominant events in the region of Eex >10 MeV came from the beam
K− → π−+π0 decay events. A small amount of constant background covering the entire
region of the spectrum corresponds to the (K−, K−) events which remained even after the
particle identification described in Section 3.3.2 and beam K− → µ− + νµ decay events
resulted from the inefficiency of SMF. According to a theoretical calculation, the 4ΛHe(0
+)
ground state is predicted to be predominantly populated, while the 4ΛHe(1
+) excited state
is produced at a lower rate (∼ 1/4 of 4ΛHe(0
+)) [26]. Therefore, the obtained peak is
composed of 4ΛHe(0
+) with a small contribution from 4ΛHe(1
+), and the peak width of 5
MeV (FWHM) approximately corresponds to the missing mass resolution. Figure 3.12
(B) shows a fit result of the missing mass spectrum with two Gaussian functions and a
background function where the threshold energy (E>threshold) of 2.39 MeV (corresponds to
BΛ = 0) was taken from the emulsion experiment [9]. (See Section 3.6 for a description
of background function.) The center position and the height of the second Gaussian
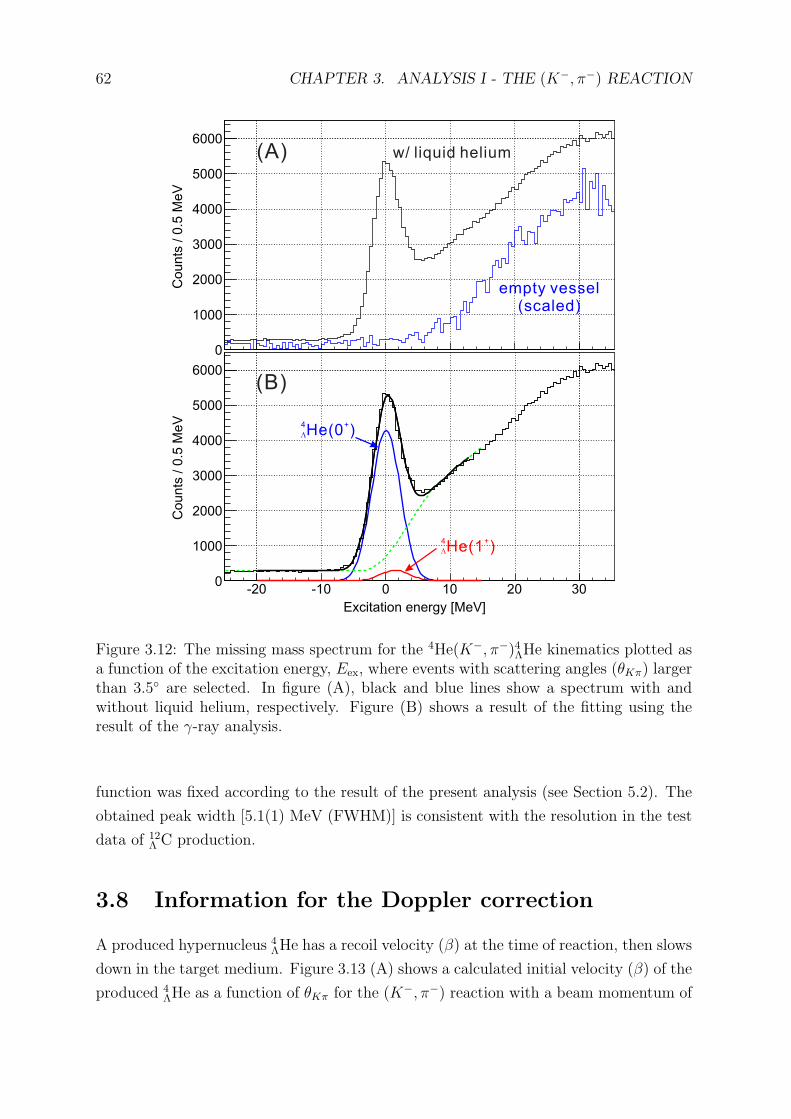
62 CHAPTER 3. ANALYSIS I - THE (K−, π−) REACTION
Co
un
ts /
0.5
Me
V
0
1000
2000
3000
4000
5000
6000
Excitation energy [MeV]
-20 -10 0 10 20 30
Co
un
ts /
0.5
Me
V
0
1000
2000
3000
4000
5000
6000
w/ liquid helium
empty vessel(scaled)
4 +He(0 )
4 +He(1 )L
L
(A)
(B)
Figure 3.12: The missing mass spectrum for the 4He(K−, π−)4ΛHe kinematics plotted asa function of the excitation energy, Eex, where events with scattering angles (θKπ) largerthan 3.5◦ are selected. In figure (A), black and blue lines show a spectrum with andwithout liquid helium, respectively. Figure (B) shows a result of the fitting using theresult of the γ-ray analysis.
function was fixed according to the result of the present analysis (see Section 5.2). The
obtained peak width [5.1(1) MeV (FWHM)] is consistent with the resolution in the test
data of 12Λ C production.
3.8 Information for the Doppler correction
A produced hypernucleus 4ΛHe has a recoil velocity (β) at the time of reaction, then slows
down in the target medium. Figure 3.13 (A) shows a calculated initial velocity (β) of the
produced 4ΛHe as a function of θKπ for the (K−, π−) reaction with a beam momentum of
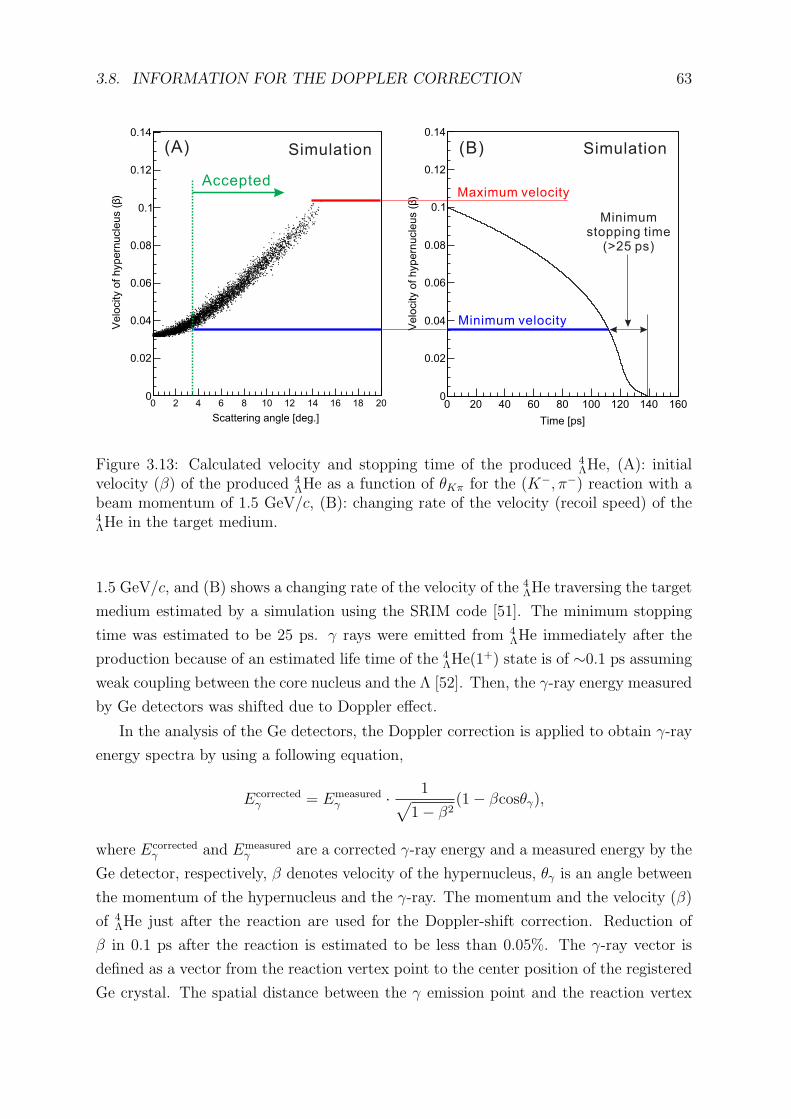
3.8. INFORMATION FOR THE DOPPLER CORRECTION 63
Time [ps]
0 20 40 60 80 100 120 140 160)
βV
elo
city o
f h
yp
ern
ucle
us (
0
0.02
0.04
0.06
0.08
0.1
0.12
0.14
Minimumstopping time
(>25 ps)
Minimum velocity
Maximum velocity
(B)
Scattering angle [deg.]
0 2 4 6 8 10 12 14 16 18 200
0.02
0.04
0.06
0.08
0.1
0.12
0.14
)β
Ve
locity o
f h
yp
ern
ucle
us (
(A)
Accepted
Simulation Simulation
Figure 3.13: Calculated velocity and stopping time of the produced 4ΛHe, (A): initial
velocity (β) of the produced 4ΛHe as a function of θKπ for the (K−, π−) reaction with a
beam momentum of 1.5 GeV/c, (B): changing rate of the velocity (recoil speed) of the4ΛHe in the target medium.
1.5 GeV/c, and (B) shows a changing rate of the velocity of the 4ΛHe traversing the target
medium estimated by a simulation using the SRIM code [51]. The minimum stopping
time was estimated to be 25 ps. γ rays were emitted from 4ΛHe immediately after the
production because of an estimated life time of the 4ΛHe(1
+) state is of ∼0.1 ps assuming
weak coupling between the core nucleus and the Λ [52]. Then, the γ-ray energy measured
by Ge detectors was shifted due to Doppler effect.
In the analysis of the Ge detectors, the Doppler correction is applied to obtain γ-ray
energy spectra by using a following equation,
Ecorrectedγ = Emeasured
γ · 1√1− β2
(1− βcosθγ),
where Ecorrectedγ and Emeasured
γ are a corrected γ-ray energy and a measured energy by the
Ge detector, respectively, β denotes velocity of the hypernucleus, θγ is an angle between
the momentum of the hypernucleus and the γ-ray. The momentum and the velocity (β)
of 4ΛHe just after the reaction are used for the Doppler-shift correction. Reduction of
β in 0.1 ps after the reaction is estimated to be less than 0.05%. The γ-ray vector is
defined as a vector from the reaction vertex point to the center position of the registered
Ge crystal. The spatial distance between the γ emission point and the reaction vertex
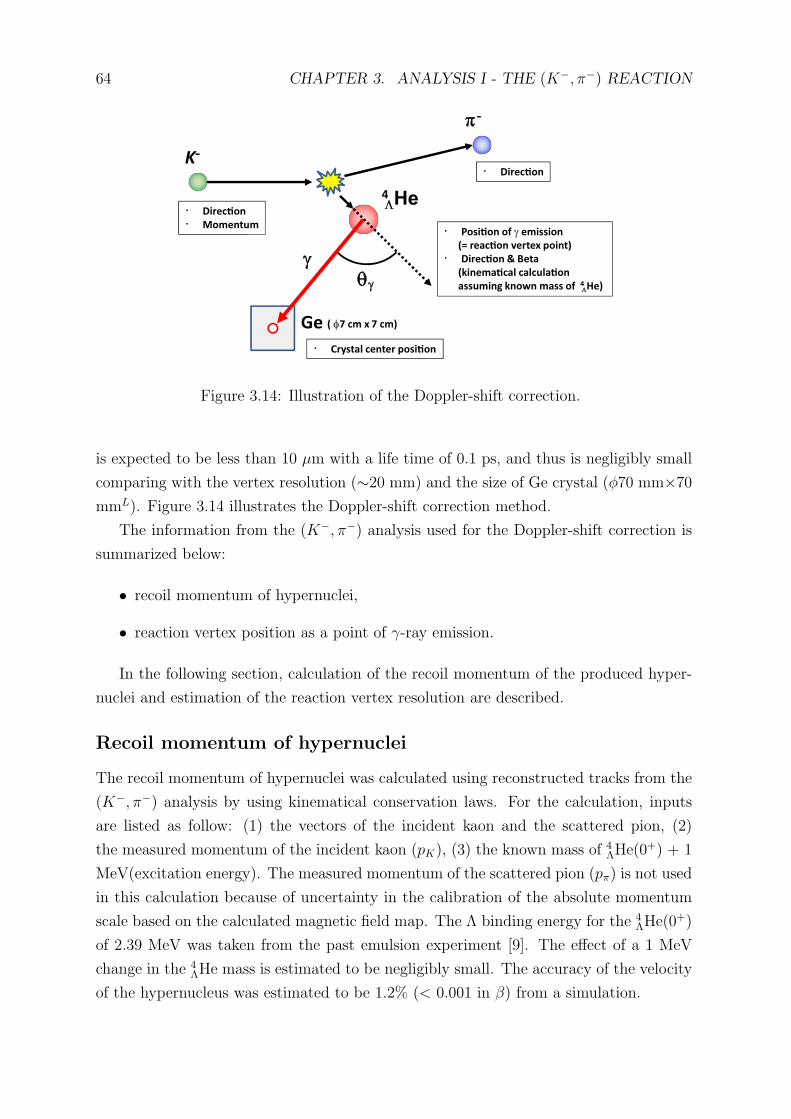
64 CHAPTER 3. ANALYSIS I - THE (K−, π−) REACTION
・ Direc!on
・ Momentum
K-
p -
・ Direc!on
・ Posi!on of emissiong
(= vertex point)reac!on
・ Direc!on & Beta
(kinema!cal calcula!on
assuming known mass of 4LHe)
4LHe
gqg
・ Crystal center posi!on
Ge ( 7 cmf x 7 cm)
Figure 3.14: Illustration of the Doppler-shift correction.
is expected to be less than 10 µm with a life time of 0.1 ps, and thus is negligibly small
comparing with the vertex resolution (∼20 mm) and the size of Ge crystal (ϕ70 mm×70
mmL). Figure 3.14 illustrates the Doppler-shift correction method.
The information from the (K−, π−) analysis used for the Doppler-shift correction is
summarized below:
• recoil momentum of hypernuclei,
• reaction vertex position as a point of γ-ray emission.
In the following section, calculation of the recoil momentum of the produced hyper-
nuclei and estimation of the reaction vertex resolution are described.
Recoil momentum of hypernuclei
The recoil momentum of hypernuclei was calculated using reconstructed tracks from the
(K−, π−) analysis by using kinematical conservation laws. For the calculation, inputs
are listed as follow: (1) the vectors of the incident kaon and the scattered pion, (2)
the measured momentum of the incident kaon (pK), (3) the known mass of 4ΛHe(0
+) + 1
MeV(excitation energy). The measured momentum of the scattered pion (pπ) is not used
in this calculation because of uncertainty in the calibration of the absolute momentum
scale based on the calculated magnetic field map. The Λ binding energy for the 4ΛHe(0
+)
of 2.39 MeV was taken from the past emulsion experiment [9]. The effect of a 1 MeV
change in the 4ΛHe mass is estimated to be negligibly small. The accuracy of the velocity
of the hypernucleus was estimated to be 1.2% (< 0.001 in β) from a simulation.
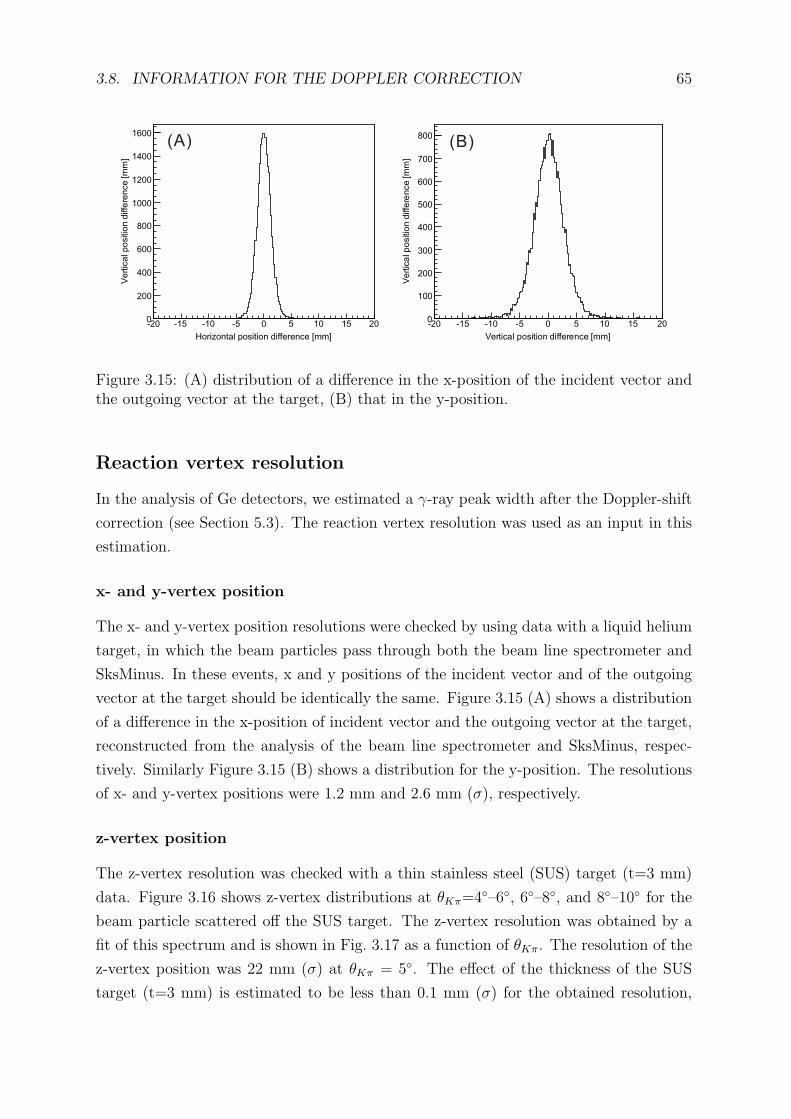
3.8. INFORMATION FOR THE DOPPLER CORRECTION 65
Horizontal position difference [mm]
-20 -15 -10 -5 0 5 10 15 20
Ve
rtic
alpo
sitio
ndiff
ere
nce
[mm
]
0
200
400
600
800
1000
1200
1400
1600
Vertical position difference [mm]
-20 -15 -10 -5 0 5 10 15 20
Ve
rtic
alp
ositio
ndiff
ere
nce
[mm
]
0
100
200
300
400
500
600
700
800(A) (B)
Figure 3.15: (A) distribution of a difference in the x-position of the incident vector andthe outgoing vector at the target, (B) that in the y-position.
Reaction vertex resolution
In the analysis of Ge detectors, we estimated a γ-ray peak width after the Doppler-shift
correction (see Section 5.3). The reaction vertex resolution was used as an input in this
estimation.
x- and y-vertex position
The x- and y-vertex position resolutions were checked by using data with a liquid helium
target, in which the beam particles pass through both the beam line spectrometer and
SksMinus. In these events, x and y positions of the incident vector and of the outgoing
vector at the target should be identically the same. Figure 3.15 (A) shows a distribution
of a difference in the x-position of incident vector and the outgoing vector at the target,
reconstructed from the analysis of the beam line spectrometer and SksMinus, respec-
tively. Similarly Figure 3.15 (B) shows a distribution for the y-position. The resolutions
of x- and y-vertex positions were 1.2 mm and 2.6 mm (σ), respectively.
z-vertex position
The z-vertex resolution was checked with a thin stainless steel (SUS) target (t=3 mm)
data. Figure 3.16 shows z-vertex distributions at θKπ=4◦–6◦, 6◦–8◦, and 8◦–10◦ for the
beam particle scattered off the SUS target. The z-vertex resolution was obtained by a
fit of this spectrum and is shown in Fig. 3.17 as a function of θKπ. The resolution of the
z-vertex position was 22 mm (σ) at θKπ = 5◦. The effect of the thickness of the SUS
target (t=3 mm) is estimated to be less than 0.1 mm (σ) for the obtained resolution,
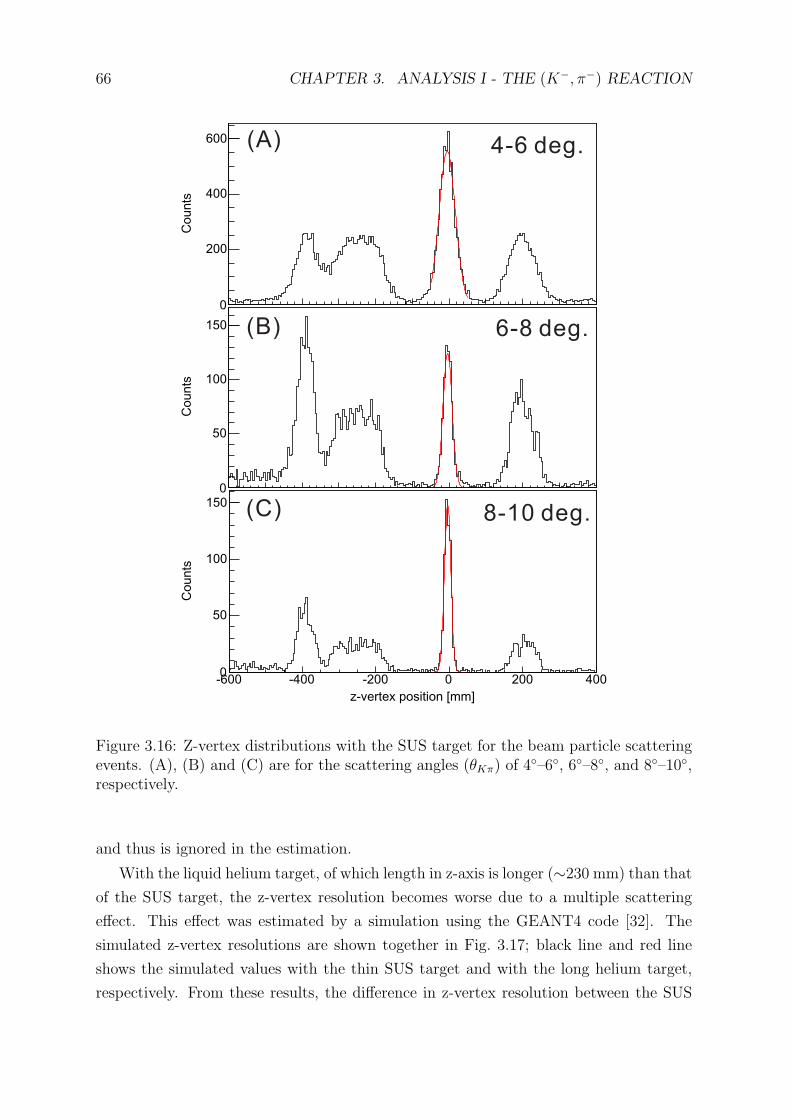
66 CHAPTER 3. ANALYSIS I - THE (K−, π−) REACTION
Co
un
ts
0
200
400
600
Co
un
ts
0
50
100
150
z-vertex position [mm]
-600 -400 -200 0 200 400
Co
un
ts
0
50
100
150
(A)
(B)
(C)
4-6 deg.
6-8 deg.
8-10 deg.
Figure 3.16: Z-vertex distributions with the SUS target for the beam particle scatteringevents. (A), (B) and (C) are for the scattering angles (θKπ) of 4
◦–6◦, 6◦–8◦, and 8◦–10◦,respectively.
and thus is ignored in the estimation.
With the liquid helium target, of which length in z-axis is longer (∼230 mm) than that
of the SUS target, the z-vertex resolution becomes worse due to a multiple scattering
effect. This effect was estimated by a simulation using the GEANT4 code [32]. The
simulated z-vertex resolutions are shown together in Fig. 3.17; black line and red line
shows the simulated values with the thin SUS target and with the long helium target,
respectively. From these results, the difference in z-vertex resolution between the SUS
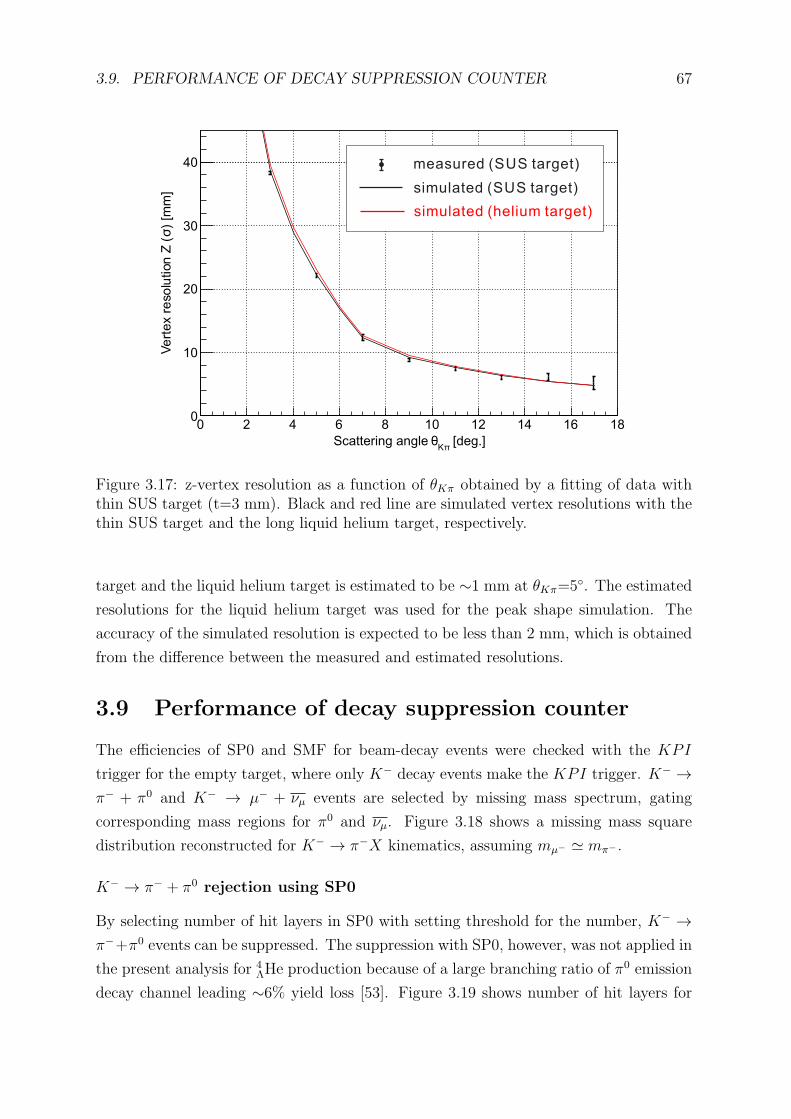
3.9. PERFORMANCE OF DECAY SUPPRESSION COUNTER 67
[deg.]πK
θScattering angle
0 2 4 6 8 10 12 14 16 18
) [m
m]
σV
ert
ex r
eso
lution
Z(
0
10
20
30
40 measured (SUS target)
simulated (SUS target)
simulated (helium target)
Figure 3.17: z-vertex resolution as a function of θKπ obtained by a fitting of data withthin SUS target (t=3 mm). Black and red line are simulated vertex resolutions with thethin SUS target and the long liquid helium target, respectively.
target and the liquid helium target is estimated to be ∼1 mm at θKπ=5◦. The estimated
resolutions for the liquid helium target was used for the peak shape simulation. The
accuracy of the simulated resolution is expected to be less than 2 mm, which is obtained
from the difference between the measured and estimated resolutions.
3.9 Performance of decay suppression counter
The efficiencies of SP0 and SMF for beam-decay events were checked with the KPI
trigger for the empty target, where only K− decay events make the KPI trigger. K− →π− + π0 and K− → µ− + νµ events are selected by missing mass spectrum, gating
corresponding mass regions for π0 and νµ. Figure 3.18 shows a missing mass square
distribution reconstructed for K− → π−X kinematics, assuming mµ− ≃ mπ− .
K− → π− + π0 rejection using SP0
By selecting number of hit layers in SP0 with setting threshold for the number, K− →π−+π0 events can be suppressed. The suppression with SP0, however, was not applied in
the present analysis for 4ΛHe production because of a large branching ratio of π0 emission
decay channel leading ∼6% yield loss [53]. Figure 3.19 shows number of hit layers for
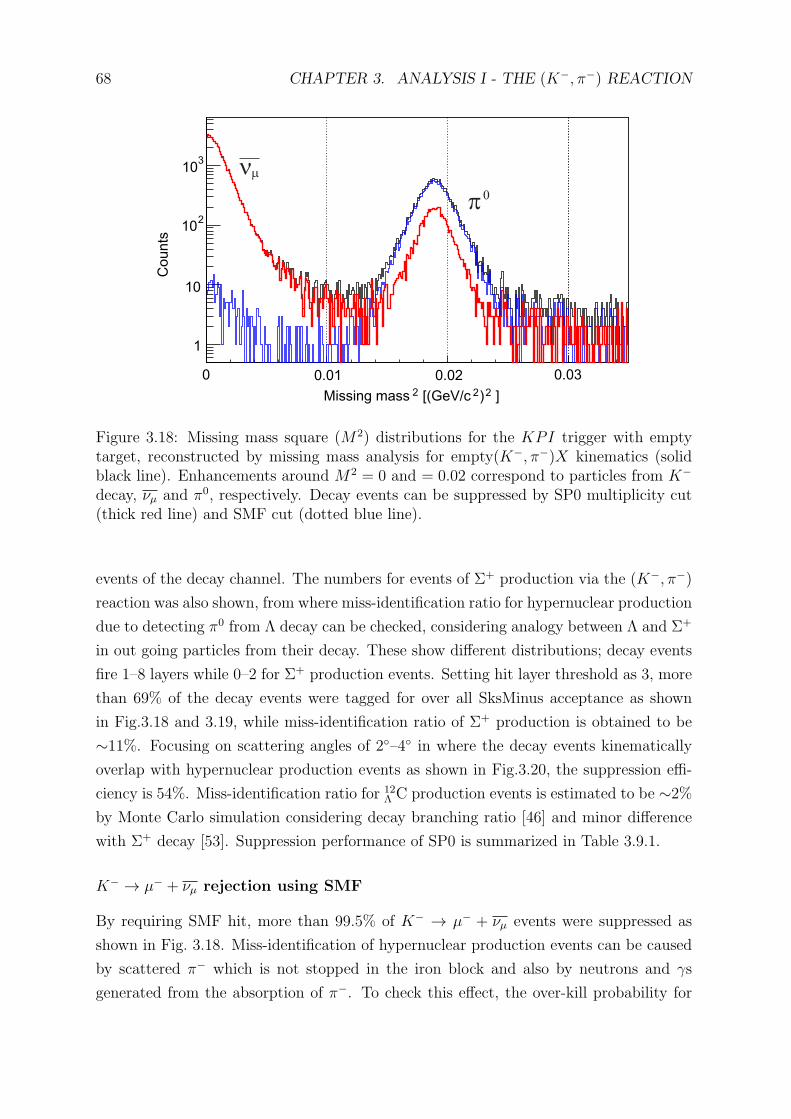
68 CHAPTER 3. ANALYSIS I - THE (K−, π−) REACTION
]2)2[(GeV/c2Missing mass
Counts
1
10
210
310
0.01 0.02 0.030
nm
p0
Figure 3.18: Missing mass square (M2) distributions for the KPI trigger with emptytarget, reconstructed by missing mass analysis for empty(K−, π−)X kinematics (solidblack line). Enhancements around M2 = 0 and = 0.02 correspond to particles from K−
decay, νµ and π0, respectively. Decay events can be suppressed by SP0 multiplicity cut(thick red line) and SMF cut (dotted blue line).
events of the decay channel. The numbers for events of Σ+ production via the (K−, π−)
reaction was also shown, from where miss-identification ratio for hypernuclear production
due to detecting π0 from Λ decay can be checked, considering analogy between Λ and Σ+
in out going particles from their decay. These show different distributions; decay events
fire 1–8 layers while 0–2 for Σ+ production events. Setting hit layer threshold as 3, more
than 69% of the decay events were tagged for over all SksMinus acceptance as shown
in Fig.3.18 and 3.19, while miss-identification ratio of Σ+ production is obtained to be
∼11%. Focusing on scattering angles of 2◦–4◦ in where the decay events kinematically
overlap with hypernuclear production events as shown in Fig.3.20, the suppression effi-
ciency is 54%. Miss-identification ratio for 12Λ C production events is estimated to be ∼2%
by Monte Carlo simulation considering decay branching ratio [46] and minor difference
with Σ+ decay [53]. Suppression performance of SP0 is summarized in Table 3.9.1.
K− → µ− + νµ rejection using SMF
By requiring SMF hit, more than 99.5% of K− → µ− + νµ events were suppressed as
shown in Fig. 3.18. Miss-identification of hypernuclear production events can be caused
by scattered π− which is not stopped in the iron block and also by neutrons and γs
generated from the absorption of π−. To check this effect, the over-kill probability for
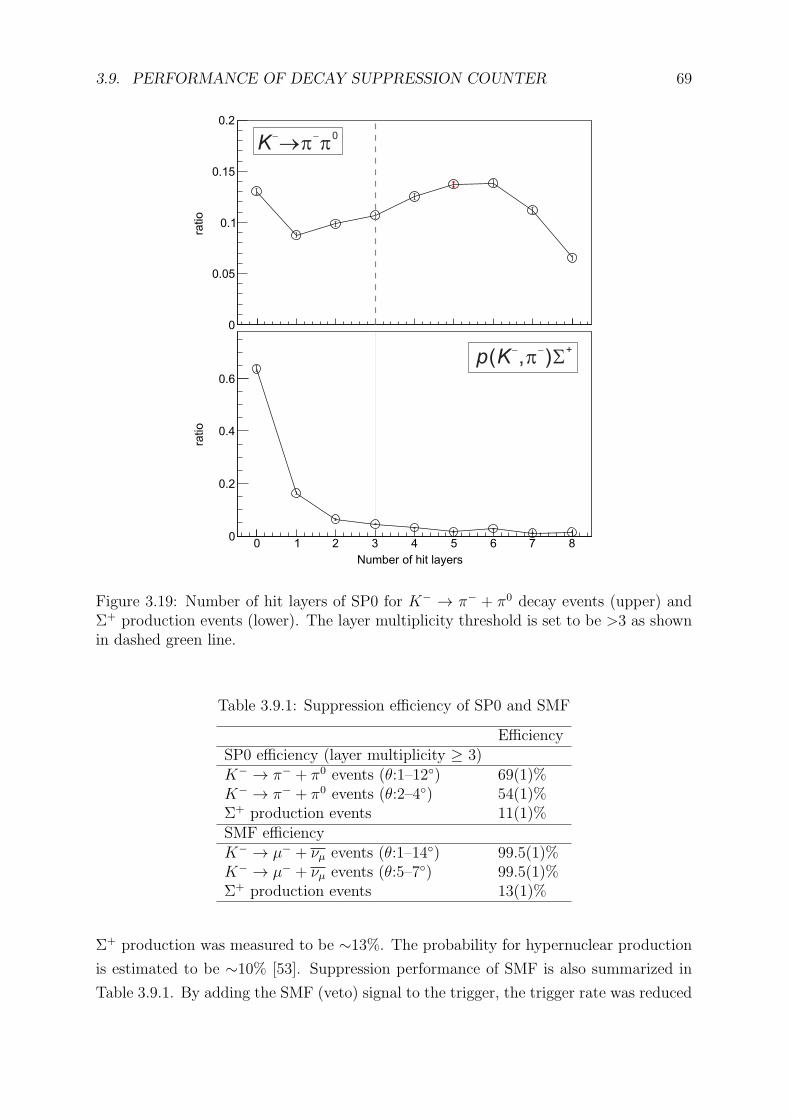
3.9. PERFORMANCE OF DECAY SUPPRESSION COUNTER 69
ratio
0
0.05
0.1
0.15
0.2
Number of hit layers
0 1 2 3 4 5 6 7 8
ratio
0
0.2
0.4
0.6
p K( , )- -
p S+
K- -
®p p0
Figure 3.19: Number of hit layers of SP0 for K− → π− + π0 decay events (upper) andΣ+ production events (lower). The layer multiplicity threshold is set to be >3 as shownin dashed green line.
Table 3.9.1: Suppression efficiency of SP0 and SMF
EfficiencySP0 efficiency (layer multiplicity ≥ 3)K− → π− + π0 events (θ:1–12◦) 69(1)%K− → π− + π0 events (θ:2–4◦) 54(1)%Σ+ production events 11(1)%SMF efficiencyK− → µ− + νµ events (θ:1–14◦) 99.5(1)%K− → µ− + νµ events (θ:5–7◦) 99.5(1)%Σ+ production events 13(1)%
Σ+ production was measured to be ∼13%. The probability for hypernuclear production
is estimated to be ∼10% [53]. Suppression performance of SMF is also summarized in
Table 3.9.1. By adding the SMF (veto) signal to the trigger, the trigger rate was reduced
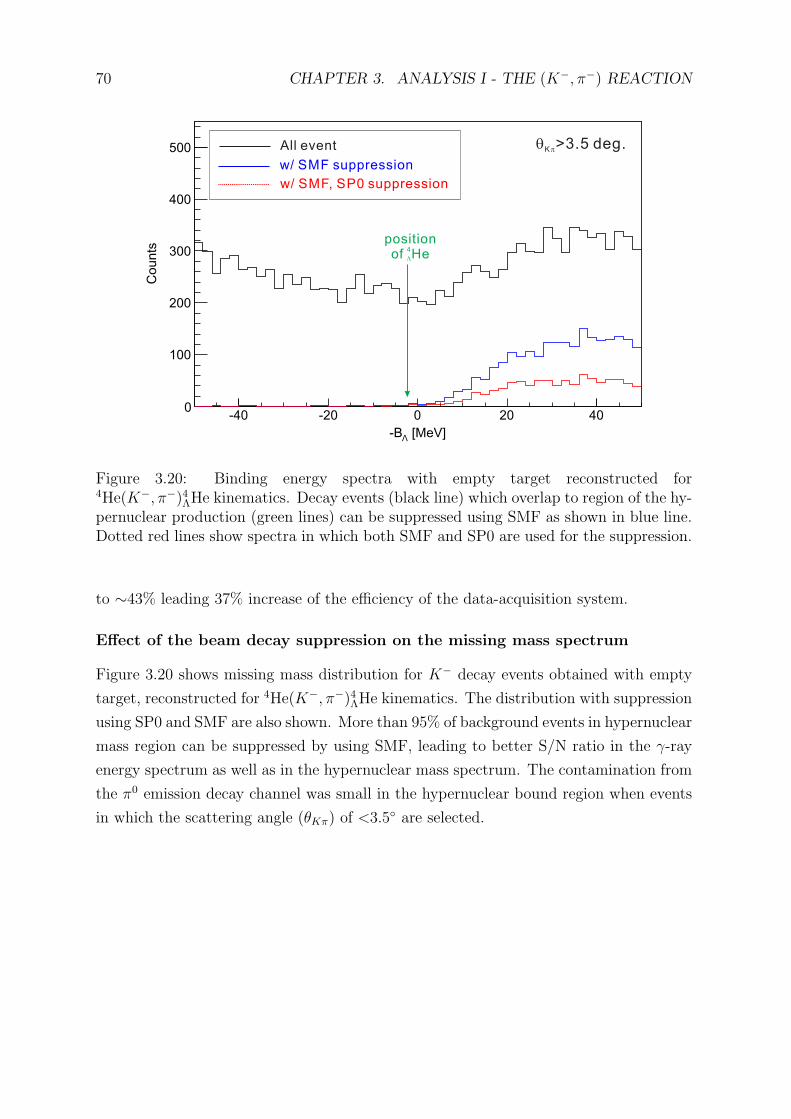
70 CHAPTER 3. ANALYSIS I - THE (K−, π−) REACTION
[MeV]Λ-B
-40 -20 0 20 40
Counts
0
100
200
300
400
500 All event
w/ SMF suppression
w/ SMF, SP0 suppression
qKp>3.5 deg.
positionof He
4
L
Figure 3.20: Binding energy spectra with empty target reconstructed for4He(K−, π−)4ΛHe kinematics. Decay events (black line) which overlap to region of the hy-pernuclear production (green lines) can be suppressed using SMF as shown in blue line.Dotted red lines show spectra in which both SMF and SP0 are used for the suppression.
to ∼43% leading 37% increase of the efficiency of the data-acquisition system.
Effect of the beam decay suppression on the missing mass spectrum
Figure 3.20 shows missing mass distribution for K− decay events obtained with empty
target, reconstructed for 4He(K−, π−)4ΛHe kinematics. The distribution with suppression
using SP0 and SMF are also shown. More than 95% of background events in hypernuclear
mass region can be suppressed by using SMF, leading to better S/N ratio in the γ-ray
energy spectrum as well as in the hypernuclear mass spectrum. The contamination from
the π0 emission decay channel was small in the hypernuclear bound region when events
in which the scattering angle (θKπ) of <3.5◦ are selected.
Chapter 4
Analysis II - γ rays
The analysis of Hyperball-J (the Ge detectors and the PWO counters) to obtain the
γ-ray energy spectrum is described in this chapter. Following this analysis, hypernuclear
γ-ray energy spectra before/after the Doppler-shift correction were obtained combining
with the analysis of the (K−, π−) reaction described in the previous chapter.
4.1 Outline
The analysis procedure of Hyperball-J is illustrated in Fig. 3.1 and also summarized
below:
• event selection by using timing information of the Ge detectors and the PWO
counters,
• energy calibration of the Ge detectors,
• Doppler-shift correction for γ-ray energy,
• simulation of a peak shape in the Doppler-shift corrected spectrum.
4.2 Event selection
The timing signal from the Ge detectors was not used for the KPI trigger. The accepted
coincidence time window between the Ge signal and the KPI trigger (= BH2 timing)
was very wide (2.5 µs) in the trigger level. This window corresponds to the gate width
for the peak-sensitive ADC modules for the readout of the Ge detectors, and is much
wider than the time resolution of the Ge detector (∼15 ns at Eγ= 1 MeV). Therefore,
an event selection using a tight time window was applied to improve a signal to noise
ratio in the γ-ray energy spectrum.
71
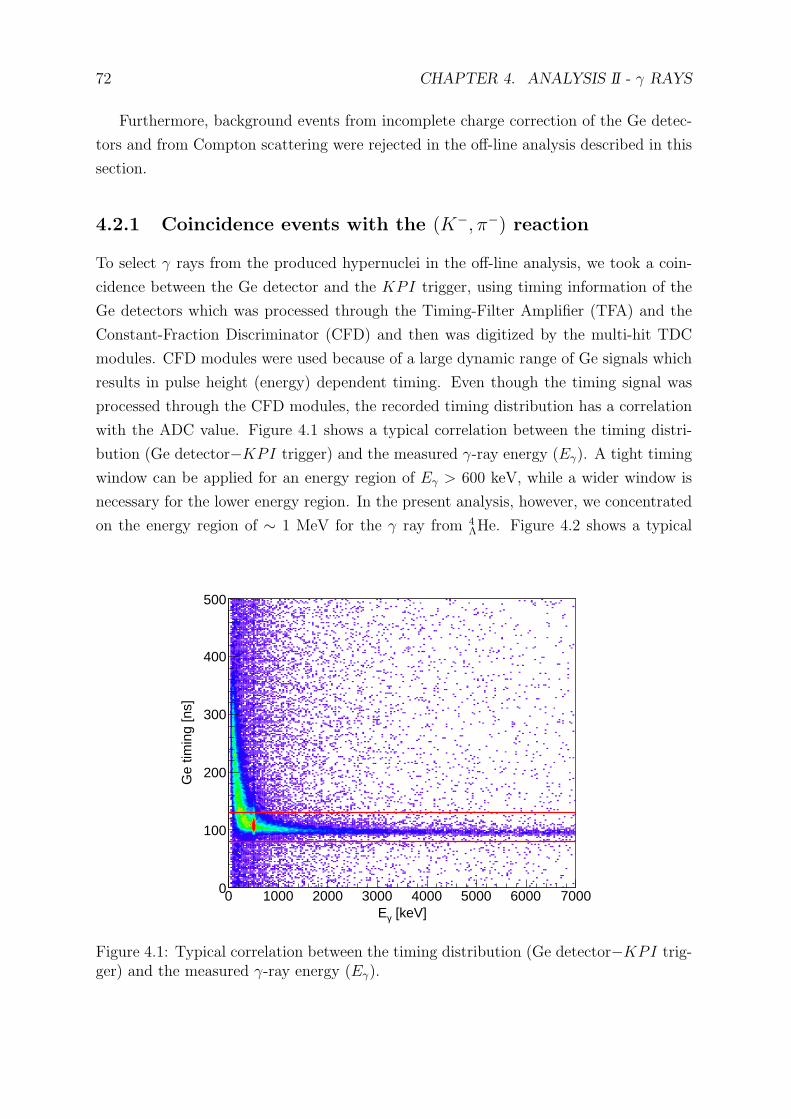
72 CHAPTER 4. ANALYSIS II - γ RAYS
Furthermore, background events from incomplete charge correction of the Ge detec-
tors and from Compton scattering were rejected in the off-line analysis described in this
section.
4.2.1 Coincidence events with the (K−, π−) reaction
To select γ rays from the produced hypernuclei in the off-line analysis, we took a coin-
cidence between the Ge detector and the KPI trigger, using timing information of the
Ge detectors which was processed through the Timing-Filter Amplifier (TFA) and the
Constant-Fraction Discriminator (CFD) and then was digitized by the multi-hit TDC
modules. CFD modules were used because of a large dynamic range of Ge signals which
results in pulse height (energy) dependent timing. Even though the timing signal was
processed through the CFD modules, the recorded timing distribution has a correlation
with the ADC value. Figure 4.1 shows a typical correlation between the timing distri-
bution (Ge detector−KPI trigger) and the measured γ-ray energy (Eγ). A tight timing
window can be applied for an energy region of Eγ > 600 keV, while a wider window is
necessary for the lower energy region. In the present analysis, however, we concentrated
on the energy region of ∼ 1 MeV for the γ ray from 4ΛHe. Figure 4.2 shows a typical
[keV]γE0 1000 2000 3000 4000 5000 6000 7000
Ge
timin
g [n
s]
0
100
200
300
400
500
Figure 4.1: Typical correlation between the timing distribution (Ge detector−KPI trig-ger) and the measured γ-ray energy (Eγ).
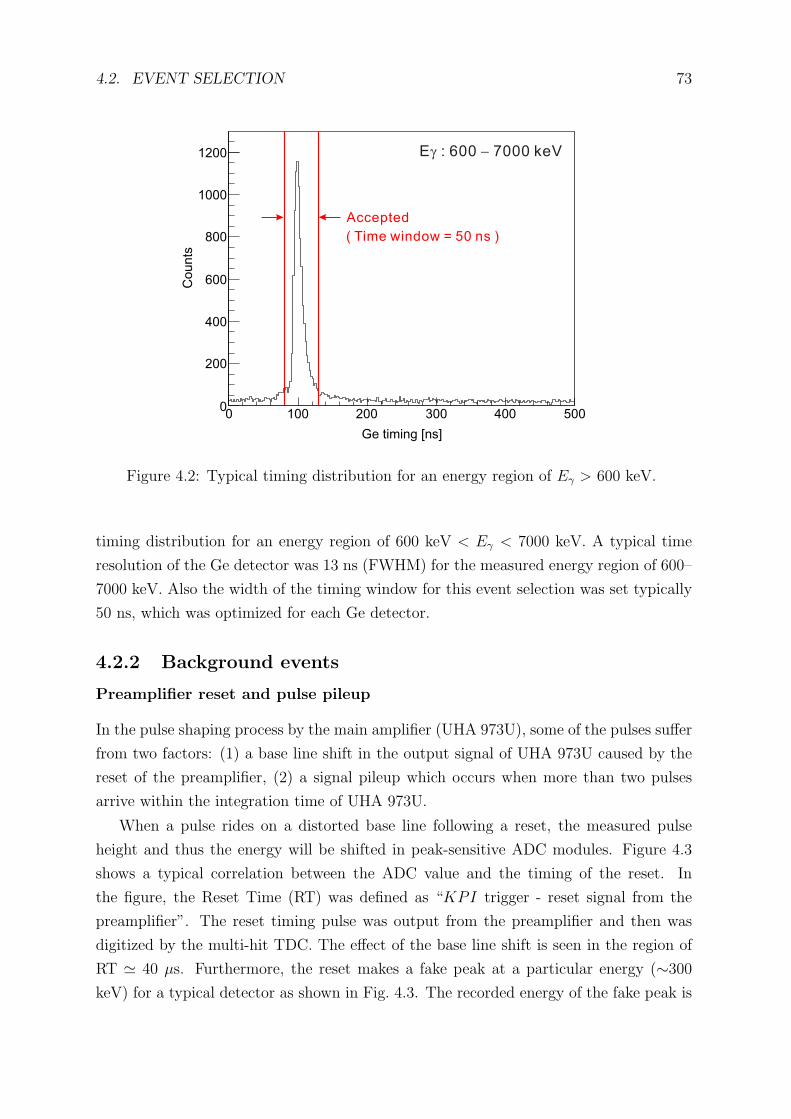
4.2. EVENT SELECTION 73
Ge timing [ns]
0 100 200 300 400 500
Counts
0
200
400
600
800
1000
1200
Accepted
E : 600 7000 keVg -
( Time window = 50 ns )
Figure 4.2: Typical timing distribution for an energy region of Eγ > 600 keV.
timing distribution for an energy region of 600 keV < Eγ < 7000 keV. A typical time
resolution of the Ge detector was 13 ns (FWHM) for the measured energy region of 600–
7000 keV. Also the width of the timing window for this event selection was set typically
50 ns, which was optimized for each Ge detector.
4.2.2 Background events
Preamplifier reset and pulse pileup
In the pulse shaping process by the main amplifier (UHA 973U), some of the pulses suffer
from two factors: (1) a base line shift in the output signal of UHA 973U caused by the
reset of the preamplifier, (2) a signal pileup which occurs when more than two pulses
arrive within the integration time of UHA 973U.
When a pulse rides on a distorted base line following a reset, the measured pulse
height and thus the energy will be shifted in peak-sensitive ADC modules. Figure 4.3
shows a typical correlation between the ADC value and the timing of the reset. In
the figure, the Reset Time (RT) was defined as “KPI trigger - reset signal from the
preamplifier”. The reset timing pulse was output from the preamplifier and then was
digitized by the multi-hit TDC. The effect of the base line shift is seen in the region of
RT ≃ 40 µs. Furthermore, the reset makes a fake peak at a particular energy (∼300
keV) for a typical detector as shown in Fig. 4.3. The recorded energy of the fake peak is
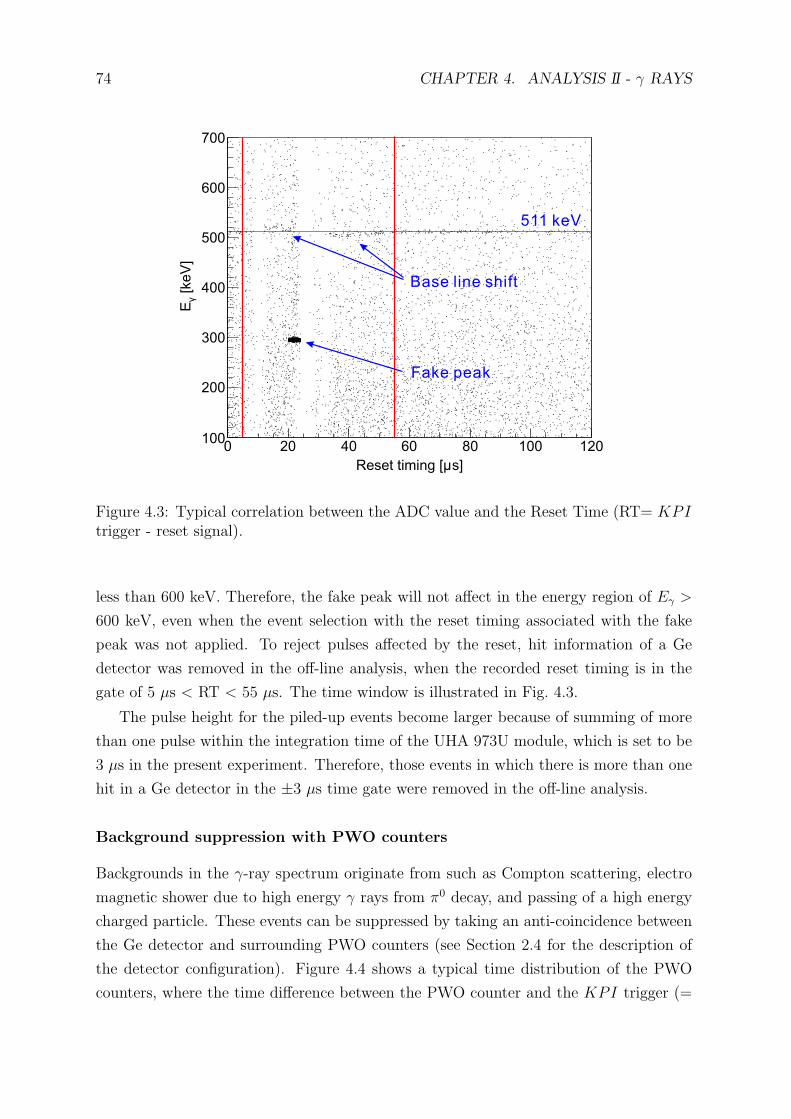
74 CHAPTER 4. ANALYSIS II - γ RAYS
s]µReset timing [
0 20 40 60 80 100 120
[ke
V]
γE
100
200
300
400
500
600
700
511 keV
Fake peak
Base line shift
Figure 4.3: Typical correlation between the ADC value and the Reset Time (RT= KPItrigger - reset signal).
less than 600 keV. Therefore, the fake peak will not affect in the energy region of Eγ >
600 keV, even when the event selection with the reset timing associated with the fake
peak was not applied. To reject pulses affected by the reset, hit information of a Ge
detector was removed in the off-line analysis, when the recorded reset timing is in the
gate of 5 µs < RT < 55 µs. The time window is illustrated in Fig. 4.3.
The pulse height for the piled-up events become larger because of summing of more
than one pulse within the integration time of the UHA 973U module, which is set to be
3 µs in the present experiment. Therefore, those events in which there is more than one
hit in a Ge detector in the ±3 µs time gate were removed in the off-line analysis.
Background suppression with PWO counters
Backgrounds in the γ-ray spectrum originate from such as Compton scattering, electro
magnetic shower due to high energy γ rays from π0 decay, and passing of a high energy
charged particle. These events can be suppressed by taking an anti-coincidence between
the Ge detector and surrounding PWO counters (see Section 2.4 for the description of
the detector configuration). Figure 4.4 shows a typical time distribution of the PWO
counters, where the time difference between the PWO counter and the KPI trigger (=
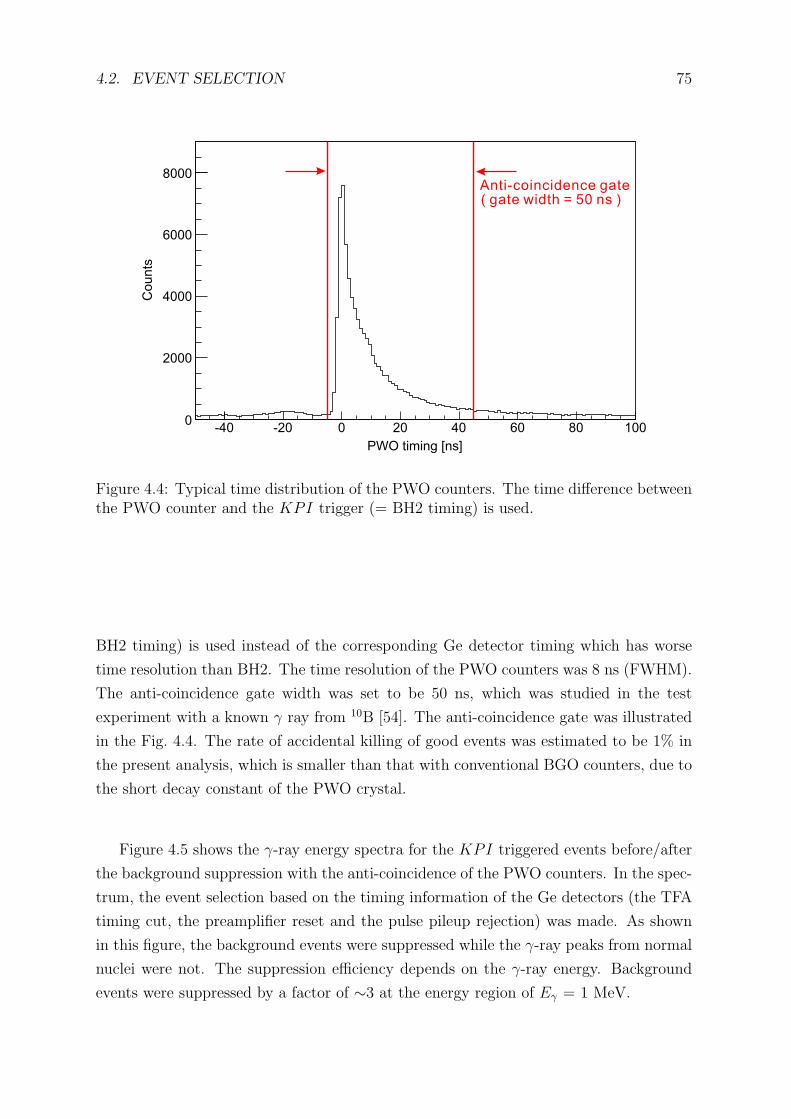
4.2. EVENT SELECTION 75
PWO timing [ns]
-40 -20 0 20 40 60 80 100
Co
un
ts
0
2000
4000
6000
8000Anti-coincidence gate( gate width = 50 ns )
Figure 4.4: Typical time distribution of the PWO counters. The time difference betweenthe PWO counter and the KPI trigger (= BH2 timing) is used.
BH2 timing) is used instead of the corresponding Ge detector timing which has worse
time resolution than BH2. The time resolution of the PWO counters was 8 ns (FWHM).
The anti-coincidence gate width was set to be 50 ns, which was studied in the test
experiment with a known γ ray from 10B [54]. The anti-coincidence gate was illustrated
in the Fig. 4.4. The rate of accidental killing of good events was estimated to be 1% in
the present analysis, which is smaller than that with conventional BGO counters, due to
the short decay constant of the PWO crystal.
Figure 4.5 shows the γ-ray energy spectra for the KPI triggered events before/after
the background suppression with the anti-coincidence of the PWO counters. In the spec-
trum, the event selection based on the timing information of the Ge detectors (the TFA
timing cut, the preamplifier reset and the pulse pileup rejection) was made. As shown
in this figure, the background events were suppressed while the γ-ray peaks from normal
nuclei were not. The suppression efficiency depends on the γ-ray energy. Background
events were suppressed by a factor of ∼3 at the energy region of Eγ = 1 MeV.
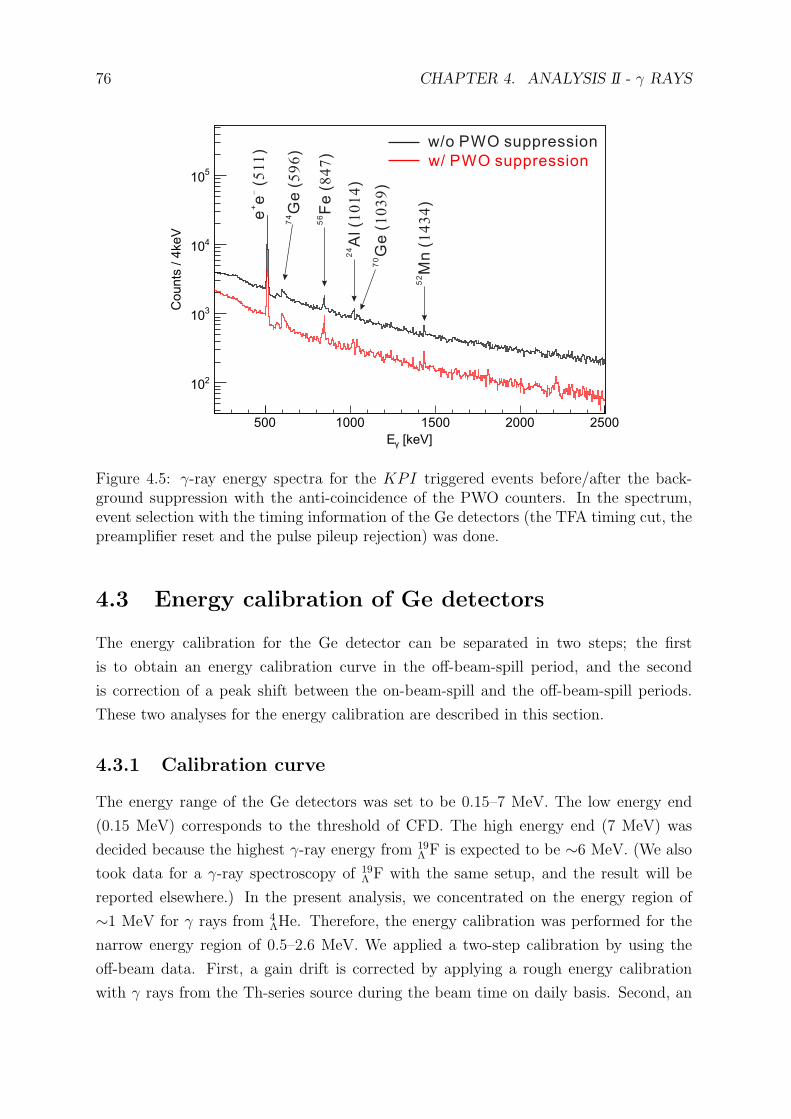
76 CHAPTER 4. ANALYSIS II - γ RAYS
[keV]γE
500 1000 1500 2000 2500
Co
un
ts /
4ke
V
210
310
410
510
w/o PWO suppression
w/ PWO suppression
ee
()
+-
51
1
74G
e (
)5
96
56F
e (
)8
47
24A
l (
)1
01
4
70G
e (
)1
03
9
52M
n (
)1
43
4
Figure 4.5: γ-ray energy spectra for the KPI triggered events before/after the back-ground suppression with the anti-coincidence of the PWO counters. In the spectrum,event selection with the timing information of the Ge detectors (the TFA timing cut, thepreamplifier reset and the pulse pileup rejection) was done.
4.3 Energy calibration of Ge detectors
The energy calibration for the Ge detector can be separated in two steps; the first
is to obtain an energy calibration curve in the off-beam-spill period, and the second
is correction of a peak shift between the on-beam-spill and the off-beam-spill periods.
These two analyses for the energy calibration are described in this section.
4.3.1 Calibration curve
The energy range of the Ge detectors was set to be 0.15–7 MeV. The low energy end
(0.15 MeV) corresponds to the threshold of CFD. The high energy end (7 MeV) was
decided because the highest γ-ray energy from 19Λ F is expected to be ∼6 MeV. (We also
took data for a γ-ray spectroscopy of 19Λ F with the same setup, and the result will be
reported elsewhere.) In the present analysis, we concentrated on the energy region of
∼1 MeV for γ rays from 4ΛHe. Therefore, the energy calibration was performed for the
narrow energy region of 0.5–2.6 MeV. We applied a two-step calibration by using the
off-beam data. First, a gain drift is corrected by applying a rough energy calibration
with γ rays from the Th-series source during the beam time on daily basis. Second, an
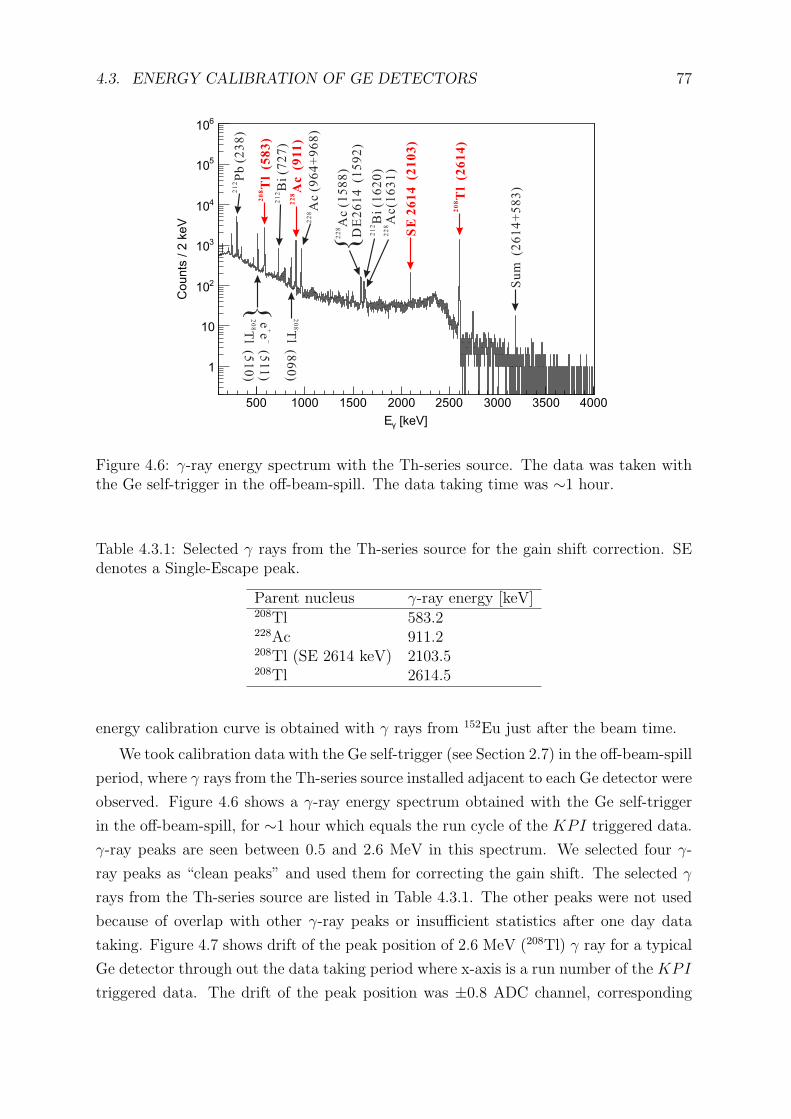
4.3. ENERGY CALIBRATION OF GE DETECTORS 77
[keV]γE
500 1000 1500 2000 2500 3000 3500 4000
Counts
/ 2
keV
1
10
210
310
410
510
610
20
8T
l (
26
14
)
SE
26
14
(2
10
3)
20
8T
l (
58
3)
22
8A
c
(911
)
Su
m
( 26
14
+5
83
)
DE
26
14
(1
59
2)
Bi
(16
20
)2
12A
c (1
58
8)
22
8
Ac
(96
4+
96
8)
22
8
Bi
(72
7)
21
2
20
8Tl (8
60
)
20
8Tl (5
10
)
ee
(51
1)
+-
{
{
Pb
(2
38
)2
12
Ac(1
63
1)
22
8
Figure 4.6: γ-ray energy spectrum with the Th-series source. The data was taken withthe Ge self-trigger in the off-beam-spill. The data taking time was ∼1 hour.
Table 4.3.1: Selected γ rays from the Th-series source for the gain shift correction. SEdenotes a Single-Escape peak.
Parent nucleus γ-ray energy [keV]208Tl 583.2228Ac 911.2208Tl (SE 2614 keV) 2103.5208Tl 2614.5
energy calibration curve is obtained with γ rays from 152Eu just after the beam time.
We took calibration data with the Ge self-trigger (see Section 2.7) in the off-beam-spill
period, where γ rays from the Th-series source installed adjacent to each Ge detector were
observed. Figure 4.6 shows a γ-ray energy spectrum obtained with the Ge self-trigger
in the off-beam-spill, for ∼1 hour which equals the run cycle of the KPI triggered data.
γ-ray peaks are seen between 0.5 and 2.6 MeV in this spectrum. We selected four γ-
ray peaks as “clean peaks” and used them for correcting the gain shift. The selected γ
rays from the Th-series source are listed in Table 4.3.1. The other peaks were not used
because of overlap with other γ-ray peaks or insufficient statistics after one day data
taking. Figure 4.7 shows drift of the peak position of 2.6 MeV (208Tl) γ ray for a typical
Ge detector through out the data taking period where x-axis is a run number of the KPI
triggered data. The drift of the peak position was ±0.8 ADC channel, corresponding
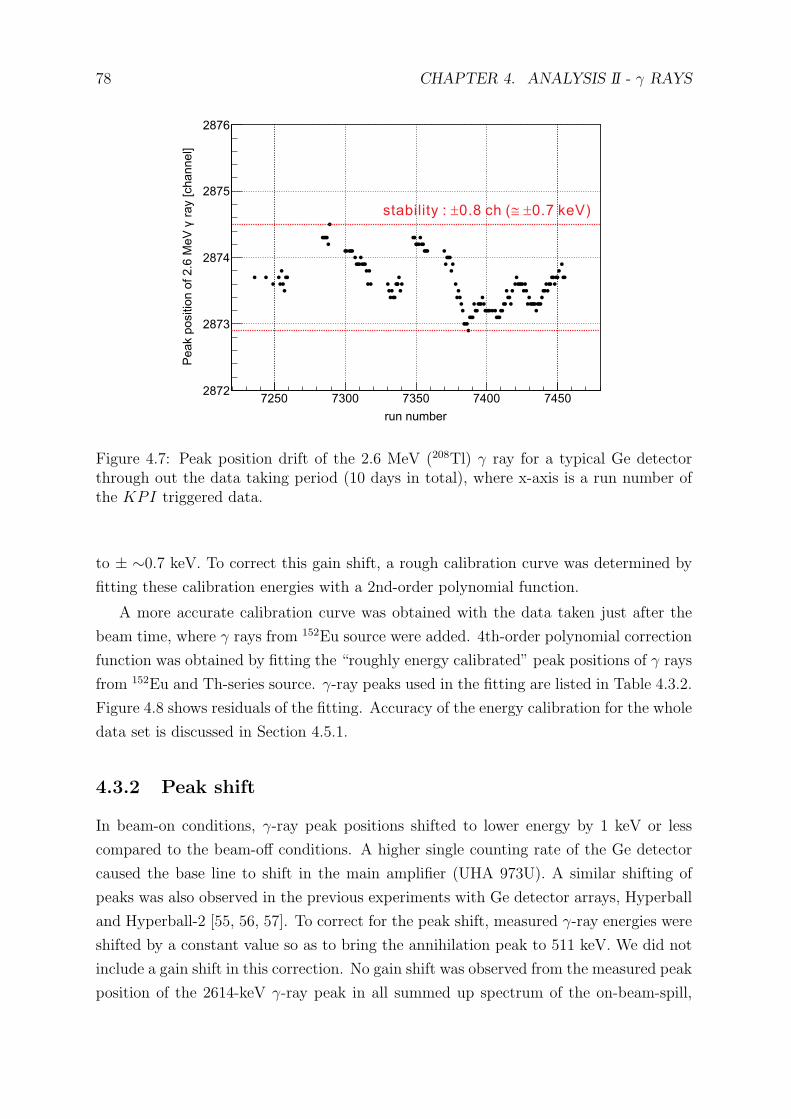
78 CHAPTER 4. ANALYSIS II - γ RAYS
run number
7250 7300 7350 7400 7450
ray [
ch
an
ne
l]γ
Pe
ak p
ositio
n o
f 2
.6 M
eV
2872
2873
2874
2875
2876
stability : 0.8 ch ( 0.7 keV)± @ ±
Figure 4.7: Peak position drift of the 2.6 MeV (208Tl) γ ray for a typical Ge detectorthrough out the data taking period (10 days in total), where x-axis is a run number ofthe KPI triggered data.
to ± ∼0.7 keV. To correct this gain shift, a rough calibration curve was determined by
fitting these calibration energies with a 2nd-order polynomial function.
A more accurate calibration curve was obtained with the data taken just after the
beam time, where γ rays from 152Eu source were added. 4th-order polynomial correction
function was obtained by fitting the “roughly energy calibrated” peak positions of γ rays
from 152Eu and Th-series source. γ-ray peaks used in the fitting are listed in Table 4.3.2.
Figure 4.8 shows residuals of the fitting. Accuracy of the energy calibration for the whole
data set is discussed in Section 4.5.1.
4.3.2 Peak shift
In beam-on conditions, γ-ray peak positions shifted to lower energy by 1 keV or less
compared to the beam-off conditions. A higher single counting rate of the Ge detector
caused the base line to shift in the main amplifier (UHA 973U). A similar shifting of
peaks was also observed in the previous experiments with Ge detector arrays, Hyperball
and Hyperball-2 [55, 56, 57]. To correct for the peak shift, measured γ-ray energies were
shifted by a constant value so as to bring the annihilation peak to 511 keV. We did not
include a gain shift in this correction. No gain shift was observed from the measured peak
position of the 2614-keV γ-ray peak in all summed up spectrum of the on-beam-spill,
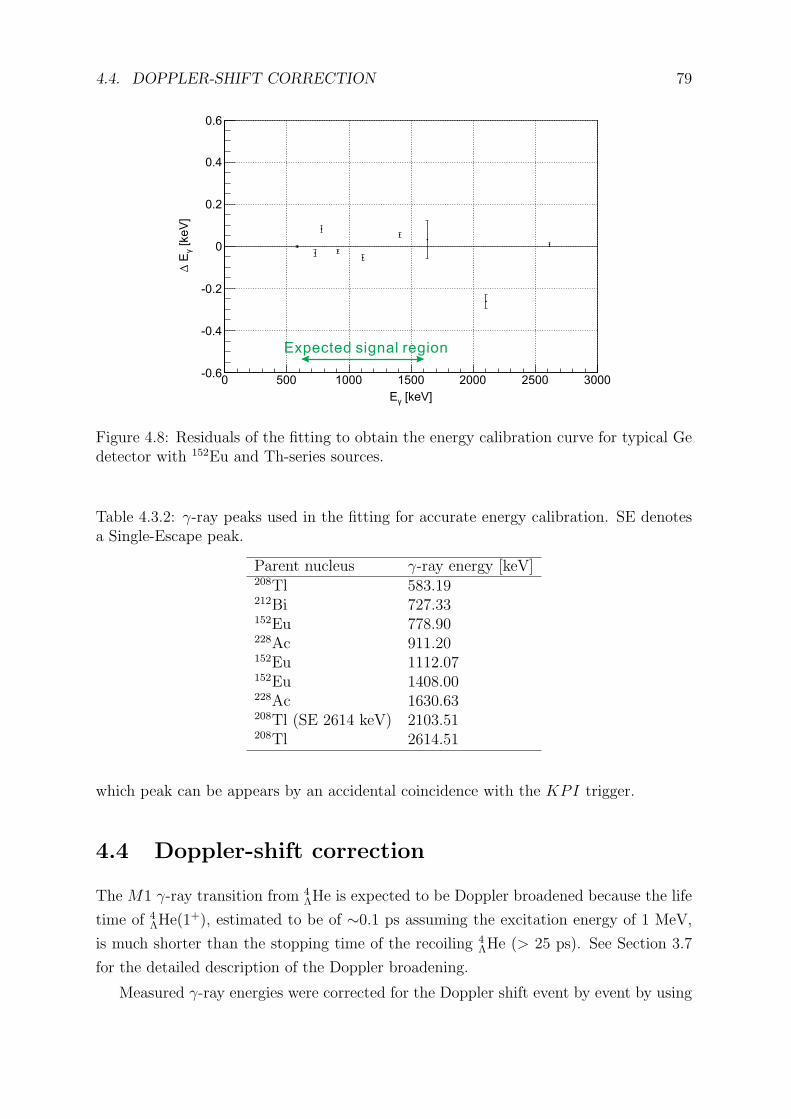
4.4. DOPPLER-SHIFT CORRECTION 79
[keV]γE
0 500 1000 1500 2000 2500 3000
[ke
V]
γE
∆
-0.6
-0.4
-0.2
0
0.2
0.4
0.6
Expected signal region
Figure 4.8: Residuals of the fitting to obtain the energy calibration curve for typical Gedetector with 152Eu and Th-series sources.
Table 4.3.2: γ-ray peaks used in the fitting for accurate energy calibration. SE denotesa Single-Escape peak.
Parent nucleus γ-ray energy [keV]208Tl 583.19212Bi 727.33152Eu 778.90228Ac 911.20152Eu 1112.07152Eu 1408.00228Ac 1630.63208Tl (SE 2614 keV) 2103.51208Tl 2614.51
which peak can be appears by an accidental coincidence with the KPI trigger.
4.4 Doppler-shift correction
The M1 γ-ray transition from 4ΛHe is expected to be Doppler broadened because the life
time of 4ΛHe(1
+), estimated to be of ∼0.1 ps assuming the excitation energy of 1 MeV,
is much shorter than the stopping time of the recoiling 4ΛHe (> 25 ps). See Section 3.7
for the detailed description of the Doppler broadening.
Measured γ-ray energies were corrected for the Doppler shift event by event by using
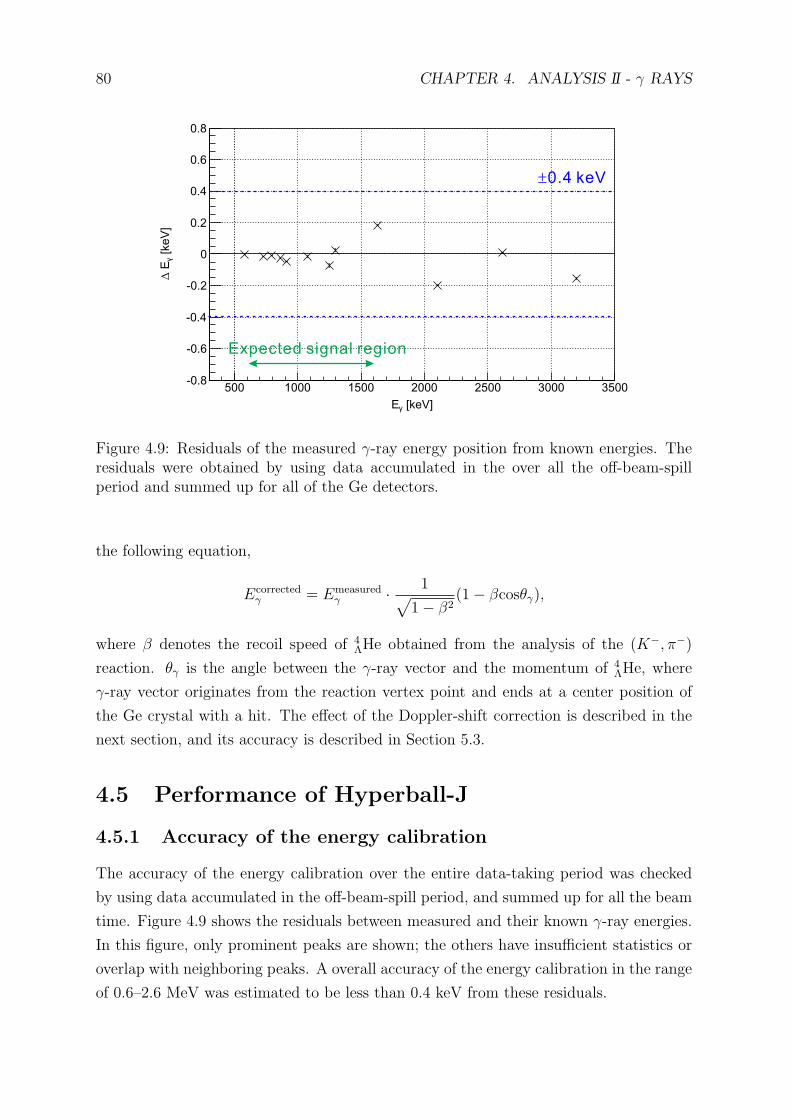
80 CHAPTER 4. ANALYSIS II - γ RAYS
[keV]γE
500 1000 1500 2000 2500 3000 3500
[ke
V]
γE
∆
-0.8
-0.6
-0.4
-0.2
0
0.2
0.4
0.6
0.8
Expected signal region
±0.4 keV
Figure 4.9: Residuals of the measured γ-ray energy position from known energies. Theresiduals were obtained by using data accumulated in the over all the off-beam-spillperiod and summed up for all of the Ge detectors.
the following equation,
Ecorrectedγ = Emeasured
γ · 1√1− β2
(1− βcosθγ),
where β denotes the recoil speed of 4ΛHe obtained from the analysis of the (K−, π−)
reaction. θγ is the angle between the γ-ray vector and the momentum of 4ΛHe, where
γ-ray vector originates from the reaction vertex point and ends at a center position of
the Ge crystal with a hit. The effect of the Doppler-shift correction is described in the
next section, and its accuracy is described in Section 5.3.
4.5 Performance of Hyperball-J
4.5.1 Accuracy of the energy calibration
The accuracy of the energy calibration over the entire data-taking period was checked
by using data accumulated in the off-beam-spill period, and summed up for all the beam
time. Figure 4.9 shows the residuals between measured and their known γ-ray energies.
In this figure, only prominent peaks are shown; the others have insufficient statistics or
overlap with neighboring peaks. A overall accuracy of the energy calibration in the range
of 0.6–2.6 MeV was estimated to be less than 0.4 keV from these residuals.
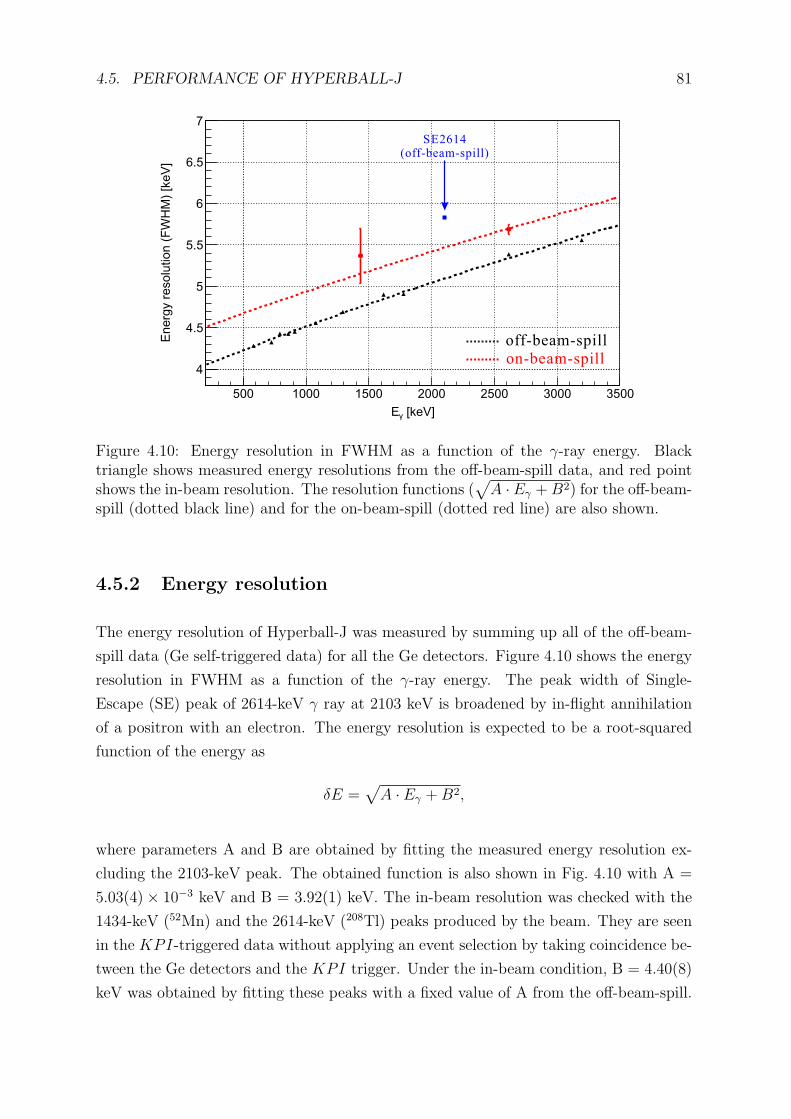
4.5. PERFORMANCE OF HYPERBALL-J 81
[keV]γE
500 1000 1500 2000 2500 3000 3500
Energ
y r
esolu
tion (
FW
HM
) [k
eV
]
4
4.5
5
5.5
6
6.5
7
SE2614(off-beam-spill)
on-beam-spill
off-beam-spill
Figure 4.10: Energy resolution in FWHM as a function of the γ-ray energy. Blacktriangle shows measured energy resolutions from the off-beam-spill data, and red pointshows the in-beam resolution. The resolution functions (
√A · Eγ +B2) for the off-beam-
spill (dotted black line) and for the on-beam-spill (dotted red line) are also shown.
4.5.2 Energy resolution
The energy resolution of Hyperball-J was measured by summing up all of the off-beam-
spill data (Ge self-triggered data) for all the Ge detectors. Figure 4.10 shows the energy
resolution in FWHM as a function of the γ-ray energy. The peak width of Single-
Escape (SE) peak of 2614-keV γ ray at 2103 keV is broadened by in-flight annihilation
of a positron with an electron. The energy resolution is expected to be a root-squared
function of the energy as
δE =√
A · Eγ +B2,
where parameters A and B are obtained by fitting the measured energy resolution ex-
cluding the 2103-keV peak. The obtained function is also shown in Fig. 4.10 with A =
5.03(4)× 10−3 keV and B = 3.92(1) keV. The in-beam resolution was checked with the
1434-keV (52Mn) and the 2614-keV (208Tl) peaks produced by the beam. They are seen
in the KPI-triggered data without applying an event selection by taking coincidence be-
tween the Ge detectors and the KPI trigger. Under the in-beam condition, B = 4.40(8)
keV was obtained by fitting these peaks with a fixed value of A from the off-beam-spill.
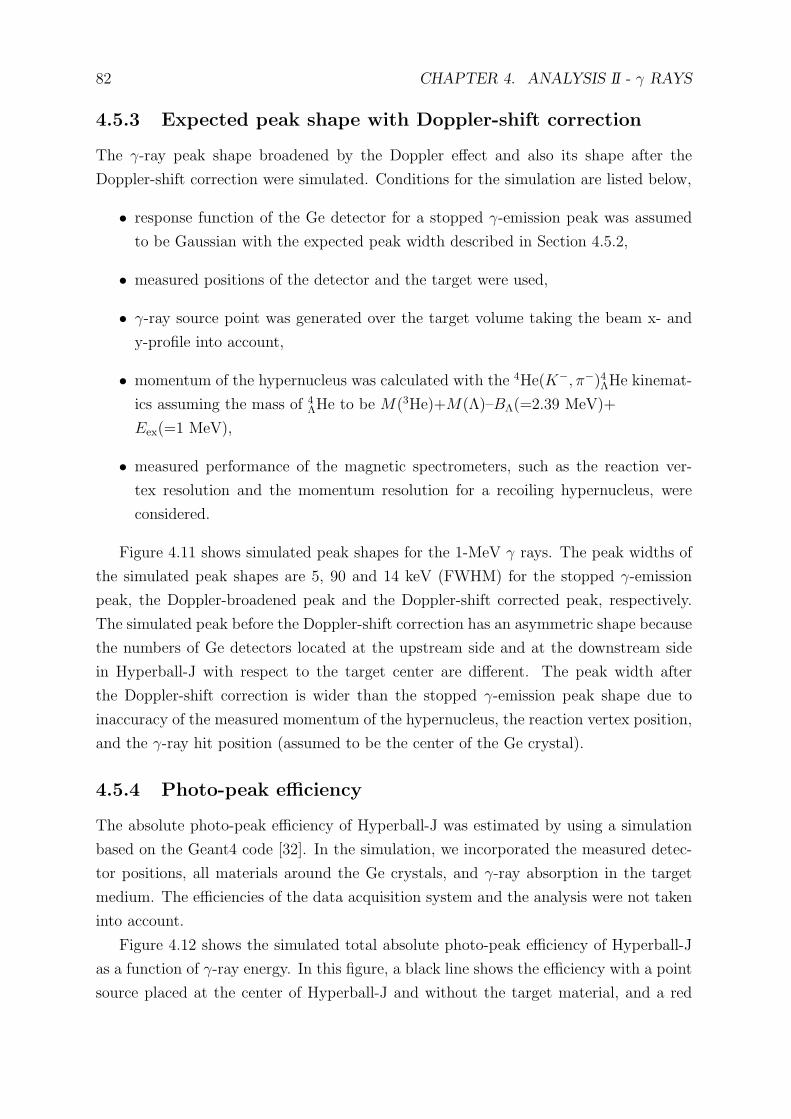
82 CHAPTER 4. ANALYSIS II - γ RAYS
4.5.3 Expected peak shape with Doppler-shift correction
The γ-ray peak shape broadened by the Doppler effect and also its shape after the
Doppler-shift correction were simulated. Conditions for the simulation are listed below,
• response function of the Ge detector for a stopped γ-emission peak was assumed
to be Gaussian with the expected peak width described in Section 4.5.2,
• measured positions of the detector and the target were used,
• γ-ray source point was generated over the target volume taking the beam x- and
y-profile into account,
• momentum of the hypernucleus was calculated with the 4He(K−, π−)4ΛHe kinemat-
ics assuming the mass of 4ΛHe to be M(3He)+M(Λ)–BΛ(=2.39 MeV)+
Eex(=1 MeV),
• measured performance of the magnetic spectrometers, such as the reaction ver-
tex resolution and the momentum resolution for a recoiling hypernucleus, were
considered.
Figure 4.11 shows simulated peak shapes for the 1-MeV γ rays. The peak widths of
the simulated peak shapes are 5, 90 and 14 keV (FWHM) for the stopped γ-emission
peak, the Doppler-broadened peak and the Doppler-shift corrected peak, respectively.
The simulated peak before the Doppler-shift correction has an asymmetric shape because
the numbers of Ge detectors located at the upstream side and at the downstream side
in Hyperball-J with respect to the target center are different. The peak width after
the Doppler-shift correction is wider than the stopped γ-emission peak shape due to
inaccuracy of the measured momentum of the hypernucleus, the reaction vertex position,
and the γ-ray hit position (assumed to be the center of the Ge crystal).
4.5.4 Photo-peak efficiency
The absolute photo-peak efficiency of Hyperball-J was estimated by using a simulation
based on the Geant4 code [32]. In the simulation, we incorporated the measured detec-
tor positions, all materials around the Ge crystals, and γ-ray absorption in the target
medium. The efficiencies of the data acquisition system and the analysis were not taken
into account.
Figure 4.12 shows the simulated total absolute photo-peak efficiency of Hyperball-J
as a function of γ-ray energy. In this figure, a black line shows the efficiency with a point
source placed at the center of Hyperball-J and without the target material, and a red
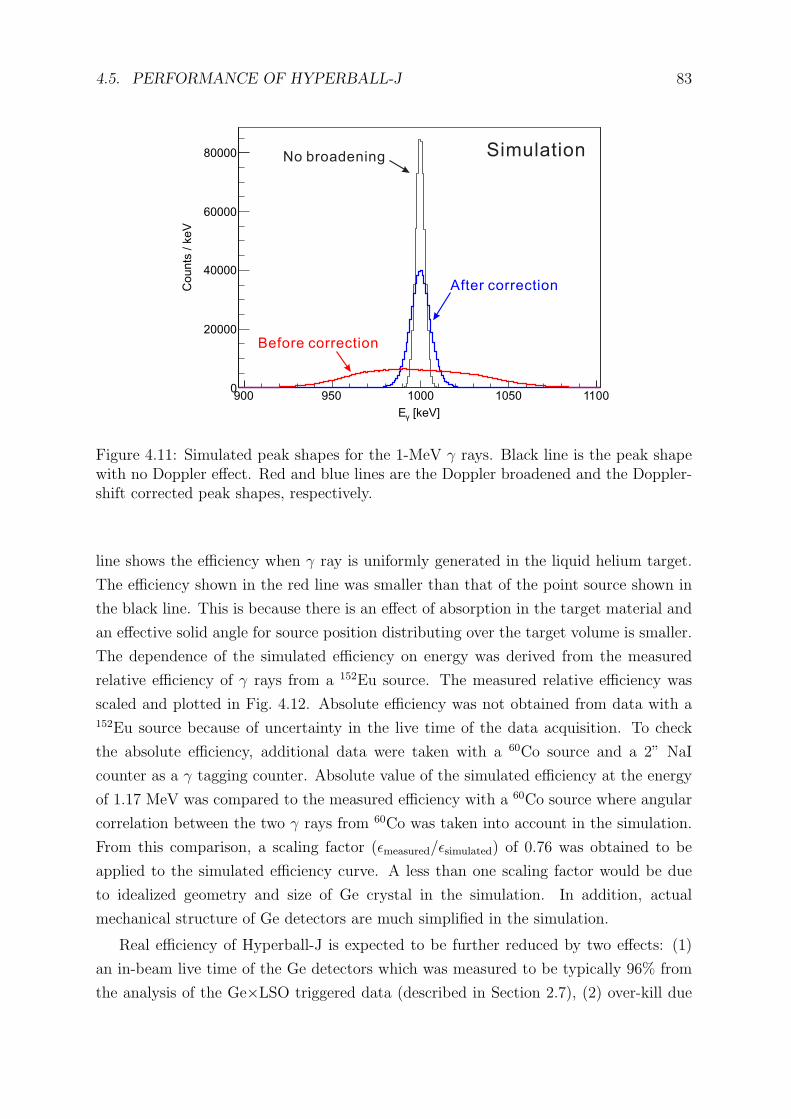
4.5. PERFORMANCE OF HYPERBALL-J 83
[keV]γE
900 950 1000 1050 1100
Co
un
ts /
ke
V
0
20000
40000
60000
80000 No broadening Simulation
Before correction
After correction
Figure 4.11: Simulated peak shapes for the 1-MeV γ rays. Black line is the peak shapewith no Doppler effect. Red and blue lines are the Doppler broadened and the Doppler-shift corrected peak shapes, respectively.
line shows the efficiency when γ ray is uniformly generated in the liquid helium target.
The efficiency shown in the red line was smaller than that of the point source shown in
the black line. This is because there is an effect of absorption in the target material and
an effective solid angle for source position distributing over the target volume is smaller.
The dependence of the simulated efficiency on energy was derived from the measured
relative efficiency of γ rays from a 152Eu source. The measured relative efficiency was
scaled and plotted in Fig. 4.12. Absolute efficiency was not obtained from data with a152Eu source because of uncertainty in the live time of the data acquisition. To check
the absolute efficiency, additional data were taken with a 60Co source and a 2” NaI
counter as a γ tagging counter. Absolute value of the simulated efficiency at the energy
of 1.17 MeV was compared to the measured efficiency with a 60Co source where angular
correlation between the two γ rays from 60Co was taken into account in the simulation.
From this comparison, a scaling factor (ϵmeasured/ϵsimulated) of 0.76 was obtained to be
applied to the simulated efficiency curve. A less than one scaling factor would be due
to idealized geometry and size of Ge crystal in the simulation. In addition, actual
mechanical structure of Ge detectors are much simplified in the simulation.
Real efficiency of Hyperball-J is expected to be further reduced by two effects: (1)
an in-beam live time of the Ge detectors which was measured to be typically 96% from
the analysis of the Ge×LSO triggered data (described in Section 2.7), (2) over-kill due
84 CHAPTER 4. ANALYSIS II - γ RAYS
[keV]γE
0 500 1000 1500 2000 2500 3000 3500 4000
Photo
-pe
ak
effi
cie
ncy
[%]
0
2
4
6
8
10
12
point source (simulation)
w/ liq. helium (simulation)152
Eu (measured, scaled)
Figure 4.12: Simulated total photo-peak efficiency of Hyperball-J as a function of γ-rayenergy. Black line is the efficiency with a point source placed at the center of Hyperball-J,and red line is that with the liquid helium target system and with randomly distributedγ-ray source points. Blue points are measured relative efficiency for γ rays from a 152Eusource.
to the accidental suppression by the PWO counters which was estimated to be of 1%.
In total, the actual efficiency of Hyperball-J was estimated to be 95% of the efficiency
curve in Fig. 4.12.
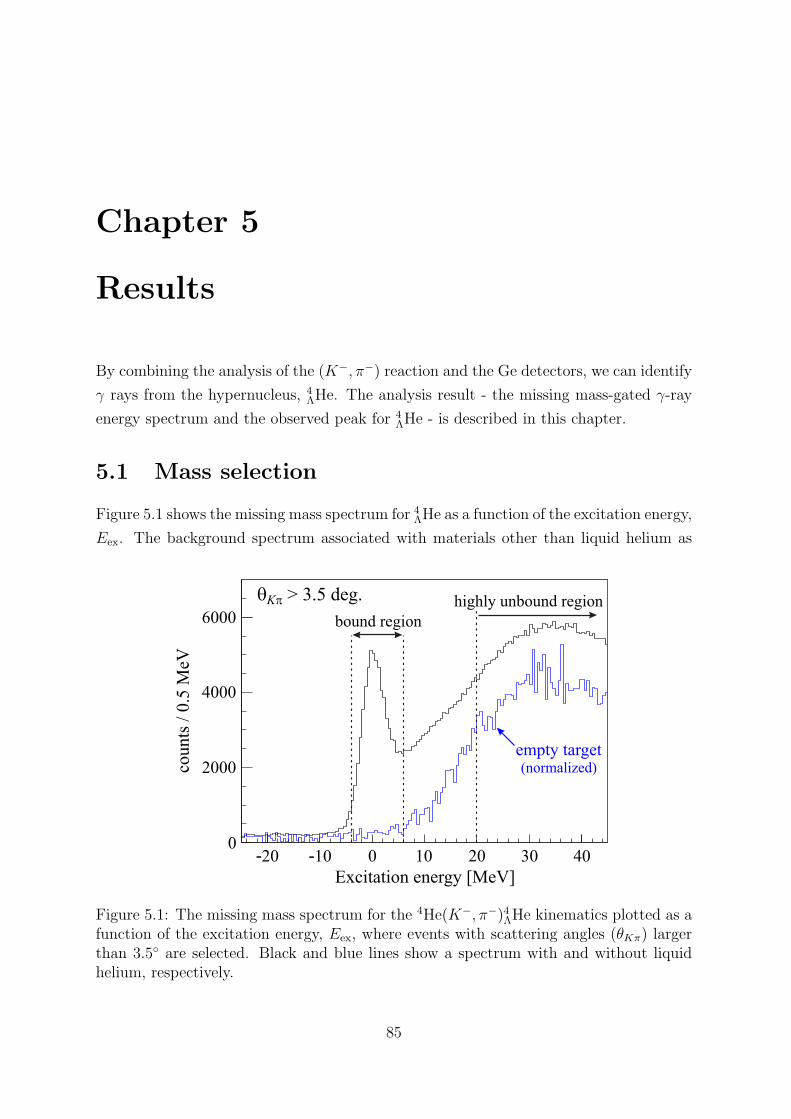
Chapter 5
Results
By combining the analysis of the (K−, π−) reaction and the Ge detectors, we can identify
γ rays from the hypernucleus, 4ΛHe. The analysis result - the missing mass-gated γ-ray
energy spectrum and the observed peak for 4ΛHe - is described in this chapter.
5.1 Mass selection
Figure 5.1 shows the missing mass spectrum for 4ΛHe as a function of the excitation energy,
Eex. The background spectrum associated with materials other than liquid helium as
Excitation energy [MeV]
-20
cou
nts
/ 0
.5 M
eV
0
2000
4000
6000
-10 0 10 20 30 40
bound region
highly unbound regionqKp > 3.5 deg.
empty target(normalized)
Figure 5.1: The missing mass spectrum for the 4He(K−, π−)4ΛHe kinematics plotted as afunction of the excitation energy, Eex, where events with scattering angles (θKπ) largerthan 3.5◦ are selected. Black and blue lines show a spectrum with and without liquidhelium, respectively.
85
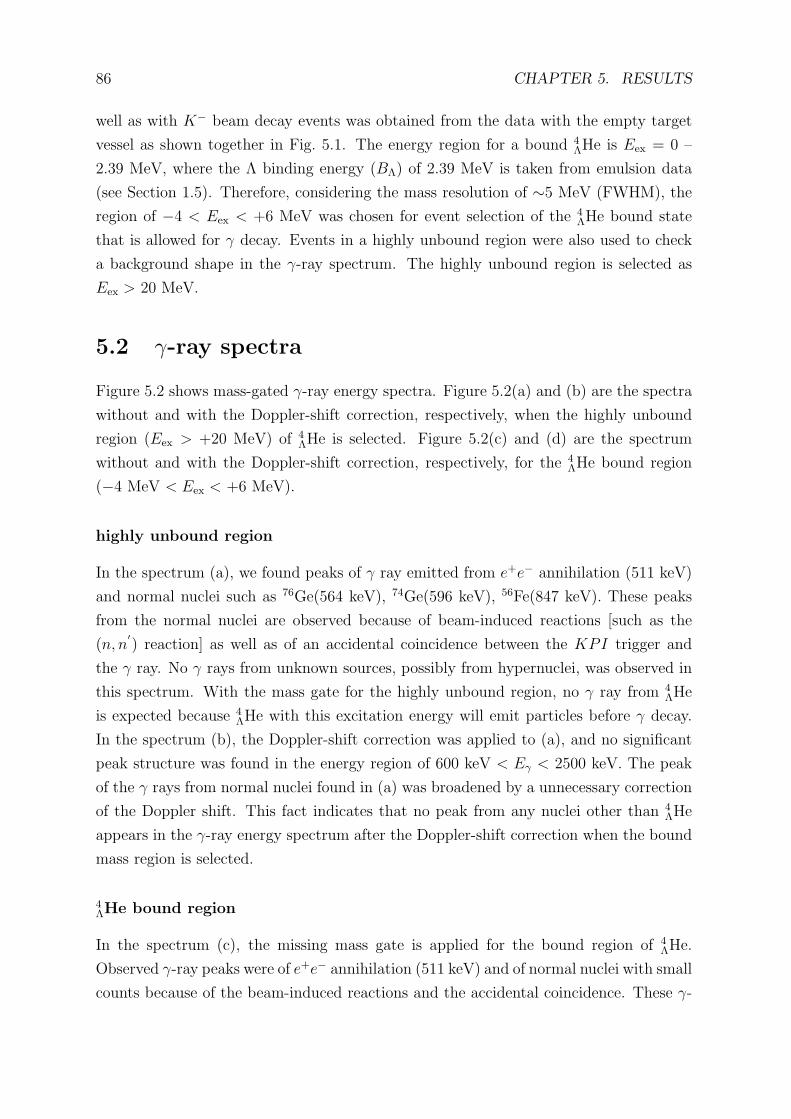
86 CHAPTER 5. RESULTS
well as with K− beam decay events was obtained from the data with the empty target
vessel as shown together in Fig. 5.1. The energy region for a bound 4ΛHe is Eex = 0 –
2.39 MeV, where the Λ binding energy (BΛ) of 2.39 MeV is taken from emulsion data
(see Section 1.5). Therefore, considering the mass resolution of ∼5 MeV (FWHM), the
region of −4 < Eex < +6 MeV was chosen for event selection of the 4ΛHe bound state
that is allowed for γ decay. Events in a highly unbound region were also used to check
a background shape in the γ-ray spectrum. The highly unbound region is selected as
Eex > 20 MeV.
5.2 γ-ray spectra
Figure 5.2 shows mass-gated γ-ray energy spectra. Figure 5.2(a) and (b) are the spectra
without and with the Doppler-shift correction, respectively, when the highly unbound
region (Eex > +20 MeV) of 4ΛHe is selected. Figure 5.2(c) and (d) are the spectrum
without and with the Doppler-shift correction, respectively, for the 4ΛHe bound region
(−4 MeV < Eex < +6 MeV).
highly unbound region
In the spectrum (a), we found peaks of γ ray emitted from e+e− annihilation (511 keV)
and normal nuclei such as 76Ge(564 keV), 74Ge(596 keV), 56Fe(847 keV). These peaks
from the normal nuclei are observed because of beam-induced reactions [such as the
(n, n′) reaction] as well as of an accidental coincidence between the KPI trigger and
the γ ray. No γ rays from unknown sources, possibly from hypernuclei, was observed in
this spectrum. With the mass gate for the highly unbound region, no γ ray from 4ΛHe
is expected because 4ΛHe with this excitation energy will emit particles before γ decay.
In the spectrum (b), the Doppler-shift correction was applied to (a), and no significant
peak structure was found in the energy region of 600 keV < Eγ < 2500 keV. The peak
of the γ rays from normal nuclei found in (a) was broadened by a unnecessary correction
of the Doppler shift. This fact indicates that no peak from any nuclei other than 4ΛHe
appears in the γ-ray energy spectrum after the Doppler-shift correction when the bound
mass region is selected.
4ΛHe bound region
In the spectrum (c), the missing mass gate is applied for the bound region of 4ΛHe.
Observed γ-ray peaks were of e+e− annihilation (511 keV) and of normal nuclei with small
counts because of the beam-induced reactions and the accidental coincidence. These γ-
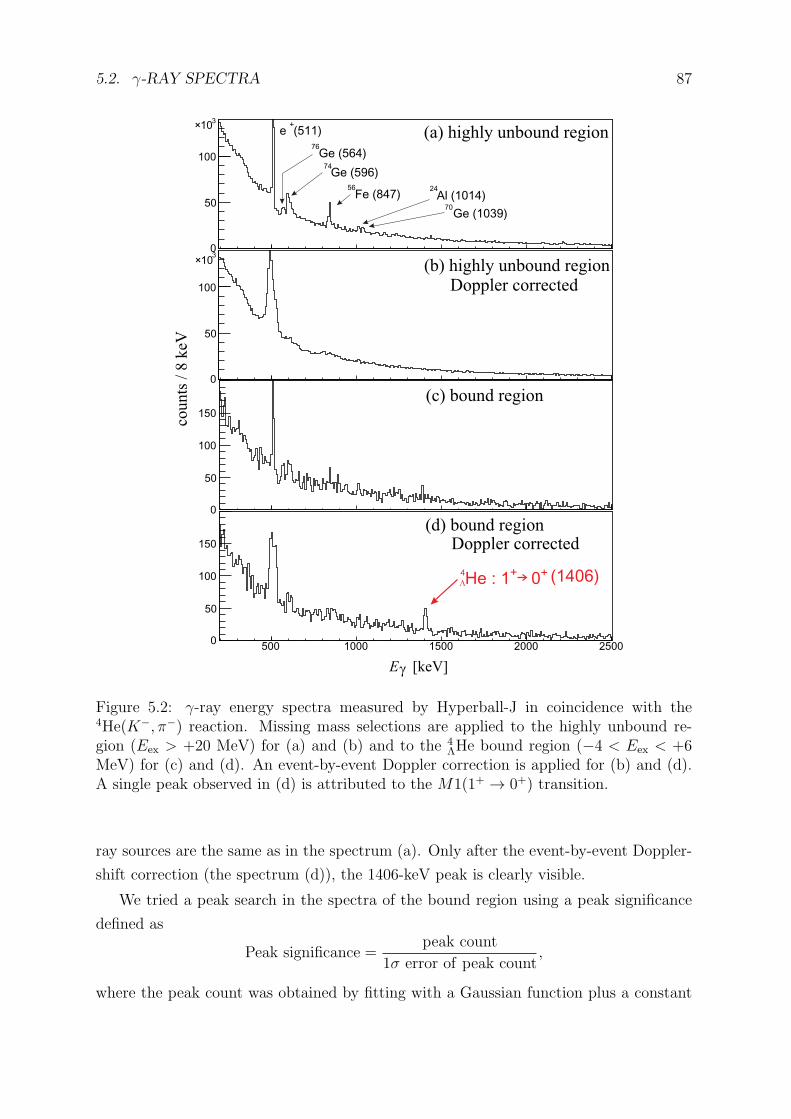
5.2. γ-RAY SPECTRA 87
Eg [keV]
counts
/ 8
keV
0
50
100
310×
0
50
100
310×
0
50
100
150
500 1000 1500 2000 25000
50
100
150
(a) highly unbound regione (511)+
74Ge (596)
56Fe (847)
24
Al (1014)70
Ge (1039)
Ge (5 )6476
(b) highly unbound regionDoppler corrected
(c) bound region
Doppler corrected(d) bound region
4He : 1 0+ +
L(140 )6
Figure 5.2: γ-ray energy spectra measured by Hyperball-J in coincidence with the4He(K−, π−) reaction. Missing mass selections are applied to the highly unbound re-gion (Eex > +20 MeV) for (a) and (b) and to the 4
ΛHe bound region (−4 < Eex < +6MeV) for (c) and (d). An event-by-event Doppler correction is applied for (b) and (d).A single peak observed in (d) is attributed to the M1(1+ → 0+) transition.
ray sources are the same as in the spectrum (a). Only after the event-by-event Doppler-
shift correction (the spectrum (d)), the 1406-keV peak is clearly visible.
We tried a peak search in the spectra of the bound region using a peak significance
defined as
Peak significance =peak count
1σ error of peak count,
where the peak count was obtained by fitting with a Gaussian function plus a constant
88 CHAPTER 5. RESULTS
background. The width of the Gaussian function was fixed to the measured resolution
(see Section 4.5.2) in the fitting for the spectrum before the Doppler-shift correction. For
the spectrum after the Doppler-shift correction, the peak shape was approximated as a
Gaussian function having the simulated peak width (see Section 4.5.3). The fitting was
attempted at every 2-keV steps of γ-ray energy where the peak position was fixed to a
given energy. Figure 5.3 shows results of the peak search in the γ-ray energy spectrum
before/after the Doppler-shift correction with the energy range of 600–2500 keV. In the
spectrum before the Doppler-shift correction, only one peak at 847 keV was found with
a peak significance of more than 3σ, which is the γ-ray from a normal nucleus, 56Fe. In
the spectrum after the Doppler-shift correction, the peak at 1406 keV was found with a
peak significance of ∼7σ. No such peak structure was found with the missing mass gate
for the highly unbound region. No other statistically significant peak was obtained in
both spectra before/after the Doppler-shift correction.
Therefore, we confirmed that only one γ-ray peak at 1406-keV came from 4ΛHe.
5.3 1406-keV γ ray
Level assignment
The peak at 1406 keV is assigned to the spin-flip M1 transition between the spin-doublet
states, 4ΛHe(1
+ → 0+). The reasons for this assignment are listed below;
• it is known that 4ΛHe(1
+) is the only bound excited state of 4ΛHe, and no state
other than 4ΛHe(1
+) which emits γ rays is expected to be populated in the selected
excitation energy region,
• the peak appears only after the Doppler-shift correction,
• the peak shape is consistent with the peak shape calculated by assuming Doppler-
shift effect for the 4ΛHe(1
+) state.
The spin assignments of the ground state [4ΛHe(0+)] and the 1st excited state [4ΛHe(1
+)]
were established from the past experiments (see Section 1.3). The ratio of the observed
yield of 4ΛHe(0
+) and 4ΛHe(1
+) states in the missing mass spectrum, where the yield of 1+
state was based on the obtained yield of 1406-keV γ ray (see Section 5.5), is consistent
with this spin assignment. A much smaller cross section is expected for the 4ΛHe(1
+) state
with the spin-flip Λ production than that for the 4ΛHe(0
+) state with the spin-non-flip Λ
production. The comparison of the yields will be described in Section 5.5.
5.3. 1406-KEV γ RAY 89
Counts
/ 2
keV
0
10
20
30
Peak s
ignifi
ca
nce
0
2
4
6
3s
56Fe (847)
w/o Doppler-shift correction (A)
(B)
Counts
/ 4
keV
0
10
20
30
40
[keV]Eg
Peak s
ignifi
cance
0
2
4
6
3s
w/ Doppler-shift correction (C)
(D)4 + +He (1 0 )®L
600 1000 1400 1800 2200
[keV]Eg
600 1000 1400 1800 2200
Figure 5.3: A result of the peak search in the γ-ray energy spectrum before/after theDoppler-shift correction: (A) a γ-ray energy spectrum before the Doppler-shift correctionselecting a missing mass gate for the 4
ΛHe bound region, (B) an obtained peak significanceas a function of the γ-ray energy, (C) and (D) are those after the Doppler-shift correction.
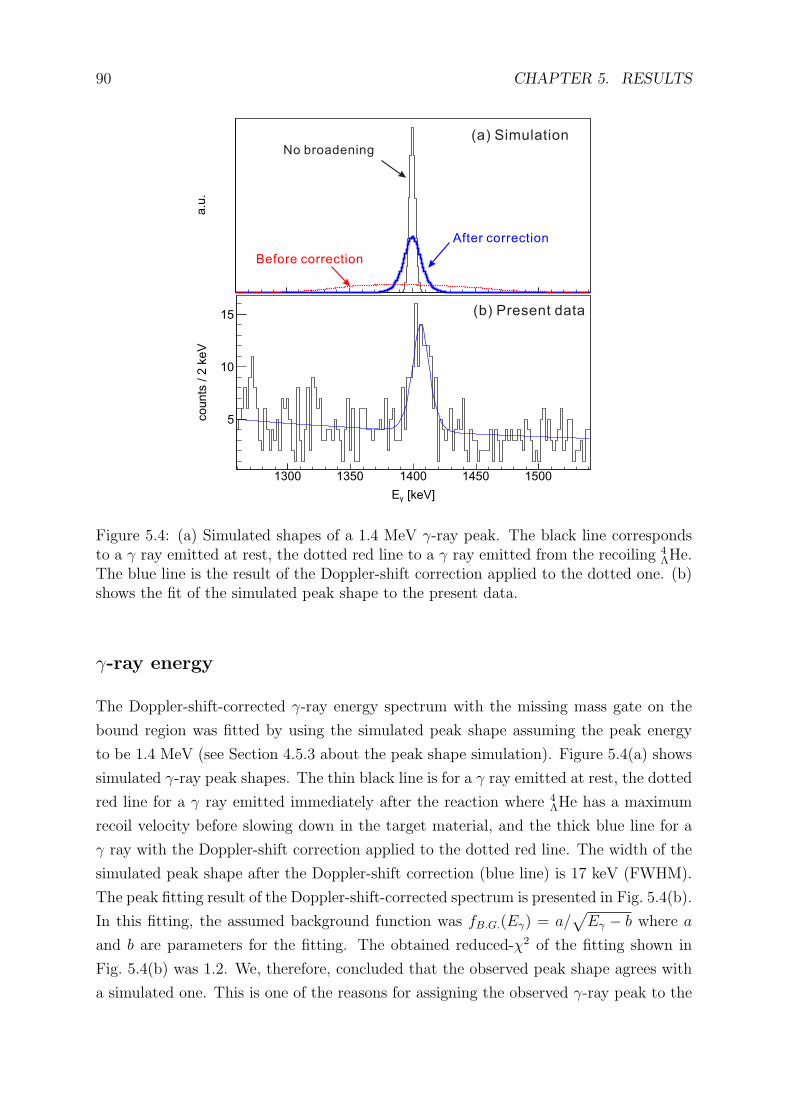
90 CHAPTER 5. RESULTS
a.u
.
[keV]γE
1300 1350 1400 1450 1500
counts
/ 2
keV
5
10
15
(a) Simulation
(b) Present data
No broadening
Before correction
After correction
Figure 5.4: (a) Simulated shapes of a 1.4 MeV γ-ray peak. The black line correspondsto a γ ray emitted at rest, the dotted red line to a γ ray emitted from the recoiling 4
ΛHe.The blue line is the result of the Doppler-shift correction applied to the dotted one. (b)shows the fit of the simulated peak shape to the present data.
γ-ray energy
The Doppler-shift-corrected γ-ray energy spectrum with the missing mass gate on the
bound region was fitted by using the simulated peak shape assuming the peak energy
to be 1.4 MeV (see Section 4.5.3 about the peak shape simulation). Figure 5.4(a) shows
simulated γ-ray peak shapes. The thin black line is for a γ ray emitted at rest, the dotted
red line for a γ ray emitted immediately after the reaction where 4ΛHe has a maximum
recoil velocity before slowing down in the target material, and the thick blue line for a
γ ray with the Doppler-shift correction applied to the dotted red line. The width of the
simulated peak shape after the Doppler-shift correction (blue line) is 17 keV (FWHM).
The peak fitting result of the Doppler-shift-corrected spectrum is presented in Fig. 5.4(b).
In this fitting, the assumed background function was fB.G.(Eγ) = a/√Eγ − b where a
and b are parameters for the fitting. The obtained reduced-χ2 of the fitting shown in
Fig. 5.4(b) was 1.2. We, therefore, concluded that the observed peak shape agrees with
a simulated one. This is one of the reasons for assigning the observed γ-ray peak to the
5.3. 1406-KEV γ RAY 91
4ΛHe(1
+ → 0+) transition.
As a result of the fitting, the γ-ray energy and the yield of the M1[4ΛHe(1+ → 0+)]
transition were determined to be
Eγ = 1406± 2(stat.)± 2(syst.) keV,
counts = 94± 13(stat.),
where a dominant source of the systematic error in the measured energy comes from
a position inaccuracy of the reaction vertex and of the Ge detectors in correcting the
Doppler shift. The systematic error for Eγ will be discussed in the next subsection. The
peak significance was
Peak significance =N2σ
s√N2σ
s +N2σb
= 7.4σ,
where N2σs and N2σ
b denote integrated counts over the energy range of ±2σ of the simu-
lated peak width with the fitting function and that of the background function, respec-
tively.
Systematic error in the measured energy
The sources of the systematic error in the measured energy are listed below:
• accuracy of the energy calibration,
• background function in the fitting,
• simulated Doppler-corrected peak shape,
• inaccuracy in the spatial configuration of the Ge detectors which affects the Doppler-
shift correction.
The effects of those sources are described in this section, followed by a summary of a
total systematic error at the end.
precision of the energy calibration
We applied energy calibration of the Ge detectors taking into account a gain drift due to
the Ge crystal temperature change (see Section 4.3.1). The range of the measured γ-ray
energy for the 1406-keV peak before the Doppler-shift correction is 1300–1500 keV as
shown in Fig. 5.4(a) (dotted red line). The accuracy of the energy calibration for this
energy region is better than ±0.4 keV as shown in Fig. 4.9.
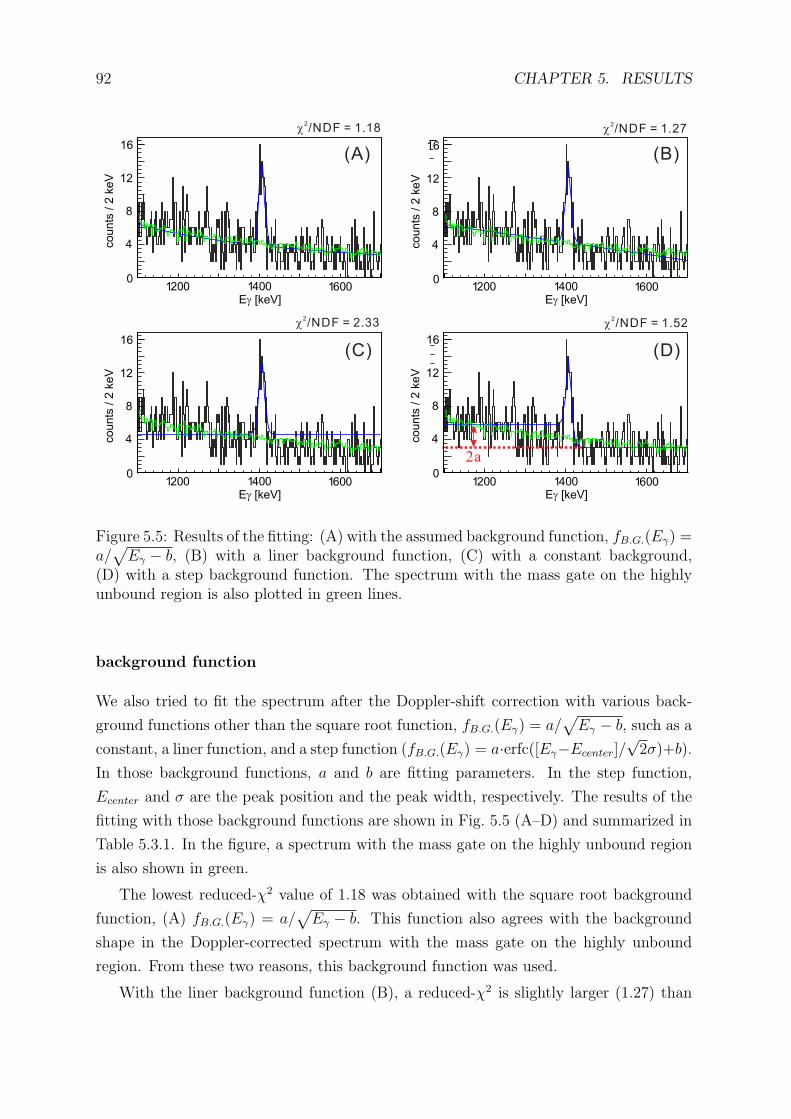
92 CHAPTER 5. RESULTS
c2/NDF = 1.18
1 002 1 004 1 006Eg [keV]
1 002 1 004 1 006Eg [keV]
1 002 1 004 1 006Eg [keV]
1 002 1 004 1 006Eg [keV]
co
unts
/ 2
keV
0
4
8
16
12
co
unts
/ 2
keV
0
4
8
16
12
co
un
ts /
2 k
eV
0
4
8
16
12
cou
nts
/ 2
ke
V
0
4
8
16
12
(C) (D)
(A) (B)
2a
c2/NDF = 1.27
c2/NDF = 2.33 c
2/NDF = 1.52
Figure 5.5: Results of the fitting: (A) with the assumed background function, fB.G.(Eγ) =a/
√Eγ − b, (B) with a liner background function, (C) with a constant background,
(D) with a step background function. The spectrum with the mass gate on the highlyunbound region is also plotted in green lines.
background function
We also tried to fit the spectrum after the Doppler-shift correction with various back-
ground functions other than the square root function, fB.G.(Eγ) = a/√
Eγ − b, such as a
constant, a liner function, and a step function (fB.G.(Eγ) = a·erfc([Eγ−Ecenter]/√2σ)+b).
In those background functions, a and b are fitting parameters. In the step function,
Ecenter and σ are the peak position and the peak width, respectively. The results of the
fitting with those background functions are shown in Fig. 5.5 (A–D) and summarized in
Table 5.3.1. In the figure, a spectrum with the mass gate on the highly unbound region
is also shown in green.
The lowest reduced-χ2 value of 1.18 was obtained with the square root background
function, (A) fB.G.(Eγ) = a/√
Eγ − b. This function also agrees with the background
shape in the Doppler-corrected spectrum with the mass gate on the highly unbound
region. From these two reasons, this background function was used.
With the liner background function (B), a reduced-χ2 is slightly larger (1.27) than
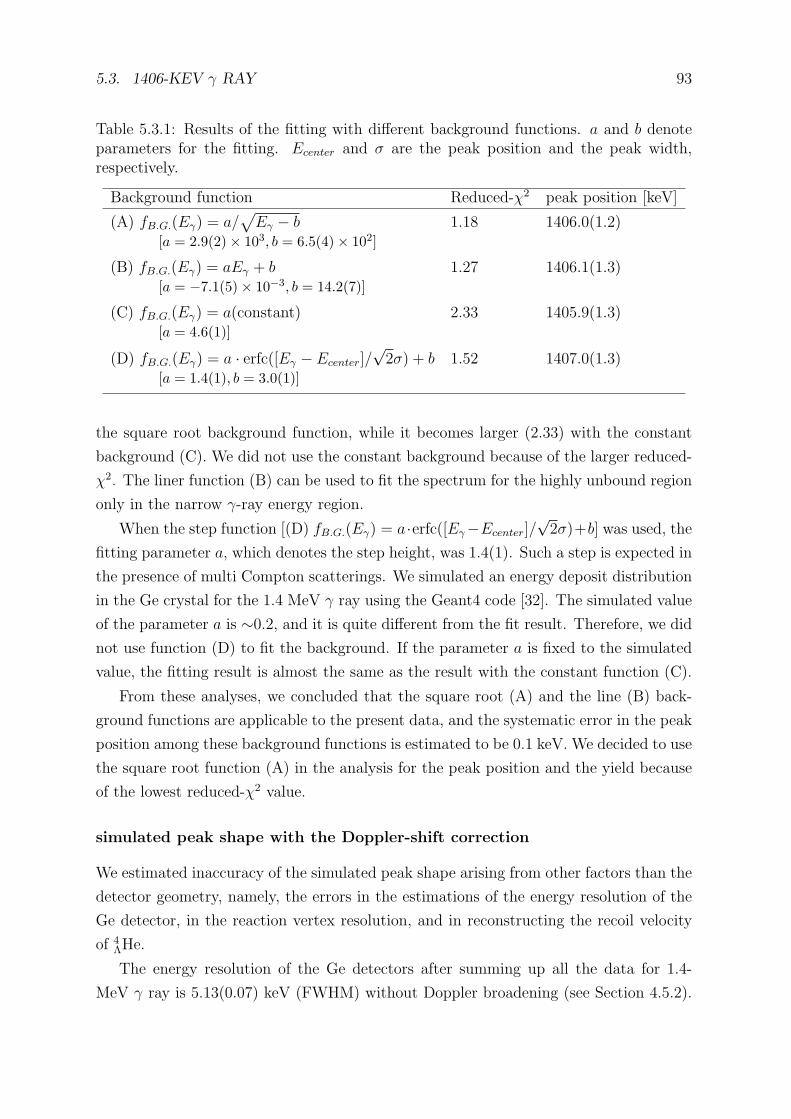
5.3. 1406-KEV γ RAY 93
Table 5.3.1: Results of the fitting with different background functions. a and b denoteparameters for the fitting. Ecenter and σ are the peak position and the peak width,respectively.
Background function Reduced-χ2 peak position [keV]
(A) fB.G.(Eγ) = a/√Eγ − b 1.18 1406.0(1.2)
[a = 2.9(2)× 103, b = 6.5(4)× 102]
(B) fB.G.(Eγ) = aEγ + b 1.27 1406.1(1.3)[a = −7.1(5)× 10−3, b = 14.2(7)]
(C) fB.G.(Eγ) = a(constant) 2.33 1405.9(1.3)[a = 4.6(1)]
(D) fB.G.(Eγ) = a · erfc([Eγ − Ecenter]/√2σ) + b 1.52 1407.0(1.3)
[a = 1.4(1), b = 3.0(1)]
the square root background function, while it becomes larger (2.33) with the constant
background (C). We did not use the constant background because of the larger reduced-
χ2. The liner function (B) can be used to fit the spectrum for the highly unbound region
only in the narrow γ-ray energy region.
When the step function [(D) fB.G.(Eγ) = a·erfc([Eγ−Ecenter]/√2σ)+b] was used, the
fitting parameter a, which denotes the step height, was 1.4(1). Such a step is expected in
the presence of multi Compton scatterings. We simulated an energy deposit distribution
in the Ge crystal for the 1.4 MeV γ ray using the Geant4 code [32]. The simulated value
of the parameter a is ∼0.2, and it is quite different from the fit result. Therefore, we did
not use function (D) to fit the background. If the parameter a is fixed to the simulated
value, the fitting result is almost the same as the result with the constant function (C).
From these analyses, we concluded that the square root (A) and the line (B) back-
ground functions are applicable to the present data, and the systematic error in the peak
position among these background functions is estimated to be 0.1 keV. We decided to use
the square root function (A) in the analysis for the peak position and the yield because
of the lowest reduced-χ2 value.
simulated peak shape with the Doppler-shift correction
We estimated inaccuracy of the simulated peak shape arising from other factors than the
detector geometry, namely, the errors in the estimations of the energy resolution of the
Ge detector, in the reaction vertex resolution, and in reconstructing the recoil velocity
of 4ΛHe.
The energy resolution of the Ge detectors after summing up all the data for 1.4-
MeV γ ray is 5.13(0.07) keV (FWHM) without Doppler broadening (see Section 4.5.2).
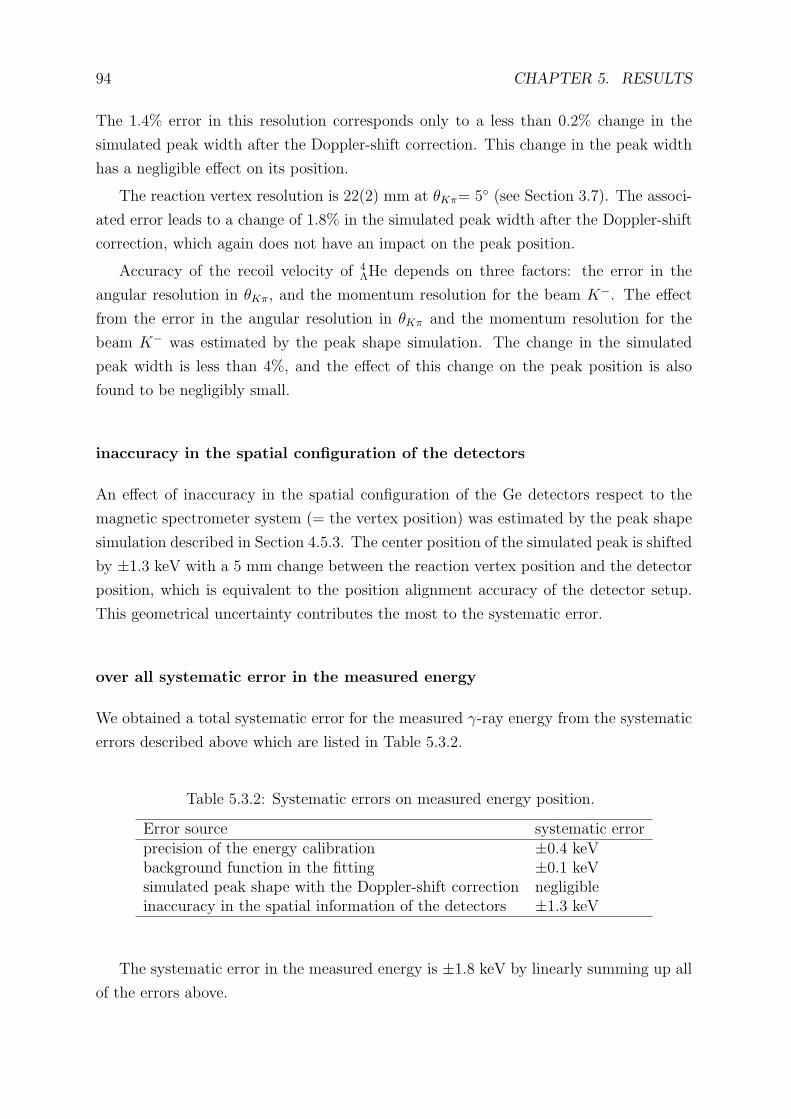
94 CHAPTER 5. RESULTS
The 1.4% error in this resolution corresponds only to a less than 0.2% change in the
simulated peak width after the Doppler-shift correction. This change in the peak width
has a negligible effect on its position.
The reaction vertex resolution is 22(2) mm at θKπ= 5◦ (see Section 3.7). The associ-
ated error leads to a change of 1.8% in the simulated peak width after the Doppler-shift
correction, which again does not have an impact on the peak position.
Accuracy of the recoil velocity of 4ΛHe depends on three factors: the error in the
angular resolution in θKπ, and the momentum resolution for the beam K−. The effect
from the error in the angular resolution in θKπ and the momentum resolution for the
beam K− was estimated by the peak shape simulation. The change in the simulated
peak width is less than 4%, and the effect of this change on the peak position is also
found to be negligibly small.
inaccuracy in the spatial configuration of the detectors
An effect of inaccuracy in the spatial configuration of the Ge detectors respect to the
magnetic spectrometer system (= the vertex position) was estimated by the peak shape
simulation described in Section 4.5.3. The center position of the simulated peak is shifted
by ±1.3 keV with a 5 mm change between the reaction vertex position and the detector
position, which is equivalent to the position alignment accuracy of the detector setup.
This geometrical uncertainty contributes the most to the systematic error.
over all systematic error in the measured energy
We obtained a total systematic error for the measured γ-ray energy from the systematic
errors described above which are listed in Table 5.3.2.
Table 5.3.2: Systematic errors on measured energy position.
Error source systematic errorprecision of the energy calibration ±0.4 keVbackground function in the fitting ±0.1 keVsimulated peak shape with the Doppler-shift correction negligibleinaccuracy in the spatial information of the detectors ±1.3 keV
The systematic error in the measured energy is ±1.8 keV by linearly summing up all
of the errors above.
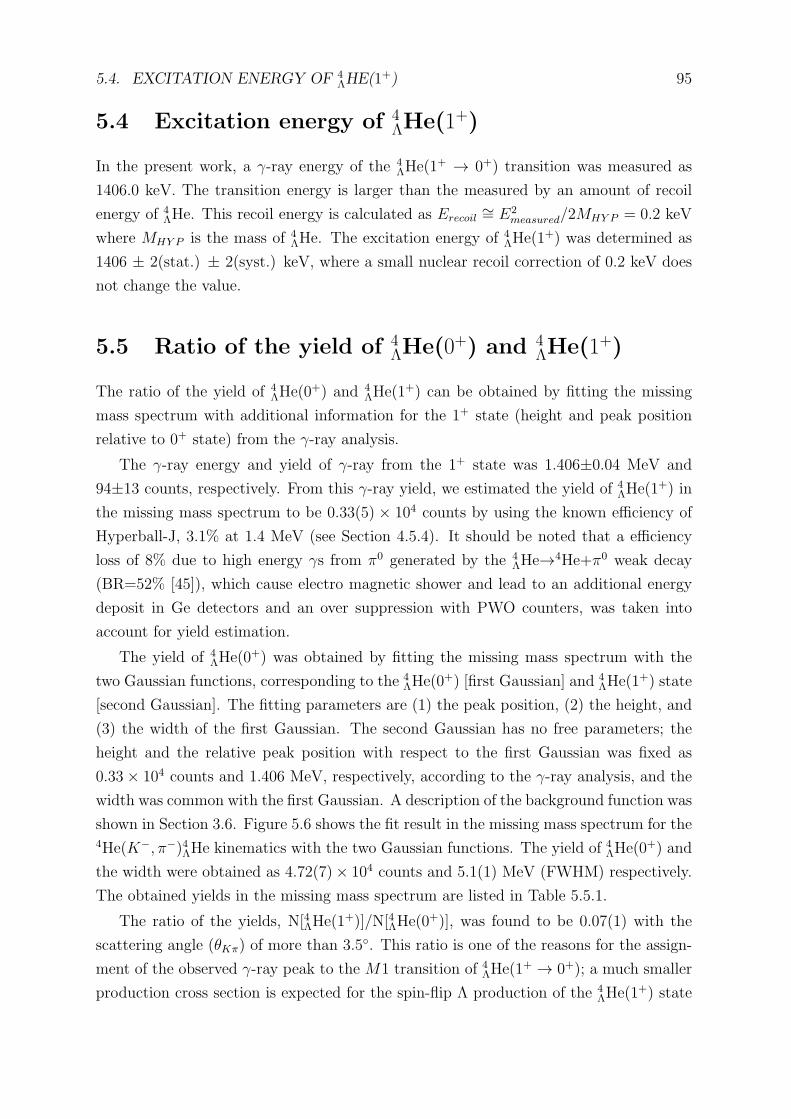
5.4. EXCITATION ENERGY OF 4ΛHE(1
+) 95
5.4 Excitation energy of 4ΛHe(1+)
In the present work, a γ-ray energy of the 4ΛHe(1
+ → 0+) transition was measured as
1406.0 keV. The transition energy is larger than the measured by an amount of recoil
energy of 4ΛHe. This recoil energy is calculated as Erecoil
∼= E2measured/2MHY P = 0.2 keV
where MHY P is the mass of 4ΛHe. The excitation energy of 4
ΛHe(1+) was determined as
1406 ± 2(stat.) ± 2(syst.) keV, where a small nuclear recoil correction of 0.2 keV does
not change the value.
5.5 Ratio of the yield of 4ΛHe(0+) and 4
ΛHe(1+)
The ratio of the yield of 4ΛHe(0
+) and 4ΛHe(1
+) can be obtained by fitting the missing
mass spectrum with additional information for the 1+ state (height and peak position
relative to 0+ state) from the γ-ray analysis.
The γ-ray energy and yield of γ-ray from the 1+ state was 1.406±0.04 MeV and
94±13 counts, respectively. From this γ-ray yield, we estimated the yield of 4ΛHe(1
+) in
the missing mass spectrum to be 0.33(5) × 104 counts by using the known efficiency of
Hyperball-J, 3.1% at 1.4 MeV (see Section 4.5.4). It should be noted that a efficiency
loss of 8% due to high energy γs from π0 generated by the 4ΛHe→4He+π0 weak decay
(BR=52% [45]), which cause electro magnetic shower and lead to an additional energy
deposit in Ge detectors and an over suppression with PWO counters, was taken into
account for yield estimation.
The yield of 4ΛHe(0
+) was obtained by fitting the missing mass spectrum with the
two Gaussian functions, corresponding to the 4ΛHe(0
+) [first Gaussian] and 4ΛHe(1
+) state
[second Gaussian]. The fitting parameters are (1) the peak position, (2) the height, and
(3) the width of the first Gaussian. The second Gaussian has no free parameters; the
height and the relative peak position with respect to the first Gaussian was fixed as
0.33× 10⁴ counts and 1.406 MeV, respectively, according to the γ-ray analysis, and the
width was common with the first Gaussian. A description of the background function was
shown in Section 3.6. Figure 5.6 shows the fit result in the missing mass spectrum for the4He(K−, π−)4ΛHe kinematics with the two Gaussian functions. The yield of 4
ΛHe(0+) and
the width were obtained as 4.72(7)× 104 counts and 5.1(1) MeV (FWHM) respectively.
The obtained yields in the missing mass spectrum are listed in Table 5.5.1.
The ratio of the yields, N[4ΛHe(1+)]/N[4ΛHe(0
+)], was found to be 0.07(1) with the
scattering angle (θKπ) of more than 3.5◦. This ratio is one of the reasons for the assign-
ment of the observed γ-ray peak to the M1 transition of 4ΛHe(1
+ → 0+); a much smaller
production cross section is expected for the spin-flip Λ production of the 4ΛHe(1
+) state
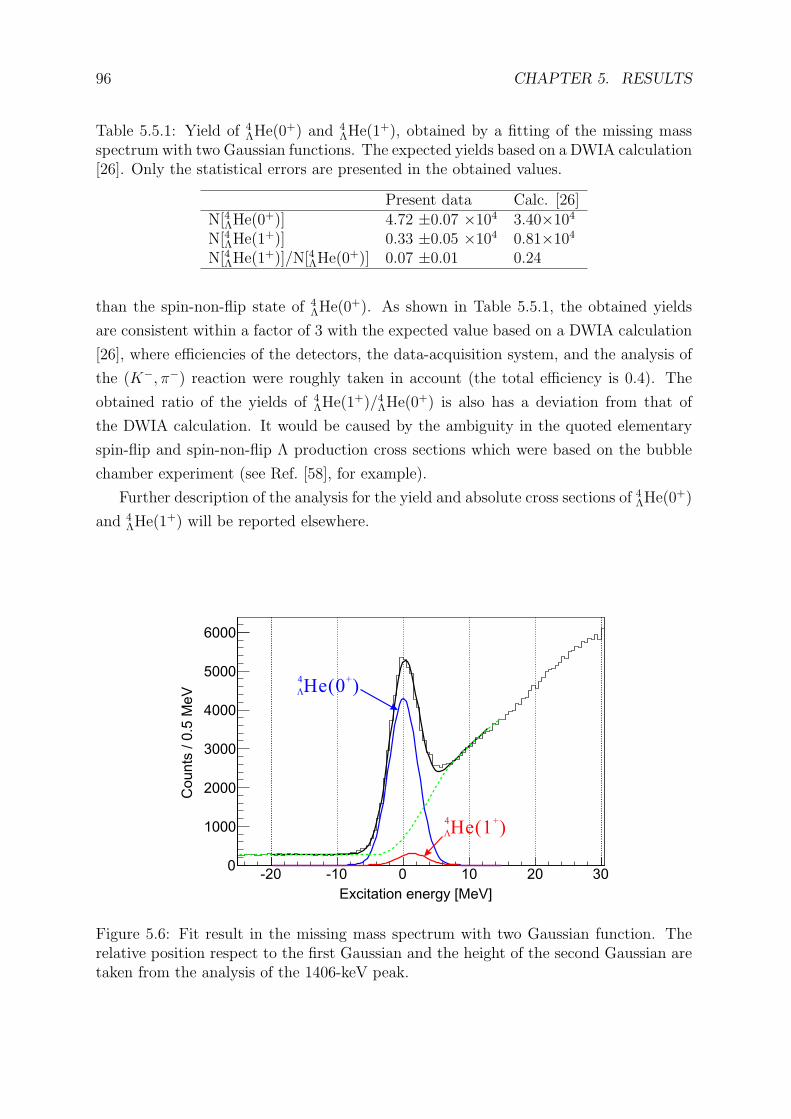
96 CHAPTER 5. RESULTS
Table 5.5.1: Yield of 4ΛHe(0
+) and 4ΛHe(1
+), obtained by a fitting of the missing massspectrum with two Gaussian functions. The expected yields based on a DWIA calculation[26]. Only the statistical errors are presented in the obtained values.
Present data Calc. [26]N[4ΛHe(0
+)] 4.72 ±0.07 ×10⁴ 3.40×10⁴
N[4ΛHe(1+)] 0.33 ±0.05 ×10⁴ 0.81×10⁴
N[4ΛHe(1+)]/N[4ΛHe(0
+)] 0.07 ±0.01 0.24
than the spin-non-flip state of 4ΛHe(0
+). As shown in Table 5.5.1, the obtained yields
are consistent within a factor of 3 with the expected value based on a DWIA calculation
[26], where efficiencies of the detectors, the data-acquisition system, and the analysis of
the (K−, π−) reaction were roughly taken in account (the total efficiency is 0.4). The
obtained ratio of the yields of 4ΛHe(1
+)/4ΛHe(0+) is also has a deviation from that of
the DWIA calculation. It would be caused by the ambiguity in the quoted elementary
spin-flip and spin-non-flip Λ production cross sections which were based on the bubble
chamber experiment (see Ref. [58], for example).
Further description of the analysis for the yield and absolute cross sections of 4ΛHe(0
+)
and 4ΛHe(1
+) will be reported elsewhere.
Excitation energy [MeV]
-20 -10 0 10 20 30
Counts
/ 0
.5 M
eV
0
1000
2000
3000
4000
5000
6000
4 +He(0 )
4 +He(1 )
L
L
Figure 5.6: Fit result in the missing mass spectrum with two Gaussian function. Therelative position respect to the first Gaussian and the height of the second Gaussian aretaken from the analysis of the 1406-keV peak.
Chapter 6
Discussion
In the present work, the γ-ray transition of 4ΛHe(1
+ → 0+) was unambiguously identified,
and the excitation energy of the 4ΛHe(1
+) state was precisely determined to be 1.406 ±0.002 ± 0.002 MeV. In this chapter, we will compare the present data with the past γ-
ray measurement. We will also discuss theoretical calculations for the charge symmetry
breaking effect in the mirror hypernuclei, 4ΛH and 4
ΛHe.
6.1 Comparison with the past γ-ray measurement
The comparison between the present and the past experiment for Eex(4ΛHe(1
+)) is dis-
cussed in this section.
There is only one experiment [14] in the past which reported the γ-ray energy from4ΛHe (see Appendix A on this experiment) before the present result. It reported the
excitation energy of 4ΛHe(1
+) to be 1.15±0.04 MeV. This energy deviates far from the
present value of 1.406±0.002±0.002 MeV beyond errors in these results. Figure 6.1 shows
the γ-ray energy spectra of the present and the old experiment: (A) shows the spectrum
reported in the previous experiment with stopped K− on 6Li and 7Li targets by tagging
a π0 from the 4ΛHe→4He+π0 with a π0 kinetic energy selection, (B) is the same as (A),
but with a 6Li target and a different gate for the kinetic energy, (C) and (D) show the
spectra obtained in the present work before/after the Doppler-shift correction.
They claimed that they observed a γ-ray peak from 4ΛHe at the energy of 1.15 ± 0.04
MeV as shown in Fig. 6.1 (A) and (B). However, no such peak structure was found in the
spectra of the present work as shown in Fig. 6.1 (C) and (D). Therefore, we concluded
that the observed peak in the past experiment, if it really exists, did not belong to 4ΛHe.
In addition, the statistical significance of less than 3σ for the 1.15-MeV peak is not
enough. On the other hand, the γ-ray peak at 1406 keV clearly observed in the present
work as shown in Fig. 6.1 (D) is absent in the spectrum (A) and (B).
The present experiment achieved a higher sensitivity because, (1) the hypernucleus
97
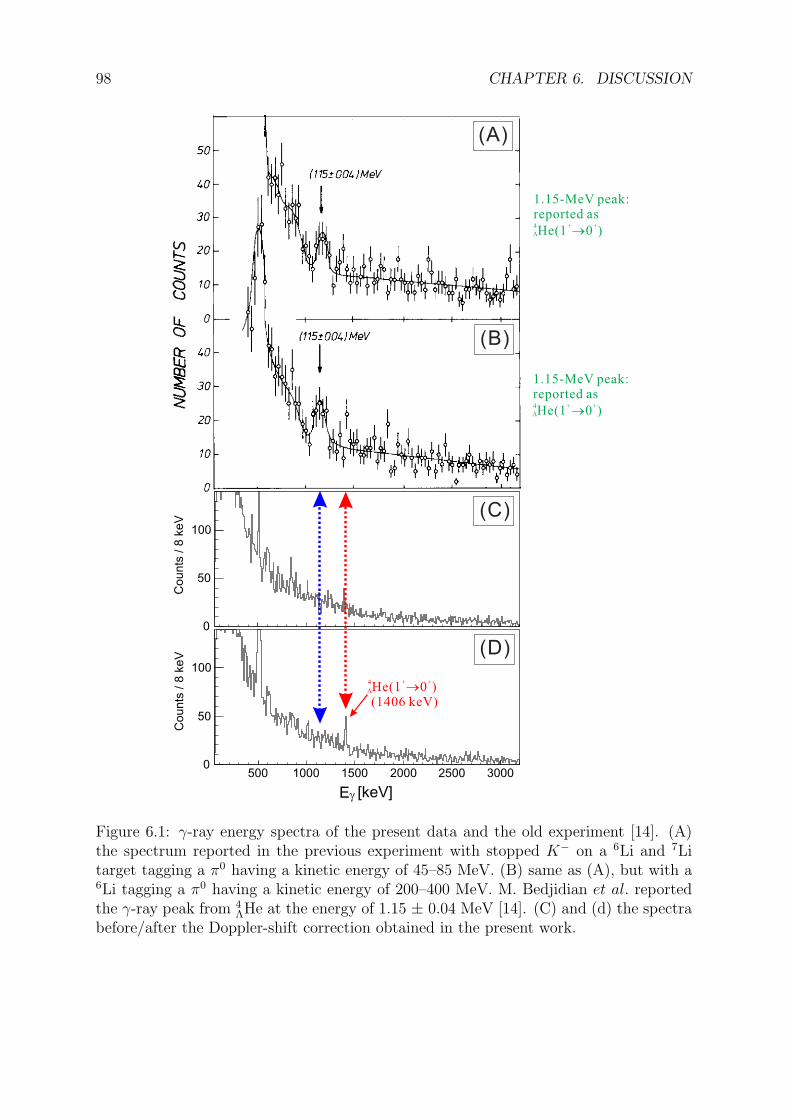
98 CHAPTER 6. DISCUSSION
Co
un
ts /
8 k
eV
0
50
100
[keV]Eg
Co
un
ts /
8 k
eV
0
50
100
(A)
(B)
(C)
(D)
4 + +He(1 0 )®(1406 keV)
L
500 1000 1500 2000 2500 3000
1.15-MeV peak:reported as4 + +He(1 0 )®L
1.15-MeV peak:reported as4 + +He(1 0 )®L
Figure 6.1: γ-ray energy spectra of the present data and the old experiment [14]. (A)the spectrum reported in the previous experiment with stopped K− on a 6Li and 7Litarget tagging a π0 having a kinetic energy of 45–85 MeV. (B) same as (A), but with a6Li tagging a π0 having a kinetic energy of 200–400 MeV. M. Bedjidian et al. reportedthe γ-ray peak from 4
ΛHe at the energy of 1.15 ± 0.04 MeV [14]. (C) and (d) the spectrabefore/after the Doppler-shift correction obtained in the present work.
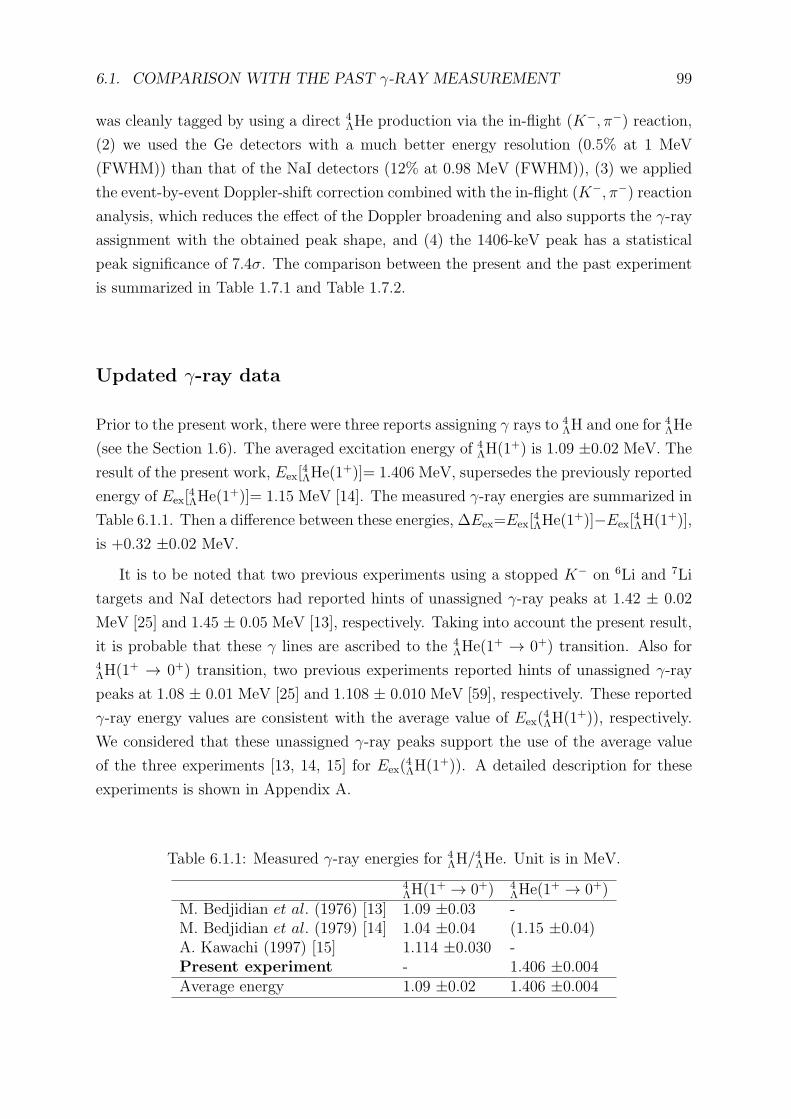
6.1. COMPARISON WITH THE PAST γ-RAY MEASUREMENT 99
was cleanly tagged by using a direct 4ΛHe production via the in-flight (K−, π−) reaction,
(2) we used the Ge detectors with a much better energy resolution (0.5% at 1 MeV
(FWHM)) than that of the NaI detectors (12% at 0.98 MeV (FWHM)), (3) we applied
the event-by-event Doppler-shift correction combined with the in-flight (K−, π−) reaction
analysis, which reduces the effect of the Doppler broadening and also supports the γ-ray
assignment with the obtained peak shape, and (4) the 1406-keV peak has a statistical
peak significance of 7.4σ. The comparison between the present and the past experiment
is summarized in Table 1.7.1 and Table 1.7.2.
Updated γ-ray data
Prior to the present work, there were three reports assigning γ rays to 4ΛH and one for 4
ΛHe
(see the Section 1.6). The averaged excitation energy of 4ΛH(1
+) is 1.09 ±0.02 MeV. The
result of the present work, Eex[4ΛHe(1
+)]= 1.406 MeV, supersedes the previously reported
energy of Eex[4ΛHe(1
+)]= 1.15 MeV [14]. The measured γ-ray energies are summarized in
Table 6.1.1. Then a difference between these energies, ∆Eex=Eex[4ΛHe(1
+)]−Eex[4ΛH(1
+)],
is +0.32 ±0.02 MeV.
It is to be noted that two previous experiments using a stopped K− on 6Li and 7Li
targets and NaI detectors had reported hints of unassigned γ-ray peaks at 1.42 ± 0.02
MeV [25] and 1.45 ± 0.05 MeV [13], respectively. Taking into account the present result,
it is probable that these γ lines are ascribed to the 4ΛHe(1
+ → 0+) transition. Also for4ΛH(1
+ → 0+) transition, two previous experiments reported hints of unassigned γ-ray
peaks at 1.08 ± 0.01 MeV [25] and 1.108 ± 0.010 MeV [59], respectively. These reported
γ-ray energy values are consistent with the average value of Eex(4ΛH(1
+)), respectively.
We considered that these unassigned γ-ray peaks support the use of the average value
of the three experiments [13, 14, 15] for Eex(4ΛH(1
+)). A detailed description for these
experiments is shown in Appendix A.
Table 6.1.1: Measured γ-ray energies for 4ΛH/
4ΛHe. Unit is in MeV.
4ΛH(1
+ → 0+) 4ΛHe(1
+ → 0+)M. Bedjidian et al. (1976) [13] 1.09 ±0.03 -M. Bedjidian et al. (1979) [14] 1.04 ±0.04 (1.15 ±0.04)A. Kawachi (1997) [15] 1.114 ±0.030 -Present experiment - 1.406 ±0.004Average energy 1.09 ±0.02 1.406 ±0.004
100 CHAPTER 6. DISCUSSION
6.2 Level scheme of 4ΛH/4
ΛHe
Based on the present result, we updated the level scheme of 4ΛHe. Figure 6.2 shows the
updated level schemes of the mirror hypernuclei, 4ΛH and 4
ΛHe, where only the assigned
γ-ray data are used to obtain the excitation energies.
By combining the emulsion data of BΛ(4ΛHe(0
+))=2.39 ±0.03 MeV, the present result
gives BΛ(4ΛHe(1
+))= 0.98 ± 0.03 MeV, where the error in BΛ(4ΛHe(1
+)) of 0.03 MeV is
1/2+
1+
1.090.02
0+
1/2+
1 406.0 002.0 002.
1+
0+2.04 0.04
2.39 0.034H
3H
3He
4He
4He( , )K
- -p( =1.5 GeV/ )p cK
B [MeV]
[present]
0.95 0.04 0.98 0.03
Eg=Eg=
03H + L
3He + L
2.12 0.01 0.09± ±
[MAMI-C]
Figure 6.2: Updated level schemes of the mirror hypernuclei, 4ΛH and 4
ΛHe. Λ bindingenergies (BΛ) of 4
ΛH(0+) and 4
ΛHe(0+) are taken from the past emulsion experiments
[9]. BΛ(4ΛHe(1
+)) and BΛ(4ΛH(1
+)) are obtained using the present and past γ-ray data[13, 14, 15], respectively. Recently, BΛ(
4ΛH(0
+)) = 2.12 ± 0.01 (stat.) ± 0.09 (syst.)MeV was obtained with an independent technique [16].
Table 6.1.2: Measured Λ binding energies (BΛ) of4ΛH/
4ΛHe. Unit is in MeV.
Ground state (0+) 1st-excited state (1+)4ΛHe 2.39 ±0.03 0.98 ±0.03with emulsion data4ΛH 2.04 ±0.04 0.95 ±0.04∆BΛ[
4ΛHe−4
ΛH] +0.35 ±0.05 +0.03 ±0.05with MAMI-C data4ΛH 2.12 ±0.10 1.03 ±0.10∆BΛ[
4ΛHe−4
ΛH] +0.27 ±0.11 −0.05 ±0.11
6.3. CSB EFFECT IN 4ΛH/
4ΛHE 101
carried over from the error in BΛ(4ΛHe(0
+)) measured by the emulsion experiments. The
measured BΛ values of 0+ and 1+ states for the mirror hypernuclei, 4ΛH and 4
ΛHe, are
summarized in Table 6.1.2.
6.3 CSB effect in 4ΛH/4
ΛHe
The present result provides a solid experimental evidence for existence of a large CSB
effect in ΛN interaction. Our new findings are summarized below:
Existence of the CSB effect
The excitation energy of 4ΛHe(1
+) (1.406 ±0.004 MeV) obtained in the present work is
largely different from 4ΛH(1
+) (1.09 ±0.02 MeV); the difference amounts to ∆Eex=+0.32
± 0.02 MeV (see Section 6.2), which is larger than +0.06 ±0.05 MeV reported in the
past experiment [14]. Therefore, the existence of the CSB effect in ΛN interaction has
been definitely confirmed via γ-ray data alone.
Strong spin-dependence of the CSB effect
The differences in BΛ values between 4ΛH and 4
ΛHe are summarized in Table 6.1.2. By
comparing BΛ(4ΛHe(1
+)) = 0.98 ± 0.03 MeV and BΛ(4ΛH(1
+)) = 0.95 ± 0.04 MeV,
obtained from the emulsion data of BΛ(0+) as well as the γ-ray data, the difference
in BΛ(1+) is ∆BΛ(1
+) = BΛ(4ΛHe(1
+))−BΛ(4ΛH(1
+)) = +0.03 ± 0.05 MeV, while the
difference in BΛ(0+) is ∆BΛ(0
+) = +0.35 ± 0.05 MeV. If the result of MAMI-C is used
for BΛ(4ΛH(0
+)), these differences will become as ∆BΛ(1+) = −0.05 ± 0.11 MeV and
∆BΛ(0+) = +0.27 ± 0.11 MeV. These values are the same within the errors between the
emulsion and the MAMI-C data.
Thus, the CSB effect is found to be strongly spin dependent, being vanishingly small
in the 1+ state and significantly large in the 0+ state. This demonstrates that the
underlying ΛN CSB interaction has spin dependence. Even if the reported BΛ(0+) value
in 4ΛH or 4
ΛHe has a systematic shift, it is clear that the 0+ state receives a different
energy shift from the CSB effect than the 1+ state, by taking account of the 320 keV
difference in Eex(1+) obtained from γ-ray data, indicating the strong spin dependence of
the CSB effect.
6.4 Theoretical calculations for the CSB effect
The present findings, the confirmation of the CSB effect in ΛN interaction and its spin
dependence, would give novel constraints to baryon-baryon interaction models such as
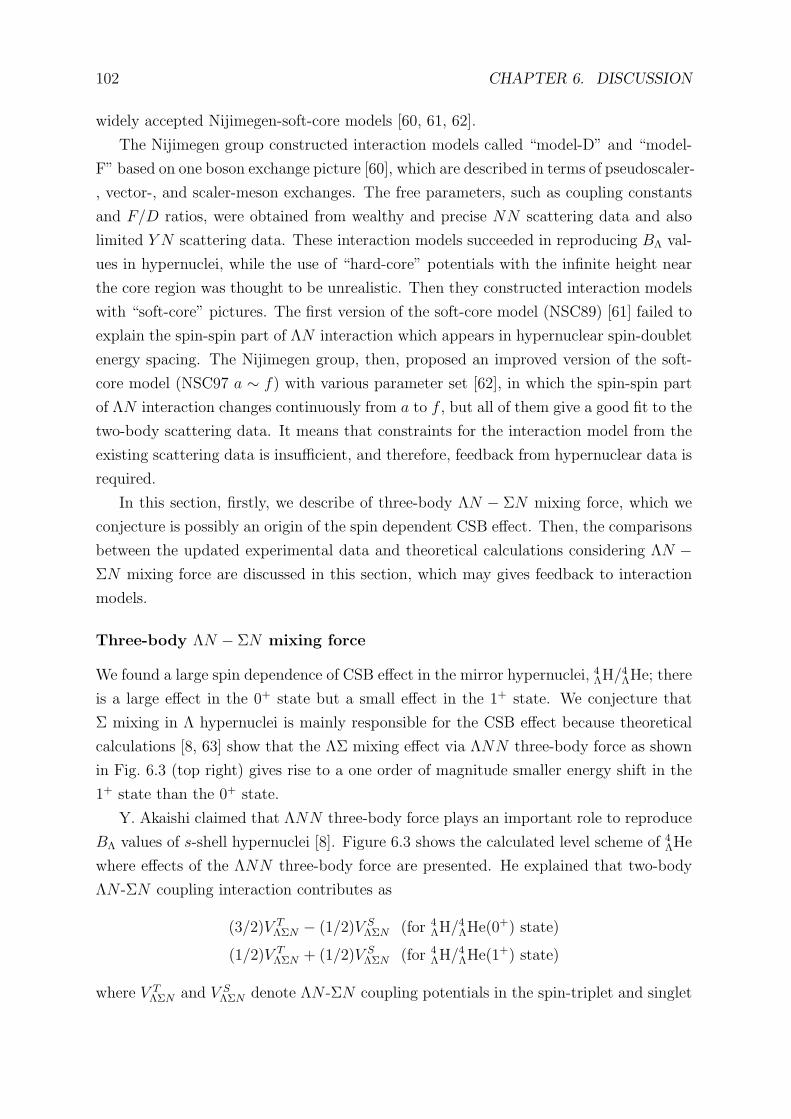
102 CHAPTER 6. DISCUSSION
widely accepted Nijimegen-soft-core models [60, 61, 62].
The Nijimegen group constructed interaction models called “model-D” and “model-
F” based on one boson exchange picture [60], which are described in terms of pseudoscaler-
, vector-, and scaler-meson exchanges. The free parameters, such as coupling constants
and F/D ratios, were obtained from wealthy and precise NN scattering data and also
limited Y N scattering data. These interaction models succeeded in reproducing BΛ val-
ues in hypernuclei, while the use of “hard-core” potentials with the infinite height near
the core region was thought to be unrealistic. Then they constructed interaction models
with “soft-core” pictures. The first version of the soft-core model (NSC89) [61] failed to
explain the spin-spin part of ΛN interaction which appears in hypernuclear spin-doublet
energy spacing. The Nijimegen group, then, proposed an improved version of the soft-
core model (NSC97 a ∼ f) with various parameter set [62], in which the spin-spin part
of ΛN interaction changes continuously from a to f , but all of them give a good fit to the
two-body scattering data. It means that constraints for the interaction model from the
existing scattering data is insufficient, and therefore, feedback from hypernuclear data is
required.
In this section, firstly, we describe of three-body ΛN − ΣN mixing force, which we
conjecture is possibly an origin of the spin dependent CSB effect. Then, the comparisons
between the updated experimental data and theoretical calculations considering ΛN −ΣN mixing force are discussed in this section, which may gives feedback to interaction
models.
Three-body ΛN − ΣN mixing force
We found a large spin dependence of CSB effect in the mirror hypernuclei, 4ΛH/4ΛHe; there
is a large effect in the 0+ state but a small effect in the 1+ state. We conjecture that
Σ mixing in Λ hypernuclei is mainly responsible for the CSB effect because theoretical
calculations [8, 63] show that the ΛΣ mixing effect via ΛNN three-body force as shown
in Fig. 6.3 (top right) gives rise to a one order of magnitude smaller energy shift in the
1+ state than the 0+ state.
Y. Akaishi claimed that ΛNN three-body force plays an important role to reproduce
BΛ values of s-shell hypernuclei [8]. Figure 6.3 shows the calculated level scheme of 4ΛHe
where effects of the ΛNN three-body force are presented. He explained that two-body
ΛN -ΣN coupling interaction contributes as
(3/2)V TΛΣN − (1/2)V S
ΛΣN (for 4ΛH/
4ΛHe(0
+) state)
(1/2)V TΛΣN + (1/2)V S
ΛΣN (for 4ΛH/
4ΛHe(1
+) state)
where V TΛΣN and V S
ΛΣN denote ΛN -ΣN coupling potentials in the spin-triplet and singlet
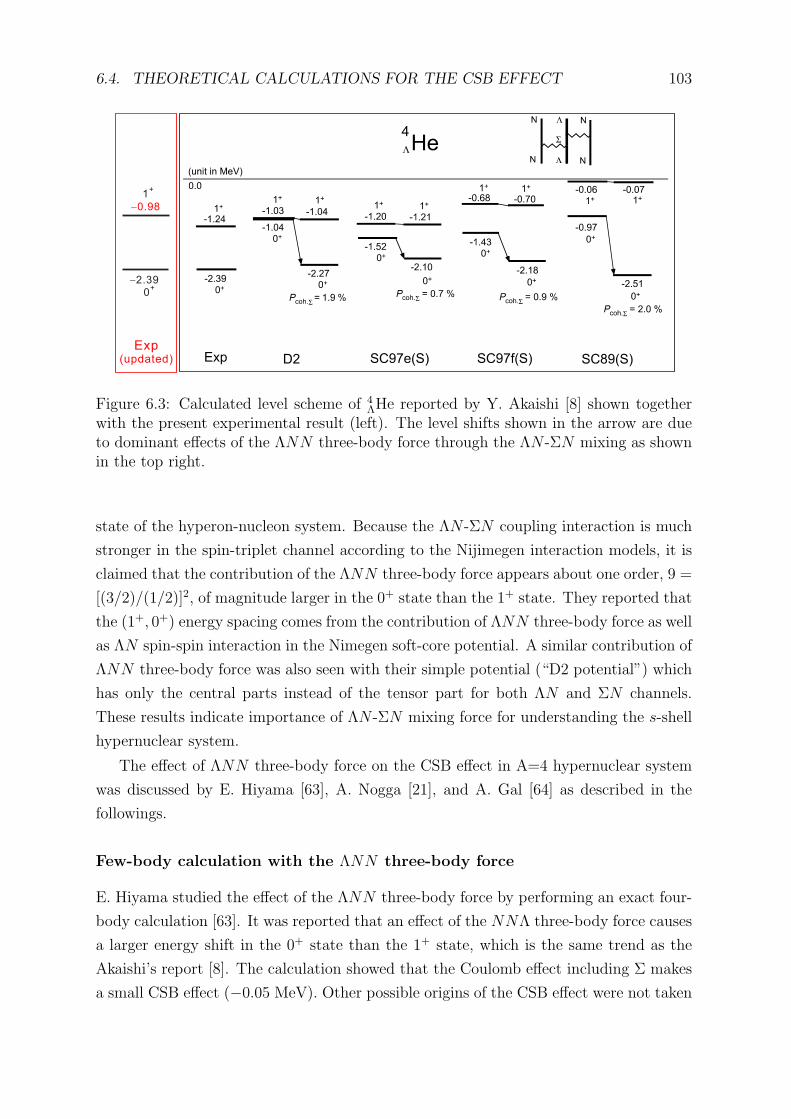
6.4. THEORETICAL CALCULATIONS FOR THE CSB EFFECT 103
Exp(updated)
-2.39
-0.98
0+
1+
Figure 6.3: Calculated level scheme of 4ΛHe reported by Y. Akaishi [8] shown together
with the present experimental result (left). The level shifts shown in the arrow are dueto dominant effects of the ΛNN three-body force through the ΛN -ΣN mixing as shownin the top right.
state of the hyperon-nucleon system. Because the ΛN -ΣN coupling interaction is much
stronger in the spin-triplet channel according to the Nijimegen interaction models, it is
claimed that the contribution of the ΛNN three-body force appears about one order, 9 =
[(3/2)/(1/2)]2, of magnitude larger in the 0+ state than the 1+ state. They reported that
the (1+, 0+) energy spacing comes from the contribution of ΛNN three-body force as well
as ΛN spin-spin interaction in the Nimegen soft-core potential. A similar contribution of
ΛNN three-body force was also seen with their simple potential (“D2 potential”) which
has only the central parts instead of the tensor part for both ΛN and ΣN channels.
These results indicate importance of ΛN -ΣN mixing force for understanding the s-shell
hypernuclear system.
The effect of ΛNN three-body force on the CSB effect in A=4 hypernuclear system
was discussed by E. Hiyama [63], A. Nogga [21], and A. Gal [64] as described in the
followings.
Few-body calculation with the ΛNN three-body force
E. Hiyama studied the effect of the ΛNN three-body force by performing an exact four-
body calculation [63]. It was reported that an effect of the NNΛ three-body force causes
a larger energy shift in the 0+ state than the 1+ state, which is the same trend as the
Akaishi’s report [8]. The calculation showed that the Coulomb effect including Σ makes
a small CSB effect (−0.05 MeV). Other possible origins of the CSB effect were not taken
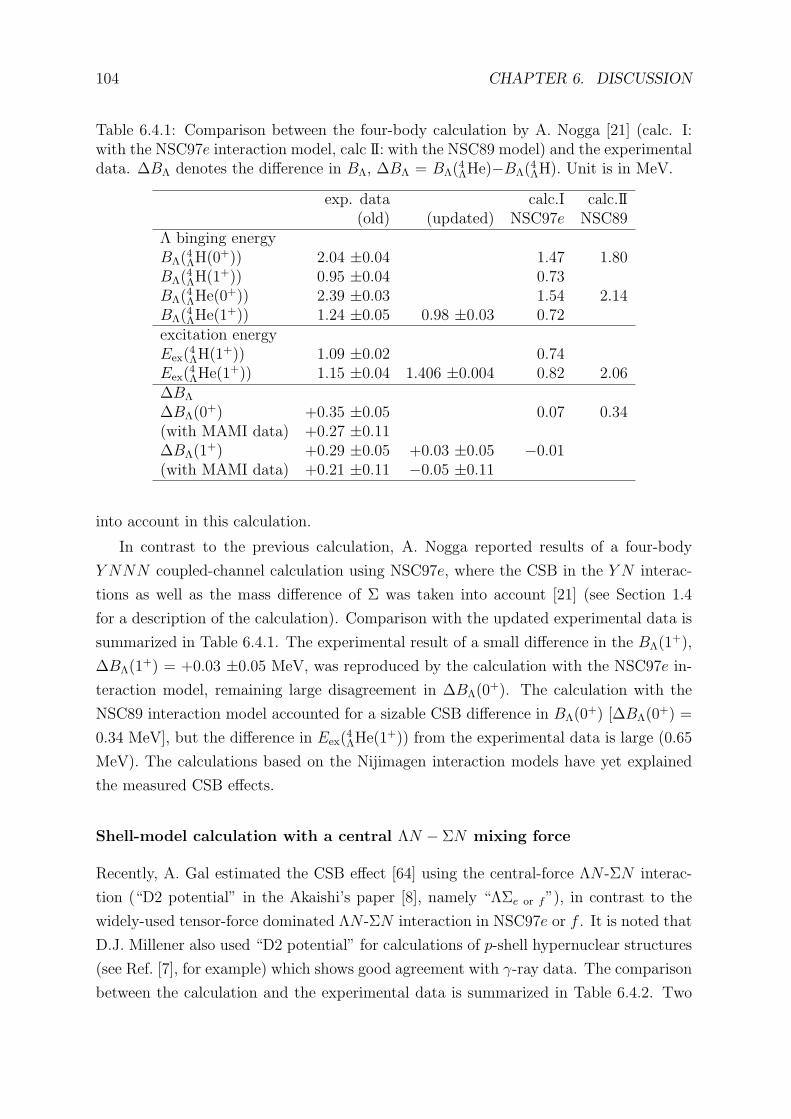
104 CHAPTER 6. DISCUSSION
Table 6.4.1: Comparison between the four-body calculation by A. Nogga [21] (calc. I:with the NSC97e interaction model, calc II: with the NSC89 model) and the experimentaldata. ∆BΛ denotes the difference in BΛ, ∆BΛ = BΛ(
4ΛHe)−BΛ(
4ΛH). Unit is in MeV.
exp. data calc.I calc.II(old) (updated) NSC97e NSC89
Λ binging energyBΛ(
4ΛH(0
+)) 2.04 ±0.04 1.47 1.80BΛ(
4ΛH(1
+)) 0.95 ±0.04 0.73BΛ(
4ΛHe(0
+)) 2.39 ±0.03 1.54 2.14BΛ(
4ΛHe(1
+)) 1.24 ±0.05 0.98 ±0.03 0.72excitation energyEex(
4ΛH(1
+)) 1.09 ±0.02 0.74Eex(
4ΛHe(1
+)) 1.15 ±0.04 1.406 ±0.004 0.82 2.06∆BΛ
∆BΛ(0+) +0.35 ±0.05 0.07 0.34
(with MAMI data) +0.27 ±0.11∆BΛ(1
+) +0.29 ±0.05 +0.03 ±0.05 −0.01(with MAMI data) +0.21 ±0.11 −0.05 ±0.11
into account in this calculation.
In contrast to the previous calculation, A. Nogga reported results of a four-body
Y NNN coupled-channel calculation using NSC97e, where the CSB in the Y N interac-
tions as well as the mass difference of Σ was taken into account [21] (see Section 1.4
for a description of the calculation). Comparison with the updated experimental data is
summarized in Table 6.4.1. The experimental result of a small difference in the BΛ(1+),
∆BΛ(1+) = +0.03 ±0.05 MeV, was reproduced by the calculation with the NSC97e in-
teraction model, remaining large disagreement in ∆BΛ(0+). The calculation with the
NSC89 interaction model accounted for a sizable CSB difference in BΛ(0+) [∆BΛ(0
+) =
0.34 MeV], but the difference in Eex(4ΛHe(1
+)) from the experimental data is large (0.65
MeV). The calculations based on the Nijimagen interaction models have yet explained
the measured CSB effects.
Shell-model calculation with a central ΛN − ΣN mixing force
Recently, A. Gal estimated the CSB effect [64] using the central-force ΛN -ΣN interac-
tion (“D2 potential” in the Akaishi’s paper [8], namely “ΛΣe or f”), in contrast to the
widely-used tensor-force dominated ΛN -ΣN interaction in NSC97e or f . It is noted that
D.J. Millener also used “D2 potential” for calculations of p-shell hypernuclear structures
(see Ref. [7], for example) which shows good agreement with γ-ray data. The comparison
between the calculation and the experimental data is summarized in Table 6.4.2. Two
6.4. THEORETICAL CALCULATIONS FOR THE CSB EFFECT 105
Table 6.4.2: Comparison between the shell model calculation by A. Gal [64] andthe experimental data. Each contribution on BΛ difference was defined as ∆BΛ =BΛ(
4ΛHe)−BΛ(
4ΛH). Unit is in keV.
model ∆TY N(0+) ∆VC(0
+) ∆VY N(0+) ∆BΛ(0
+) ∆BΛ(1+)
NSC97e 47 −16 44 75 −10NSC97f 100 −10ΛΣe 39 −45 232 226 30ΛΣf 49 −46 263 266 39exp. data (emulsion) 350 ±50 30 ±50exp. data (MAMI) 270 ±110 −50 ±110
contributions, an asymmetric kinetic energy contribution due to a ΣN intermediate-state
mass difference (∆TY N) and a contribution from Coulomb energy modification induced
by hyperons (∆VC), both being <50 keV, cancel out and do not seem to be a source of
the observed CSB effect (∼300 keV). CSB one-pion-exchange contribution with a ΛΛπ
coupling [20], which arises from Λ-Σ0 mixing, was taken into account in his calculation.
This contribution on the energy (∆VY N) with the “ΛΣe or f” potential was found to be
sizable (>200 keV) for reproducing the existing data, while the NSC97 model gives a
small ∆VY N . It was mentioned that the origin of such a large contribution is a ΛΣ central
part in the selected potential, while the 3S1-3D1 tensor part is dominant in the NSC97
model.
His ∆BΛ values show a good agreement with the experimental data. This fact implies
that the tensor-dominated strong ΛΣ coupling in the widely accepted NSC97 model has
to be reconsidered. In addition, this result suggests that the Λ-Σ mixing force can be a
source of the CSB effect observed in the A=4 hypernuclear systems.
ab initio calculation with the interaction from chiral effective field theory
In contrast to the calculations based on Nijimegen one boson exchange models described
above, D. Gazda and A. Gal studied the CSB effect using the Bonn-Julich leading-
order (LO) chiral effective field theory hyperon-nucleon potential (reported in 2006) [65]
via a four-body ab initio calculation [66]. The LO Bonn-Julich interaction model was
based on one pseudoscaler-meson exchanges and four-baryon contact terms, in which
free parameters were determined from NN and Y N scattering data as in the case of the
Nijimegen interaction models. A charge symmetry breaking Λ − Σ0 mixing vertex was
additionally taken into account in the calculation. The results of their calculation and
the experimental data are summarized in Table 6.4.3. Obtained values are close to the
experimental data, while there is a large dependence of the cutoff momentum parameter
in the interaction model. They claimed that the origin of this large CSB splitting in
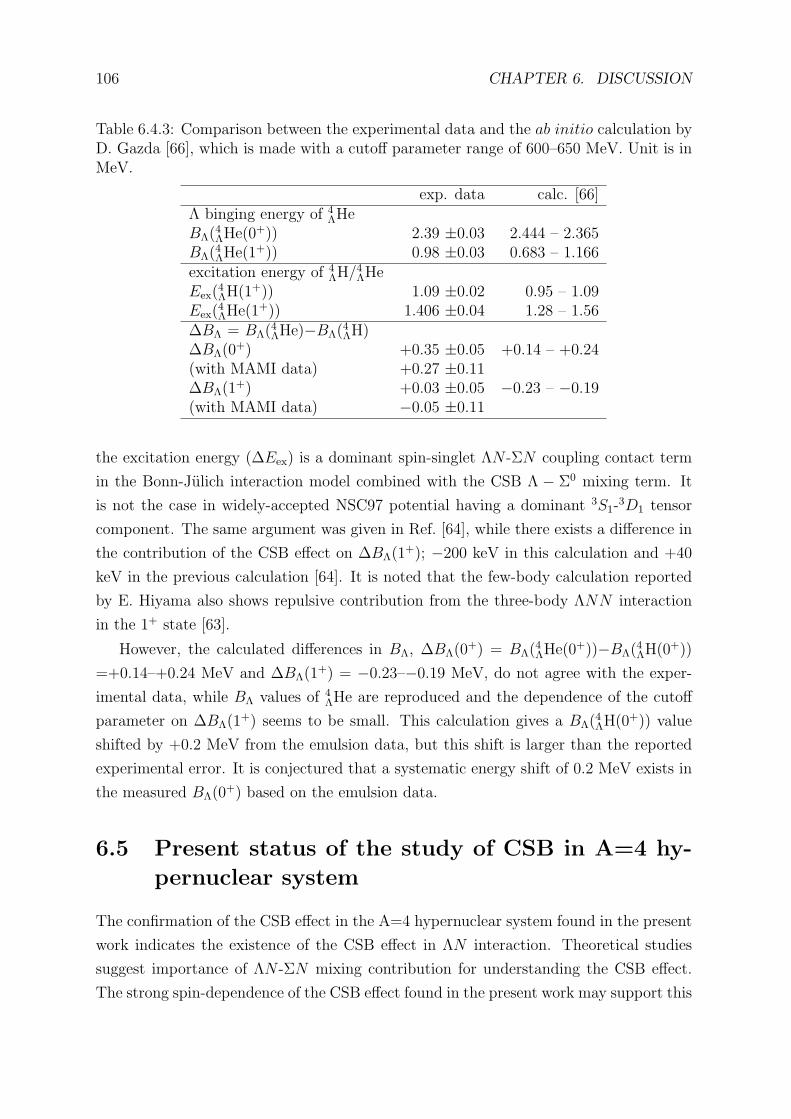
106 CHAPTER 6. DISCUSSION
Table 6.4.3: Comparison between the experimental data and the ab initio calculation byD. Gazda [66], which is made with a cutoff parameter range of 600–650 MeV. Unit is inMeV.
exp. data calc. [66]Λ binging energy of 4
ΛHeBΛ(
4ΛHe(0
+)) 2.39 ±0.03 2.444 – 2.365BΛ(
4ΛHe(1
+)) 0.98 ±0.03 0.683 – 1.166excitation energy of 4
ΛH/4ΛHe
Eex(4ΛH(1
+)) 1.09 ±0.02 0.95 – 1.09Eex(
4ΛHe(1
+)) 1.406 ±0.04 1.28 – 1.56∆BΛ = BΛ(
4ΛHe)−BΛ(
4ΛH)
∆BΛ(0+) +0.35 ±0.05 +0.14 – +0.24
(with MAMI data) +0.27 ±0.11∆BΛ(1
+) +0.03 ±0.05 −0.23 – −0.19(with MAMI data) −0.05 ±0.11
the excitation energy (∆Eex) is a dominant spin-singlet ΛN -ΣN coupling contact term
in the Bonn-Julich interaction model combined with the CSB Λ − Σ0 mixing term. It
is not the case in widely-accepted NSC97 potential having a dominant 3S1-3D1 tensor
component. The same argument was given in Ref. [64], while there exists a difference in
the contribution of the CSB effect on ∆BΛ(1+); −200 keV in this calculation and +40
keV in the previous calculation [64]. It is noted that the few-body calculation reported
by E. Hiyama also shows repulsive contribution from the three-body ΛNN interaction
in the 1+ state [63].
However, the calculated differences in BΛ, ∆BΛ(0+) = BΛ(
4ΛHe(0
+))−BΛ(4ΛH(0
+))
=+0.14–+0.24 MeV and ∆BΛ(1+) = −0.23–−0.19 MeV, do not agree with the exper-
imental data, while BΛ values of 4ΛHe are reproduced and the dependence of the cutoff
parameter on ∆BΛ(1+) seems to be small. This calculation gives a BΛ(
4ΛH(0
+)) value
shifted by +0.2 MeV from the emulsion data, but this shift is larger than the reported
experimental error. It is conjectured that a systematic energy shift of 0.2 MeV exists in
the measured BΛ(0+) based on the emulsion data.
6.5 Present status of the study of CSB in A=4 hy-
pernuclear system
The confirmation of the CSB effect in the A=4 hypernuclear system found in the present
work indicates the existence of the CSB effect in ΛN interaction. Theoretical studies
suggest importance of ΛN -ΣN mixing contribution for understanding the CSB effect.
The strong spin-dependence of the CSB effect found in the present work may support this
6.5. PRESENT STATUS OF THE STUDY OF 4ΛH/
4ΛHE 107
suggestion. However, the widely accepted interaction model, NSC97, failed to reproduce
the experimental data for A=4 mirror hypernuclei. Resent studies claimed that NSC97
interaction model has to be reconsidered in terms of ΛN -ΣN interaction; the central
part seems to be important for CSB effect while the tensor part is dominant in NSC97
interaction model.
Experimentally, the excitation energies of the 4ΛHe(1
+) was accurately determined
by the present work. On the other hand, although the excitation energy of 4ΛH(1
+)
is rather well determined by the past experiments using NaI detectors, re-examination
of this energy using Ge detectors with a much better energy resolution is desirable for
experimental completeness for study of the CSB effect in A=4 hypernuclei. We are,
therefore, now proposing a new γ-ray spectroscopic experiment at J-PARC to measure
the excitation energy of 4ΛH(1
+) [67]. If the experiment is carried out, the excitation
energies of 4ΛH(1
+)/4ΛHe(1+) would be completely re-examined with modern techniques.
For BΛ(0+) values, it is thought that the measured BΛ(0
+) values based on the
emulsion data have a systematic shift. Recently, an experiment at MAMI re-examined
the BΛ(H(0+)) value via precise decay π− spectroscopy and reported a consistent BΛ(0
+)
value with the emulsion data [16]. In this experiment, there is a chance to reduce the
reported systematic error of ±0.09 MeV. The reduction of the systematic error may help
to improve experimental data for study of the CSB effect. On the other hand, it is
difficult to re-examine the BΛ(He(0+)) value with precision of better than 0.1 MeV with
a technique other than emulsion. A discovery of a new method for measuring BΛ(He(0+))
value is necessary to complete experimental data for the CSB effect in ΛN interaction.
It is noted that the large deviations in the calculated CSB effect among the interaction
models, such as Nijimegen model and Bonn-Julich model, would be caused by the lack
of Y N scattering data. The existing data of Y N scattering were obtained via bubble
chamber experiments in 1960s (see references in [68]). More precise Y N scattering data
with modern techniques may help for study of the CSB effect and understanding of
baryon-baryon interaction. Actually, a Σp scattering experiment will be performed at
J-PARC with a newly developed scintillating fiber tracking device [69].
We hope that our new result (and also precise measurements in future) may promote
further theoretical and experimental studies not only for the origin of the CSB effect but
also for the properties of Λ-Σ mixing in hypernuclei.

Chapter 7
Summary
We performed a γ-ray spectroscopic experiment of 4ΛHe (J-PARC E13) at the J-PARC
K1.8 beam line to examine the existence of the Charge Symmetry Breaking (CSB) effect
in the mirror hypernuclei, 4ΛH and 4ΛHe [23, 24]. The CSB effects were previously reported
by the past experiments; there are (1) difference between the Λ binding energies (BΛ)
of 4ΛH(0
+) and 4ΛHe(0
+) and (2) difference between the excitation energies of 4ΛH(1
+)
and 4ΛHe(1
+). The reported excitation energy of 4ΛHe(1
+) was 1.15 ±0.04 MeV [14].
These differences indicate a large CSB effect in ΛN interaction if the data are confirmed.
However, experimental re-examinations by independent and modern techniques with
higher sensitivity have been awaited for the confirmation. A break-through has been
brought by our γ-ray spectroscopic experiment of 4ΛHe; we has measured the transition
energy between the Λ-spin doublet states (1+, 0+) using germanium (Ge) detectors with
a much better energy resolution of 5 keV (FWHM) for 1 MeV γ ray.
The hypernucleus 4ΛHe was produced via the (K−, π−) reaction with a beam momen-
tum of pK = 1.52 GeV/c. The hypernuclear production was tagged by measuring the
missing mass of the 4He(K−, π−)X reaction, where the beam K− and the scattered π−
were particle identified and momentum analyzed by the beam line spectrometer and the
superconducting dipole magnet (SKS) with a modified detector configuration for γ-ray
spectroscopy (SksMinus), respectively. The signal-to-noise ratio in the missing mass as
well as the γ-ray energy spectrum was drastically improved by employing a beam K−
decay suppression counter (SMF). In addition, γ rays from the produced hypernucleus
were detected by a large solid-angle Ge detector array (Hyperball-J), in coincidence with
the (K−, π−) reaction. The event-by-event Doppler-shift correction was necessary be-
cause the lifetime of the 4ΛHe(1
+) state is expected to be much shorter than the stopping
time of the recoiling hypernucleus, and thus the measured γ-ray peak was subject to
Doppler broadening.
From the analysis of the present data, we clearly identified a γ-ray transition from4ΛHe after the Doppler-shift correction and determined the energy spacing between the
109
110 CHAPTER 7. SUMMARY
spin-doublet states (1+, 0+) to be 1406 ± 2 (stat.) ± 2 (syst.) keV. The result of the
present data superseded the claim of the previous experiment (1.15 MeV) and established
the level scheme of 4ΛHe. The Λ binding energy of the excited state was obtained to be
BΛ(4ΛHe(1
+)) = 0.98 ± 0.03 MeV by combining with the emulsion data of BΛ(0+).
The difference between the excitation energy of 4ΛHe(1
+) [1.406 ± 0.004 MeV, the
present data] and that of 4ΛH(1
+) [1.09 ±0.02 MeV, the average of the past three experi-
ments [13, 14, 15]] is definitively non zero. Therefore, the existence of CSB in ΛN inter-
action has been confirmed via γ-ray data alone. By comparing differences in BΛ’s of the
0+ and 1+ states between 4ΛH and 4
ΛHe, namely ∆BΛ(0+) = BΛ(
4ΛHe(0
+)) −BΛ(4ΛH(0
+))
= +0.35 ± 0.05 MeV and ∆BΛ(1+) = +0.03 ± 0.05, we have discovered a large spin
dependence in the CSB effect; the CSB effect is pronounced in the 0+ state while van-
ishingly small in the 1+ state. This fact suggests that Σ mixing in Λ hypernuclei is
responsible for the CSB effect since the 0+ state in 4ΛH/
4ΛHe is expected to receive one
order of magnitude larger energy shift due to Λ-Σ mixing than the 1+ state [8].
The result presented in this thesis has confirmed a sizable CSB effect in ΛN interac-
tion and its strong spin dependence. Further theoretical studies of ΛN -ΣN interaction
will explain the observed CSB effect, giving a relevant contribution to our understanding
of baryon-baryon interactions.
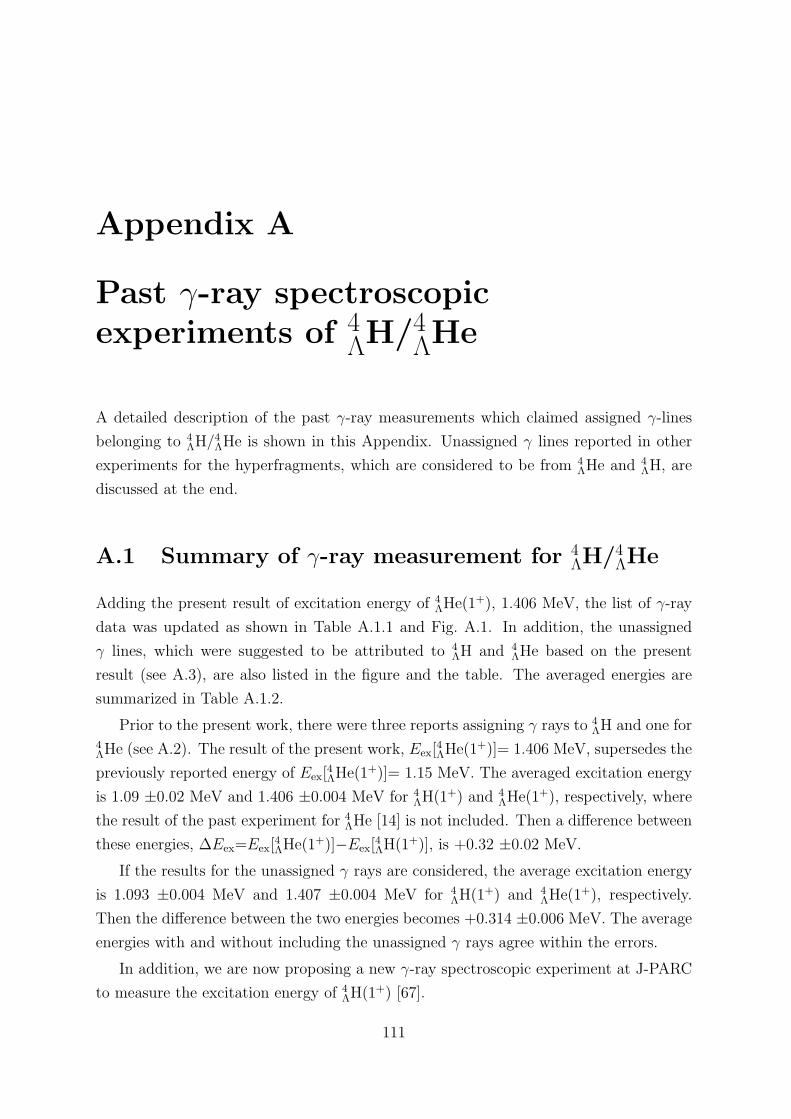
Appendix A
Past γ-ray spectroscopicexperiments of 4
ΛH/4ΛHe
A detailed description of the past γ-ray measurements which claimed assigned γ-lines
belonging to 4ΛH/
4ΛHe is shown in this Appendix. Unassigned γ lines reported in other
experiments for the hyperfragments, which are considered to be from 4ΛHe and 4
ΛH, are
discussed at the end.
A.1 Summary of γ-ray measurement for 4ΛH/4
ΛHe
Adding the present result of excitation energy of 4ΛHe(1
+), 1.406 MeV, the list of γ-ray
data was updated as shown in Table A.1.1 and Fig. A.1. In addition, the unassigned
γ lines, which were suggested to be attributed to 4ΛH and 4
ΛHe based on the present
result (see A.3), are also listed in the figure and the table. The averaged energies are
summarized in Table A.1.2.
Prior to the present work, there were three reports assigning γ rays to 4ΛH and one for
4ΛHe (see A.2). The result of the present work, Eex[
4ΛHe(1
+)]= 1.406 MeV, supersedes the
previously reported energy of Eex[4ΛHe(1
+)]= 1.15 MeV. The averaged excitation energy
is 1.09 ±0.02 MeV and 1.406 ±0.004 MeV for 4ΛH(1
+) and 4ΛHe(1
+), respectively, where
the result of the past experiment for 4ΛHe [14] is not included. Then a difference between
these energies, ∆Eex=Eex[4ΛHe(1
+)]−Eex[4ΛH(1
+)], is +0.32 ±0.02 MeV.
If the results for the unassigned γ rays are considered, the average excitation energy
is 1.093 ±0.004 MeV and 1.407 ±0.004 MeV for 4ΛH(1
+) and 4ΛHe(1
+), respectively.
Then the difference between the two energies becomes +0.314 ±0.006 MeV. The average
energies with and without including the unassigned γ rays agree within the errors.
In addition, we are now proposing a new γ-ray spectroscopic experiment at J-PARC
to measure the excitation energy of 4ΛH(1
+) [67].
111
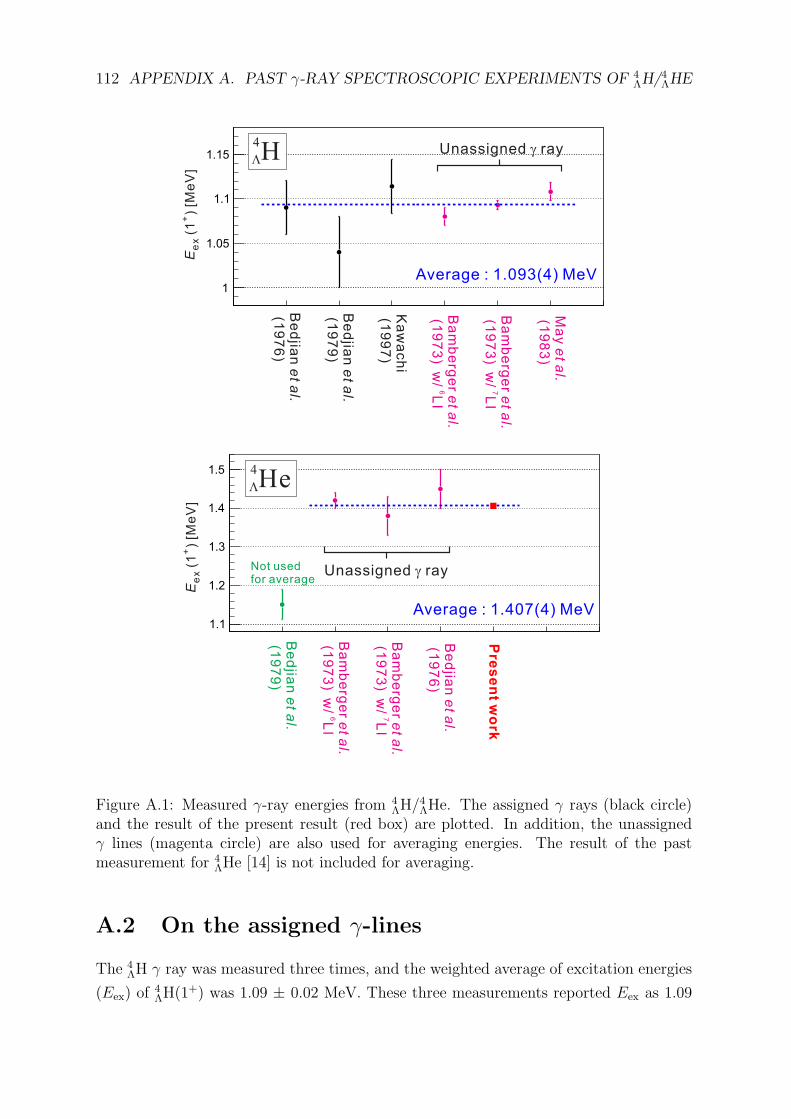
112 APPENDIX A. PAST γ-RAY SPECTROSCOPIC EXPERIMENTS OF 4ΛH/
4ΛHE
Be
djia
ne
t al.
(19
76
)
Be
djia
ne
t al.
(19
79
)
Be
djia
ne
t al.
(19
79
)
Ka
wa
ch
i(1
99
7)
Ba
mb
erg
er
et a
l.
(19
73
) w/
LI
6
1
1.05
1.1
1.15
4
HL
1.1
1.2
1.3
1.4
1.5 4
HeL
Ba
mb
erg
er
et a
l.
(19
73
) w/
LI
7
Be
djia
ne
t al.
(19
76
)
Pre
se
nt w
ork
Not usedfor average
Ba
mb
erg
er
et a
l.
(19
73
) w/
LI
6
Ba
mb
erg
er
et a
l.
(19
73
) w/
LI
7
Ma
ye
t al .
(19
83
)
Unassigned rayg
Unassigned rayg
Average : 1.407(4) MeV
Average : 1.093(4) MeV
Ee
x(1
) [M
eV
]+
Ee
x(1
) [M
eV
]+
Figure A.1: Measured γ-ray energies from 4ΛH/
4ΛHe. The assigned γ rays (black circle)
and the result of the present result (red box) are plotted. In addition, the unassignedγ lines (magenta circle) are also used for averaging energies. The result of the pastmeasurement for 4
ΛHe [14] is not included for averaging.
A.2 On the assigned γ-lines
The 4ΛH γ ray was measured three times, and the weighted average of excitation energies
(Eex) of4ΛH(1
+) was 1.09 ± 0.02 MeV. These three measurements reported Eex as 1.09
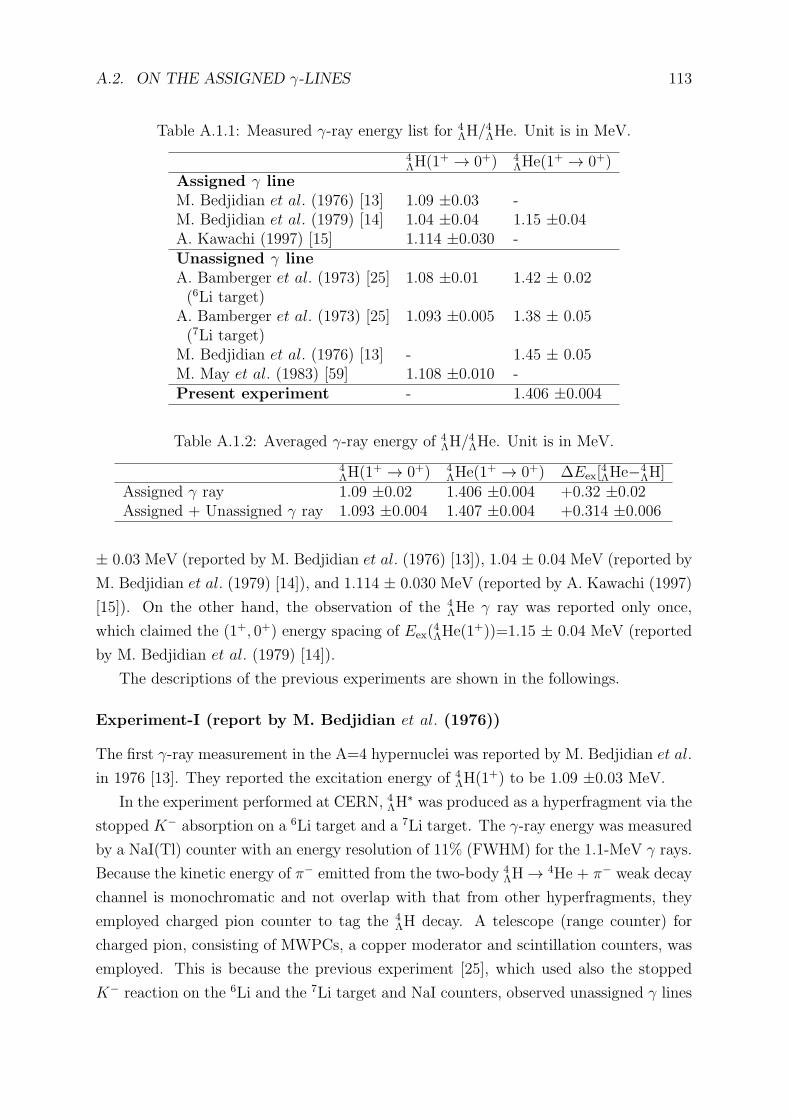
A.2. ON THE ASSIGNED γ-LINES 113
Table A.1.1: Measured γ-ray energy list for 4ΛH/
4ΛHe. Unit is in MeV.
4ΛH(1
+ → 0+) 4ΛHe(1
+ → 0+)Assigned γ lineM. Bedjidian et al. (1976) [13] 1.09 ±0.03 -M. Bedjidian et al. (1979) [14] 1.04 ±0.04 1.15 ±0.04A. Kawachi (1997) [15] 1.114 ±0.030 -Unassigned γ lineA. Bamberger et al. (1973) [25] 1.08 ±0.01 1.42 ± 0.02(6Li target)
A. Bamberger et al. (1973) [25] 1.093 ±0.005 1.38 ± 0.05(7Li target)
M. Bedjidian et al. (1976) [13] - 1.45 ± 0.05M. May et al. (1983) [59] 1.108 ±0.010 -Present experiment - 1.406 ±0.004
Table A.1.2: Averaged γ-ray energy of 4ΛH/
4ΛHe. Unit is in MeV.
4ΛH(1
+ → 0+) 4ΛHe(1
+ → 0+) ∆Eex[4ΛHe−4
ΛH]Assigned γ ray 1.09 ±0.02 1.406 ±0.004 +0.32 ±0.02Assigned + Unassigned γ ray 1.093 ±0.004 1.407 ±0.004 +0.314 ±0.006
± 0.03 MeV (reported by M. Bedjidian et al. (1976) [13]), 1.04 ± 0.04 MeV (reported by
M. Bedjidian et al. (1979) [14]), and 1.114 ± 0.030 MeV (reported by A. Kawachi (1997)
[15]). On the other hand, the observation of the 4ΛHe γ ray was reported only once,
which claimed the (1+, 0+) energy spacing of Eex(4ΛHe(1
+))=1.15 ± 0.04 MeV (reported
by M. Bedjidian et al. (1979) [14]).
The descriptions of the previous experiments are shown in the followings.
Experiment-I (report by M. Bedjidian et al. (1976))
The first γ-ray measurement in the A=4 hypernuclei was reported by M. Bedjidian et al.
in 1976 [13]. They reported the excitation energy of 4ΛH(1
+) to be 1.09 ±0.03 MeV.
In the experiment performed at CERN, 4ΛH∗ was produced as a hyperfragment via the
stopped K− absorption on a 6Li target and a 7Li target. The γ-ray energy was measured
by a NaI(Tl) counter with an energy resolution of 11% (FWHM) for the 1.1-MeV γ rays.
Because the kinetic energy of π− emitted from the two-body 4ΛH → 4He + π− weak decay
channel is monochromatic and not overlap with that from other hyperfragments, they
employed charged pion counter to tag the 4ΛH decay. A telescope (range counter) for
charged pion, consisting of MWPCs, a copper moderator and scintillation counters, was
employed. This is because the previous experiment [25], which used also the stopped
K− reaction on the 6Li and the 7Li target and NaI counters, observed unassigned γ lines
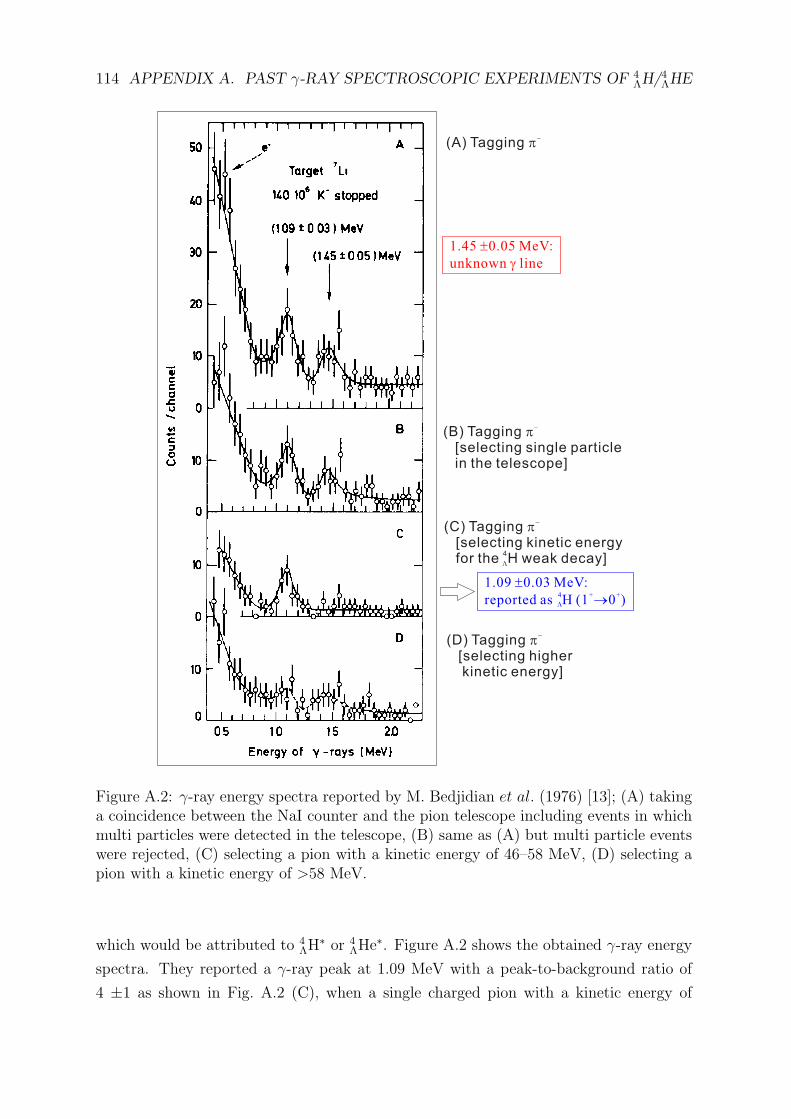
114 APPENDIX A. PAST γ-RAY SPECTROSCOPIC EXPERIMENTS OF 4ΛH/
4ΛHE
1.09 0.03 MeV:±
reported as H (1 0 )4 + +
®L
1.45 0.05 MeV:±
unknown lineg
(A) Tagging p-
(B) Tagging p-
[selecting single particlein the telescope]
(C) Tagging p-
[selecting kinetic energyfor the H weak decay]
4
(D) Tagging p-
[selecting higherkinetic energy]
L
Figure A.2: γ-ray energy spectra reported by M. Bedjidian et al. (1976) [13]; (A) takinga coincidence between the NaI counter and the pion telescope including events in whichmulti particles were detected in the telescope, (B) same as (A) but multi particle eventswere rejected, (C) selecting a pion with a kinetic energy of 46–58 MeV, (D) selecting apion with a kinetic energy of >58 MeV.
which would be attributed to 4ΛH
∗ or 4ΛHe
∗. Figure A.2 shows the obtained γ-ray energy
spectra. They reported a γ-ray peak at 1.09 MeV with a peak-to-background ratio of
4 ±1 as shown in Fig. A.2 (C), when a single charged pion with a kinetic energy of
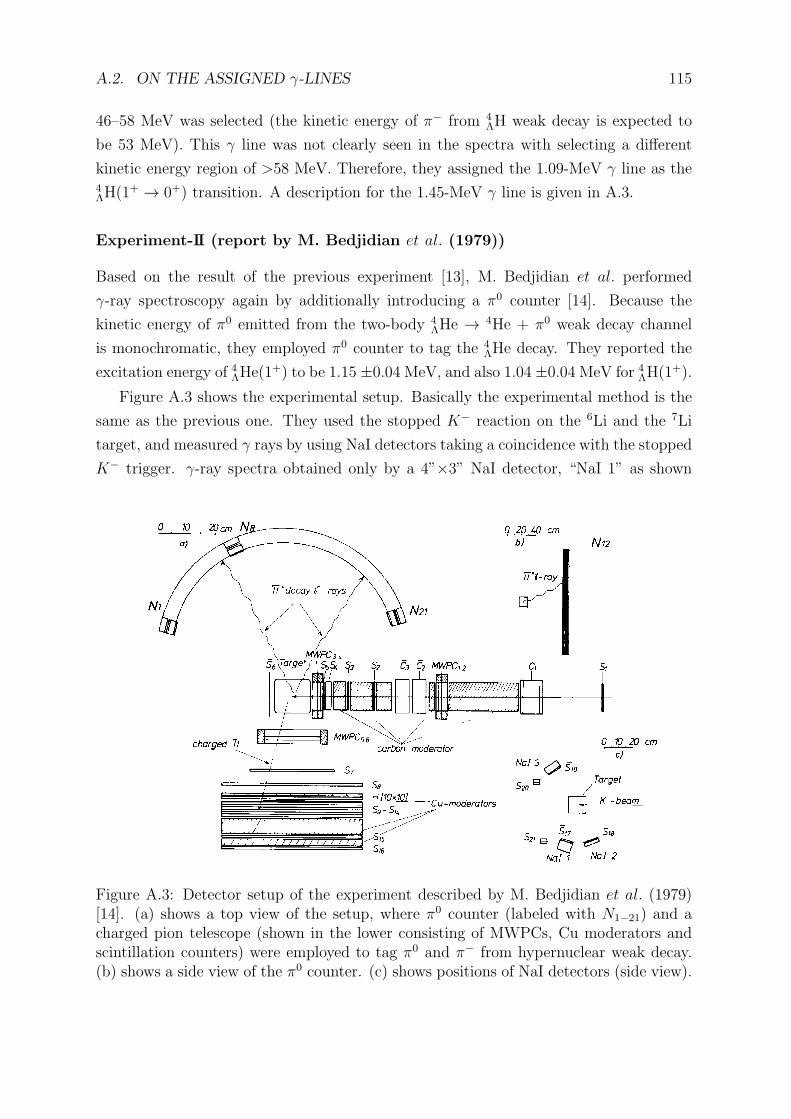
A.2. ON THE ASSIGNED γ-LINES 115
46–58 MeV was selected (the kinetic energy of π− from 4ΛH weak decay is expected to
be 53 MeV). This γ line was not clearly seen in the spectra with selecting a different
kinetic energy region of >58 MeV. Therefore, they assigned the 1.09-MeV γ line as the4ΛH(1
+ → 0+) transition. A description for the 1.45-MeV γ line is given in A.3.
Experiment-II (report by M. Bedjidian et al. (1979))
Based on the result of the previous experiment [13], M. Bedjidian et al. performed
γ-ray spectroscopy again by additionally introducing a π0 counter [14]. Because the
kinetic energy of π0 emitted from the two-body 4ΛHe → 4He + π0 weak decay channel
is monochromatic, they employed π0 counter to tag the 4ΛHe decay. They reported the
excitation energy of 4ΛHe(1+) to be 1.15 ±0.04 MeV, and also 1.04 ±0.04 MeV for 4
ΛH(1+).
Figure A.3 shows the experimental setup. Basically the experimental method is the
same as the previous one. They used the stopped K− reaction on the 6Li and the 7Li
target, and measured γ rays by using NaI detectors taking a coincidence with the stopped
K− trigger. γ-ray spectra obtained only by a 4”×3” NaI detector, “NaI 1” as shown
Figure A.3: Detector setup of the experiment described by M. Bedjidian et al. (1979)[14]. (a) shows a top view of the setup, where π0 counter (labeled with N1−21) and acharged pion telescope (shown in the lower consisting of MWPCs, Cu moderators andscintillation counters) were employed to tag π0 and π− from hypernuclear weak decay.(b) shows a side view of the π0 counter. (c) shows positions of NaI detectors (side view).
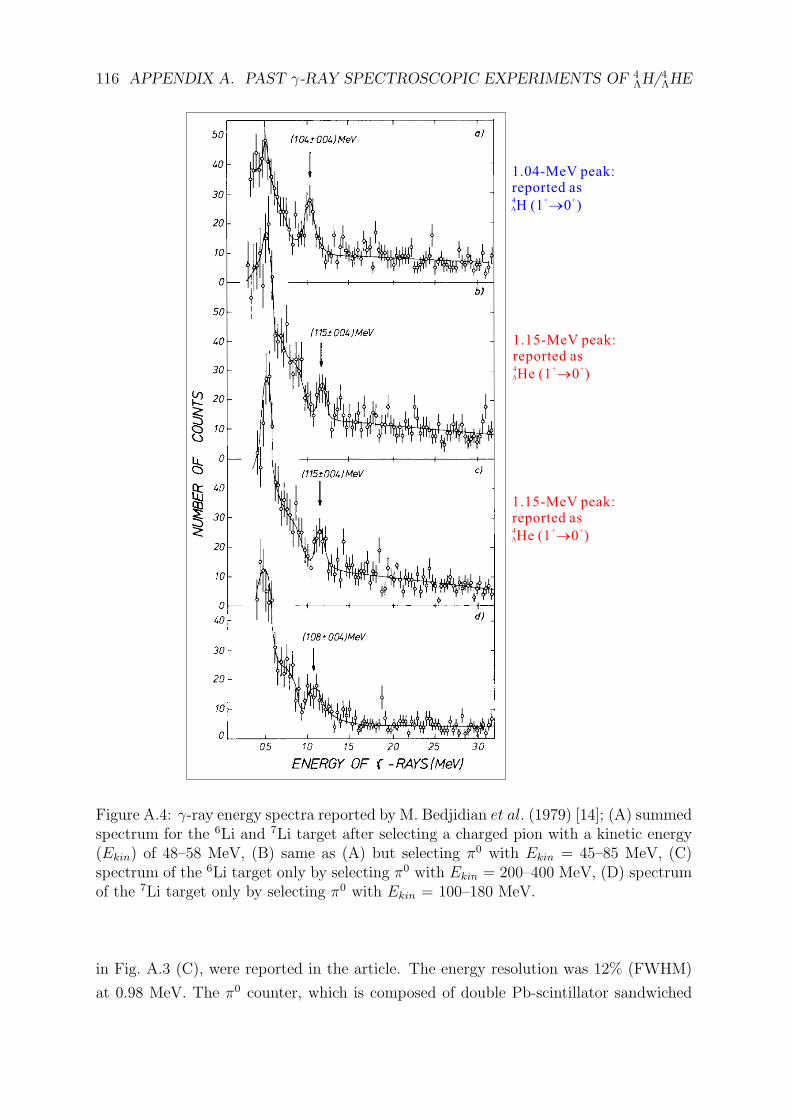
116 APPENDIX A. PAST γ-RAY SPECTROSCOPIC EXPERIMENTS OF 4ΛH/
4ΛHE
1.15-MeV peak:reported as4 + +He (1 0 )®L
1.15-MeV peak:reported as4 + +He (1 0 )®L
1.04-MeV peak:reported as4 + +H (1 0 )®L
Figure A.4: γ-ray energy spectra reported by M. Bedjidian et al. (1979) [14]; (A) summedspectrum for the 6Li and 7Li target after selecting a charged pion with a kinetic energy(Ekin) of 48–58 MeV, (B) same as (A) but selecting π0 with Ekin = 45–85 MeV, (C)spectrum of the 6Li target only by selecting π0 with Ekin = 200–400 MeV, (D) spectrumof the 7Li target only by selecting π0 with Ekin = 100–180 MeV.
in Fig. A.3 (C), were reported in the article. The energy resolution was 12% (FWHM)
at 0.98 MeV. The π0 counter, which is composed of double Pb-scintillator sandwiched
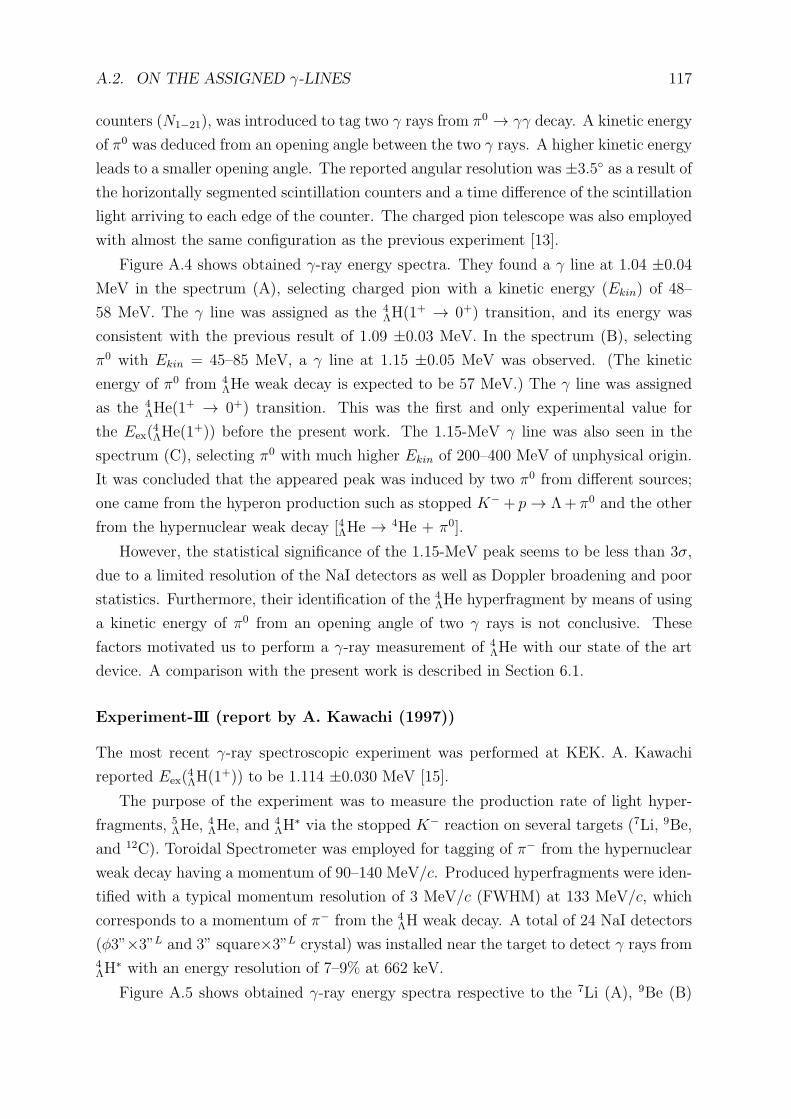
A.2. ON THE ASSIGNED γ-LINES 117
counters (N1−21), was introduced to tag two γ rays from π0 → γγ decay. A kinetic energy
of π0 was deduced from an opening angle between the two γ rays. A higher kinetic energy
leads to a smaller opening angle. The reported angular resolution was ±3.5◦ as a result of
the horizontally segmented scintillation counters and a time difference of the scintillation
light arriving to each edge of the counter. The charged pion telescope was also employed
with almost the same configuration as the previous experiment [13].
Figure A.4 shows obtained γ-ray energy spectra. They found a γ line at 1.04 ±0.04
MeV in the spectrum (A), selecting charged pion with a kinetic energy (Ekin) of 48–
58 MeV. The γ line was assigned as the 4ΛH(1
+ → 0+) transition, and its energy was
consistent with the previous result of 1.09 ±0.03 MeV. In the spectrum (B), selecting
π0 with Ekin = 45–85 MeV, a γ line at 1.15 ±0.05 MeV was observed. (The kinetic
energy of π0 from 4ΛHe weak decay is expected to be 57 MeV.) The γ line was assigned
as the 4ΛHe(1
+ → 0+) transition. This was the first and only experimental value for
the Eex(4ΛHe(1
+)) before the present work. The 1.15-MeV γ line was also seen in the
spectrum (C), selecting π0 with much higher Ekin of 200–400 MeV of unphysical origin.
It was concluded that the appeared peak was induced by two π0 from different sources;
one came from the hyperon production such as stopped K− + p → Λ+ π0 and the other
from the hypernuclear weak decay [4ΛHe → 4He + π0].
However, the statistical significance of the 1.15-MeV peak seems to be less than 3σ,
due to a limited resolution of the NaI detectors as well as Doppler broadening and poor
statistics. Furthermore, their identification of the 4ΛHe hyperfragment by means of using
a kinetic energy of π0 from an opening angle of two γ rays is not conclusive. These
factors motivated us to perform a γ-ray measurement of 4ΛHe with our state of the art
device. A comparison with the present work is described in Section 6.1.
Experiment-III (report by A. Kawachi (1997))
The most recent γ-ray spectroscopic experiment was performed at KEK. A. Kawachi
reported Eex(4ΛH(1
+)) to be 1.114 ±0.030 MeV [15].
The purpose of the experiment was to measure the production rate of light hyper-
fragments, 5ΛHe,
4ΛHe, and
4ΛH
∗ via the stopped K− reaction on several targets (7Li, 9Be,
and 12C). Toroidal Spectrometer was employed for tagging of π− from the hypernuclear
weak decay having a momentum of 90–140 MeV/c. Produced hyperfragments were iden-
tified with a typical momentum resolution of 3 MeV/c (FWHM) at 133 MeV/c, which
corresponds to a momentum of π− from the 4ΛH weak decay. A total of 24 NaI detectors
(ϕ3”×3”L and 3” square×3”L crystal) was installed near the target to detect γ rays from4ΛH
∗ with an energy resolution of 7–9% at 662 keV.
Figure A.5 shows obtained γ-ray energy spectra respective to the 7Li (A), 9Be (B)
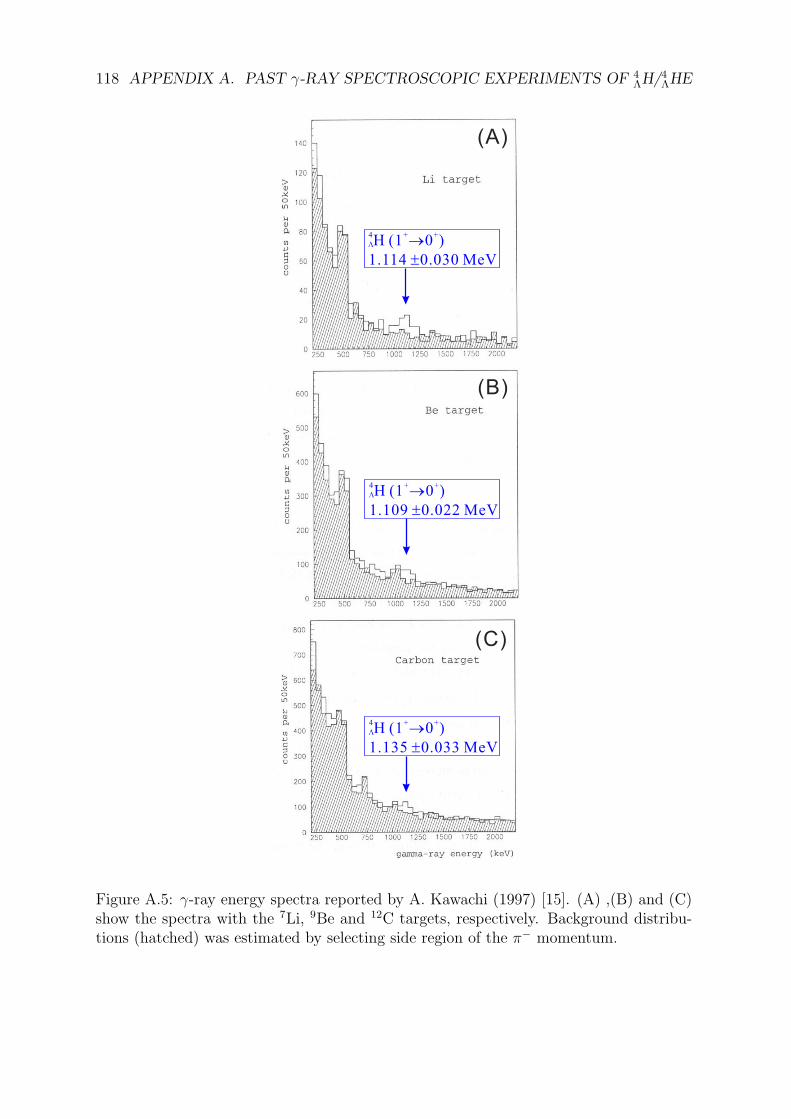
118 APPENDIX A. PAST γ-RAY SPECTROSCOPIC EXPERIMENTS OF 4ΛH/
4ΛHE
4 + +H (1 0 )®
1.114 0.030 MeV±
L
4 + +H (1 0 )®
1.109 0.022 MeV±
L
4 + +H (1 0 )®
1.135 0.033 MeV±
L
(A)
(B)
(C)
Figure A.5: γ-ray energy spectra reported by A. Kawachi (1997) [15]. (A) ,(B) and (C)show the spectra with the 7Li, 9Be and 12C targets, respectively. Background distribu-tions (hatched) was estimated by selecting side region of the π− momentum.
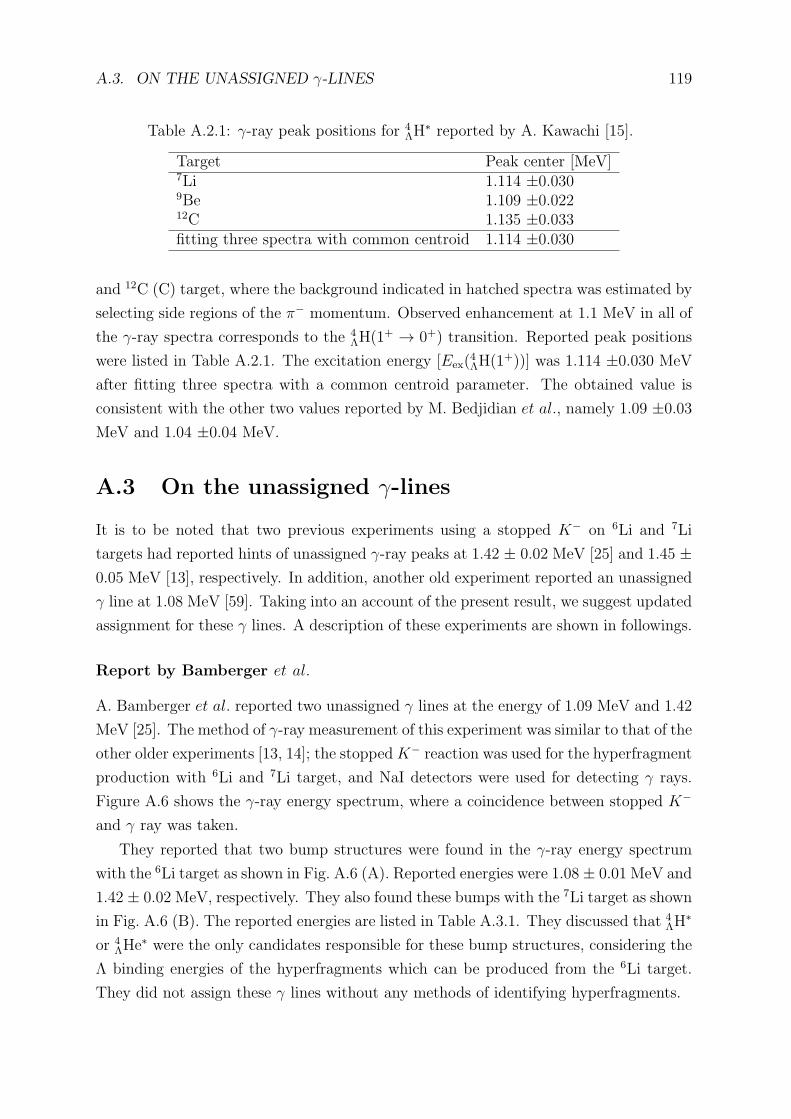
A.3. ON THE UNASSIGNED γ-LINES 119
Table A.2.1: γ-ray peak positions for 4ΛH
∗ reported by A. Kawachi [15].
Target Peak center [MeV]7Li 1.114 ±0.0309Be 1.109 ±0.02212C 1.135 ±0.033fitting three spectra with common centroid 1.114 ±0.030
and 12C (C) target, where the background indicated in hatched spectra was estimated by
selecting side regions of the π− momentum. Observed enhancement at 1.1 MeV in all of
the γ-ray spectra corresponds to the 4ΛH(1
+ → 0+) transition. Reported peak positions
were listed in Table A.2.1. The excitation energy [Eex(4ΛH(1
+))] was 1.114 ±0.030 MeV
after fitting three spectra with a common centroid parameter. The obtained value is
consistent with the other two values reported by M. Bedjidian et al., namely 1.09 ±0.03
MeV and 1.04 ±0.04 MeV.
A.3 On the unassigned γ-lines
It is to be noted that two previous experiments using a stopped K− on 6Li and 7Li
targets had reported hints of unassigned γ-ray peaks at 1.42 ± 0.02 MeV [25] and 1.45 ±0.05 MeV [13], respectively. In addition, another old experiment reported an unassigned
γ line at 1.08 MeV [59]. Taking into an account of the present result, we suggest updated
assignment for these γ lines. A description of these experiments are shown in followings.
Report by Bamberger et al.
A. Bamberger et al. reported two unassigned γ lines at the energy of 1.09 MeV and 1.42
MeV [25]. The method of γ-ray measurement of this experiment was similar to that of the
other older experiments [13, 14]; the stoppedK− reaction was used for the hyperfragment
production with 6Li and 7Li target, and NaI detectors were used for detecting γ rays.
Figure A.6 shows the γ-ray energy spectrum, where a coincidence between stopped K−
and γ ray was taken.
They reported that two bump structures were found in the γ-ray energy spectrum
with the 6Li target as shown in Fig. A.6 (A). Reported energies were 1.08± 0.01 MeV and
1.42 ± 0.02 MeV, respectively. They also found these bumps with the 7Li target as shown
in Fig. A.6 (B). The reported energies are listed in Table A.3.1. They discussed that 4ΛH
∗
or 4ΛHe
∗ were the only candidates responsible for these bump structures, considering the
Λ binding energies of the hyperfragments which can be produced from the 6Li target.
They did not assign these γ lines without any methods of identifying hyperfragments.
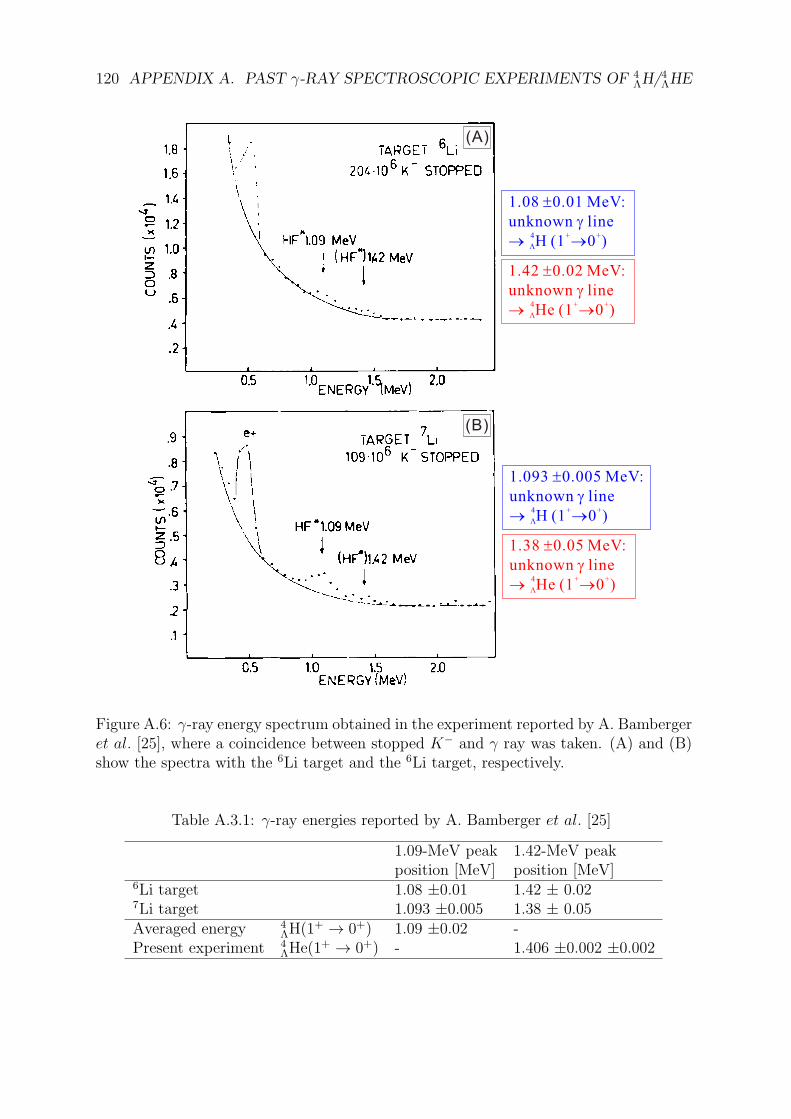
120 APPENDIX A. PAST γ-RAY SPECTROSCOPIC EXPERIMENTS OF 4ΛH/
4ΛHE
L
(A)
(B)
1.08 0.01 MeV:±
unknown lineg
®4 + +H (1 0 )®
L
1.42 0.02 MeV:±
unknown lineg
®4 + +He (1 0 )®
L
1.093 0.005 MeV:±
unknown lineg
®4 + +H (1 0 )®
L
1.38 0.05 MeV:±
unknown lineg
®4 + +He (1 0 )®
Figure A.6: γ-ray energy spectrum obtained in the experiment reported by A. Bambergeret al. [25], where a coincidence between stopped K− and γ ray was taken. (A) and (B)show the spectra with the 6Li target and the 6Li target, respectively.
Table A.3.1: γ-ray energies reported by A. Bamberger et al. [25]
1.09-MeV peak 1.42-MeV peakposition [MeV] position [MeV]
6Li target 1.08 ±0.01 1.42 ± 0.027Li target 1.093 ±0.005 1.38 ± 0.05Averaged energy 4
ΛH(1+ → 0+) 1.09 ±0.02 -
Present experiment 4ΛHe(1
+ → 0+) - 1.406 ±0.002 ±0.002
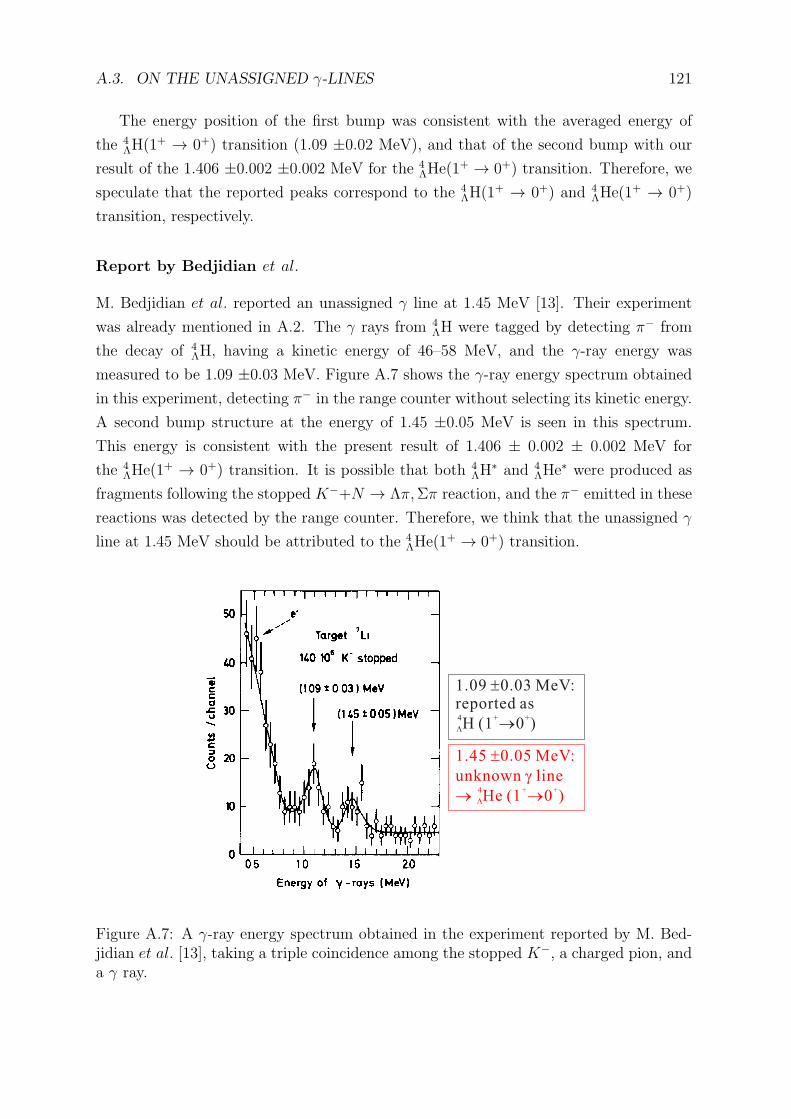
A.3. ON THE UNASSIGNED γ-LINES 121
The energy position of the first bump was consistent with the averaged energy of
the 4ΛH(1
+ → 0+) transition (1.09 ±0.02 MeV), and that of the second bump with our
result of the 1.406 ±0.002 ±0.002 MeV for the 4ΛHe(1
+ → 0+) transition. Therefore, we
speculate that the reported peaks correspond to the 4ΛH(1
+ → 0+) and 4ΛHe(1
+ → 0+)
transition, respectively.
Report by Bedjidian et al.
M. Bedjidian et al. reported an unassigned γ line at 1.45 MeV [13]. Their experiment
was already mentioned in A.2. The γ rays from 4ΛH were tagged by detecting π− from
the decay of 4ΛH, having a kinetic energy of 46–58 MeV, and the γ-ray energy was
measured to be 1.09 ±0.03 MeV. Figure A.7 shows the γ-ray energy spectrum obtained
in this experiment, detecting π− in the range counter without selecting its kinetic energy.
A second bump structure at the energy of 1.45 ±0.05 MeV is seen in this spectrum.
This energy is consistent with the present result of 1.406 ± 0.002 ± 0.002 MeV for
the 4ΛHe(1
+ → 0+) transition. It is possible that both 4ΛH
∗ and 4ΛHe
∗ were produced as
fragments following the stopped K−+N → Λπ,Σπ reaction, and the π− emitted in these
reactions was detected by the range counter. Therefore, we think that the unassigned γ
line at 1.45 MeV should be attributed to the 4ΛHe(1
+ → 0+) transition.
L
1.09 0.03 MeV:±reported as4 + +H (1 0 )®
L
1.45 0.05 MeV:±
unknown lineg
®4 + +He (1 0 )®
Figure A.7: A γ-ray energy spectrum obtained in the experiment reported by M. Bed-jidian et al. [13], taking a triple coincidence among the stopped K−, a charged pion, anda γ ray.
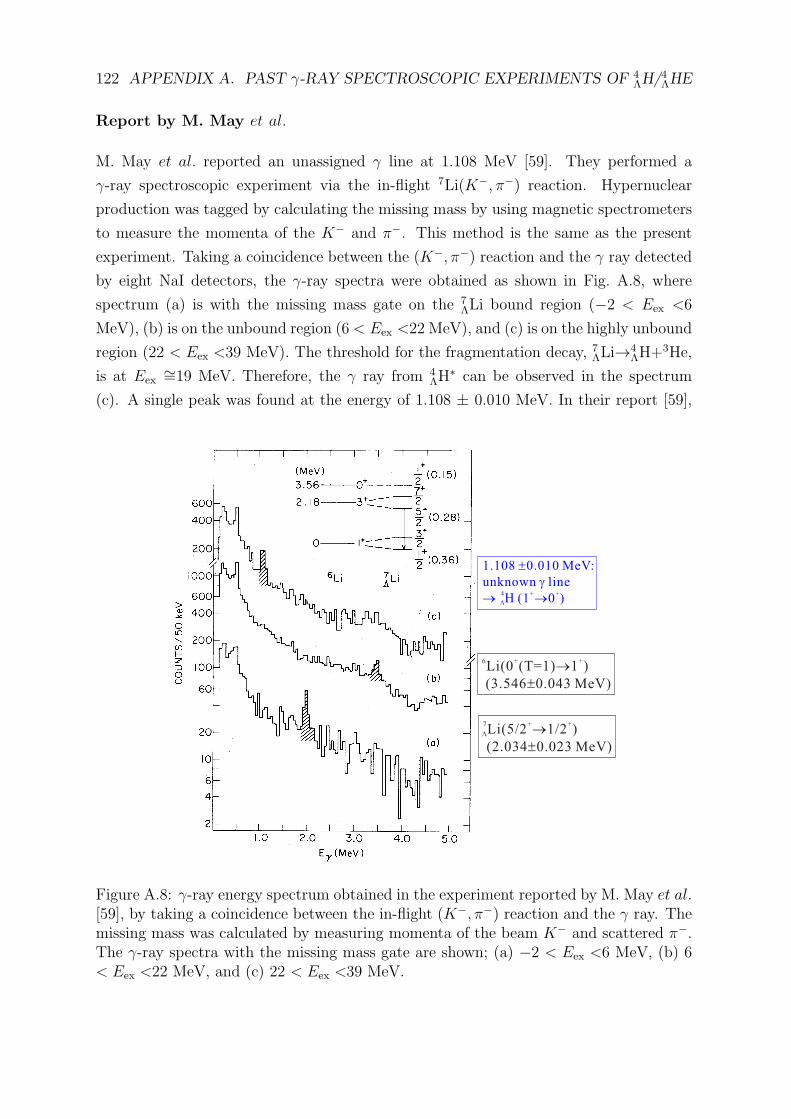
122 APPENDIX A. PAST γ-RAY SPECTROSCOPIC EXPERIMENTS OF 4ΛH/
4ΛHE
Report by M. May et al.
M. May et al. reported an unassigned γ line at 1.108 MeV [59]. They performed a
γ-ray spectroscopic experiment via the in-flight 7Li(K−, π−) reaction. Hypernuclear
production was tagged by calculating the missing mass by using magnetic spectrometers
to measure the momenta of the K− and π−. This method is the same as the present
experiment. Taking a coincidence between the (K−, π−) reaction and the γ ray detected
by eight NaI detectors, the γ-ray spectra were obtained as shown in Fig. A.8, where
spectrum (a) is with the missing mass gate on the 7ΛLi bound region (−2 < Eex <6
MeV), (b) is on the unbound region (6 < Eex <22 MeV), and (c) is on the highly unbound
region (22 < Eex <39 MeV). The threshold for the fragmentation decay, 7ΛLi→4
ΛH+3He,
is at Eex∼=19 MeV. Therefore, the γ ray from 4
ΛH∗ can be observed in the spectrum
(c). A single peak was found at the energy of 1.108 ± 0.010 MeV. In their report [59],
6 + +Li(0 (T=1) 1 )®
(3.546 0.043 MeV)±
7 + +Li(5/2 1/2 )®
(2.034 0.023 MeV)±L
L
1.108 0.010 MeV:±
unknown lineg
®4 + +H (1 0 )®
Figure A.8: γ-ray energy spectrum obtained in the experiment reported by M. May et al.[59], by taking a coincidence between the in-flight (K−, π−) reaction and the γ ray. Themissing mass was calculated by measuring momenta of the beam K− and scattered π−.The γ-ray spectra with the missing mass gate are shown; (a) −2 < Eex <6 MeV, (b) 6< Eex <22 MeV, and (c) 22 < Eex <39 MeV.
A.3. ON THE UNASSIGNED γ-LINES 123
they concluded that the peak was attributed to the sum of the two transitions, the4ΛH(1
+ → 0+) and the 4ΛHe(1
+ → 0+) transitions, because the known excitation energies
of 4ΛH
∗ and 4ΛHe
∗, 1.04 MeV and 1.15 MeV at that time, were too close to be resolved
by the NaI detectors with the energy resolution of 0.084 MeV (FWHM). The present
result suggests that the observed 1.108 MeV peak is attributed only to the 4ΛH(1
+ → 0+)
transition because of the 1.406-MeV transition energy of 4ΛHe.
It is possible as well to observe γ rays from 4ΛHe in the spectrum (c) because the
threshold for the decay, 7ΛLi→4
ΛHe+3H, is at Eex
∼=19 MeV. No peak structure was
reported near the energy of 1.4 MeV in the spectrum (c). This fact indicates that the
hyperfragment production rate of 4ΛHe
∗ is lower in the in-flight 7Li(K−, π−) reaction.

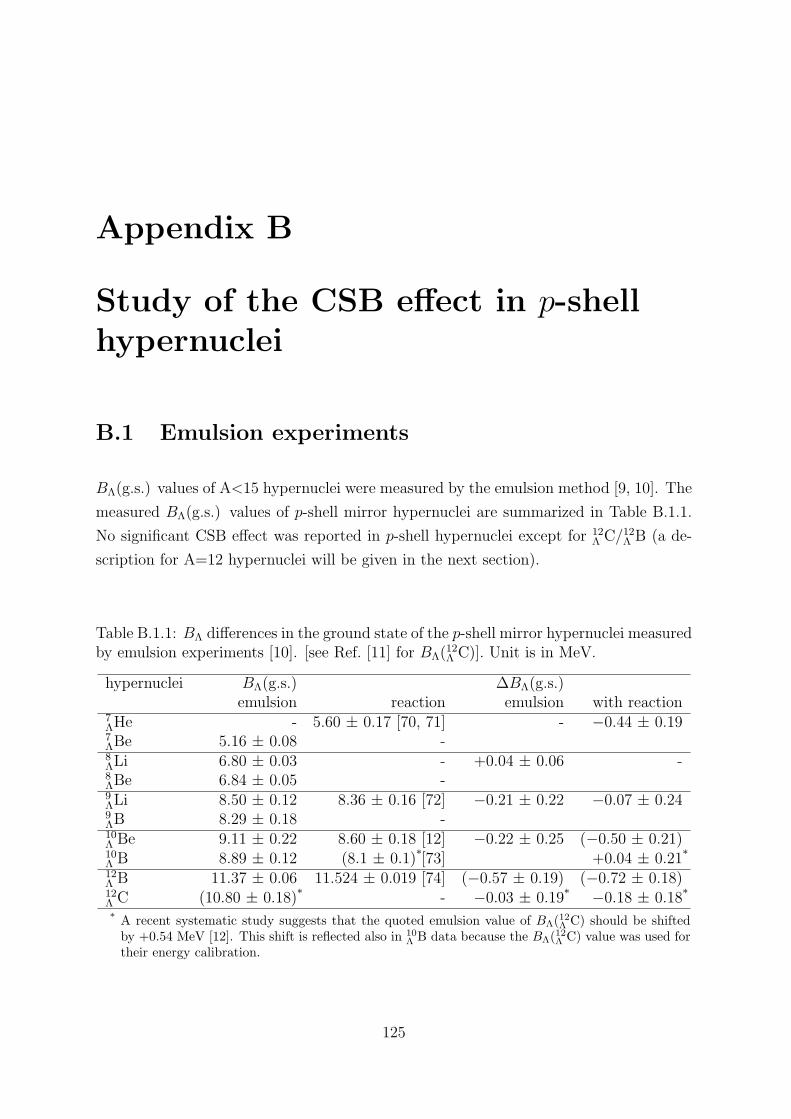
Appendix B
Study of the CSB effect in p-shellhypernuclei
B.1 Emulsion experiments
BΛ(g.s.) values of A<15 hypernuclei were measured by the emulsion method [9, 10]. The
measured BΛ(g.s.) values of p-shell mirror hypernuclei are summarized in Table B.1.1.
No significant CSB effect was reported in p-shell hypernuclei except for 12Λ C/12Λ B (a de-
scription for A=12 hypernuclei will be given in the next section).
Table B.1.1: BΛ differences in the ground state of the p-shell mirror hypernuclei measuredby emulsion experiments [10]. [see Ref. [11] for BΛ(
12Λ C)]. Unit is in MeV.
hypernuclei BΛ(g.s.) ∆BΛ(g.s.)emulsion reaction emulsion with reaction
7ΛHe - 5.60 ± 0.17 [70, 71] - −0.44 ± 0.197ΛBe 5.16 ± 0.08 -8ΛLi 6.80 ± 0.03 - +0.04 ± 0.06 -8ΛBe 6.84 ± 0.05 -9ΛLi 8.50 ± 0.12 8.36 ± 0.16 [72] −0.21 ± 0.22 −0.07 ± 0.249ΛB 8.29 ± 0.18 -10Λ Be 9.11 ± 0.22 8.60 ± 0.18 [12] −0.22 ± 0.25 (−0.50 ± 0.21)10Λ B 8.89 ± 0.12 (8.1 ± 0.1)*[73] +0.04 ± 0.21*12Λ B 11.37 ± 0.06 11.524 ± 0.019 [74] (−0.57 ± 0.19) (−0.72 ± 0.18)12Λ C (10.80 ± 0.18)* - −0.03 ± 0.19* −0.18 ± 0.18*
* A recent systematic study suggests that the quoted emulsion value of BΛ(12Λ C) should be shifted
by +0.54 MeV [12]. This shift is reflected also in 10Λ B data because the BΛ(
12Λ C) value was used for
their energy calibration.
125
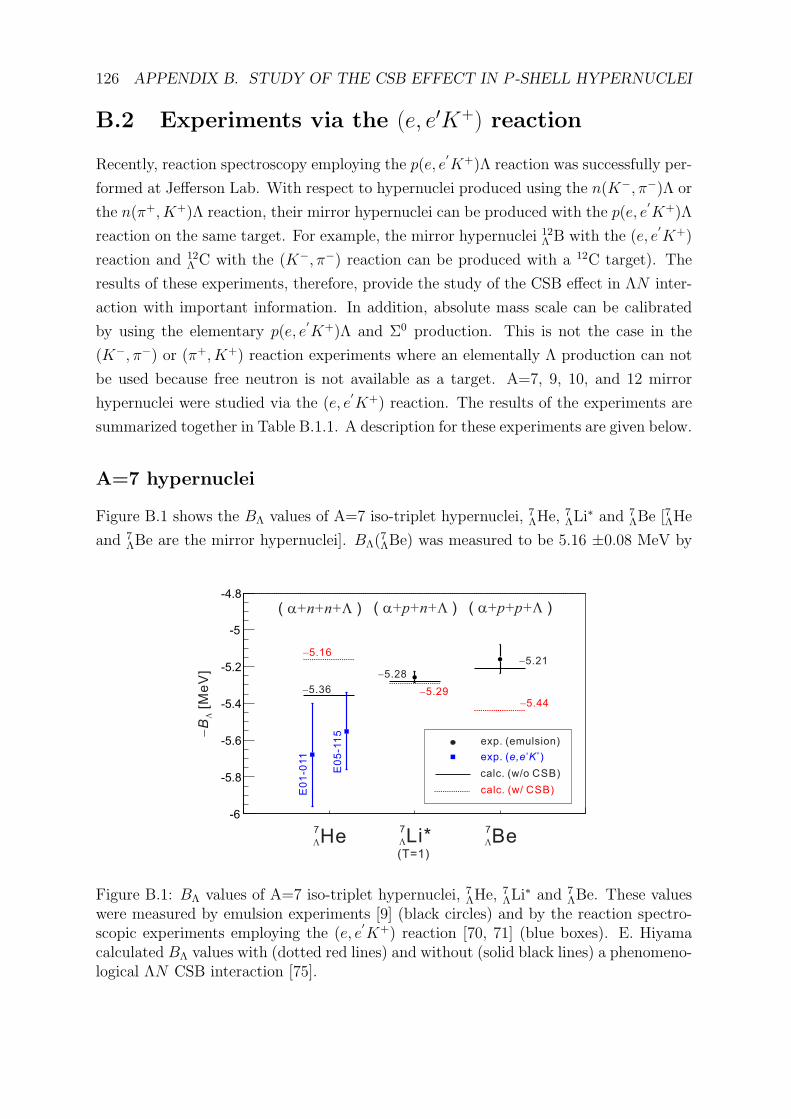
126 APPENDIX B. STUDY OF THE CSB EFFECT IN P -SHELL HYPERNUCLEI
B.2 Experiments via the (e, e′K+) reaction
Recently, reaction spectroscopy employing the p(e, e′K+)Λ reaction was successfully per-
formed at Jefferson Lab. With respect to hypernuclei produced using the n(K−, π−)Λ or
the n(π+, K+)Λ reaction, their mirror hypernuclei can be produced with the p(e, e′K+)Λ
reaction on the same target. For example, the mirror hypernuclei 12Λ B with the (e, e
′K+)
reaction and 12Λ C with the (K−, π−) reaction can be produced with a 12C target). The
results of these experiments, therefore, provide the study of the CSB effect in ΛN inter-
action with important information. In addition, absolute mass scale can be calibrated
by using the elementary p(e, e′K+)Λ and Σ0 production. This is not the case in the
(K−, π−) or (π+, K+) reaction experiments where an elementally Λ production can not
be used because free neutron is not available as a target. A=7, 9, 10, and 12 mirror
hypernuclei were studied via the (e, e′K+) reaction. The results of the experiments are
summarized together in Table B.1.1. A description for these experiments are given below.
A=7 hypernuclei
Figure B.1 shows the BΛ values of A=7 iso-triplet hypernuclei, 7ΛHe,
7ΛLi
∗ and 7ΛBe [7ΛHe
and 7ΛBe are the mirror hypernuclei]. BΛ(
7ΛBe) was measured to be 5.16 ±0.08 MeV by
-6
-5.8
-5.6
-5.4
-5.2
-5
-4.8
7HeL
7Li*L
7BeL
(T=1)
calc. (w/o CSB)
calc. (w/ CSB)
exp. (emulsion)
exp. ( ’ )e,e K+
E0
1-0
11
E0
5-1
15
( )a L+ + +n n ( )a L+ + +p n ( )a L+ + +p p
-5.16
-5.36
-5.28
-5.29-5.44
-5.21
-B
L[M
eV
]
Figure B.1: BΛ values of A=7 iso-triplet hypernuclei, 7ΛHe,
7ΛLi
∗ and 7ΛBe. These values
were measured by emulsion experiments [9] (black circles) and by the reaction spectro-scopic experiments employing the (e, e
′K+) reaction [70, 71] (blue boxes). E. Hiyama
calculated BΛ values with (dotted red lines) and without (solid black lines) a phenomeno-logical ΛN CSB interaction [75].
B.2. EXPERIMENTS VIA THE (E,E ′K+) REACTION 127
the emulsion experiment [9]. That of 7ΛLi
∗ was derived from the results of the emulsion
experiment and of the γ-ray experiment [5] as 5.26 ±0.03 MeV. No result was reported
for 7ΛHe in the emulsion experiment because there are only ∼10 observed events and
its BΛ distribution was spread (they claimed that the reason was an existence of long-
lived isomeric states) [9]. By employing the 7Li(e, e′K+) reaction, it becomes possible
to obtain BΛ(7ΛHe) with the missing mass method. The (e, e
′K+) experiments, E01-011
and E05-115, were performed at Jefferson Lab and reported BΛ(7ΛHe) to be 5.68 ±0.03
±0.25 MeV [70] and 5.55 ±0.10 ±0.11 MeV [71], respectively. A weighted average of
BΛ(7ΛHe) is 5.60 ±0.17 MeV. A difference in the measured BΛ values is significantly
large, ∆BΛ = BΛ(7ΛBe)−BΛ(
7ΛHe)= −0.44 ± 0.19 MeV. However, a few-body calculation
by E. Hiyama [75], which included only Coulomb interaction as the CSB origin, well
reproduced the measured BΛ values, indicating that no significant CSB effect other than
Coulomb effect was found in the A=7 hypernuclear system. E. Hiyama also reported a
result of a calculation with a phenomenological ΛN CSB interaction as shown together
in Fig B.1, where parameters for the phenomenological CSB interaction was based on
the (old) experimental data in the A=4 hypernuclear system. This calculation did not
reproduced the measured BΛ values.
A=9 hypernuclei
BΛ(g.s.) values of A=9 mirror hypernuclei 9ΛLi/
9ΛB were measured by the emulsion ex-
periments [9]. The reported difference in BΛ is ∆BΛ = −0.21 ± 0.22 MeV, indicating
no significant CSB effect.
The BΛ(9ΛLi) was re-measured by a reaction spectroscopy experiment at JLab Hall-A
using the 9Be(e, e′K+)9ΛLi reaction [72]. The reported BΛ was of 8.36± 0.16 MeV, leading
to almost no CSB effect as ∆BΛ = −0.07 ± 0.19 MeV. It is noted that the absolute mass
calibration was made based on the BΛ(12Λ B) value reported from the emulsion experiments
[9].
A=10 hypernuclei
BΛ(g.s.) values of A=10 mirror hypernuclei 10Λ Be/10Λ B were measured by the emulsion
experiments [9]. The reported difference in BΛ is ∆BΛ = −0.22 ± 0.25 MeV, indicating
no significant CSB effect.
The BΛ values were remeasured by reaction spectroscopy experiments using the10B(e, e′K+)10Λ Be reaction [12] and the 10B(π+, K+)10Λ B reaction [73]. The reported BΛ
values are BΛ(10Λ Be)=8.60 ± 0.07 ± 0.11 MeV and BΛ(
10Λ B)=8.1 ± 0.1 MeV. It should
be noted that a recent systematic study suggests that the 10Λ B data have a systematic
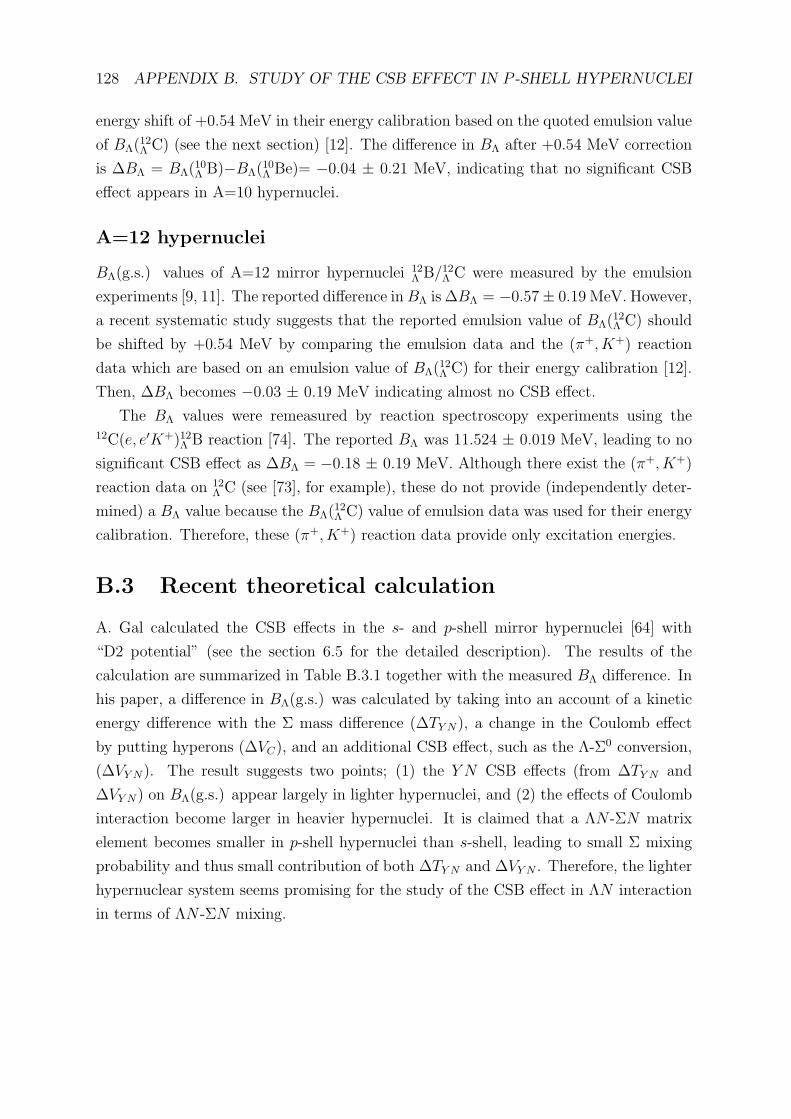
128 APPENDIX B. STUDY OF THE CSB EFFECT IN P -SHELL HYPERNUCLEI
energy shift of +0.54 MeV in their energy calibration based on the quoted emulsion value
of BΛ(12Λ C) (see the next section) [12]. The difference in BΛ after +0.54 MeV correction
is ∆BΛ = BΛ(10Λ B)−BΛ(
10Λ Be)= −0.04 ± 0.21 MeV, indicating that no significant CSB
effect appears in A=10 hypernuclei.
A=12 hypernuclei
BΛ(g.s.) values of A=12 mirror hypernuclei 12Λ B/12Λ C were measured by the emulsion
experiments [9, 11]. The reported difference inBΛ is ∆BΛ = −0.57± 0.19 MeV. However,
a recent systematic study suggests that the reported emulsion value of BΛ(12Λ C) should
be shifted by +0.54 MeV by comparing the emulsion data and the (π+, K+) reaction
data which are based on an emulsion value of BΛ(12Λ C) for their energy calibration [12].
Then, ∆BΛ becomes −0.03 ± 0.19 MeV indicating almost no CSB effect.
The BΛ values were remeasured by reaction spectroscopy experiments using the12C(e, e′K+)12Λ B reaction [74]. The reported BΛ was 11.524 ± 0.019 MeV, leading to no
significant CSB effect as ∆BΛ = −0.18 ± 0.19 MeV. Although there exist the (π+, K+)
reaction data on 12Λ C (see [73], for example), these do not provide (independently deter-
mined) a BΛ value because the BΛ(12Λ C) value of emulsion data was used for their energy
calibration. Therefore, these (π+, K+) reaction data provide only excitation energies.
B.3 Recent theoretical calculation
A. Gal calculated the CSB effects in the s- and p-shell mirror hypernuclei [64] with
“D2 potential” (see the section 6.5 for the detailed description). The results of the
calculation are summarized in Table B.3.1 together with the measured BΛ difference. In
his paper, a difference in BΛ(g.s.) was calculated by taking into an account of a kinetic
energy difference with the Σ mass difference (∆TY N), a change in the Coulomb effect
by putting hyperons (∆VC), and an additional CSB effect, such as the Λ-Σ0 conversion,
(∆VY N). The result suggests two points; (1) the Y N CSB effects (from ∆TY N and
∆VY N) on BΛ(g.s.) appear largely in lighter hypernuclei, and (2) the effects of Coulomb
interaction become larger in heavier hypernuclei. It is claimed that a ΛN -ΣN matrix
element becomes smaller in p-shell hypernuclei than s-shell, leading to small Σ mixing
probability and thus small contribution of both ∆TY N and ∆VY N . Therefore, the lighter
hypernuclear system seems promising for the study of the CSB effect in ΛN interaction
in terms of ΛN -ΣN mixing.
B.3. RECENT THEORETICAL CALCULATION 129
Table B.3.1: BΛ differences in ground-state of the s- and p-shell mirror hypernucleimeasured by the emulsion experiments [10, 9] and reaction spectroscopy (see Table B.1.1).The result of a theoretical calculation reported by A. Gal [64] are also listed, where threecomponents of CSB effect are individually presented; ∆TY N is from a kinetic energydifference with the Σ mass difference, ∆VC is from a change in the Coulomb effect byputting hyperons, and ∆VY N is from Y N CSB interactions. Unit is in keV.
exp. data calculatedhypernuclei ∆BΛ(g.s.) ∆BΛ(g.s.) ∆TY N ∆VC ∆VY N
emulsion reaction4ΛHe−4
ΛH +350 ± 60 +270 ± 110 +226 +39 −45 +2328ΛBe−8
ΛLi +40 ± 60 - +49 +11 −81 +1199ΛB−9
ΛLi −210 ± 220 −70 ± 240 −54 +10 −145 +8110Λ B−10
Λ Be −220 ± 250 +40 ± 210 −136 +3 −156 +17

Bibliography
[1] G. A. Miller, A. K. Opper, and E. J. Stephenson, Ann. Rev. Nucl. Part. Sci. 56,
253 (2006).
[2] S.A. Coon and R.C. Barrett, Phys. Rev. C 36, 2189 (1987).
[3] M. Danysz and J. Pniewski, Phil. Mag. 44, 348 (1953).
[4] M. Ukai et al., Phys. Rev. C 77, 054315 (2008).
[5] H. Tamura et al., Phys. Rev. Lett. 84, 5963 (2000).
[6] M. Ukai et al., Phys. Rev. C 73, 012501 (2006).
[7] D.J. Millener, Nucl. Phys. A 754, 48c (2005).
[8] Y. Akaishi, T. Harada, S. Shinmura, and K. S. Myint, Phys. Rev. Lett. 84, 3539
(2000).
[9] M. Juric et al., Nucl. Phys. B 52, 1 (1973).
[10] D.H. Davis, Nucl. Phys. A 754, 3c (2005).
[11] P. Dluzewski, K. Garbowska-pniwska, J. Pniwski, T. Tymieniecka, and P. Ciok,
Nucl. Phys. A 484, 520 (1988).
[12] T. Gogami et al., arXive nucl-ex, 1511.04801v1 (2015).
[13] M. Bedjidian et al., Phys. Lett. B 62, 467 (1976).
[14] M. Bedjidian et al., Phys. Lett. B 83, 252 (1979).
[15] A. Kawachi, Doctoral Thesis, University of Tokyo (1997), unpublished.
[16] A. Esser et al., Phys. Rev. Lett. 114, 232501 (2015).
[17] D.H. Davis, Contemp. Phys. 27-2,91, 116 (1986).
131
132 BIBLIOGRAPHY
[18] M.M. Block et al., Proceedings of the International Conference on Hyperfragments
at St. Cergue, Switzerland, 1963 (CERN Scientific Information Service) 64-1 (1963).
[19] R.H. Dalitz and L. Liu, Phys. Rev. 116-5, 1312 (1959).
[20] R. H. Dalitz and F. Von Hippel, Phys. Lett. 10, 153 (1964).
[21] A. Nogga, H. Kamada, and W. Glockle, Phys. Rev. Lett. 88, 172501 (2002), and
references therein.
[22] H. Tamura et al., J-PARC proposal E13 “Gamma-ray spectroscopy of light hy-
pernuclei”, http://j-parc.jp/researcher/Hadron/en/pac 0606/pdf/p13-Tamura.pdf
(2006).
[23] H. Tamura, M. Ukai, T.O. Yamamoto, and T. Koike, Nucl. Phys. A 881, 310
(2012).
[24] T.O. Yamamoto et al., Phys. Rev. Lett. 115, 222501 (2015).
[25] A. Bamberger et al., Nucl. Phys. B 60, 1 (1973).
[26] T. Harada, Private communication (2006).
[27] K. Agari et al., Prog. Theor. Exp. Phys. 2012, 02B009 (2012).
[28] T. Takahashi et al., Prog. Theor. Exp. Phys. 2012, 02B010 (2012).
[29] R. Honda, K. Miwa, Y. Matsumoto, N. Chiga, S. Hasegawa, and K. Imai, Nucl.
Instr. Meth. A 787, 157 (2015).
[30] T. Fukuda et al., Nucl. Instrum. Methods A 361, 485 (1995).
[31] K. Shirotori et al., Phys. Rev. Lett. 109, 132002 (2012).
[32] S. Agostinelli et al., Nucl. Instr. Meth. A 506, 250 (2003).
[33] J. Myrheim and L. Bugge, Nucl. Instr. Meth. 160, 43 (1979).
[34] J. Myrheim and L. Bugge, Three Dimentional Computer Program (TOSCA) for
Non-Linear Electromagnetic Fields, RL-81-070557 (1982).
[35] M. Daum et al., Eur. Phys. J. C 23, 43 (2002).
[36] T. Iijima et al., Nucl. Instr. Meth. A 453, 321 (2000).
[37] T. Nagae et al., Phys. Rev. Lett. 80, 1605 (1998).
BIBLIOGRAPHY 133
[38] K. Miwa et al., Phys. Rev. C 77, 045203 (2008).
[39] M. Moritsu et al., Nucl. Phys. A 914, 91 (2013).
[40] Y. Ichikawa et al., Prog. Theor. Exp. Phys. 2014, 101D03 (2014).
[41] H. Sugimura et al., Phys. Lett. B 729, 39 (2014).
[42] T. Koike et al., Proc. 9th Int. Conf. on Hypernuclear and Strange Particle Physics
(HYP2006), October 10-14, 2006, Mainz, Ed. by J. Pochodzalla and Th. Walcher,
Springer , 25 (2007).
[43] T. Koike et al., Nucl. Instrum. Methods A 770, 1 (2014).
[44] E. Hull, R. H. Pehl, et al., IUCF Ann. Rep. , 143 (1993).
[45] H. Outa et al., Nucl. Phys. A 639, 215c (1998).
[46] H. Outa et al., Nucl. Phys. A 754, 157c (2005).
[47] Y. Igarashi et al., IEEE Trans. Nucl. Sci. 57, 618 (2010).
[48] R. Honda and K. Miwa, Proceedings of 3rd International Workshop on New Pho-
tonDetectors, PoS Press , 031 (2012).
[49] Y. Igarashi et al., IEEE Trans. Nucl. Sci. 52, 2866 (2005).
[50] O. Hashimoto and H. Tamura, Prog. Part. Nucl. Phys. 57, 564 (2006).
[51] J. F. Ziegler, The Stopping and Range of Ions in Matter, avaliable via www at the
URL:http://www.srim.org/ (1977).
[52] R. Dalitz and A. Gal, Annals Phys. 116, 167 (1978).
[53] Y. Sasaki, Master thesis, Tohoku University (2013a).
[54] A. Sasaki, Master thesis, Tohoku University (2013b).
[55] K. Tanida, Doctoral thesis, University of Tokyo (2000).
[56] M. Ukai, Doctoral thesis, Tohoku University (2004).
[57] K. Hosomi, Doctoral thesis, Tohoku University (2013).
[58] G.P. Gopal. et al., Nucl. Phys. B 119, 362 (1976).
[59] M. May et al., Phys. Rev. Lett. 51, 2085 (1983).
134 BIBLIOGRAPHY
[60] M.M. Nagels. et al., Phys. Rev. D 12, 744 (1975).
[61] P.M.M. Maessen. et al., Phys. Rev. C 40, 2226 (1989).
[62] Th. Rijken. et al., Phys. Rev. C 59, 21 (1999).
[63] E. Hiyama, M. Kamimura, T. Motoba, T. Yamada, and Y. Yamamoto, Phys. Rev. C
65, 011301 (2002).
[64] A. Gal, Phys. Lett. B 744, 352 (2015).
[65] H. Polinder, R. Haidenbauer, and U.-G. Meiβner, Nucl. Phys. A 779, 244 (2006).
[66] D. Gazda and A. Gal, arXive nucl-th, 1512.01049v2 (2015).
[67] H. Tamura et al., J-PARC proposal P63 “Gamma-ray spectroscopy of light hyper-
nuclei II ” (2016).
[68] Y. Fujiwara, Y. Suzuki, and C. Nakamoto, Prog. Nucl. Part. Phys. 58, 439 (2007).
[69] K. Miwa et al., J-PARC proposal E40 “Measurement of the cross section of Σp
scatterings”, http://j-parc.jp/researcher/Hadron/en/pac 1101/pdf/KEK J-PARC-
PAC2010-12.pdf (2010).
[70] S.N. Nakamura et al., Phys. Rev. Lett. 110, 012502 (2013).
[71] T. Gogami, Doctoral thesis, Tohoku University (2014).
[72] G.M. Urciuoli et al., Phys. Rev. C 91, 034308 (2015).
[73] T. Hasegawa et al., Phys. Rev. C 53, 1210 (1996).
[74] L. Tang et al., Phys. Rev. C 90, 034320 (2014).
[75] E. Hiyama et al., Phys. Rev. C 80, 054321 (2009).