(a) c d - Nature Research...the absence of tumor cell death. (a) Western blot and quantification of...
11
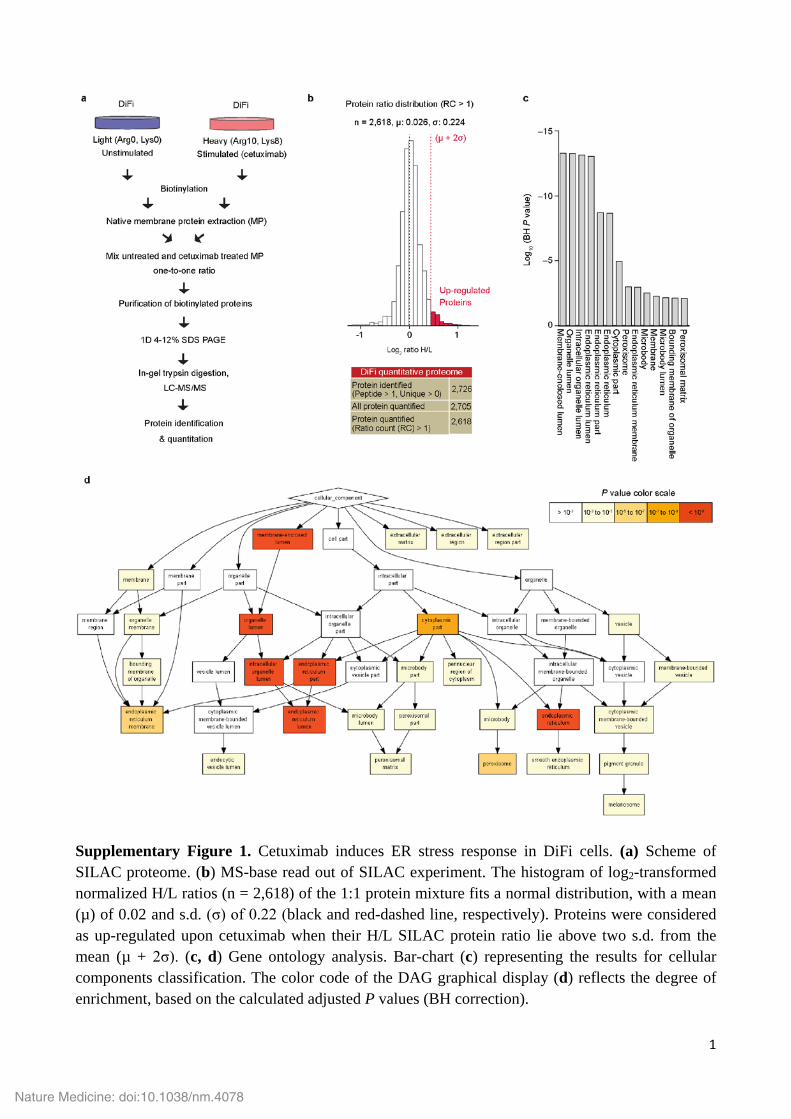
1 Supplementary Figure 1. Cetuximab induces ER stress response in DiFi cells. (a) Scheme of SILAC proteome. (b) MS-base read out of SILAC experiment. The histogram of log 2 -transformed normalized H/L ratios (n = 2,618) of the 1:1 protein mixture fits a normal distribution, with a mean (μ) of 0.02 and s.d. (σ) of 0.22 (black and red-dashed line, respectively). Proteins were considered as up-regulated upon cetuximab when their H/L SILAC protein ratio lie above two s.d. from the mean (μ + 2σ). (c, d) Gene ontology analysis. Bar-chart (c) representing the results for cellular components classification. The color code of the DAG graphical display (d) reflects the degree of enrichment, based on the calculated adjusted P values (BH correction). Nature Medicine: doi:10.1038/nm.4078
Transcript of (a) c d - Nature Research...the absence of tumor cell death. (a) Western blot and quantification of...
1
Supplementary Figure 1. Cetuximab induces ER stress response in DiFi cells. (a) Scheme of SILAC proteome. (b) MS-base read out of SILAC experiment. The histogram of log2-transformed normalized H/L ratios (n = 2,618) of the 1:1 protein mixture fits a normal distribution, with a mean (µ) of 0.02 and s.d. (σ) of 0.22 (black and red-dashed line, respectively). Proteins were considered as up-regulated upon cetuximab when their H/L SILAC protein ratio lie above two s.d. from the mean (µ + 2σ). (c, d) Gene ontology analysis. Bar-chart (c) representing the results for cellular components classification. The color code of the DAG graphical display (d) reflects the degree of enrichment, based on the calculated adjusted P values (BH correction).
Nature Medicine: doi:10.1038/nm.4078
2
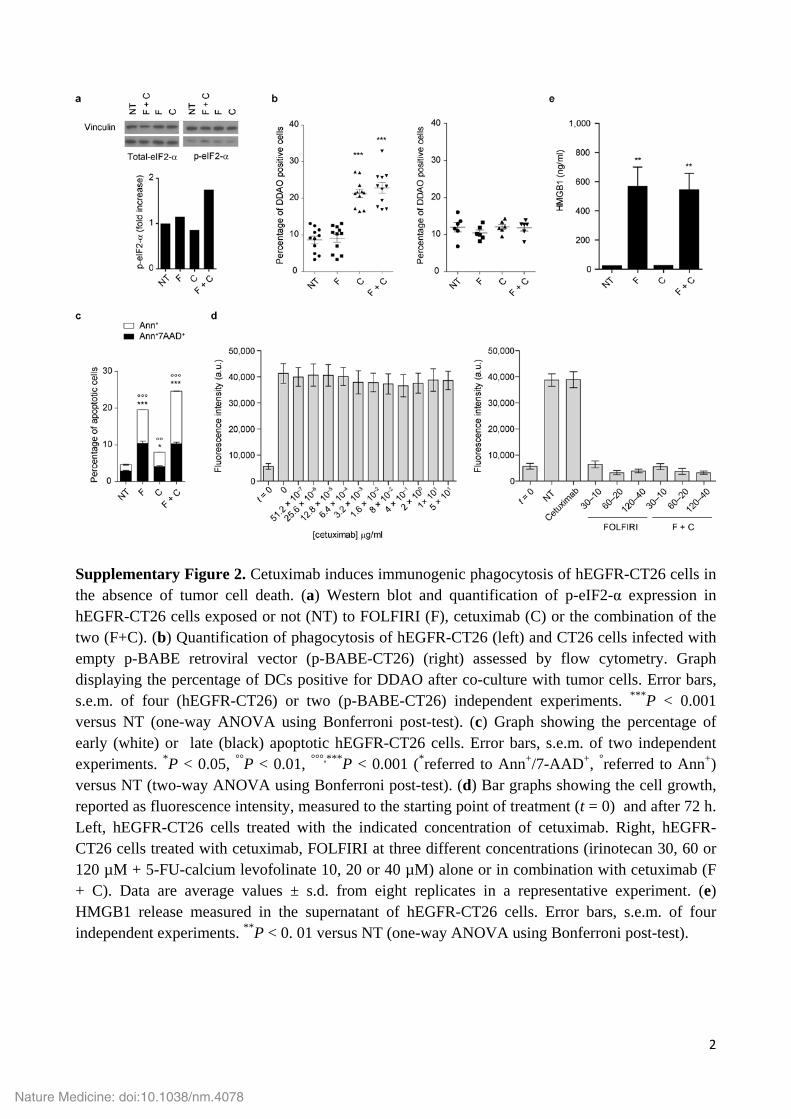
Supplementary Figure 2. Cetuximab induces immunogenic phagocytosis of hEGFR-CT26 cells in the absence of tumor cell death. (a) Western blot and quantification of p-eIF2-α expression in hEGFR-CT26 cells exposed or not (NT) to FOLFIRI (F), cetuximab (C) or the combination of the two (F+C). (b) Quantification of phagocytosis of hEGFR-CT26 (left) and CT26 cells infected with empty p-BABE retroviral vector (p-BABE-CT26) (right) assessed by flow cytometry. Graph displaying the percentage of DCs positive for DDAO after co-culture with tumor cells. Error bars, s.e.m. of four (hEGFR-CT26) or two (p-BABE-CT26) independent experiments. ***P < 0.001 versus NT (one-way ANOVA using Bonferroni post-test). (c) Graph showing the percentage of early (white) or late (black) apoptotic hEGFR-CT26 cells. Error bars, s.e.m. of two independent experiments. *P < 0.05, °°P < 0.01, °°°,***P < 0.001 (*referred to Ann+/7-AAD+, °referred to Ann+) versus NT (two-way ANOVA using Bonferroni post-test). (d) Bar graphs showing the cell growth, reported as fluorescence intensity, measured to the starting point of treatment (t = 0) and after 72 h. Left, hEGFR-CT26 cells treated with the indicated concentration of cetuximab. Right, hEGFR-CT26 cells treated with cetuximab, FOLFIRI at three different concentrations (irinotecan 30, 60 or 120 µM + 5-FU-calcium levofolinate 10, 20 or 40 µM) alone or in combination with cetuximab (F + C). Data are average values ± s.d. from eight replicates in a representative experiment. (e) HMGB1 release measured in the supernatant of hEGFR-CT26 cells. Error bars, s.e.m. of four independent experiments. **P < 0. 01 versus NT (one-way ANOVA using Bonferroni post-test).
Nature Medicine: doi:10.1038/nm.4078
3
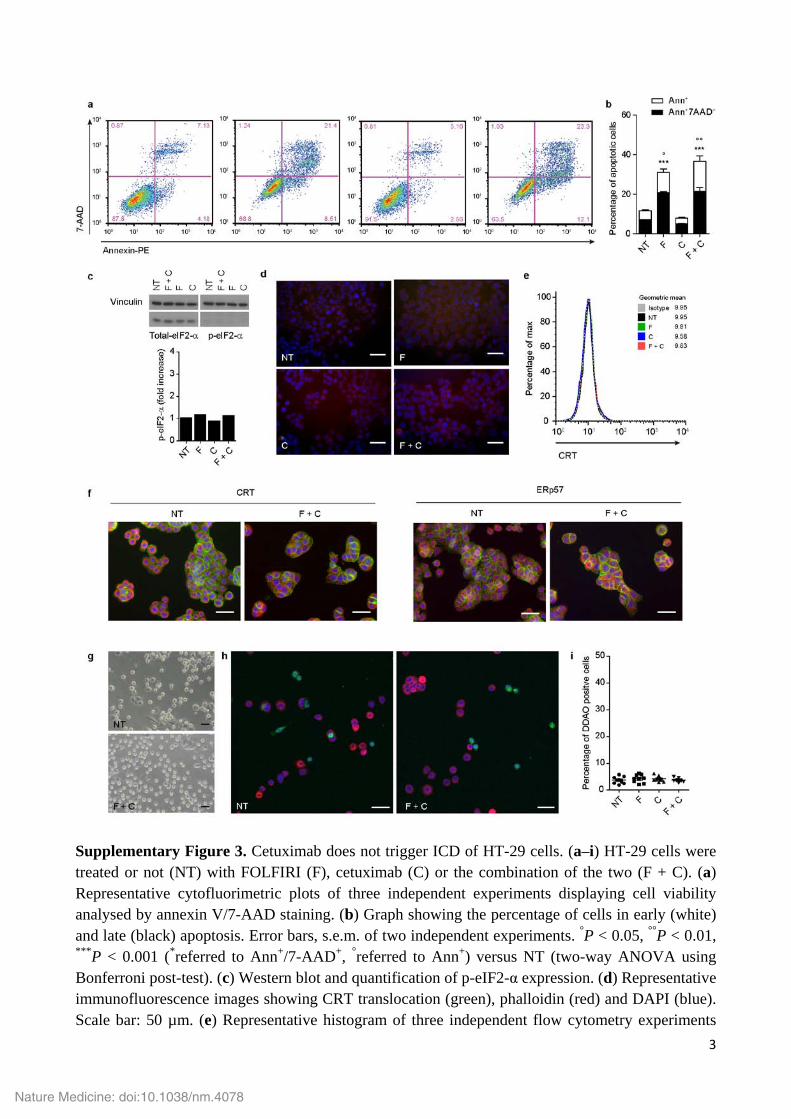
Supplementary Figure 3. Cetuximab does not trigger ICD of HT-29 cells. (a–i) HT-29 cells were treated or not (NT) with FOLFIRI (F), cetuximab (C) or the combination of the two (F + C). (a) Representative cytofluorimetric plots of three independent experiments displaying cell viability analysed by annexin V/7-AAD staining. (b) Graph showing the percentage of cells in early (white) and late (black) apoptosis. Error bars, s.e.m. of two independent experiments. °P < 0.05, °°P < 0.01, ***P < 0.001 (*referred to Ann+/7-AAD+, °referred to Ann+) versus NT (two-way ANOVA using Bonferroni post-test). (c) Western blot and quantification of p-eIF2-α expression. (d) Representative immunofluorescence images showing CRT translocation (green), phalloidin (red) and DAPI (blue). Scale bar: 50 µm. (e) Representative histogram of three independent flow cytometry experiments
Nature Medicine: doi:10.1038/nm.4078
4
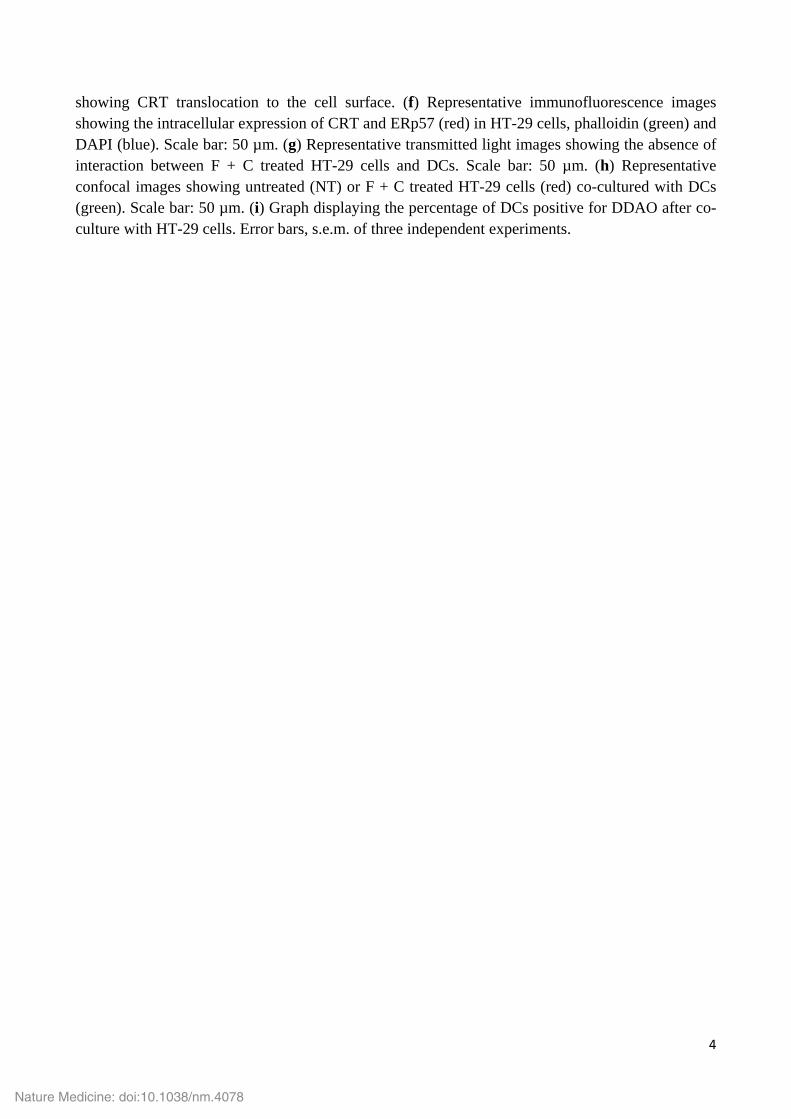
showing CRT translocation to the cell surface. (f) Representative immunofluorescence images showing the intracellular expression of CRT and ERp57 (red) in HT-29 cells, phalloidin (green) and DAPI (blue). Scale bar: 50 µm. (g) Representative transmitted light images showing the absence of interaction between F + C treated HT-29 cells and DCs. Scale bar: 50 µm. (h) Representative confocal images showing untreated (NT) or F + C treated HT-29 cells (red) co-cultured with DCs (green). Scale bar: 50 µm. (i) Graph displaying the percentage of DCs positive for DDAO after co-culture with HT-29 cells. Error bars, s.e.m. of three independent experiments.
Nature Medicine: doi:10.1038/nm.4078
5
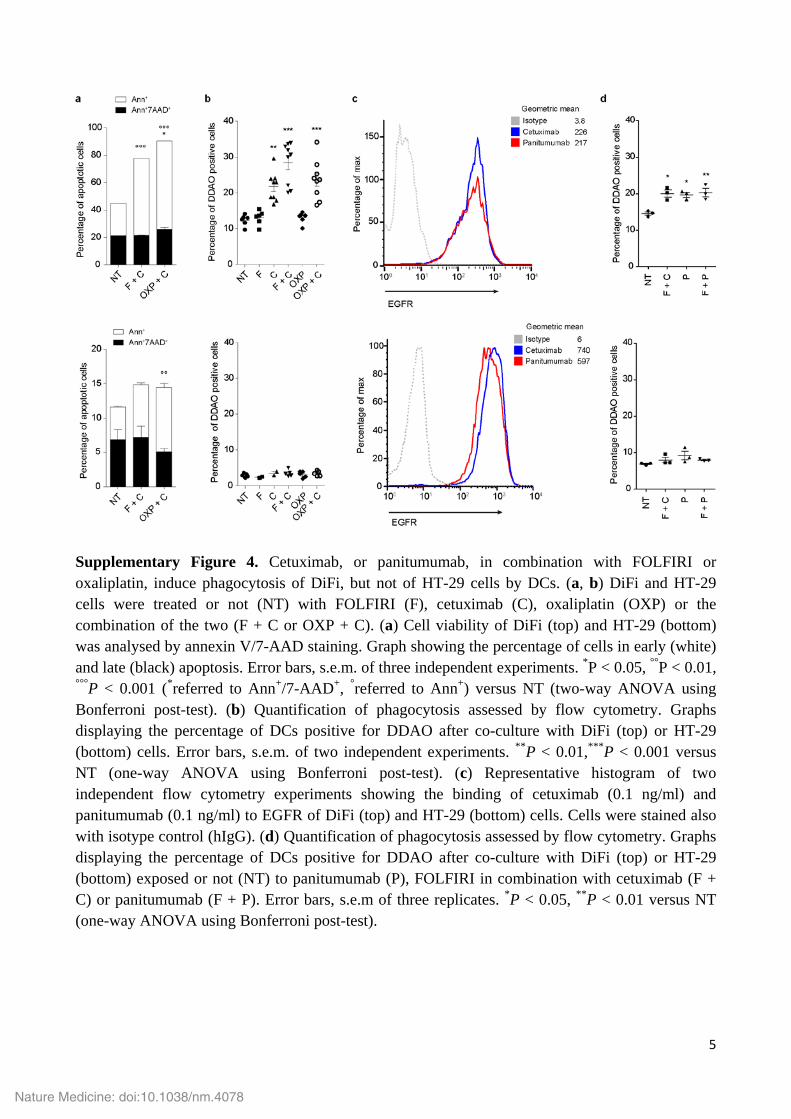
Supplementary Figure 4. Cetuximab, or panitumumab, in combination with FOLFIRI or oxaliplatin, induce phagocytosis of DiFi, but not of HT-29 cells by DCs. (a, b) DiFi and HT-29 cells were treated or not (NT) with FOLFIRI (F), cetuximab (C), oxaliplatin (OXP) or the combination of the two (F + C or OXP + C). (a) Cell viability of DiFi (top) and HT-29 (bottom) was analysed by annexin V/7-AAD staining. Graph showing the percentage of cells in early (white) and late (black) apoptosis. Error bars, s.e.m. of three independent experiments. *P < 0.05, °°P < 0.01, °°°P < 0.001 (*referred to Ann+/7-AAD+, °referred to Ann+) versus NT (two-way ANOVA using Bonferroni post-test). (b) Quantification of phagocytosis assessed by flow cytometry. Graphs displaying the percentage of DCs positive for DDAO after co-culture with DiFi (top) or HT-29 (bottom) cells. Error bars, s.e.m. of two independent experiments. **P < 0.01,***P < 0.001 versus NT (one-way ANOVA using Bonferroni post-test). (c) Representative histogram of two independent flow cytometry experiments showing the binding of cetuximab (0.1 ng/ml) and panitumumab (0.1 ng/ml) to EGFR of DiFi (top) and HT-29 (bottom) cells. Cells were stained also with isotype control (hIgG). (d) Quantification of phagocytosis assessed by flow cytometry. Graphs displaying the percentage of DCs positive for DDAO after co-culture with DiFi (top) or HT-29 (bottom) exposed or not (NT) to panitumumab (P), FOLFIRI in combination with cetuximab (F + C) or panitumumab (F + P). Error bars, s.e.m of three replicates. *P < 0.05, **P < 0.01 versus NT (one-way ANOVA using Bonferroni post-test).
Nature Medicine: doi:10.1038/nm.4078

6
Supplementary Figure 5. Phagocytosis of different human CRC cell lines (raw data of Table 1). (a) Quantification of phagocytosis of SK-CO-1, HCT116, Lim1215 KRASG12D treated or not (NT) with FOLFIRI (F), cetuximab (C) or the combination of the two (F + C) co-cultured with DCs, assessed by flow cytometry. Error bars, s.e.m. of two (SK-CO-1) or three (HCT116, Lim1215 KRASG12D) independent experiments. *P < 0.05 versus NT (one-way ANOVA using Bonferroni post-test). **P < 0.01 versus NT (unpaired Student’s t-test). (b) Quantification of phagocytosis of OXCO-2, Caco-2, COLO-205, RKO, NCI-H508 cells treated or not (NT) with FOLFIRI (F), cetuximab (C) or the combination of the two (F+C) co-cultured with DCs, assessed by flow cytometry. Error bars, s.e.m. of three replicates (OXCO-2, COLO205, NCI-H508) or of two independent experiments (Caco-2, RKO). *P < 0.05 versus NT (unpaired Student’s t-test).
Nature Medicine: doi:10.1038/nm.4078
7
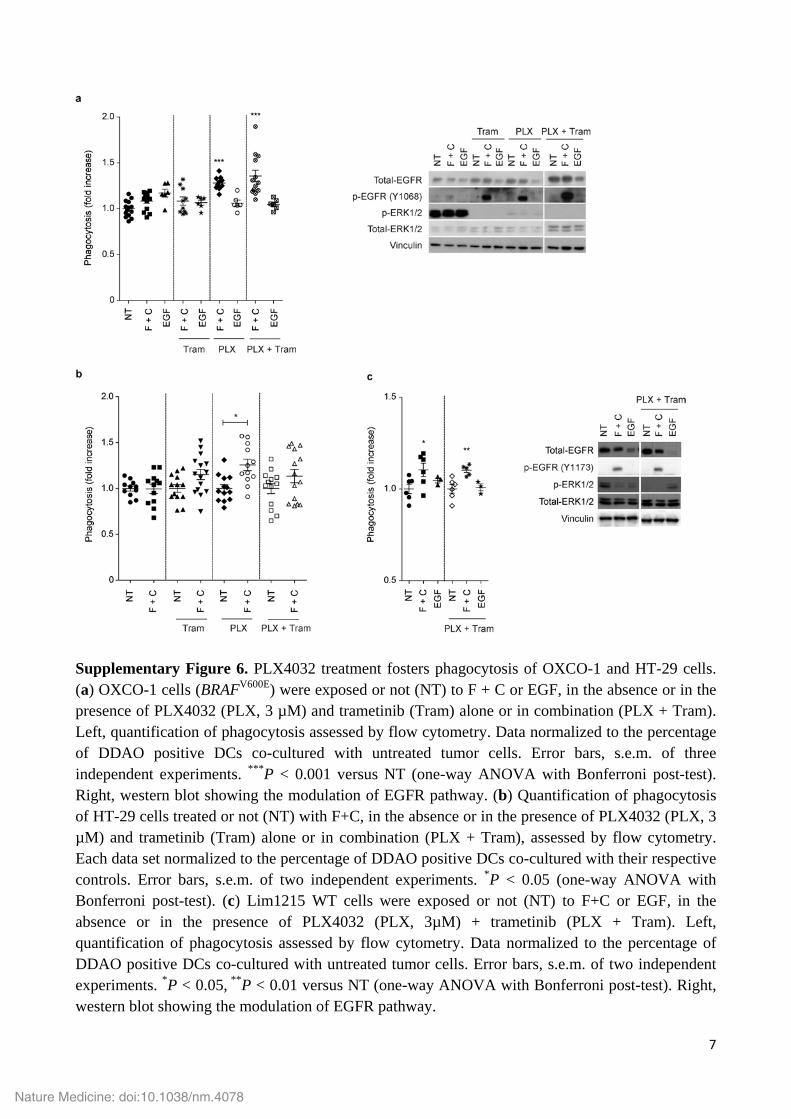
Supplementary Figure 6. PLX4032 treatment fosters phagocytosis of OXCO-1 and HT-29 cells. (a) OXCO-1 cells (BRAFV600E) were exposed or not (NT) to F + C or EGF, in the absence or in the presence of PLX4032 (PLX, 3 µM) and trametinib (Tram) alone or in combination (PLX + Tram). Left, quantification of phagocytosis assessed by flow cytometry. Data normalized to the percentage of DDAO positive DCs co-cultured with untreated tumor cells. Error bars, s.e.m. of three independent experiments. ***P < 0.001 versus NT (one-way ANOVA with Bonferroni post-test). Right, western blot showing the modulation of EGFR pathway. (b) Quantification of phagocytosis of HT-29 cells treated or not (NT) with F+C, in the absence or in the presence of PLX4032 (PLX, 3 µM) and trametinib (Tram) alone or in combination (PLX + Tram), assessed by flow cytometry. Each data set normalized to the percentage of DDAO positive DCs co-cultured with their respective controls. Error bars, s.e.m. of two independent experiments. *P < 0.05 (one-way ANOVA with Bonferroni post-test). (c) Lim1215 WT cells were exposed or not (NT) to F+C or EGF, in the absence or in the presence of PLX4032 (PLX, 3µM) + trametinib (PLX + Tram). Left, quantification of phagocytosis assessed by flow cytometry. Data normalized to the percentage of DDAO positive DCs co-cultured with untreated tumor cells. Error bars, s.e.m. of two independent experiments. *P < 0.05, **P < 0.01 versus NT (one-way ANOVA with Bonferroni post-test). Right, western blot showing the modulation of EGFR pathway.
Nature Medicine: doi:10.1038/nm.4078
8
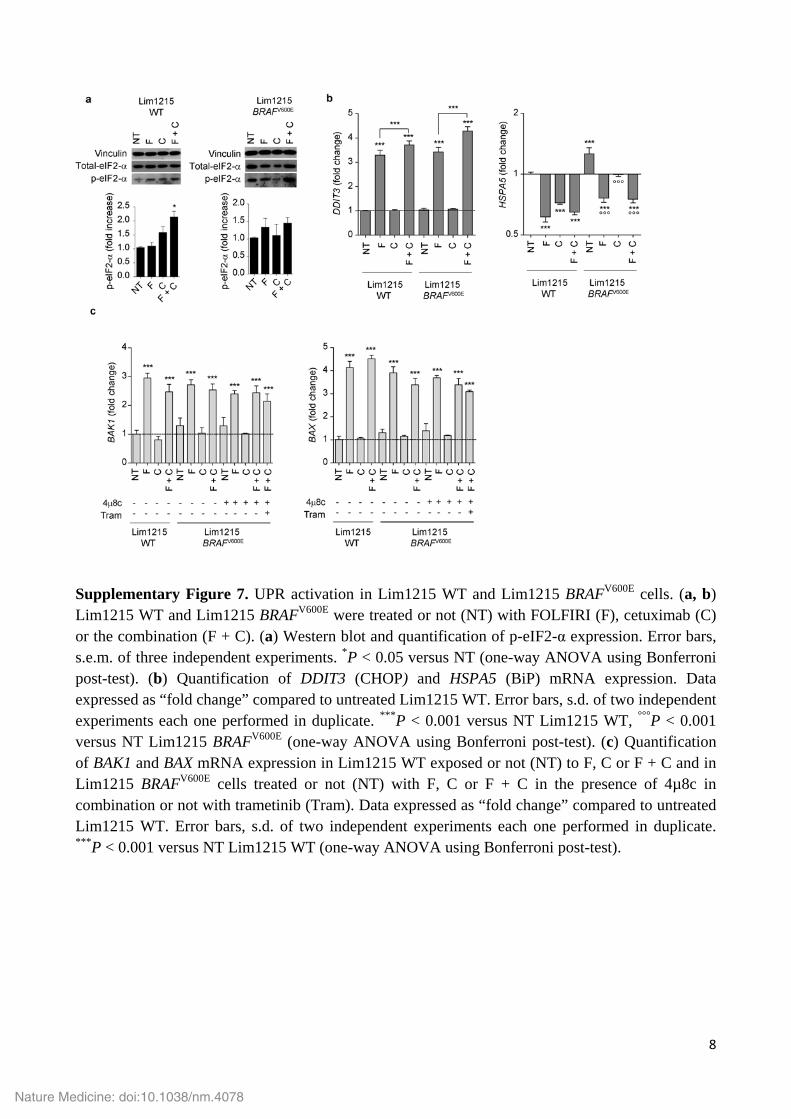
Supplementary Figure 7. UPR activation in Lim1215 WT and Lim1215 BRAFV600E cells. (a, b) Lim1215 WT and Lim1215 BRAFV600E were treated or not (NT) with FOLFIRI (F), cetuximab (C) or the combination (F + C). (a) Western blot and quantification of p-eIF2-α expression. Error bars, s.e.m. of three independent experiments. *P < 0.05 versus NT (one-way ANOVA using Bonferroni post-test). (b) Quantification of DDIT3 (CHOP) and HSPA5 (BiP) mRNA expression. Data expressed as “fold change” compared to untreated Lim1215 WT. Error bars, s.d. of two independent experiments each one performed in duplicate. ***P < 0.001 versus NT Lim1215 WT, °°°P < 0.001 versus NT Lim1215 BRAFV600E (one-way ANOVA using Bonferroni post-test). (c) Quantification of BAK1 and BAX mRNA expression in Lim1215 WT exposed or not (NT) to F, C or F + C and in Lim1215 BRAFV600E cells treated or not (NT) with F, C or F + C in the presence of 4µ8c in combination or not with trametinib (Tram). Data expressed as “fold change” compared to untreated Lim1215 WT. Error bars, s.d. of two independent experiments each one performed in duplicate. ***P < 0.001 versus NT Lim1215 WT (one-way ANOVA using Bonferroni post-test).
Nature Medicine: doi:10.1038/nm.4078
9
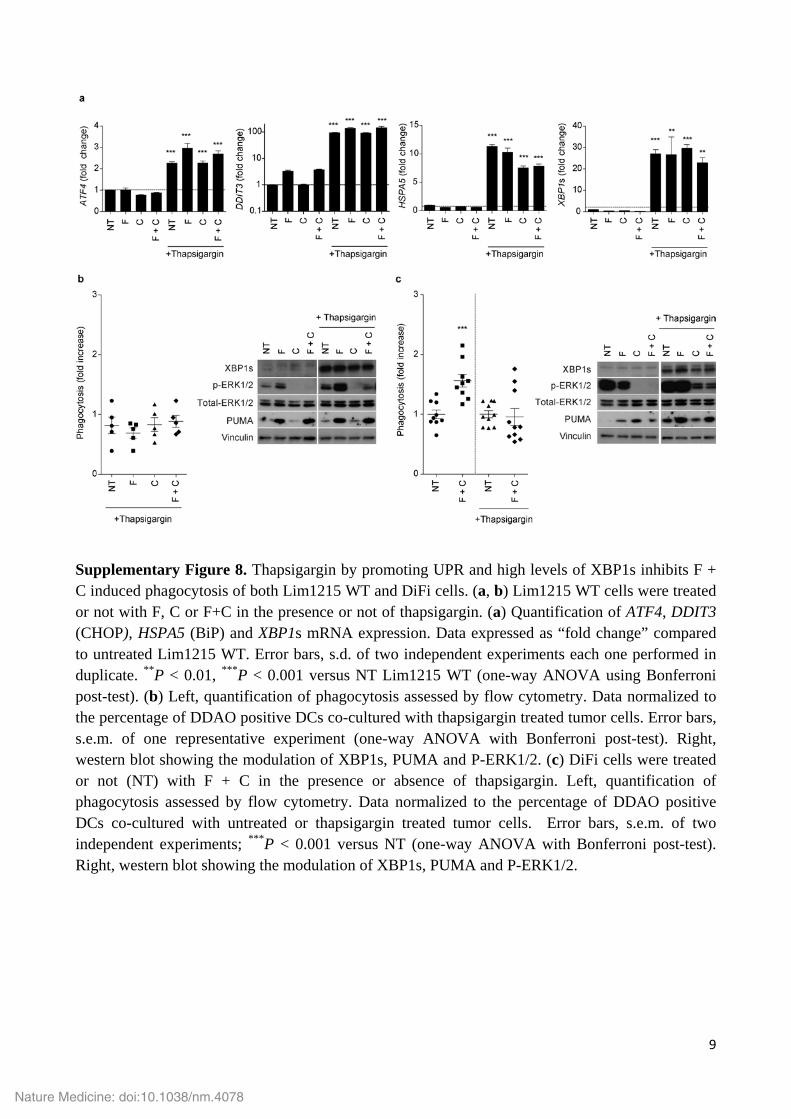
Supplementary Figure 8. Thapsigargin by promoting UPR and high levels of XBP1s inhibits F + C induced phagocytosis of both Lim1215 WT and DiFi cells. (a, b) Lim1215 WT cells were treated or not with F, C or F+C in the presence or not of thapsigargin. (a) Quantification of ATF4, DDIT3 (CHOP), HSPA5 (BiP) and XBP1s mRNA expression. Data expressed as “fold change” compared to untreated Lim1215 WT. Error bars, s.d. of two independent experiments each one performed in duplicate. **P < 0.01, ***P < 0.001 versus NT Lim1215 WT (one-way ANOVA using Bonferroni post-test). (b) Left, quantification of phagocytosis assessed by flow cytometry. Data normalized to the percentage of DDAO positive DCs co-cultured with thapsigargin treated tumor cells. Error bars, s.e.m. of one representative experiment (one-way ANOVA with Bonferroni post-test). Right, western blot showing the modulation of XBP1s, PUMA and P-ERK1/2. (c) DiFi cells were treated or not (NT) with F + C in the presence or absence of thapsigargin. Left, quantification of phagocytosis assessed by flow cytometry. Data normalized to the percentage of DDAO positive DCs co-cultured with untreated or thapsigargin treated tumor cells. Error bars, s.e.m. of two independent experiments; ***P < 0.001 versus NT (one-way ANOVA with Bonferroni post-test). Right, western blot showing the modulation of XBP1s, PUMA and P-ERK1/2.
Nature Medicine: doi:10.1038/nm.4078
10
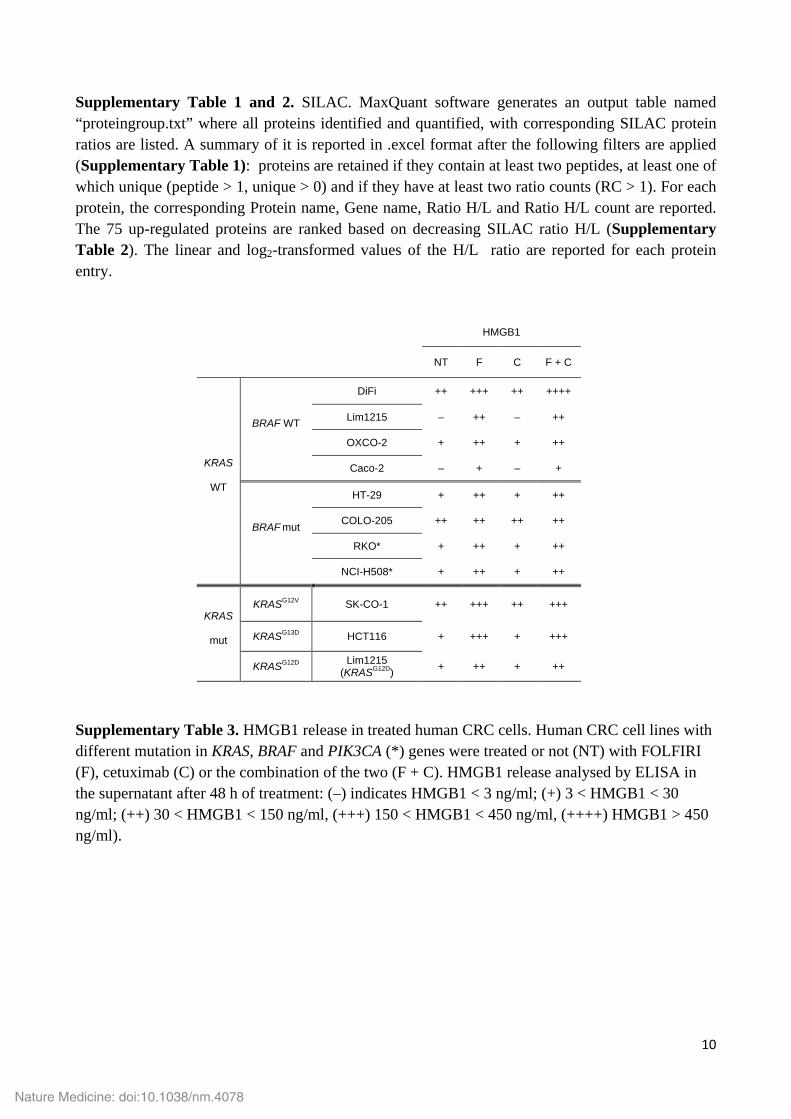
Supplementary Table 1 and 2. SILAC. MaxQuant software generates an output table named “proteingroup.txt” where all proteins identified and quantified, with corresponding SILAC protein ratios are listed. A summary of it is reported in .excel format after the following filters are applied (Supplementary Table 1): proteins are retained if they contain at least two peptides, at least one of which unique (peptide > 1, unique > 0) and if they have at least two ratio counts (RC > 1). For each protein, the corresponding Protein name, Gene name, Ratio H/L and Ratio H/L count are reported. The 75 up-regulated proteins are ranked based on decreasing SILAC ratio H/L (Supplementary Table 2). The linear and log2-transformed values of the H/L ratio are reported for each protein entry.
HMGB1
NT F C F + C
KRAS
WT
BRAF WT
DiFi ++ +++ ++ ++++
Lim1215 – ++ – ++
OXCO-2 + ++ + ++
Caco-2 – + – +
BRAF mut
HT-29 + ++ + ++
COLO-205 ++ ++ ++ ++
RKO* + ++ + ++
NCI-H508* + ++ + ++
KRAS
mut
KRASG12V SK-CO-1 ++ +++ ++ +++
KRASG13D HCT116 + +++ + +++
KRASG12D Lim1215 (KRASG12D) + ++ + ++
Supplementary Table 3. HMGB1 release in treated human CRC cells. Human CRC cell lines with different mutation in KRAS, BRAF and PIK3CA (*) genes were treated or not (NT) with FOLFIRI (F), cetuximab (C) or the combination of the two (F + C). HMGB1 release analysed by ELISA in the supernatant after 48 h of treatment: (–) indicates HMGB1 < 3 ng/ml; (+) 3 < HMGB1 < 30 ng/ml; (++) 30 < HMGB1 < 150 ng/ml, (+++) 150 < HMGB1 < 450 ng/ml, (++++) HMGB1 > 450 ng/ml).
Nature Medicine: doi:10.1038/nm.4078
11
XBP1s 5'-CTGAGTCCGAATCAGGTGCAG-3' FW 5'-ATCCATGGGGAGATGTTCTGG-3' RV
ATF4 5'-GTTCTCCAGCGACAAGGCTA-3' FW 5'-ATCCTCCTTGCTGTTGTTGG-3' RV
DDIT3 5'-AGAACCAGGAAACGGAAACAGA-3' FW 5'-TCTCCTTCATGCGCTGCTTT-3' RV
HSPA5 5'-TGTTCAACCAATTATCAGCAAACTC-3' FW 5'-TTCTGCTGTATCCTCTTCACCAGT-3' RV
BBC3 5'-ACCTCAACGCACAGTACGAG-3' FW 5'-CCCATGATGAGATTGTACAGGA-3' RV
BAX 5'-TGGAGCTGCAGAGGATGATTG-3' FW 5'-GAAGTTGCCGTCAGAAAACATG-3' RV
BAK1 5'-ATGGTCACCTTACCTCTGCAA-3' FW 5'-TCATAGCGTCGGTTGATGTCG-3' RV
GAPDH 5'-ATCAGCAATGCCTCCTGCAC-3' FW 5'-TGGCATGGACTGTGGTCATG-3' RV
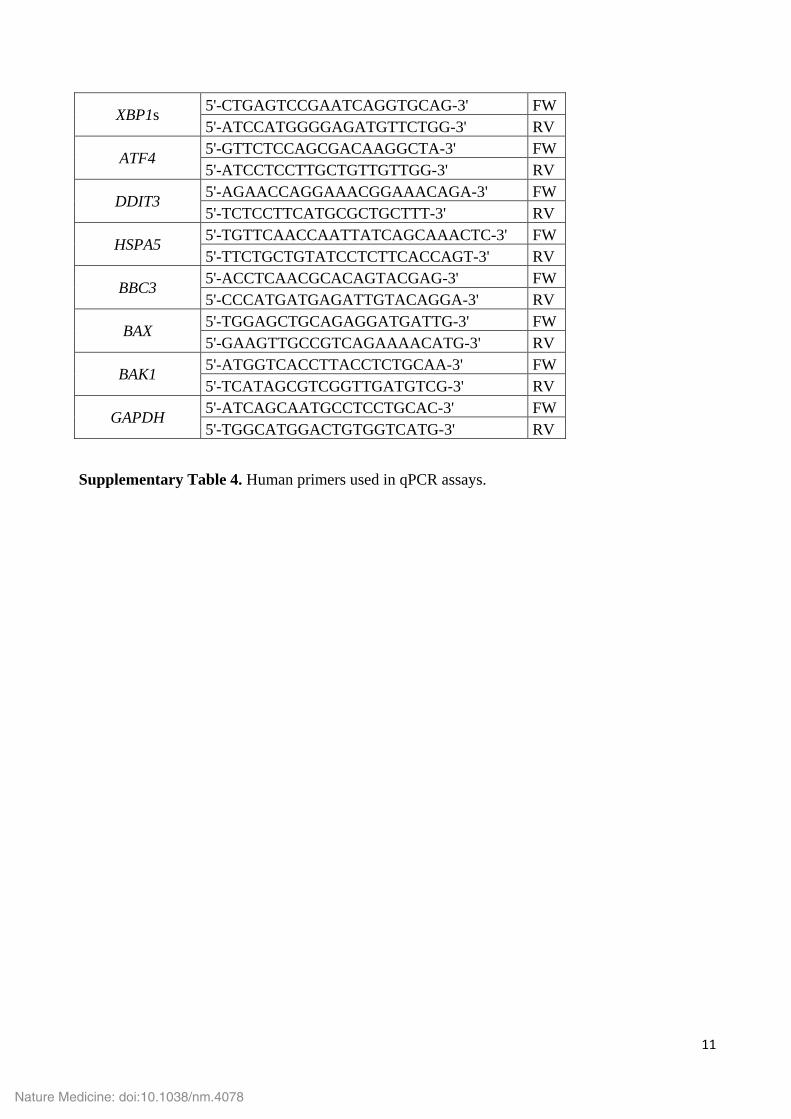
Supplementary Table 4. Human primers used in qPCR assays.
Nature Medicine: doi:10.1038/nm.4078