
5 Inelastic Nuclear Resonant Scattering - Springer · 5 Inelastic Nuclear Resonant Scattering ......
51
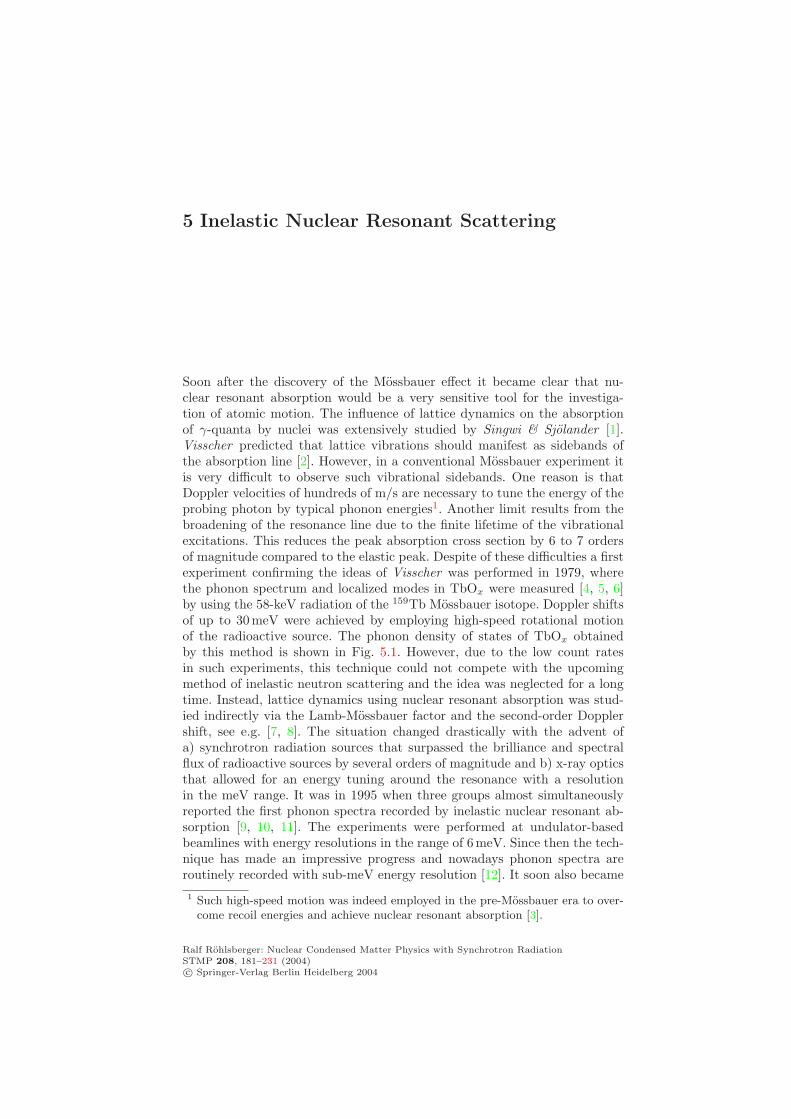
5 Inelastic Nuclear Resonant Scattering Soon after the discovery of the M¨ ossbauer effect it became clear that nu- clear resonant absorption would be a very sensitive tool for the investiga- tion of atomic motion. The influence of lattice dynamics on the absorption of γ -quanta by nuclei was extensively studied by Singwi & Sj¨ olander [1]. Visscher predicted that lattice vibrations should manifest as sidebands of the absorption line [2]. However, in a conventional M¨ ossbauer experiment it is very difficult to observe such vibrational sidebands. One reason is that Doppler velocities of hundreds of m/s are necessary to tune the energy of the probing photon by typical phonon energies 1 . Another limit results from the broadening of the resonance line due to the finite lifetime of the vibrational excitations. This reduces the peak absorption cross section by 6 to 7 orders of magnitude compared to the elastic peak. Despite of these difficulties a first experiment confirming the ideas of Visscher was performed in 1979, where the phonon spectrum and localized modes in TbO x were measured [4, 5, 6] by using the 58-keV radiation of the 159 Tb M¨ ossbauer isotope. Doppler shifts of up to 30meV were achieved by employing high-speed rotational motion of the radioactive source. The phonon density of states of TbO x obtained by this method is shown in Fig. 5.1. However, due to the low count rates in such experiments, this technique could not compete with the upcoming method of inelastic neutron scattering and the idea was neglected for a long time. Instead, lattice dynamics using nuclear resonant absorption was stud- ied indirectly via the Lamb-M¨ ossbauer factor and the second-order Doppler shift, see e.g. [7, 8]. The situation changed drastically with the advent of a) synchrotron radiation sources that surpassed the brilliance and spectral flux of radioactive sources by several orders of magnitude and b) x-ray optics that allowed for an energy tuning around the resonance with a resolution in the meV range. It was in 1995 when three groups almost simultaneously reported the first phonon spectra recorded by inelastic nuclear resonant ab- sorption [9, 10, 11]. The experiments were performed at undulator-based beamlines with energy resolutions in the range of 6 meV. Since then the tech- nique has made an impressive progress and nowadays phonon spectra are routinely recorded with sub-meV energy resolution [12]. It soon also became 1 Such high-speed motion was indeed employed in the pre-M¨ossbauer era to over- come recoil energies and achieve nuclear resonant absorption [3]. Ralf R¨ohlsberger: Nuclear Condensed Matter Physics with Synchrotron Radiation STMP 208, 181–231 (2004) c Springer-Verlag Berlin Heidelberg 2004
-
Upload
truongduong -
Category
Documents
-
view
221 -
download
2
Transcript of 5 Inelastic Nuclear Resonant Scattering - Springer · 5 Inelastic Nuclear Resonant Scattering ......
5 Inelastic Nuclear Resonant Scattering
Soon after the discovery of the Mossbauer effect it became clear that nu-clear resonant absorption would be a very sensitive tool for the investiga-tion of atomic motion. The influence of lattice dynamics on the absorptionof γ-quanta by nuclei was extensively studied by Singwi & Sjolander [1].Visscher predicted that lattice vibrations should manifest as sidebands ofthe absorption line [2]. However, in a conventional Mossbauer experiment itis very difficult to observe such vibrational sidebands. One reason is thatDoppler velocities of hundreds of m/s are necessary to tune the energy of theprobing photon by typical phonon energies1. Another limit results from thebroadening of the resonance line due to the finite lifetime of the vibrationalexcitations. This reduces the peak absorption cross section by 6 to 7 ordersof magnitude compared to the elastic peak. Despite of these difficulties a firstexperiment confirming the ideas of Visscher was performed in 1979, wherethe phonon spectrum and localized modes in TbOx were measured [4, 5, 6]by using the 58-keV radiation of the 159Tb Mossbauer isotope. Doppler shiftsof up to 30 meV were achieved by employing high-speed rotational motionof the radioactive source. The phonon density of states of TbOx obtainedby this method is shown in Fig. 5.1. However, due to the low count ratesin such experiments, this technique could not compete with the upcomingmethod of inelastic neutron scattering and the idea was neglected for a longtime. Instead, lattice dynamics using nuclear resonant absorption was stud-ied indirectly via the Lamb-Mossbauer factor and the second-order Dopplershift, see e.g. [7, 8]. The situation changed drastically with the advent ofa) synchrotron radiation sources that surpassed the brilliance and spectralflux of radioactive sources by several orders of magnitude and b) x-ray opticsthat allowed for an energy tuning around the resonance with a resolutionin the meV range. It was in 1995 when three groups almost simultaneouslyreported the first phonon spectra recorded by inelastic nuclear resonant ab-sorption [9, 10, 11]. The experiments were performed at undulator-basedbeamlines with energy resolutions in the range of 6meV. Since then the tech-nique has made an impressive progress and nowadays phonon spectra areroutinely recorded with sub-meV energy resolution [12]. It soon also became
1 Such high-speed motion was indeed employed in the pre-Mossbauer era to over-come recoil energies and achieve nuclear resonant absorption [3].
Ralf Rohlsberger: Nuclear Condensed Matter Physics with Synchrotron RadiationSTMP 208, 181–231 (2004)c© Springer-Verlag Berlin Heidelberg 2004
182 5 Inelastic Nuclear Resonant Scattering
2.7 10 4
resσbarn
meV0E – E50
60
40
20
010 15 20 25
W
W0
1
W (n > 1)n
Fig. 5.1. Phonon spectrumof 159Tb recorded with theradiation from a radioactivesource (Figure adopted fromWeiss et al. [5])
clear that the enormous brilliance of undulator radiation at third-generationsynchrotrons renders this technique sensitive to very small sample volumes.In the following, the basic features of inelastic nuclear resonant scattering willbe described and applications of this method to study vibrational propertiesof thin films and nanostructures will be demonstrated.
5.1 Inelastic Nuclear Resonant Absorption
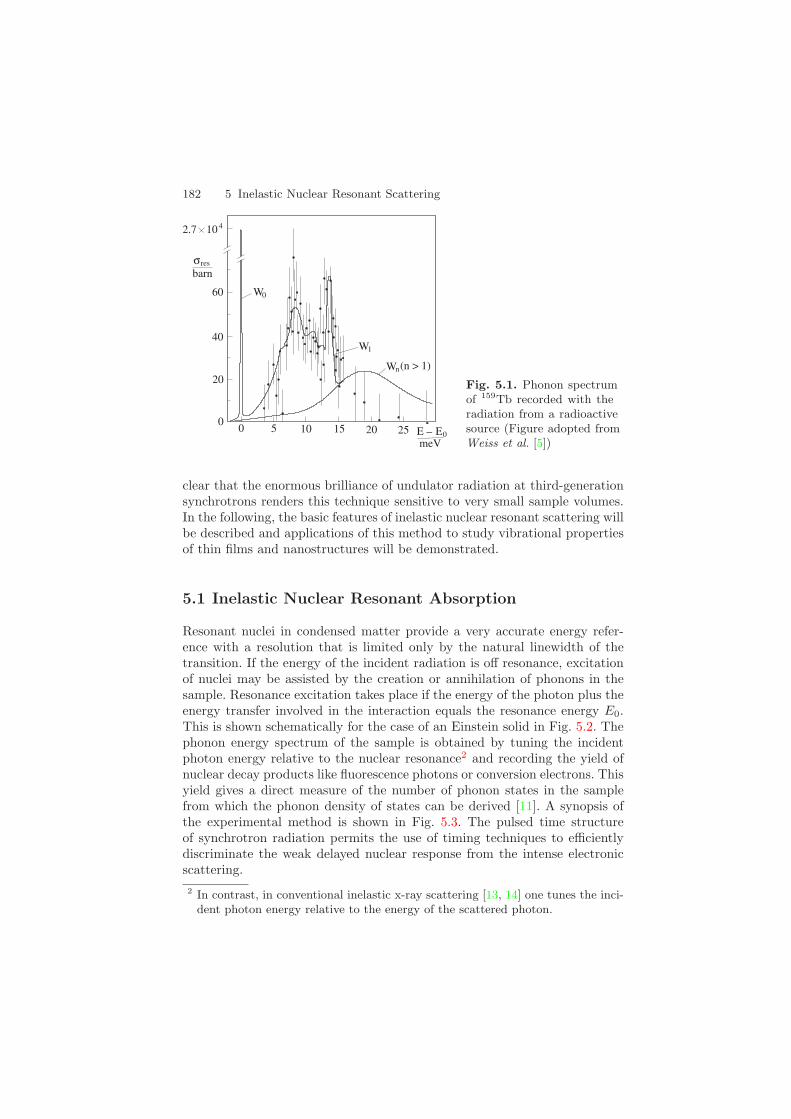
Resonant nuclei in condensed matter provide a very accurate energy refer-ence with a resolution that is limited only by the natural linewidth of thetransition. If the energy of the incident radiation is off resonance, excitationof nuclei may be assisted by the creation or annihilation of phonons in thesample. Resonance excitation takes place if the energy of the photon plus theenergy transfer involved in the interaction equals the resonance energy E0.This is shown schematically for the case of an Einstein solid in Fig. 5.2. Thephonon energy spectrum of the sample is obtained by tuning the incidentphoton energy relative to the nuclear resonance2 and recording the yield ofnuclear decay products like fluorescence photons or conversion electrons. Thisyield gives a direct measure of the number of phonon states in the samplefrom which the phonon density of states can be derived [11]. A synopsis ofthe experimental method is shown in Fig. 5.3. The pulsed time structureof synchrotron radiation permits the use of timing techniques to efficientlydiscriminate the weak delayed nuclear response from the intense electronicscattering.2 In contrast, in conventional inelastic x-ray scattering [13, 14] one tunes the inci-
dent photon energy relative to the energy of the scattered photon.
5.1 Inelastic Nuclear Resonant Absorption 183S
(E)
−2Eph Eph 2Eph E − E0−Eph
Eph
E0
1−phonon 2−phononelastic
0
Fig. 5.2. Excitation processesupon resonant scattering froman Einstein solid and the cor-responding excitation probabil-ity density S(E). Direct exci-tation of the transition withresonance energy E0 leads tothe central elastic line in S(E).Additional transitions (dashedlines) include the creation or an-nihilation of one phonon withthe energy Eph. Multiphonontransitions involve excitation ofmore than one phonon like the2-phonon transitions shown asdotted lines. The strength of thevibrational transitions is deter-mined by the number of phononstates at a given energy (DOS)and their thermal occupationnumber
An excited nucleus may decay via two channels: Radiative decay andinternal conversion. The relative probability of these channels is 1/(1 + α)and α/(1 + α), respectively, where α is the internal conversion coefficient.Since for most Mossbauer isotopes α > 1, the dominating channel is internalconversion. Depending on the experimental situation, the following decaychannels can be used as the inelastic signal:
– Nuclear resonant fluorescenceThe incident photon is absorbed and a photon is reemitted.
– Conversion electron emissionThe excitation energy of the nucleus is transferred to the electron shell, sothat an electron is emitted. Due to the small escape depth of the electrons,this method has a potentially high surface sensitivity.
– Atomic fluorescence following internal conversionAfter emission of a conversion electron, the electronic recombination leadsto emission of a fluorescence photon3.
The outstanding brilliance of modern synchrotron radiation sources allowsone to probe the dynamical properties of very small sample volumes. In thefollowing some quantitative aspects of this method will be elaborated.
In an incoherent scattering process the total yield of delayed K-fluorescencephotons is given by3 If the nuclear transition energy is below the K-edge, K-fluorescence is not possi-
ble, as it is the case for 119Sn [15, 16]. Since L-fluorescence photons are often toolow in energy to be detected, nuclear resonant fluorescence has to be used then.

184 5 Inelastic Nuclear Resonant Scattering
APD
sample
0
APDHRM
(a)
(b)
(delayed fluorescence)
time after excitation
log
(int
ensi
ty)
Non−resonant scattering (~10 MHz)
Resonant scattering (~10 Hz)
Fig. 5.3. Synopsis of themethod of inelastic nuclearresonant scattering: (a) Timediscrimination of the delayednuclear resonant scatteringafter excitation at t = 0.The ratio of the nonreso-nant prompt photons andthe resonant delayed countsis about 106. (b) Scheme ofthe experimental setup withhigh-resolution monochroma-tor (HRM) and detection offluorescence quanta over thesolid angle with a large-areaavalanche photodiode (APD).The detector in forward di-rection monitors the energydependence of the elasticallyscattered quanta which givesthe resolution function of thesetup
I(E) = I0 ρ ηKΓK
Γ0σ(E) , (5.1)
where I0 is the incident flux, ρ the effective area density of the nuclei, and ηK
the K-fluorescence yield. The ratio of the nonradiative (internal conversion)linewidth ΓK to the natural linewidth Γ0 of the nuclear transition is given by
ΓK
Γ0=
αK
1 + α, (5.2)
where α and αK are the total and partial internal conversion coefficients,respectively. σ(E) is the cross section for nuclear resonant absorption of aphoton with energy E:
σ(E) =π
2σ(E0)Γ0 S(E − E0) , (5.3)
where σ(E0) = σ0 is the nuclear absorption cross section at the resonanceenergy E0
4. S(E) is the normalized probability of absorption per unit energyinterval at the energy E that depends also on the incident wavevector k0.According to Singwi & Sjolander [1] it can be written as:
S(k0, E) =12π
∞∫
0
dt e−iEt−Γ0 t/2 F (k0, t) , (5.4)
4 σ0 is tabulated for all Mossbauer isotopes in Table A.1 of the appendix.
5.1 Inelastic Nuclear Resonant Absorption 185
with
F (k, t) = 〈 e−ik·r(0) eik·r(t) 〉T . (5.5)
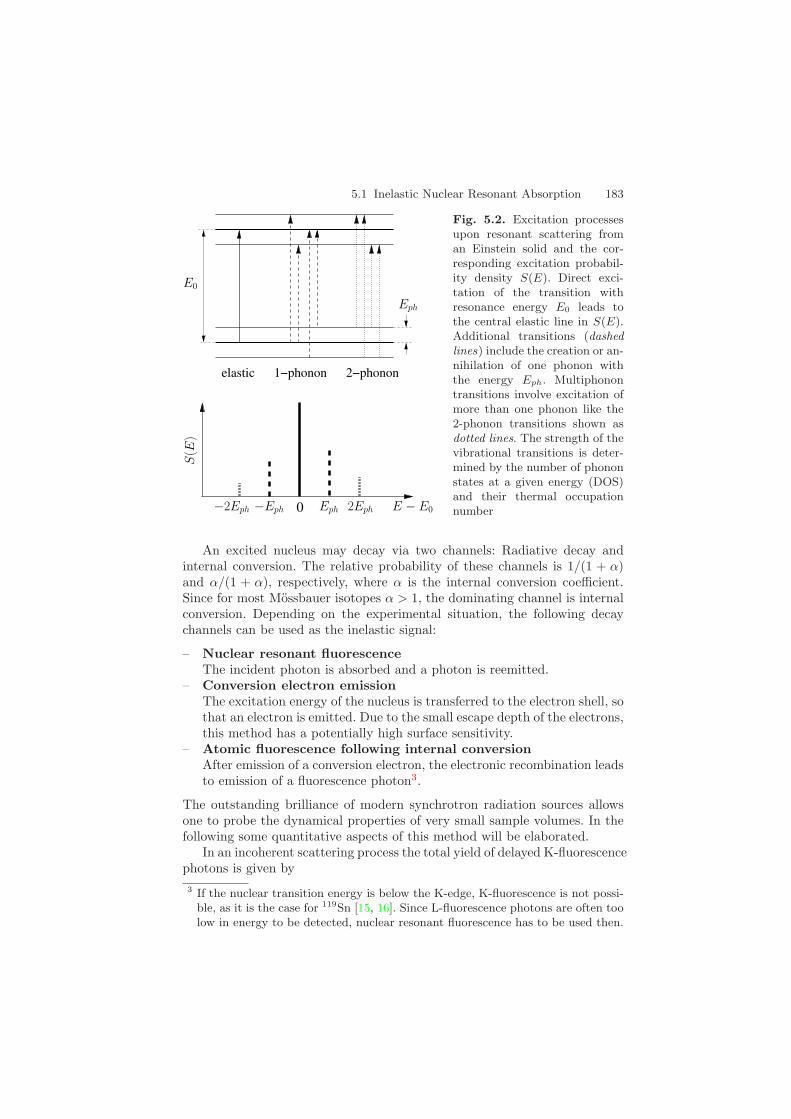
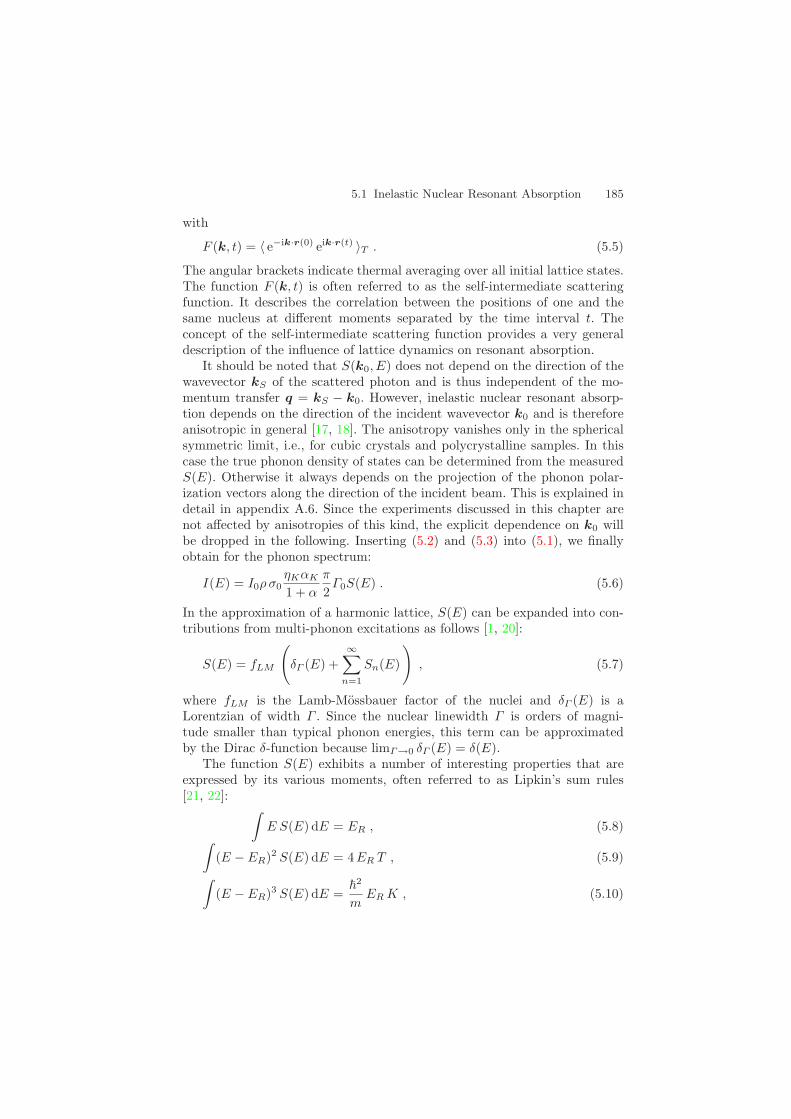
The angular brackets indicate thermal averaging over all initial lattice states.The function F (k, t) is often referred to as the self-intermediate scatteringfunction. It describes the correlation between the positions of one and thesame nucleus at different moments separated by the time interval t. Theconcept of the self-intermediate scattering function provides a very generaldescription of the influence of lattice dynamics on resonant absorption.
It should be noted that S(k0, E) does not depend on the direction of thewavevector kS of the scattered photon and is thus independent of the mo-mentum transfer q = kS − k0. However, inelastic nuclear resonant absorp-tion depends on the direction of the incident wavevector k0 and is thereforeanisotropic in general [17, 18]. The anisotropy vanishes only in the sphericalsymmetric limit, i.e., for cubic crystals and polycrystalline samples. In thiscase the true phonon density of states can be determined from the measuredS(E). Otherwise it always depends on the projection of the phonon polar-ization vectors along the direction of the incident beam. This is explained indetail in appendix A.6. Since the experiments discussed in this chapter arenot affected by anisotropies of this kind, the explicit dependence on k0 willbe dropped in the following. Inserting (5.2) and (5.3) into (5.1), we finallyobtain for the phonon spectrum:
I(E) = I0ρ σ0ηKαK
1 + α
π
2Γ0S(E) . (5.6)
In the approximation of a harmonic lattice, S(E) can be expanded into con-tributions from multi-phonon excitations as follows [1, 20]:
S(E) = fLM
(δΓ (E) +
∞∑
n=1
Sn(E)
), (5.7)
where fLM is the Lamb-Mossbauer factor of the nuclei and δΓ (E) is aLorentzian of width Γ . Since the nuclear linewidth Γ is orders of magni-tude smaller than typical phonon energies, this term can be approximatedby the Dirac δ-function because limΓ→0 δΓ (E) = δ(E).
The function S(E) exhibits a number of interesting properties that areexpressed by its various moments, often referred to as Lipkin’s sum rules[21, 22]:
∫E S(E) dE = ER , (5.8)
∫(E − ER)2 S(E) dE = 4ER T , (5.9)
∫(E − ER)3 S(E) dE =
2
mER K , (5.10)
186 5 Inelastic Nuclear Resonant Scattering
where ER = E20/2Mc2 is the recoil energy of the free atom, M is the nu-
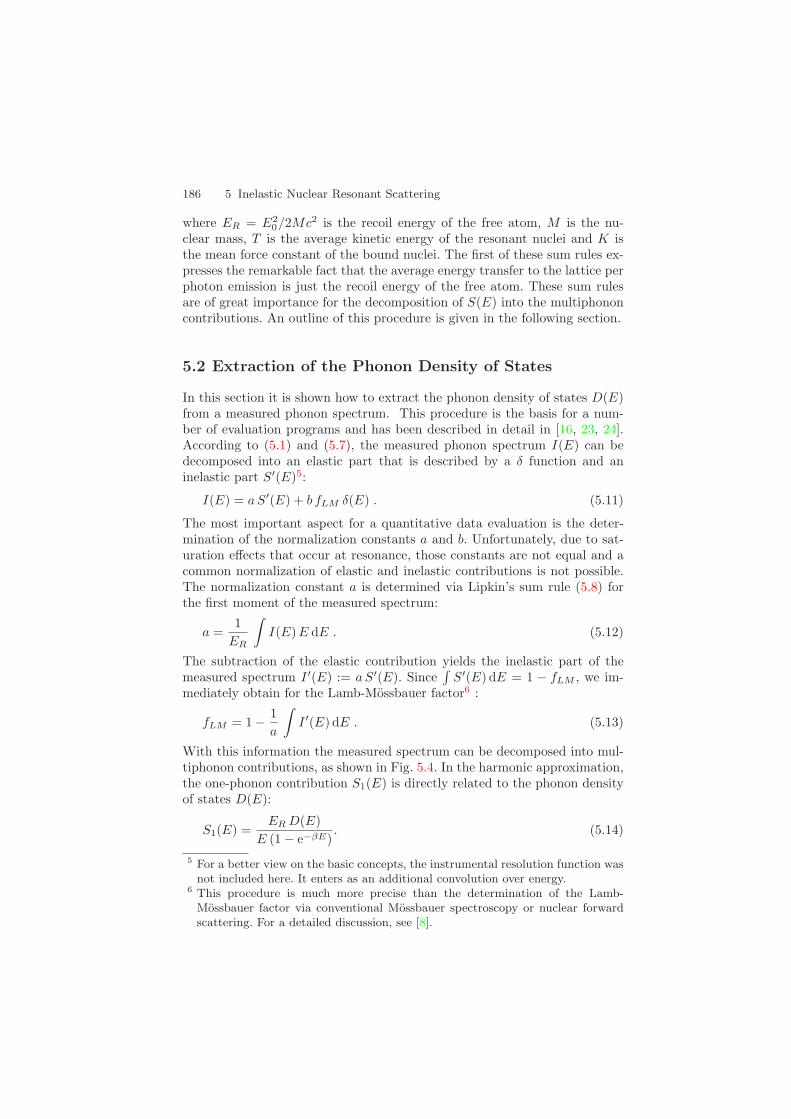
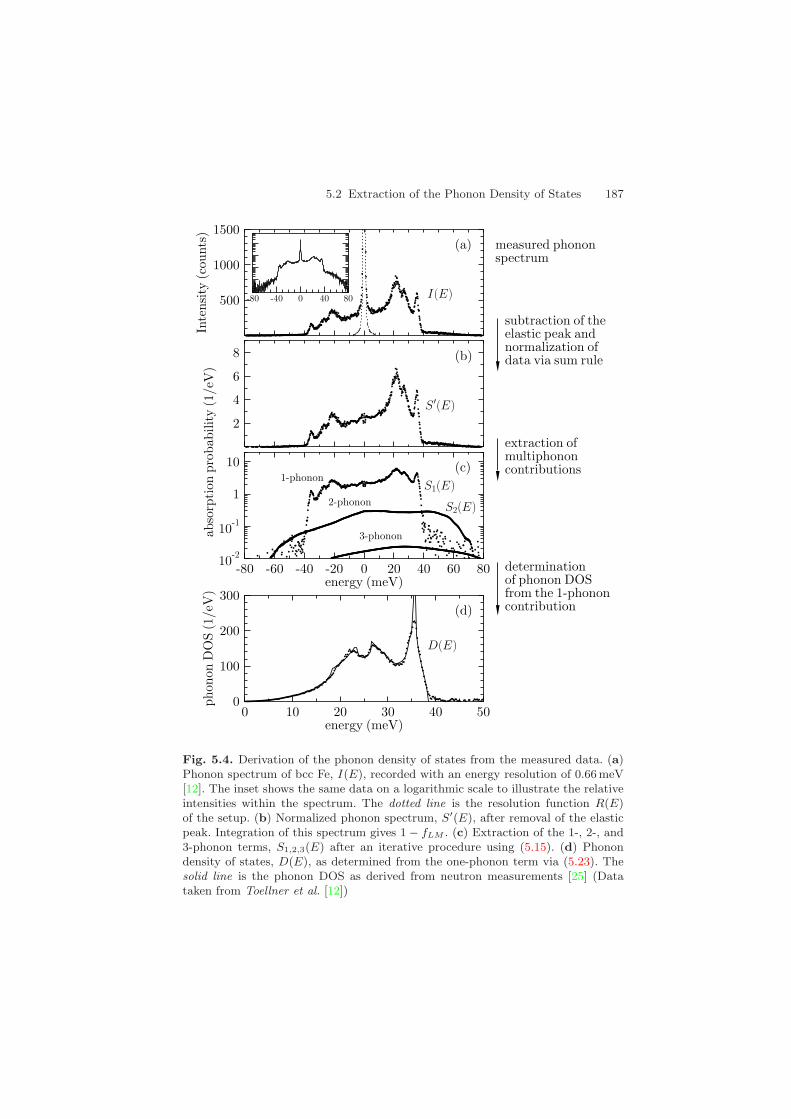
clear mass, T is the average kinetic energy of the resonant nuclei and K isthe mean force constant of the bound nuclei. The first of these sum rules ex-presses the remarkable fact that the average energy transfer to the lattice perphoton emission is just the recoil energy of the free atom. These sum rulesare of great importance for the decomposition of S(E) into the multiphononcontributions. An outline of this procedure is given in the following section.
5.2 Extraction of the Phonon Density of States
In this section it is shown how to extract the phonon density of states D(E)from a measured phonon spectrum. This procedure is the basis for a num-ber of evaluation programs and has been described in detail in [16, 23, 24].According to (5.1) and (5.7), the measured phonon spectrum I(E) can bedecomposed into an elastic part that is described by a δ function and aninelastic part S′(E)5:
I(E) = aS′(E) + b fLM δ(E) . (5.11)
The most important aspect for a quantitative data evaluation is the deter-mination of the normalization constants a and b. Unfortunately, due to sat-uration effects that occur at resonance, those constants are not equal and acommon normalization of elastic and inelastic contributions is not possible.The normalization constant a is determined via Lipkin’s sum rule (5.8) forthe first moment of the measured spectrum:
a =1
ER
∫I(E)E dE . (5.12)
The subtraction of the elastic contribution yields the inelastic part of themeasured spectrum I ′(E) := aS′(E). Since
∫S′(E) dE = 1 − fLM , we im-
mediately obtain for the Lamb-Mossbauer factor6 :
fLM = 1 − 1a
∫I ′(E) dE . (5.13)
With this information the measured spectrum can be decomposed into mul-tiphonon contributions, as shown in Fig. 5.4. In the harmonic approximation,the one-phonon contribution S1(E) is directly related to the phonon densityof states D(E):
S1(E) =ER D(E)
E (1 − e−βE). (5.14)
5 For a better view on the basic concepts, the instrumental resolution function wasnot included here. It enters as an additional convolution over energy.
6 This procedure is much more precise than the determination of the Lamb-Mossbauer factor via conventional Mossbauer spectroscopy or nuclear forwardscattering. For a detailed discussion, see [8].
5.2 Extraction of the Phonon Density of States 187
D(E)
S1(E)
S2(E)
S ′(E)
I(E)
Fig. 5.4. Derivation of the phonon density of states from the measured data. (a)Phonon spectrum of bcc Fe, I(E), recorded with an energy resolution of 0.66 meV[12]. The inset shows the same data on a logarithmic scale to illustrate the relativeintensities within the spectrum. The dotted line is the resolution function R(E)of the setup. (b) Normalized phonon spectrum, S′(E), after removal of the elasticpeak. Integration of this spectrum gives 1 − fLM . (c) Extraction of the 1-, 2-, and3-phonon terms, S1,2,3(E) after an iterative procedure using (5.15). (d) Phonondensity of states, D(E), as determined from the one-phonon term via (5.23). Thesolid line is the phonon DOS as derived from neutron measurements [25] (Datataken from Toellner et al. [12])
188 5 Inelastic Nuclear Resonant Scattering
The higher-order contributions are given by successive convolutions with theone-phonon term:
Sn(E) =1n
∫Sn−1(E − E′)S1(E′) dE′, n > 1 . (5.15)
Using the convolution theorem, this equation has a very simple expression inFourier space:
Sn(t) =1n
Sn−1(t) S1(t) . (5.16)
This recursive relation has the closed solution:
Sn(t) =1n!
[S1(t)]n . (5.17)
Thus, taking the Fourier transform of (5.7) and performing the summationover the multiphonon contributions, one obtains:
S(t) = fLM eS1(t) . (5.18)
Finally, this expression can now be resolved for the one-phonon contribution:
S1(E) =∫
dt e−iEt ln
[S(t)fLM
]. (5.19)
This method is known as the Fourier-Log decomposition [26].Now we include the resolution function R(E) into the formalism, i.e., (5.1)
is replaced by
I(E) =∫
R(E − E′) aS(E′) − b fLM δ(E′)dE′ . (5.20)
R(E) can be measured very accurately by monitoring the intensity of elasticforward scattering while tuning the energy. Including the convolution withR(E) into the above formalism, the expression (5.19) for the single-phononcontribution turns into:
S1(E) =∫
dt e−i E t ln
[1 +
I ′(t)a fLM R(t)
], (5.21)
where I ′(t) denotes the Fourier image of the measured phonon spectrumwith the elastic peak subtracted. The finite width of the resolution functionintroduces a number of problems that should be discussed here briefly. It isobvious from (5.13) that the determination of fLM and the single-phononcontribution depends critically on the subtraction of the elastic peak. Thenan assumption has to be made how to describe the region under the elasticpeak. In many cases it is reasonable to insert a one-phonon contribution froma Debye solid. However, this procedure has its limits in the case of sampleswith non-Debye behavior or a strong contribution from multiphonon termsunder the elastic peak. The latter case applies for samples with small fLM
5.3 Experimental Aspects 189
and can be cured to some extent by an iterative algorithm [24]. Also thenumerical problems that arise from the deconvolution, i.e. the division byR(t), are elaborated in [24].
Once S1(E) has been obtained, the phonon density of states D(E) can beobtained via (5.14). Taking the condition of detailed balance into account,i.e.,
S1(E) = e−β E S1(−E) , (5.22)
one can use both wings of the phonon spectrum to determine D(E), resultingin:
D(E) =E
ER(S1(E) + S1(−E)) tanh
(βE
2
)with E ≥ 0 . (5.23)
The computational procedure outlined in this section has been illustrated inFig. 5.4 for the case of bcc Fe.
The above formalism has been implemented into two program pack-ages that are available for evaluation of phonon spectra, i.e., the packagePHOENIX by W. Sturhahn [24] and DOS by A. I. Chumakov [23]. Bothpackages are available from the authors.
5.3 Experimental Aspects
In contrast to other methods like inelastic neutron, X-ray, and Raman scat-tering, inelastic nuclear resonant scattering gives direct access to the phonondensity of states. The rapid development of this technique since 1995 becamepossible due to several distinct advantages [27]. Due to the resonant nature ofthe interaction the count rate of inelastic nuclear scattering is large enoughto perform a complete measurement in a few hours. The combination of thelarge scattering cross-section and the small size of the synchrotron radiationbeams allows one to use tiny samples like ultrathin films and nanoparticlesand materials that are available only in small quantities. The experimentalaspects of this method have been described in a comprehensive review byChumakov & Sturhahn [27]. In the following we summarize a few selectedaspects that are relevant for most experiments.
5.3.1 Lamb-Mossbauer Factor and Multiphonon Excitations
The Lamb-Mossbauer factor, also called f-factor or recoilless fraction, deter-mines the fraction of recoilless events in nuclear resonant scattering. It wasshown in the previous section that it can be directly derived from the mea-sured data via (5.13). On the other hand, it is related to the phonon densityof states via [1]:
190 5 Inelastic Nuclear Resonant Scattering
fLM = exp
−ER
∞∫
0
D(E)E
1 + e−E/kBT
1 − e−E/kBTdE
. (5.24)
This allows one to check the derivation of the phonon DOS for consistencywith the Lamb-Mossbauer factor. Inspection of the above equation revealsthat in the low-temperature limit the integrand in the exponential is weightedby 1/E and by 1/E2 in the high-temperature limit. This shows that theLamb-Mossbauer factor is determined mainly by the low-energy part of thephonon DOS, that can be described for most solids by the Debye-model.Thus, the Lamb-Mossbauer factor is only sensitive to the phonon DOS if thespectrum of low-energy excitations undergoes changes.
The Lamb-Mossbauer factor can be used to estimate the relative contribu-tion of multi-phonon excitations. The relative contribution of the n-phononterm is given by
∫Sn(E) dE =
(− ln fLM )n
n!. (5.25)
Thus, if the Lamb-Mossbauer factor is close to 1, only a few multiphononcontributions are significant, as shown for bcc Fe in Fig. 5.4a. In this case theexpansion in (5.7) converges rapidly. If the Lamb-Mossbauer factor is small,e.g., at high transition energies or weakly bound nuclei, many multiphononterms contribute and the separation between them is difficult. In such casesthe extraction of the phonon DOS becomes difficult, as it is the case forbiomolecules [28] or β-Sn [15, 29], for example.
5.3.2 Temperature Dependence and Anharmonicity
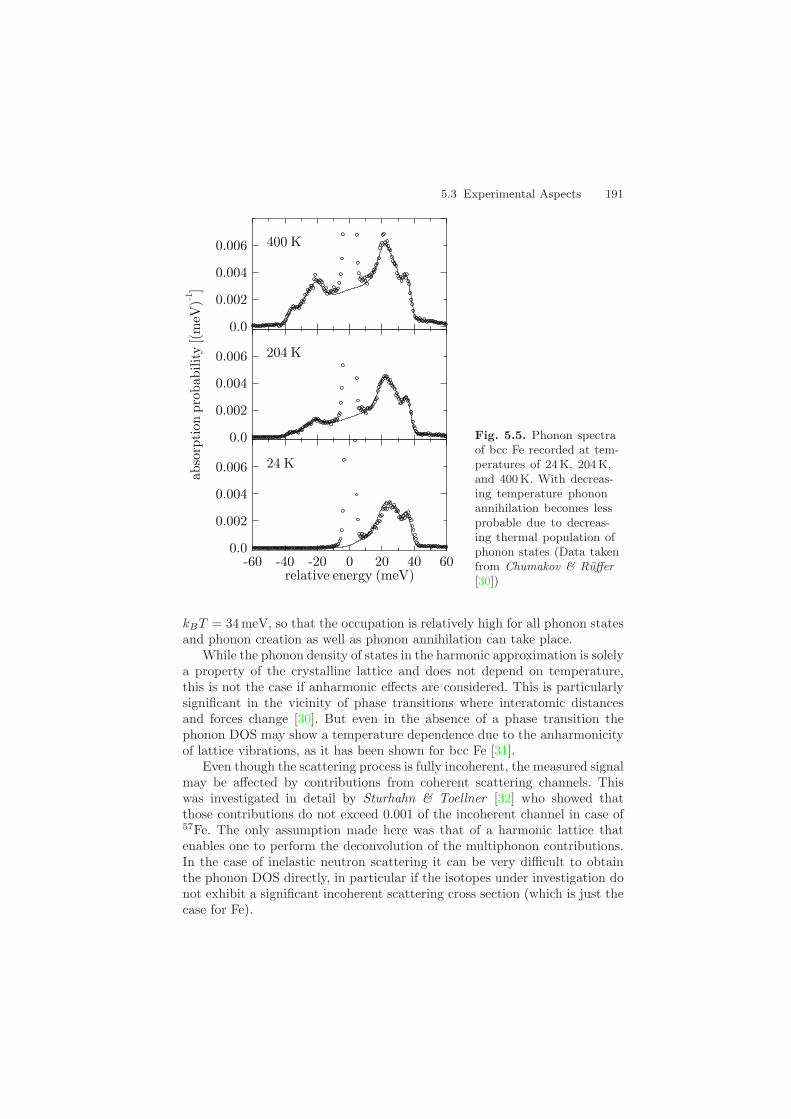
The phonon spectra recorded via nuclear inelastic absorption show a pro-nounced temperature dependence that is determined by the thermal occu-pation of phonon states. This is shown for bcc Fe in Fig. 5.5. The ratiobetween the absorption probability with energy gain and energy loss is de-termined by the detailed balance7, see (5.22). Because the recoil may excitephonons even at the lowest temperatures, inelastic absorption with energyloss is possible at all temperatures. Inelastic absorption with energy gain,on the other hand, depends on the occupation number of thermally excitedphonons. At T = 24 K the thermal energy is only 2 meV, so that phononstates with higher energies have a very low occupation and practically onlyphonon creation takes place. Therefore inelastic absorption on the low-energyside of the spectrum is almost impossible. At T = 400 K the energy spectrumof inelastic absorption is much less asymmetric because the thermal energy7 This is essentially a consequence of time-reversal invariance of the scattering
process. In circumstances where this is not fulfilled, e.g., for spinwave excitations,the detailed balance does not hold.
5.3 Experimental Aspects 191
Fig. 5.5. Phonon spectraof bcc Fe recorded at tem-peratures of 24 K, 204 K,and 400K. With decreas-ing temperature phononannihilation becomes lessprobable due to decreas-ing thermal population ofphonon states (Data takenfrom Chumakov & Ruffer[30])
kBT = 34 meV, so that the occupation is relatively high for all phonon statesand phonon creation as well as phonon annihilation can take place.
While the phonon density of states in the harmonic approximation is solelya property of the crystalline lattice and does not depend on temperature,this is not the case if anharmonic effects are considered. This is particularlysignificant in the vicinity of phase transitions where interatomic distancesand forces change [30]. But even in the absence of a phase transition thephonon DOS may show a temperature dependence due to the anharmonicityof lattice vibrations, as it has been shown for bcc Fe [31].
Even though the scattering process is fully incoherent, the measured signalmay be affected by contributions from coherent scattering channels. Thiswas investigated in detail by Sturhahn & Toellner [32] who showed thatthose contributions do not exceed 0.001 of the incoherent channel in case of57Fe. The only assumption made here was that of a harmonic lattice thatenables one to perform the deconvolution of the multiphonon contributions.In the case of inelastic neutron scattering it can be very difficult to obtainthe phonon DOS directly, in particular if the isotopes under investigation donot exhibit a significant incoherent scattering cross section (which is just thecase for Fe).
192 5 Inelastic Nuclear Resonant Scattering
5.3.3 Thermodynamic Quantities
Once D(E) has been determined for a particular material, a number of ther-modynamic quantities can be derived. As a first example we consider thephonon contribution to the lattice specific heat. The contribution of latticeexcitations to the internal energy is given by
U = N
∫E n(E)D(E) dE , (5.26)
where N is the number of particles and n(E) = 1/(eE/kBT − 1) is the Boseoccupation number. From this expression the lattice specific heat followsimmediately:
cv(T ) =dU
dT=
N
kBT 2
∞∫
0
E2 eE/kBT n(E)2 D(E) dE . (5.27)
It is the virtue of this technique to be sensitive to very small amounts ofmaterial as in thin films and nanostructures. This allows one to investigatethermodynamic quantities on microscopic length scales, thus allowing studyof, for example, dissipation phenomena in confined systems. The high isotopicspecifity may be used to enhance the spatial resolution to the atomic levelby selectively doping the system with monolayers of the resonant isotope.
Another important thermodynamic quantity derived from the PDOS isthe vibrational entropy:
Svib(T ) = R
∞∫
0
D(E) [E n(E)/kBT + ln(1 + n(E))] dE . (5.28)
Recent experiments indicate that the relative stability of the ordered andthe disordered states of a compound may be significantly affected by theirdifference in vibrational entropy [33]. Thus, changes in vibrational entropycan be important for the thermodynamics of solid-state phase transitions [34]or diffusion and nucleation on surfaces [35].
It should be noted that the quantities in (5.27) and (5.28) give only thecontributions of the resonant atoms. This may not be representative for thethermodynamic behavior of the material. Thus, the experimental data have tobe complemented by data from other methods and calculations. Nevertheless,the vibrational entropies derived from the VDOS have been successfully usedto explain order-disorder effects in Fe alloys [33, 36].
5.4 Vibrational Properties of Thin Filmsand Nanostructures
A multitude of studies on the vibrational properties of semiconductor su-perlattices and nanostructures has been reported [37]. Several novel effects
5.4 Vibrational Properties of Thin Films and Nanostructures 193
have been observed that are induced by the broken translational symmetryof these systems [38]:
– Phonon FoldingFolding of acoustical phonon dispersion relations into the first Brillouin
zone due to the superlattice periodicity.– Phonon Confinement
Quantization of optical phonons due to restriction of the propagation tocertain layers.
– Interface PhononsVibrational states arising at the interface between different materials.
For metallic layer systems, however, only a few investigations about phononfolding [39] or phonon confinement [40] have been reported. The reason is thatmost elemental metals are not Raman active or only weakly so. Therefore it ishighly desirable to develop characterization methods that are more suitablefor metallic systems.
The investigation of collective excitations in reduced dimensions by meansof advanced x-ray scattering techniques will be an important field in materialsscience in the future. With further progress in deposition and structuringtechniques, the variety of materials as well as their complexity will rapidlyincrease. Such systems will exhibit large deviations from bulk behavior. Thosedeviations either limit the desired properties of new materials or they formthe basis for a new functionality. A few key areas shall be identified here:
– Thermal Transport in MicrostructuresIn a confined geometry the vibrational spectrum is altered if the filmthickness or the multilayer period is comparable to the phonon mean freepath. This leads to novel features like phonon zone-folding in periodiclayer structures and phonon confinement due to the restriction of phononpropagation to certain layers [38]. Such size effects on the vibrationalproperties will be of particular technical relevance for the thermal prop-erties of thin films that are part of micromechanic and microelectronicdevices [41]. Properties like thermal conductivity become more and morecritical with increasing power level and decreasing time scales of electronicand mechanical processes in those devices.
– Nanoscale TribologyThe microscopic origin of friction is a subject of intense research presently[42, 43]. It became clear that frictional behavior is not only determined bystructural properties like surface roughness, but is also influenced by dy-namical properties: The density of vibrational states (VDOS) at a certainfrequency determines how much energy can be dissipated in that partic-ular mode. The design of solids, (e.g., nanostructured materials) with agap in the VDOS over a critical region of frequencies could prevent en-ergy losses through friction. Since these processes are naturally located at
194 5 Inelastic Nuclear Resonant Scattering
buried interfaces, inelastic x-ray spectroscopy with its great penetrationpower and high surface sensitivity is the ideal tool for this purpose.
– Smart Materials Based on Lattice Instabilities‘Smart Materials’ rely on structural phase transitions, which allow the ma-terial to modify the domain structure or the band structure to respond toexternal parameters like temperature, pressure, electric or magnetic fields[44]. The underlying physics of these phase transitions is intimately relatedto lattice instabilities with soft phonon modes. In the future new mate-rials with a transformation behavior based on strongly modified phonondispersion relations will emerge. Particular examples are ferroelastic andmartensitic transformations as the origin of the shape-memory effect.These phenomena are frequently employed in sensor/actuator systems.It will be important to determine how the confined geometry of thin filmsand microstructures affects the fundamental properties of such devices.
This list indicates that tuning or even tailoring of phononic spectra to specificpurposes will be of increasing importance in the future, and a field of ‘phononengineering’ can be envisaged with many similarities to the common ‘bandgap engineering’ of electronic properties. However, a full tunability of theseproperties will be possible only with a thorough understanding of the un-derlying processes. The increasing miniaturization of structures requires thefurther development of existing spectroscopic techniques or the developmentof new, particularly suited techniques. The measurement of vibrational prop-erties of thin films is conceptually difficult because neither inelastic neutronscattering nor inelastic x-ray scattering are feasible for such small amounts ofmaterial. On the other hand, energy-loss spectroscopy with electrons or Heatoms [45] or point-contact methods [46] may be too surface sensitive. There-fore, inelastic scattering of infrared or visible light accounts for the largestfraction of spectroscopic data on vibrational excitations in thin films [47].However, the limited momentum transfer usually prohibits the determina-tion of the full vibrational density of states.
5.4.1 Phonon Damping in Thin Films of Fe
In this experiment, inelastic nuclear resonant scattering is applied to deter-mine the vibrational density of states of thin 57Fe films. The aim is to identifyeffects of the confined geometry on the vibrational spectrum [48]. To enhancethe inelastic signal, the films are illuminated in grazing incidence geometry,preferably under conditions where a waveguide mode inside the film can beexcited. The measured yield I(E) of delayed fluorescence photons is thenproportional to the average intensity of the radiation field inside the film ofthickness d. This can be expressed by an extension of (5.6) as follows:
5.4 Vibrational Properties of Thin Films and Nanostructures 195
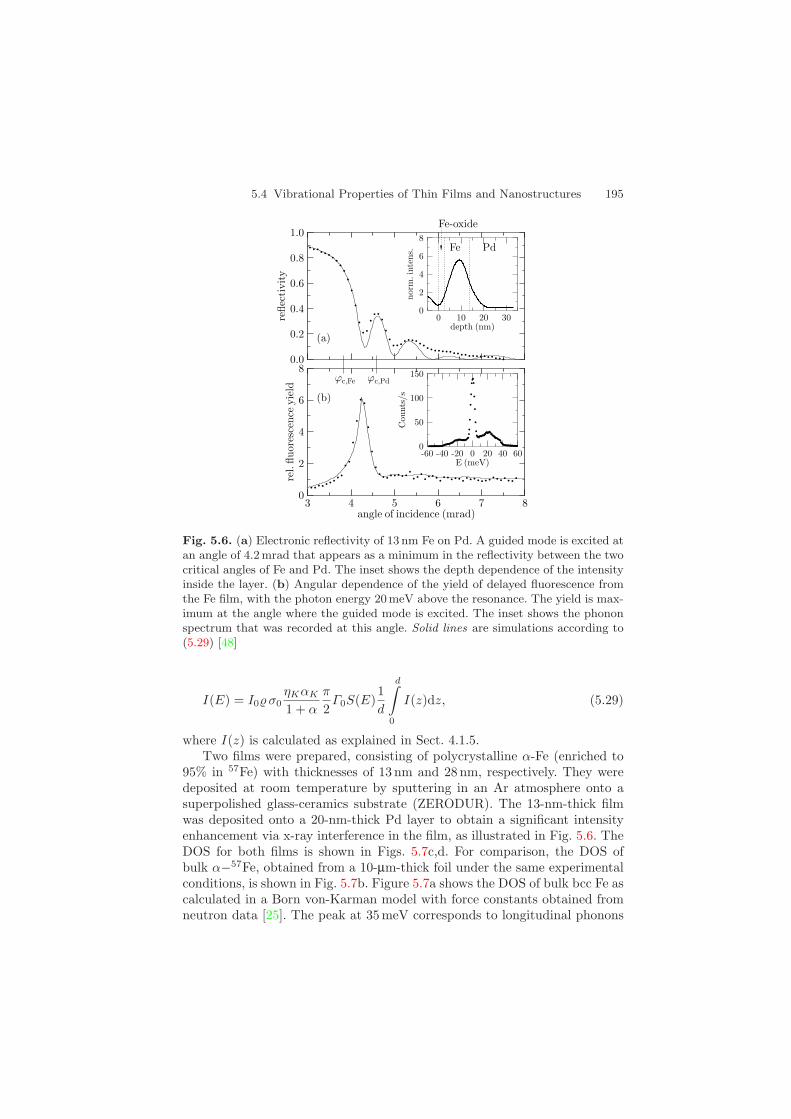
Fig. 5.6. (a) Electronic reflectivity of 13 nm Fe on Pd. A guided mode is excited atan angle of 4.2 mrad that appears as a minimum in the reflectivity between the twocritical angles of Fe and Pd. The inset shows the depth dependence of the intensityinside the layer. (b) Angular dependence of the yield of delayed fluorescence fromthe Fe film, with the photon energy 20meV above the resonance. The yield is max-imum at the angle where the guided mode is excited. The inset shows the phononspectrum that was recorded at this angle. Solid lines are simulations according to(5.29) [48]
I(E) = I0 σ0ηKαK
1 + α
π
2Γ0S(E)
1d
d∫
0
I(z)dz, (5.29)
where I(z) is calculated as explained in Sect. 4.1.5.Two films were prepared, consisting of polycrystalline α-Fe (enriched to
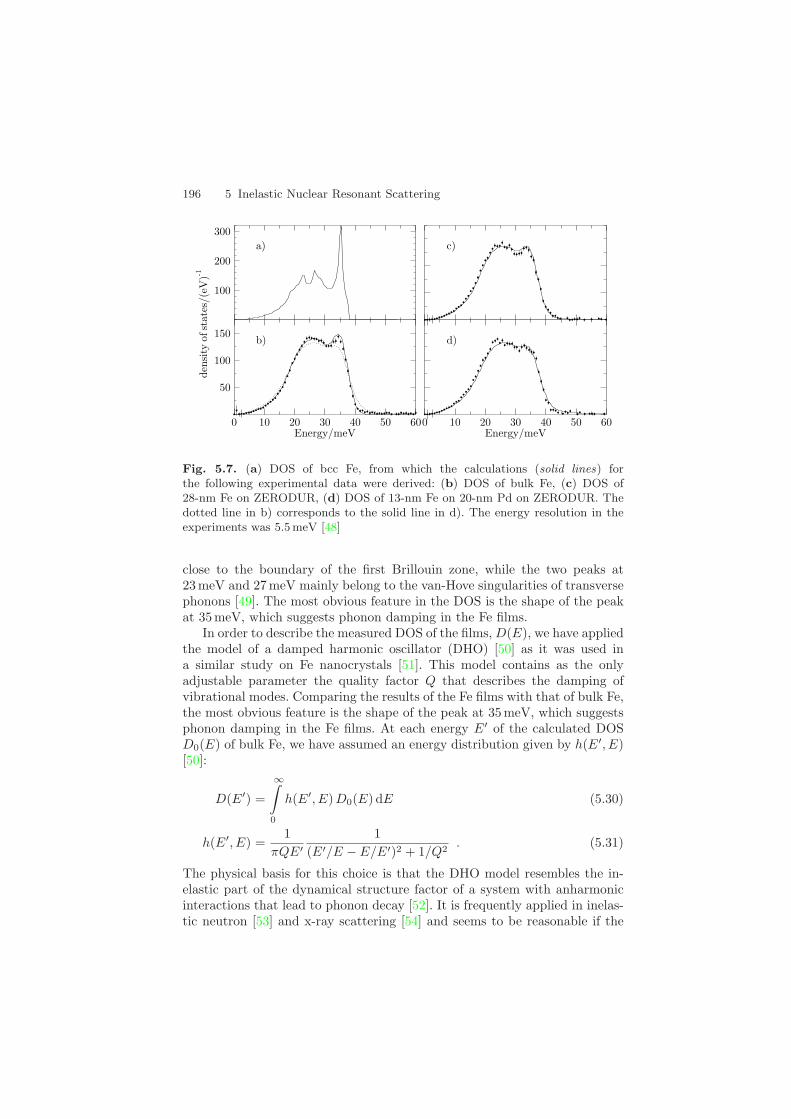
95% in 57Fe) with thicknesses of 13 nm and 28 nm, respectively. They weredeposited at room temperature by sputtering in an Ar atmosphere onto asuperpolished glass-ceramics substrate (ZERODUR). The 13-nm-thick filmwas deposited onto a 20-nm-thick Pd layer to obtain a significant intensityenhancement via x-ray interference in the film, as illustrated in Fig. 5.6. TheDOS for both films is shown in Figs. 5.7c,d. For comparison, the DOS ofbulk α−57Fe, obtained from a 10-µm-thick foil under the same experimentalconditions, is shown in Fig. 5.7b. Figure 5.7a shows the DOS of bulk bcc Fe ascalculated in a Born von-Karman model with force constants obtained fromneutron data [25]. The peak at 35 meV corresponds to longitudinal phonons
196 5 Inelastic Nuclear Resonant Scattering
Fig. 5.7. (a) DOS of bcc Fe, from which the calculations (solid lines) forthe following experimental data were derived: (b) DOS of bulk Fe, (c) DOS of28-nm Fe on ZERODUR, (d) DOS of 13-nm Fe on 20-nm Pd on ZERODUR. Thedotted line in b) corresponds to the solid line in d). The energy resolution in theexperiments was 5.5 meV [48]
close to the boundary of the first Brillouin zone, while the two peaks at23 meV and 27 meV mainly belong to the van-Hove singularities of transversephonons [49]. The most obvious feature in the DOS is the shape of the peakat 35 meV, which suggests phonon damping in the Fe films.
In order to describe the measured DOS of the films, D(E), we have appliedthe model of a damped harmonic oscillator (DHO) [50] as it was used ina similar study on Fe nanocrystals [51]. This model contains as the onlyadjustable parameter the quality factor Q that describes the damping ofvibrational modes. Comparing the results of the Fe films with that of bulk Fe,the most obvious feature is the shape of the peak at 35 meV, which suggestsphonon damping in the Fe films. At each energy E′ of the calculated DOSD0(E) of bulk Fe, we have assumed an energy distribution given by h(E′, E)[50]:
D(E′) =
∞∫
0
h(E′, E)D0(E) dE (5.30)
h(E′, E) =1
πQE′1
(E′/E − E/E′)2 + 1/Q2. (5.31)
The physical basis for this choice is that the DHO model resembles the in-elastic part of the dynamical structure factor of a system with anharmonicinteractions that lead to phonon decay [52]. It is frequently applied in inelas-tic neutron [53] and x-ray scattering [54] and seems to be reasonable if the
5.4 Vibrational Properties of Thin Films and Nanostructures 197
damping is not too large. In the evaluations presented here, the quality factorQ was the only parameter used to fit the data.
The DOS of the 28-nm-thick Fe film shown in Fig. 5.7c was describedwith Q = 25(2), while for the 13-nm-thick Fe film a value of Q = 13(1) wasobtained [48]. For a direct comparison with bulk bcc Fe, the calculated DOSof the 13-nm Fe film is drawn as dotted line in Fig. 5.7b. The discrepanciesbetween both calculated DOS reveal the features that are introduced by thedamping: The high-energy tail is smeared out over a wide range of energies,the peaks due to the van-Hove singularities are smoothened, and there is aslight increase of the DOS at low energies, caused by the long tails of theDHO function.
In spite of the good agreement, there remains an excess in the measuredDOS over the calculated curve at low energies. Low-energy excitations areoften linked to vibrational states in regions with low density or a high degreeof disorder. A strong excess of such modes compared to bulk Fe has beenobserved in nanocrystalline Fe with an average particle size of 10 nm, wherea large fraction of the Fe is close to or within surface oxide layers [51]. For theFe films, the excess at low energies is considerably smaller, probably becausethe relative contribution from surface and interface regions is small: In caseof the 28-nm film, the thickness of the surface oxide layer is small comparedto the total thickness; in case of the 13-nm film on Pd, the electromagneticfield intensity peaks inside the Fe layer with a relatively small intensity atthe interfaces. This is supported by the observation that the DOS of the Fefilms does not show modes above 50 meV, which reflects the response of theFe atoms to high-energy vibrations of oxygen atoms in surface oxides [51].
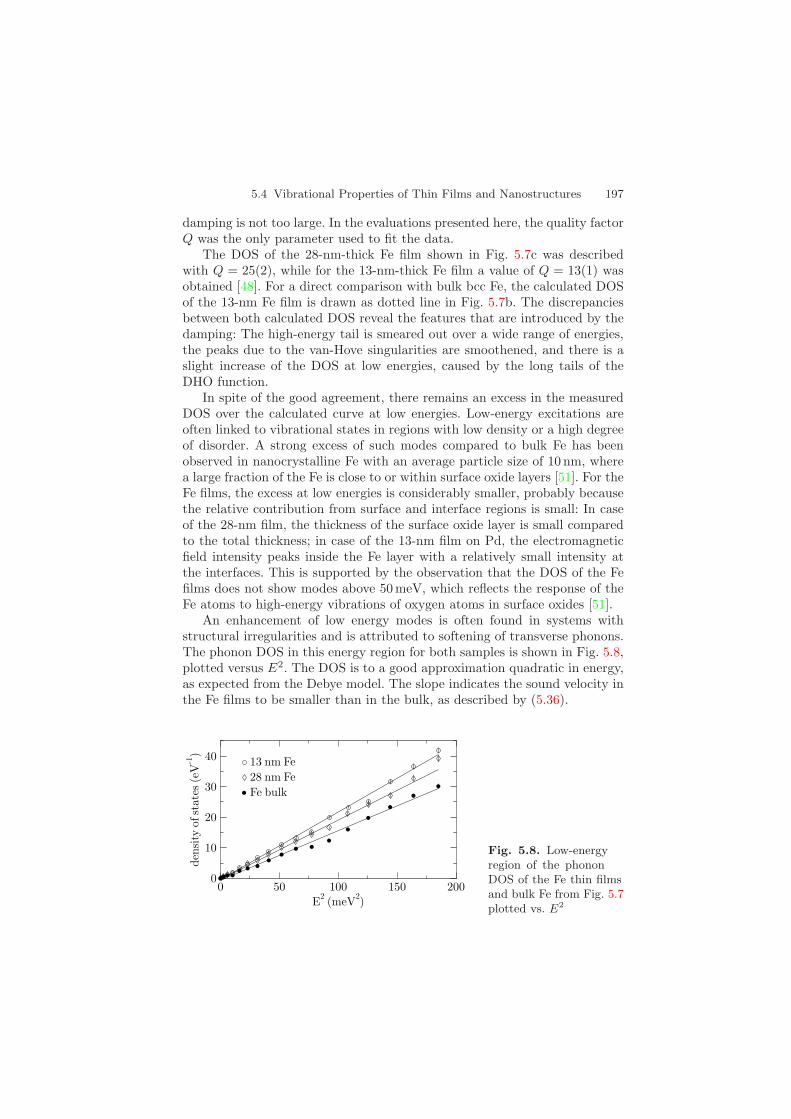
An enhancement of low energy modes is often found in systems withstructural irregularities and is attributed to softening of transverse phonons.The phonon DOS in this energy region for both samples is shown in Fig. 5.8,plotted versus E2. The DOS is to a good approximation quadratic in energy,as expected from the Debye model. The slope indicates the sound velocity inthe Fe films to be smaller than in the bulk, as described by (5.36).
Fig. 5.8. Low-energyregion of the phononDOS of the Fe thin filmsand bulk Fe from Fig. 5.7plotted vs. E2
198 5 Inelastic Nuclear Resonant Scattering
The observed differences in the Q values for both films are most likelyrelated to the layer thickness d. Taken as the phonon mean free path, thelayer thickness then limits the phonon lifetime in the films. Since the aver-age crystallite size in polycrystalline thin films is in the same range as thelayer thickness, this consideration holds also for in-plane phonons scatteredat grain boundaries. Stresses originating at the layer boundaries, especiallyfrom the surface oxide, may propagate into the layer and give rise to addi-tional scattering processes that shorten the phonon lifetime even more. Itshould also be noted that in Pd metal there are no phonon modes above29 meV [49], resulting in a strong confinement of the high-energy modes inthe Fe film on Pd.
Although the microscopic origin for the damping could not be discernedhere, it is a remarkable fact that the DOS of two different films can be de-scribed within the same model with a single parameter. Remaining discrep-ancies may be due to extra soft modes and slightly different damping oftransverse and longitudinal modes. The measurement of the effective phonondamping may be applied, e.g., to estimate the thermal resistivity of thin filmsin novel microstructures [41].
5.4.2 Vibrational Modes in Nanoparticles
The vibrational properties of clusters, nanoparticles, and nanocrystalline areof considerable interest because remarkable deviations from bulk behaviorhave been found [37]. These properties are of great importance for the under-standing of thermodynamic properties like thermal expansion, heat capac-ity, thermal conductivity and vibrational entropy. An important ingredientfor the determination of these quantities is the vibrational density of states(VDOS). The VDOS of metallic nanostructures has been measured by inelas-tic neutron scattering [55, 56, 57, 58, 59, 60] and inelastic nuclear resonantscattering [51, 61, 62]. In addition, computer simulations have been performedto calculate the VDOS of nanocrystalline materials [63, 64, 65, 66]. The exper-iments and the simulations reveal that the VDOS of nanocrystalline materialsexhibits an excess of low- and high-energy modes that are not observed inthe bulk or coarse-grained counterparts. These modes have been related tovibrations of atoms with reduced coordination and a modified local environ-ment. Systematic studies, however, of the nature of these modes are scarce.In the center of such studies will be the following questions: (i) how doesthe VDOS depend on the crystallite size and (ii) does the high fraction ofinterfaces and surfaces lead to a deviation of the low-energy VDOS from theDebye-behavior ? A systematic study in this field has been reported [62], asdescribed in the following.
Fe nanoparticles were produced by inert gas condensation (IGC) [67] ofFe evaporated from a tungsten crucible in He gas (purity 99.9999%) with apressure of 133 Pa. The IGC technique invariably leads to a certain oxida-tion of the nanoparticles due to reaction of iron with residual oxygen and
5.4 Vibrational Properties of Thin Films and Nanostructures 199
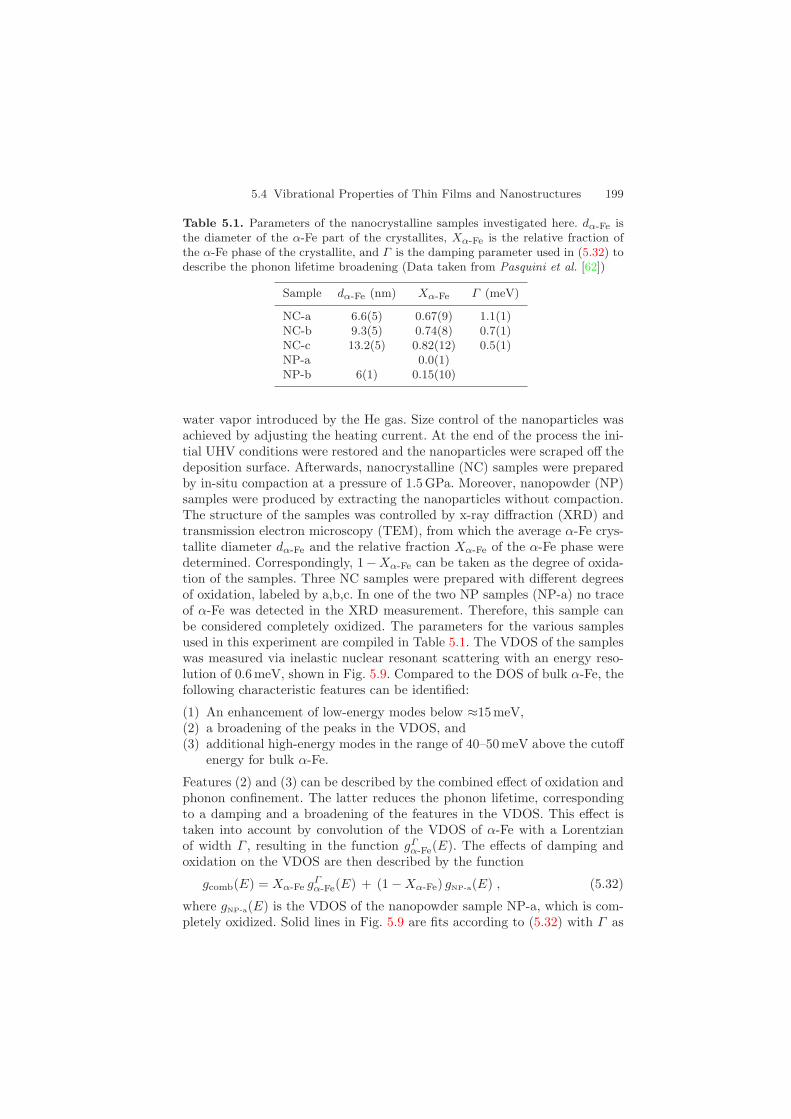
Table 5.1. Parameters of the nanocrystalline samples investigated here. dα-Fe isthe diameter of the α-Fe part of the crystallites, Xα-Fe is the relative fraction ofthe α-Fe phase of the crystallite, and Γ is the damping parameter used in (5.32) todescribe the phonon lifetime broadening (Data taken from Pasquini et al. [62])
Sample dα-Fe (nm) Xα-Fe Γ (meV)
NC-a 6.6(5) 0.67(9) 1.1(1)NC-b 9.3(5) 0.74(8) 0.7(1)NC-c 13.2(5) 0.82(12) 0.5(1)NP-a 0.0(1)NP-b 6(1) 0.15(10)
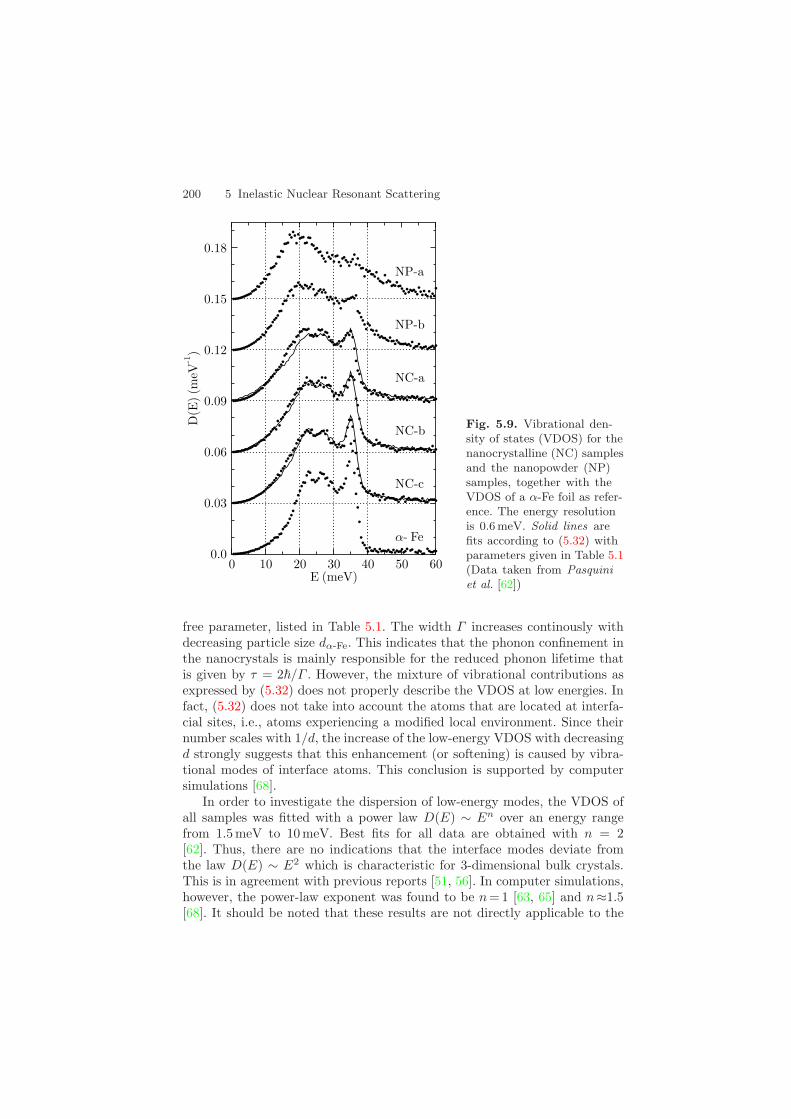
water vapor introduced by the He gas. Size control of the nanoparticles wasachieved by adjusting the heating current. At the end of the process the ini-tial UHV conditions were restored and the nanoparticles were scraped off thedeposition surface. Afterwards, nanocrystalline (NC) samples were preparedby in-situ compaction at a pressure of 1.5 GPa. Moreover, nanopowder (NP)samples were produced by extracting the nanoparticles without compaction.The structure of the samples was controlled by x-ray diffraction (XRD) andtransmission electron microscopy (TEM), from which the average α-Fe crys-tallite diameter dα-Fe and the relative fraction Xα-Fe of the α-Fe phase weredetermined. Correspondingly, 1−Xα-Fe can be taken as the degree of oxida-tion of the samples. Three NC samples were prepared with different degreesof oxidation, labeled by a,b,c. In one of the two NP samples (NP-a) no traceof α-Fe was detected in the XRD measurement. Therefore, this sample canbe considered completely oxidized. The parameters for the various samplesused in this experiment are compiled in Table 5.1. The VDOS of the sampleswas measured via inelastic nuclear resonant scattering with an energy reso-lution of 0.6 meV, shown in Fig. 5.9. Compared to the DOS of bulk α-Fe, thefollowing characteristic features can be identified:
(1) An enhancement of low-energy modes below ≈15 meV,(2) a broadening of the peaks in the VDOS, and(3) additional high-energy modes in the range of 40–50 meV above the cutoff
energy for bulk α-Fe.
Features (2) and (3) can be described by the combined effect of oxidation andphonon confinement. The latter reduces the phonon lifetime, correspondingto a damping and a broadening of the features in the VDOS. This effect istaken into account by convolution of the VDOS of α-Fe with a Lorentzianof width Γ , resulting in the function gΓ
α-Fe(E). The effects of damping andoxidation on the VDOS are then described by the function
gcomb(E) = Xα-Fe gΓα-Fe(E) + (1 − Xα-Fe) gNP-a(E) , (5.32)
where gNP-a(E) is the VDOS of the nanopowder sample NP-a, which is com-pletely oxidized. Solid lines in Fig. 5.9 are fits according to (5.32) with Γ as
200 5 Inelastic Nuclear Resonant Scattering
Fig. 5.9. Vibrational den-sity of states (VDOS) for thenanocrystalline (NC) samplesand the nanopowder (NP)samples, together with theVDOS of a α-Fe foil as refer-ence. The energy resolutionis 0.6 meV. Solid lines arefits according to (5.32) withparameters given in Table 5.1(Data taken from Pasquiniet al. [62])
free parameter, listed in Table 5.1. The width Γ increases continously withdecreasing particle size dα-Fe. This indicates that the phonon confinement inthe nanocrystals is mainly responsible for the reduced phonon lifetime thatis given by τ = 2/Γ . However, the mixture of vibrational contributions asexpressed by (5.32) does not properly describe the VDOS at low energies. Infact, (5.32) does not take into account the atoms that are located at interfa-cial sites, i.e., atoms experiencing a modified local environment. Since theirnumber scales with 1/d, the increase of the low-energy VDOS with decreasingd strongly suggests that this enhancement (or softening) is caused by vibra-tional modes of interface atoms. This conclusion is supported by computersimulations [68].
In order to investigate the dispersion of low-energy modes, the VDOS ofall samples was fitted with a power law D(E) ∼ En over an energy rangefrom 1.5 meV to 10 meV. Best fits for all data are obtained with n = 2[62]. Thus, there are no indications that the interface modes deviate fromthe law D(E) ∼ E2 which is characteristic for 3-dimensional bulk crystals.This is in agreement with previous reports [51, 56]. In computer simulations,however, the power-law exponent was found to be n= 1 [63, 65] and n≈1.5[68]. It should be noted that these results are not directly applicable to the
5.4 Vibrational Properties of Thin Films and Nanostructures 201
nanocrystalline samples investigated here, because these simulations wereassuming isolated nanoparticles with free surfaces.
The experiments have shown that the excess of low-energy vibrationalmodes in nanocrystalline systems result from interface vibrational modes andoxidation. The excess of high-energy modes, on the other hand, results fromoxidation only. Confinement of the phonons leads to a significant dampingof modes. Similar results have been found for thin Fe films, as it has beenshown in Sect. 5.4.1. In the case of Ag-capped single-crystalline Fe islands, asdiscussed in Sect. 5.4.3, oxidation effects can be excluded. Correspondingly,one finds extra vibrational modes only in the low-energy regime.
5.4.3 Phonons in Fe Islands on W(110)
While nanocrystalline materials typically exhibit a multitude of interfacialconfigurations, no such investigations have been reported so far on nanoscalesystems with well-defined interfacial structures. In the experiment describedhere we have investigated three-dimensional Ag-capped Fe islands on W(110)that have already been introduced in Sect. 4.4.4. These islands typically havea thickness of a few nm and a lateral extension of several hundred nm, asshown in Fig. 4.36.
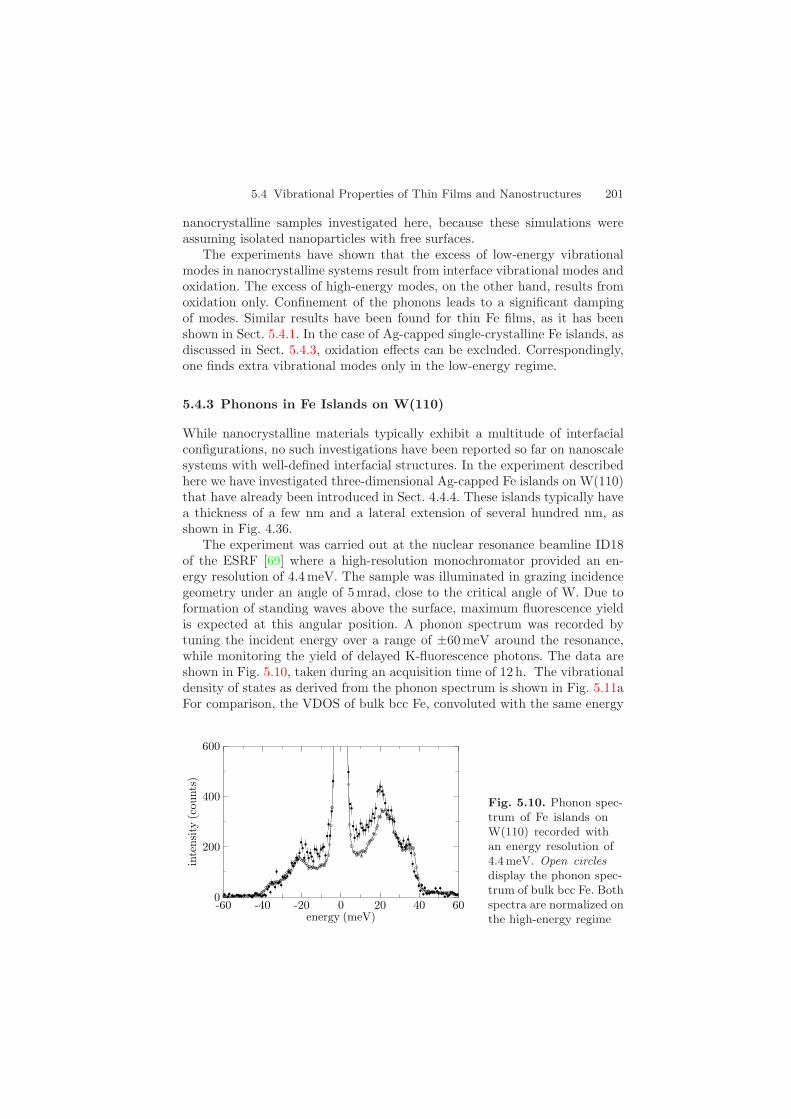
The experiment was carried out at the nuclear resonance beamline ID18of the ESRF [69] where a high-resolution monochromator provided an en-ergy resolution of 4.4 meV. The sample was illuminated in grazing incidencegeometry under an angle of 5 mrad, close to the critical angle of W. Due toformation of standing waves above the surface, maximum fluorescence yieldis expected at this angular position. A phonon spectrum was recorded bytuning the incident energy over a range of ±60 meV around the resonance,while monitoring the yield of delayed K-fluorescence photons. The data areshown in Fig. 5.10, taken during an acquisition time of 12 h. The vibrationaldensity of states as derived from the phonon spectrum is shown in Fig. 5.11aFor comparison, the VDOS of bulk bcc Fe, convoluted with the same energy
Fig. 5.10. Phonon spec-trum of Fe islands onW(110) recorded withan energy resolution of4.4 meV. Open circlesdisplay the phonon spec-trum of bulk bcc Fe. Bothspectra are normalized onthe high-energy regime
202 5 Inelastic Nuclear Resonant Scattering
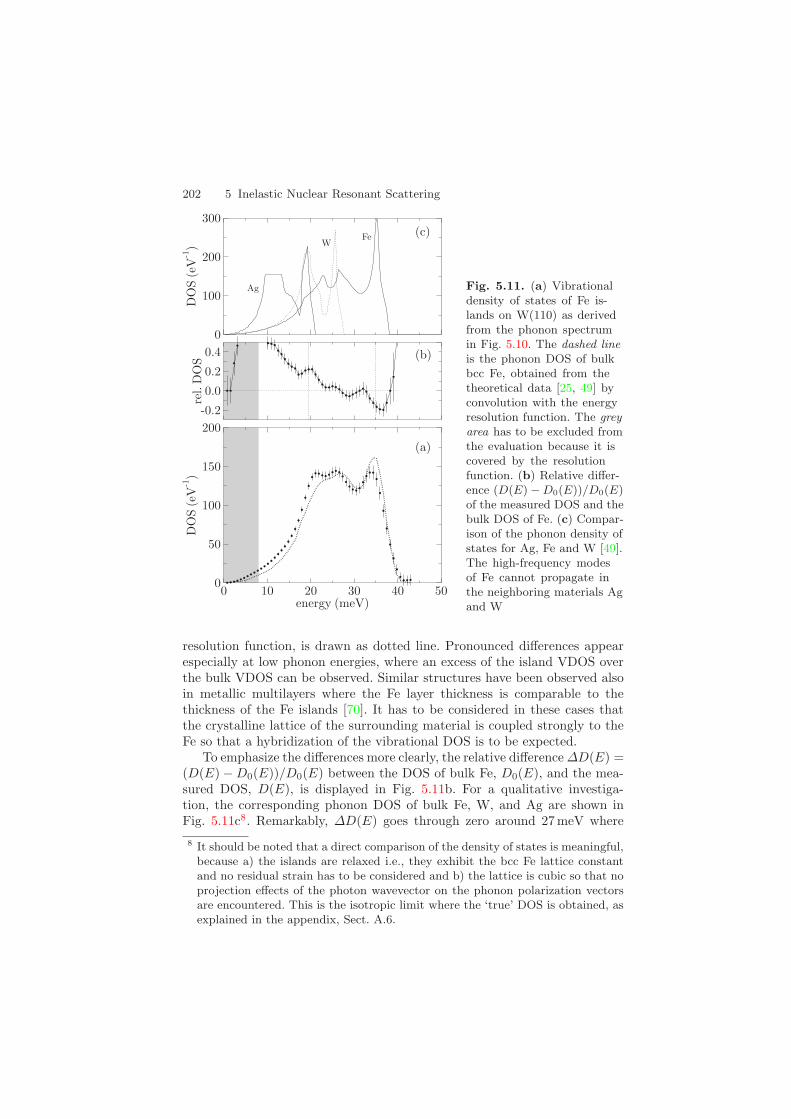
Fig. 5.11. (a) Vibrationaldensity of states of Fe is-lands on W(110) as derivedfrom the phonon spectrumin Fig. 5.10. The dashed lineis the phonon DOS of bulkbcc Fe, obtained from thetheoretical data [25, 49] byconvolution with the energyresolution function. The greyarea has to be excluded fromthe evaluation because it iscovered by the resolutionfunction. (b) Relative differ-ence (D(E) − D0(E))/D0(E)of the measured DOS and thebulk DOS of Fe. (c) Compar-ison of the phonon density ofstates for Ag, Fe and W [49].The high-frequency modesof Fe cannot propagate inthe neighboring materials Agand W
resolution function, is drawn as dotted line. Pronounced differences appearespecially at low phonon energies, where an excess of the island VDOS overthe bulk VDOS can be observed. Similar structures have been observed alsoin metallic multilayers where the Fe layer thickness is comparable to thethickness of the Fe islands [70]. It has to be considered in these cases thatthe crystalline lattice of the surrounding material is coupled strongly to theFe so that a hybridization of the vibrational DOS is to be expected.
To emphasize the differences more clearly, the relative difference ∆D(E) =(D(E) − D0(E))/D0(E) between the DOS of bulk Fe, D0(E), and the mea-sured DOS, D(E), is displayed in Fig. 5.11b. For a qualitative investiga-tion, the corresponding phonon DOS of bulk Fe, W, and Ag are shown inFig. 5.11c8. Remarkably, ∆D(E) goes through zero around 27 meV where
8 It should be noted that a direct comparison of the density of states is meaningful,because a) the islands are relaxed i.e., they exhibit the bcc Fe lattice constantand no residual strain has to be considered and b) the lattice is cubic so that noprojection effects of the photon wavevector on the phonon polarization vectorsare encountered. This is the isotropic limit where the ‘true’ DOS is obtained, asexplained in the appendix, Sect. A.6.
5.4 Vibrational Properties of Thin Films and Nanostructures 203
the DOS of W terminates. At energies above 27 meV the Fe phonons can-not propagate in the neighboring materials and are essentially confined tothe islands. Due to enhanced scattering at the boundaries and accompanyinganharmonic interactions the phonon lifetime is shortened, leading to lifetime-broadening and damping of the high-frequency Fe modes, so that ∆D(E) < 0.A similar behavior has been observed in thin films of Fe [48], as describedalready in Sect. 5.4.1. At low energies the DOS of W and Ag is larger thanthat of Fe, so that Fe vibrations can propagate freely into these materials. Itis quite remarkable that at energies around 19 meV, where the DOS of Agand W is strongly peaked, the DOS of the Fe islands is enhanced, too. Thissuggests a strong coupling of the lattices in this Ag/Fe/W sandwich struc-ture. In contrast to nanocrystalline Fe (see Sect. 5.4.2), an enhanced DOSat high energies is not observed for the Fe islands. In the nanocrystals thisis attributed partly to a shrinkage of the bond length and a correspondingincrease in the interatomic force constants [64]. Here, however, the Fe islandsexhibit the bulk bcc Fe lattice constant, so that no shrinkage effects are foundhere. The high-energy tail of the VDOS thus resembles quite closely that ofbcc Fe.
Although a quantitative treatment cannot be given at this stage, theseinvestigations open a way for an understanding of vibrational interactions innanostructured metallic systems. Further investigations with other substratematerials and capping layers should be performed to deepen this understand-ing. This could be a first step on the way to a controlled manipulation of vibra-tional properties (‘phonon engineering’), particularly in novel nanostructuredmaterials. While the system Fe on W is already an established model systemfor low-dimensional magnetism it also has a potential as a model system forthe lattice dynamics of nanostructures.
5.4.4 Vibrational Excitations in Amorphous FeTb Alloys
The dynamical properties of amorphous materials have attracted considerableattention because they show an anomalous behavior in the low-energy partof the vibrational spectrum [71, 72, 73, 74]. Of particular interest in this fieldis the so called boson peak [72], which appears in the vibrational density ofstates (VDOS), D(E), as an excess contribution with respect to the usualDebye behavior D(E) ∼ E2. Such a behaviour was observed, for example,by coherent inelastic neutron scattering on bulk samples of binary metallicglasses, such as a-Mg70Zn30 [75]. Typically, the amorphous state is metastableand can only be stabilized by rapid quenching. Common techniques are melt-spinning, splat-cooling or condensation from the vapor phase, as it occurs,e.g., during the deposition of thin films. This is the case for FexTb1−x alloys,which can be prepared over a wide composition range by vapor quenching.In this experiment, FeTb alloys in the thickness range between 175 A and800 A were found to be metastable at room temperature in the regime 0.20 <x < 0.82.
204 5 Inelastic Nuclear Resonant Scattering
All a-FexTb1−x alloy thin films were prepared in ultrahigh vacuum (basepressure ∼ 5×10⁻¹⁰ mbar) by thermal co-evaporation of Tb metal and metal-lic Fe (enriched to 95.5% in 57Fe) from two independently controlled Knudsencells [76]. The pressure during evaporation was below 1 × 10⁻¹⁰ mbar. Thedesired alloy composition was adjusted by selecting the corresponding ratioof the Tb and 57Fe deposition rates. All alloy compositions given here arethe nominal compositions as determined from the ratio of the two depositionrates with an error of ± 0.01. The films were grown at 300 K on oxidizedSi(001) wafers that were initially coated by a 200 A thick polycrystalline Ptbuffer layer in order to exploit the formation of x-ray standing waves for in-tensity enhancement [48]. All samples were coated with a 50 – 100 A thick Silayer for protection against oxidation. The structure of the samples was char-acterized by x-ray diffraction (XRD) and 57Fe conversion electron Mossbauerspectroscopy (CEMS).
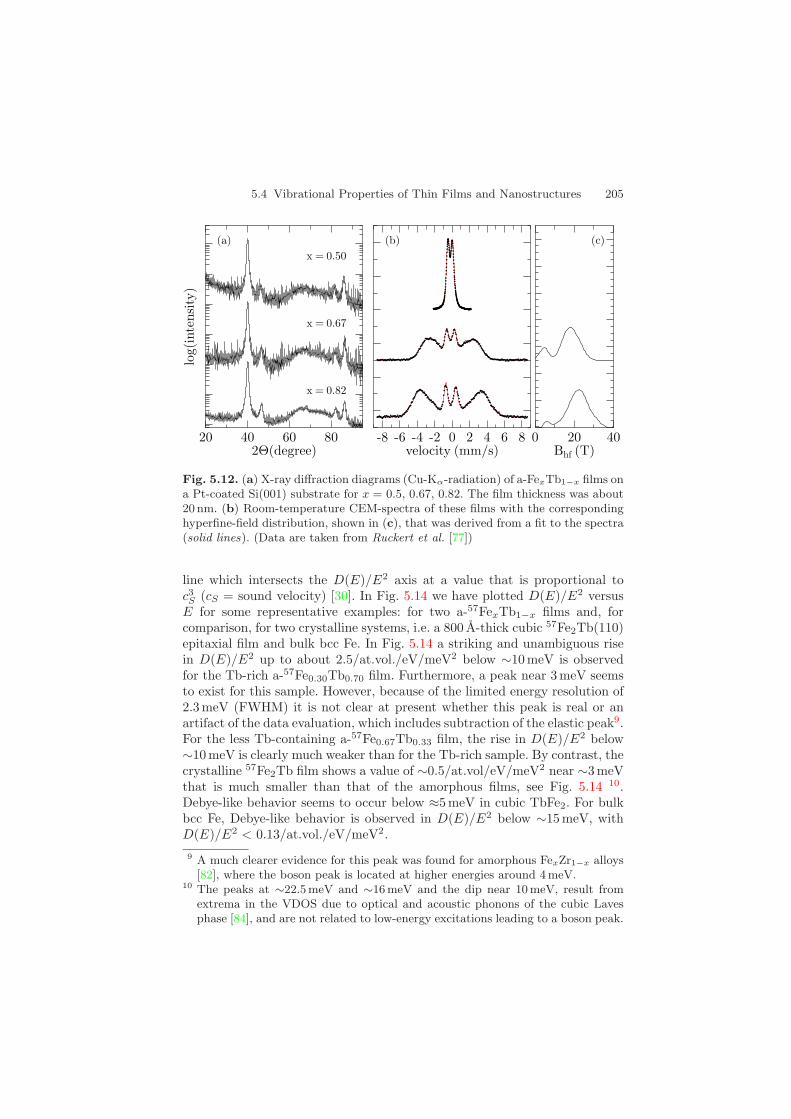
Some typical XRD diagrams are shown in Fig. 5.12a, where only Braggpeaks of the 200 A thick polycrystalline Pt buffer layer are present. The ab-sence of Bragg reflections from hcp-Tb or intermetallic Tb-Fe compoundsconfirms the amorphous structure of the FexTb1−x thin films. Typical CEMspectra of a-FexTb1−x films are shown in Fig. 5.12b. Also these spectra con-firm the amorphous structure, as evidenced by the broad hyperfine field dis-tribution that is necessary to fit the data (solid lines). From the relativeline intensities one deduces that the average Fe spin direction is preferen-tially perpendicular to the film plane. This is in agreement with earlier re-ports [76, 78, 79]. Moreover, a-FexTb1−x films with x < 0.50 are paramag-netic at room temperature, as indicated by the quadrupole split spectrum inFig. 5.12b. This hyperfine structure results from a a distribution of electricquadrupole splittings which is a typical feature of nonmagnetic amorphousbinary Fe alloys [80, 81].
Vibrational spectra of the films were recorded at the undulator beamline3-ID at the Advanced Photon Source with an energy resolution of 2.3 meV,shown in Fig. 5.13a. The incident beam illuminated the films under a grazingangle of about 4 mrad. Data acquisition times were 2–10 h per spectrum,depending on film thickness and Fe content.
The partial VDOS as deduced from the measured vibrational spectra isshown in Fig. 5.13b for FexTb1−x films of different composition. The VDOSrepresents a structureless broad peak, as anticipated for such structurally andatomically disordered materials, where van Hove singularities are smearedout. There is a tendency that the maximum energy of the VDOS in Fig. 5.13bshifts to lower energies with decreasing Fe content x of the amorphous films,i.e., the Fe vibrations soften with decreasing x. The low-energy modes inD(E) below 10 meV in Fig. 5.13b are of particular interest because of theboson-peak phenomenon [71, 73, 74]. The usual way to observe a deviationfrom Debye-like behavior is to plot the reduced VDOS, D(E)/E2, versus E.In this representation, strict Debye-like behavior is reflected by a horizontal
5.4 Vibrational Properties of Thin Films and Nanostructures 205
Fig. 5.12. (a) X-ray diffraction diagrams (Cu-Kα-radiation) of a-FexTb1−x films ona Pt-coated Si(001) substrate for x = 0.5, 0.67, 0.82. The film thickness was about20 nm. (b) Room-temperature CEM-spectra of these films with the correspondinghyperfine-field distribution, shown in (c), that was derived from a fit to the spectra(solid lines). (Data are taken from Ruckert et al. [77])
line which intersects the D(E)/E2 axis at a value that is proportional toc3S (cS = sound velocity) [30]. In Fig. 5.14 we have plotted D(E)/E2 versus
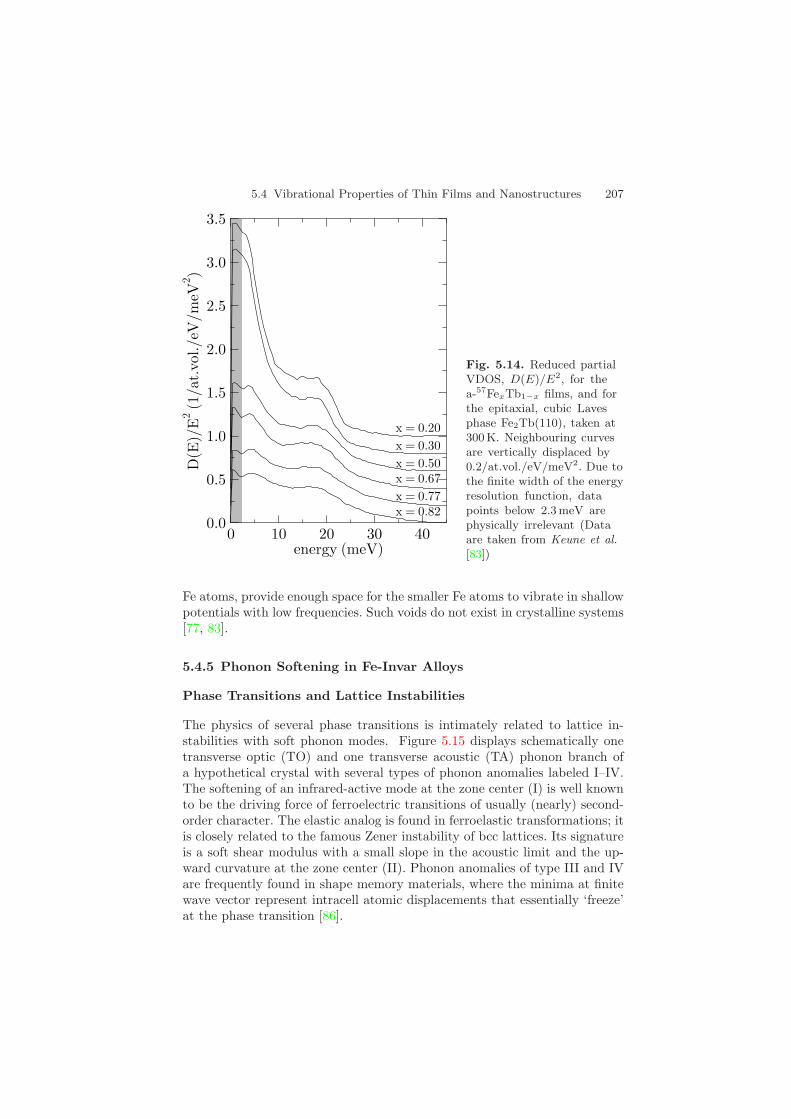
E for some representative examples: for two a-57FexTb1−x films and, forcomparison, for two crystalline systems, i.e. a 800 A-thick cubic 57Fe2Tb(110)epitaxial film and bulk bcc Fe. In Fig. 5.14 a striking and unambiguous risein D(E)/E2 up to about 2.5/at.vol./eV/meV2 below ∼10 meV is observedfor the Tb-rich a-57Fe0.30Tb0.70 film. Furthermore, a peak near 3 meV seemsto exist for this sample. However, because of the limited energy resolution of2.3 meV (FWHM) it is not clear at present whether this peak is real or anartifact of the data evaluation, which includes subtraction of the elastic peak9.For the less Tb-containing a-57Fe0.67Tb0.33 film, the rise in D(E)/E2 below∼10 meV is clearly much weaker than for the Tb-rich sample. By contrast, thecrystalline 57Fe2Tb film shows a value of ∼0.5/at.vol/eV/meV2 near ∼3 meVthat is much smaller than that of the amorphous films, see Fig. 5.14 10.Debye-like behavior seems to occur below ≈5 meV in cubic TbFe2. For bulkbcc Fe, Debye-like behavior is observed in D(E)/E2 below ∼15 meV, withD(E)/E2 < 0.13/at.vol./eV/meV2.
9 A much clearer evidence for this peak was found for amorphous FexZr1−x alloys[82], where the boson peak is located at higher energies around 4 meV.
10 The peaks at ∼22.5 meV and ∼16 meV and the dip near 10 meV, result fromextrema in the VDOS due to optical and acoustic phonons of the cubic Lavesphase [84], and are not related to low-energy excitations leading to a boson peak.
206 5 Inelastic Nuclear Resonant Scattering
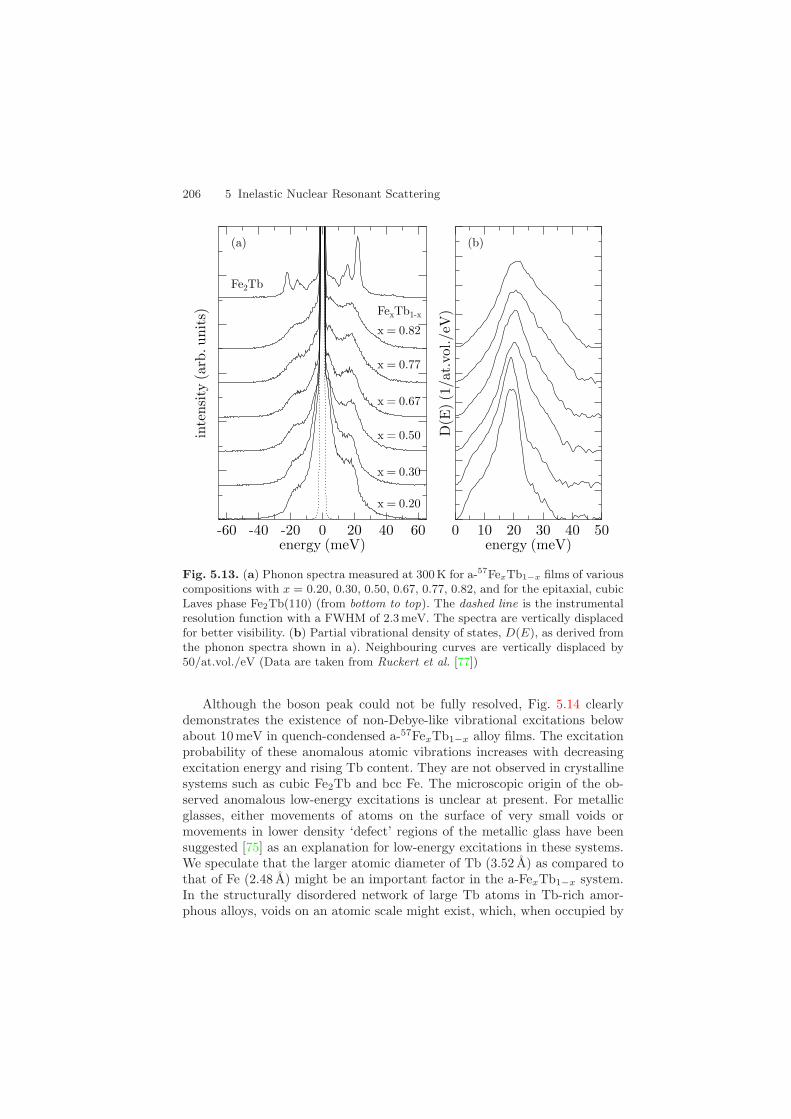
Fig. 5.13. (a) Phonon spectra measured at 300K for a-57FexTb1−x films of variouscompositions with x = 0.20, 0.30, 0.50, 0.67, 0.77, 0.82, and for the epitaxial, cubicLaves phase Fe2Tb(110) (from bottom to top). The dashed line is the instrumentalresolution function with a FWHM of 2.3 meV. The spectra are vertically displacedfor better visibility. (b) Partial vibrational density of states, D(E), as derived fromthe phonon spectra shown in a). Neighbouring curves are vertically displaced by50/at.vol./eV (Data are taken from Ruckert et al. [77])
Although the boson peak could not be fully resolved, Fig. 5.14 clearlydemonstrates the existence of non-Debye-like vibrational excitations belowabout 10 meV in quench-condensed a-57FexTb1−x alloy films. The excitationprobability of these anomalous atomic vibrations increases with decreasingexcitation energy and rising Tb content. They are not observed in crystallinesystems such as cubic Fe2Tb and bcc Fe. The microscopic origin of the ob-served anomalous low-energy excitations is unclear at present. For metallicglasses, either movements of atoms on the surface of very small voids ormovements in lower density ‘defect’ regions of the metallic glass have beensuggested [75] as an explanation for low-energy excitations in these systems.We speculate that the larger atomic diameter of Tb (3.52 A) as compared tothat of Fe (2.48 A) might be an important factor in the a-FexTb1−x system.In the structurally disordered network of large Tb atoms in Tb-rich amor-phous alloys, voids on an atomic scale might exist, which, when occupied by
5.4 Vibrational Properties of Thin Films and Nanostructures 207
Fig. 5.14. Reduced partialVDOS, D(E)/E2, for thea-57FexTb1−x films, and forthe epitaxial, cubic Lavesphase Fe2Tb(110), taken at300K. Neighbouring curvesare vertically displaced by0.2/at.vol./eV/meV2. Due tothe finite width of the energyresolution function, datapoints below 2.3 meV arephysically irrelevant (Dataare taken from Keune et al.[83])
Fe atoms, provide enough space for the smaller Fe atoms to vibrate in shallowpotentials with low frequencies. Such voids do not exist in crystalline systems[77, 83].
5.4.5 Phonon Softening in Fe-Invar Alloys
Phase Transitions and Lattice Instabilities
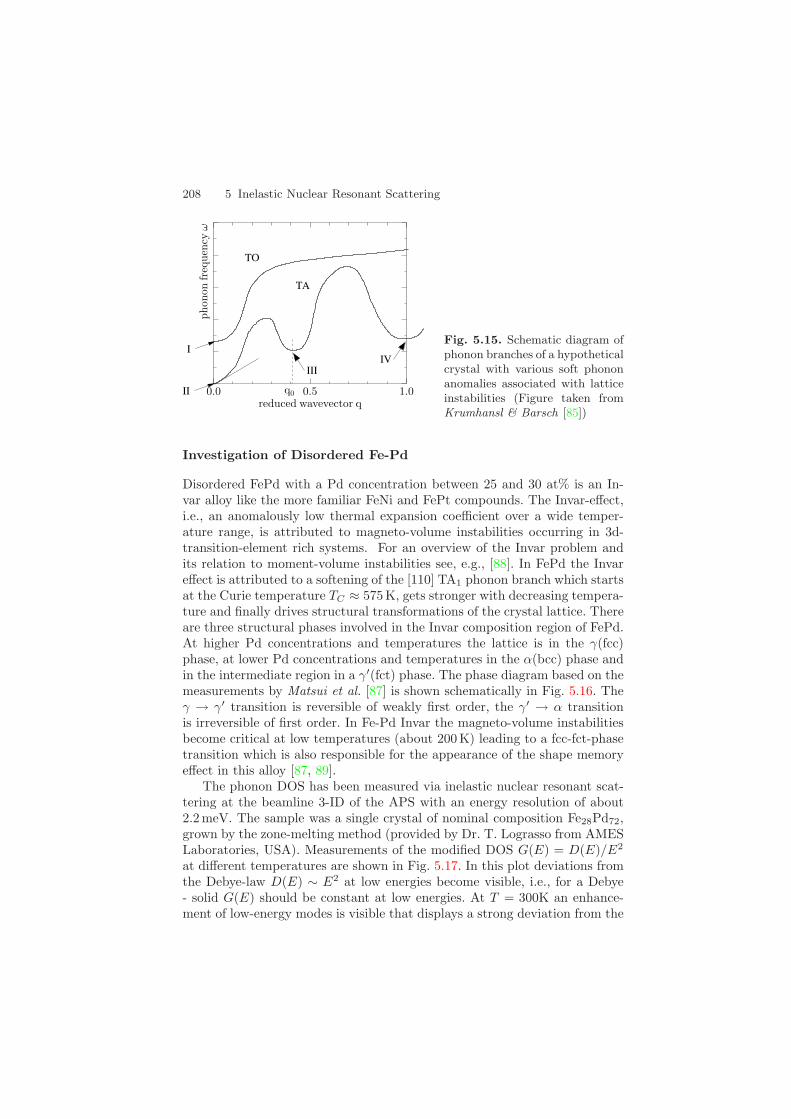
The physics of several phase transitions is intimately related to lattice in-stabilities with soft phonon modes. Figure 5.15 displays schematically onetransverse optic (TO) and one transverse acoustic (TA) phonon branch ofa hypothetical crystal with several types of phonon anomalies labeled I–IV.The softening of an infrared-active mode at the zone center (I) is well knownto be the driving force of ferroelectric transitions of usually (nearly) second-order character. The elastic analog is found in ferroelastic transformations; itis closely related to the famous Zener instability of bcc lattices. Its signatureis a soft shear modulus with a small slope in the acoustic limit and the up-ward curvature at the zone center (II). Phonon anomalies of type III and IVare frequently found in shape memory materials, where the minima at finitewave vector represent intracell atomic displacements that essentially ‘freeze’at the phase transition [86].
208 5 Inelastic Nuclear Resonant Scattering
ΤΟ
ΤΑ
ΙΙΙIV
Ι
ΙΙ
Fig. 5.15. Schematic diagram ofphonon branches of a hypotheticalcrystal with various soft phononanomalies associated with latticeinstabilities (Figure taken fromKrumhansl & Barsch [85])
Investigation of Disordered Fe-Pd
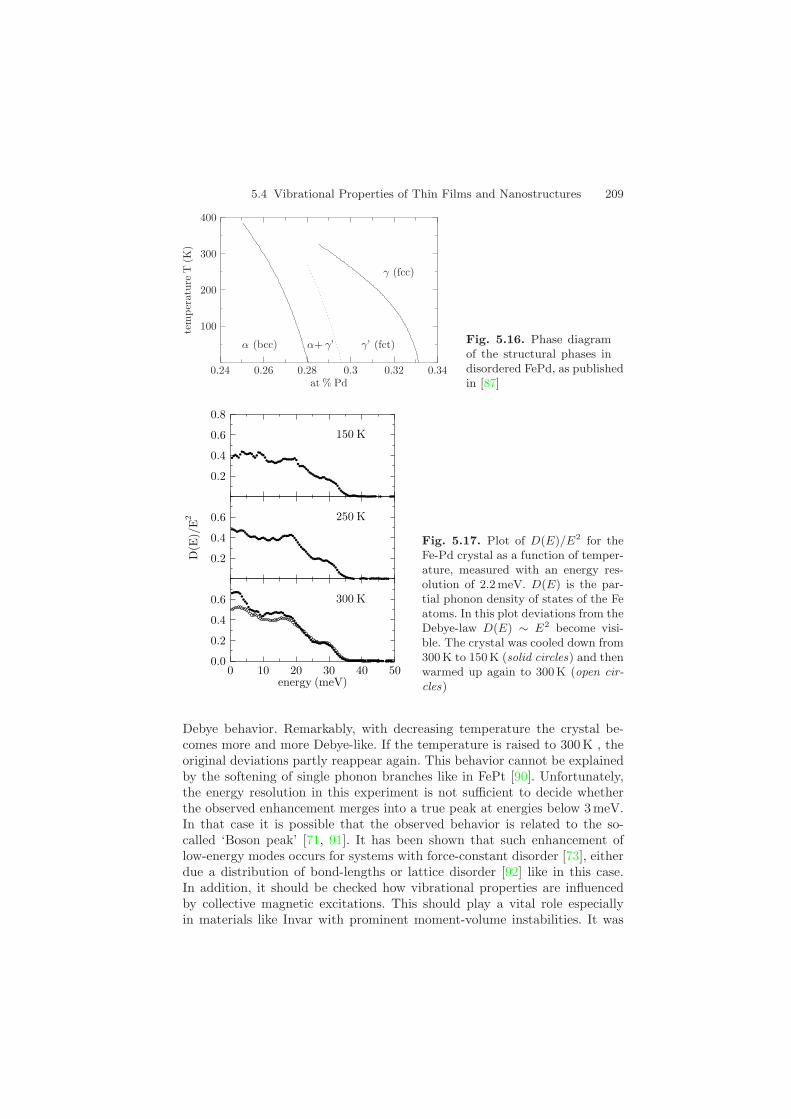
Disordered FePd with a Pd concentration between 25 and 30 at% is an In-var alloy like the more familiar FeNi and FePt compounds. The Invar-effect,i.e., an anomalously low thermal expansion coefficient over a wide temper-ature range, is attributed to magneto-volume instabilities occurring in 3d-transition-element rich systems. For an overview of the Invar problem andits relation to moment-volume instabilities see, e.g., [88]. In FePd the Invareffect is attributed to a softening of the [110] TA1 phonon branch which startsat the Curie temperature TC ≈ 575 K, gets stronger with decreasing tempera-ture and finally drives structural transformations of the crystal lattice. Thereare three structural phases involved in the Invar composition region of FePd.At higher Pd concentrations and temperatures the lattice is in the γ(fcc)phase, at lower Pd concentrations and temperatures in the α(bcc) phase andin the intermediate region in a γ′(fct) phase. The phase diagram based on themeasurements by Matsui et al. [87] is shown schematically in Fig. 5.16. Theγ → γ′ transition is reversible of weakly first order, the γ′ → α transitionis irreversible of first order. In Fe-Pd Invar the magneto-volume instabilitiesbecome critical at low temperatures (about 200 K) leading to a fcc-fct-phasetransition which is also responsible for the appearance of the shape memoryeffect in this alloy [87, 89].
The phonon DOS has been measured via inelastic nuclear resonant scat-tering at the beamline 3-ID of the APS with an energy resolution of about2.2 meV. The sample was a single crystal of nominal composition Fe28Pd72,grown by the zone-melting method (provided by Dr. T. Lograsso from AMESLaboratories, USA). Measurements of the modified DOS G(E) = D(E)/E2
at different temperatures are shown in Fig. 5.17. In this plot deviations fromthe Debye-law D(E) ∼ E2 at low energies become visible, i.e., for a Debye- solid G(E) should be constant at low energies. At T = 300K an enhance-ment of low-energy modes is visible that displays a strong deviation from the
5.4 Vibrational Properties of Thin Films and Nanostructures 209
Fig. 5.16. Phase diagramof the structural phases indisordered FePd, as publishedin [87]
Fig. 5.17. Plot of D(E)/E2 for theFe-Pd crystal as a function of temper-ature, measured with an energy res-olution of 2.2 meV. D(E) is the par-tial phonon density of states of the Featoms. In this plot deviations from theDebye-law D(E) ∼ E2 become visi-ble. The crystal was cooled down from300K to 150 K (solid circles) and thenwarmed up again to 300 K (open cir-cles)
Debye behavior. Remarkably, with decreasing temperature the crystal be-comes more and more Debye-like. If the temperature is raised to 300 K , theoriginal deviations partly reappear again. This behavior cannot be explainedby the softening of single phonon branches like in FePt [90]. Unfortunately,the energy resolution in this experiment is not sufficient to decide whetherthe observed enhancement merges into a true peak at energies below 3 meV.In that case it is possible that the observed behavior is related to the so-called ‘Boson peak’ [71, 91]. It has been shown that such enhancement oflow-energy modes occurs for systems with force-constant disorder [73], eitherdue a distribution of bond-lengths or lattice disorder [92] like in this case.In addition, it should be checked how vibrational properties are influencedby collective magnetic excitations. This should play a vital role especiallyin materials like Invar with prominent moment-volume instabilities. It was
210 5 Inelastic Nuclear Resonant Scattering
suggested that hybridization between phonon and magnon branches leads toan enhancement of low-energy modes in FeO [93].
5.4.6 Local Vibrational Density of States:Interface Phonons and Impurity Modes
Very often, the electronic, magnetic and thermal properties of materials arestrongly influenced by the presence of impurity atoms. Vibrational propertiesare affected by the coupling of the impurity atoms to the surrounding lattice.The vibrational dynamics of impurity atoms was described theoretically byGreen’s function techniques [94]. In these theories, the vibrational density ofstates (VDOS) of the impurity atoms is derived from the unperturbed VDOSof the host crystal. Two kinds of vibrational modes are distinguished:
– Resonance Modes: The energies of these modes lie within the vibra-tional spectrum of the host lattice. This is to be expected when the massof the impurity atom is larger than that of the host atom. Example: Fein Al.
– Localized Modes: The energies of these modes are larger than thelargest vibrational frequency of the host lattice. These modes appear whenthe mass of the impurity is smaller than that of the host atoms. Example:Fe in Cu.
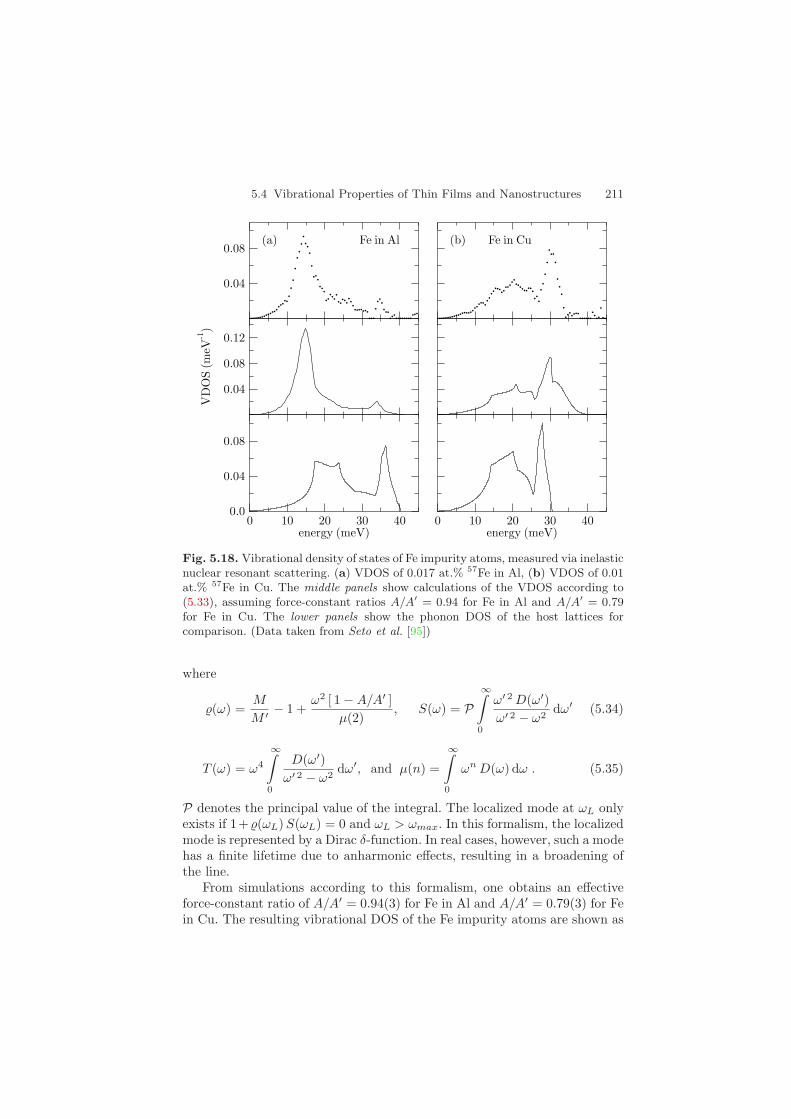
This coupling was investigated by inelastic nuclear resonant scattering [95]from Fe as the impurity atom. Nuclear resonant scattering is an ideal toolto investigate this dynamics because the signal comes exclusively from theimpurity atoms.
Figure 5.18 shows the VDOS of two samples: a) 0.017 at.% 57Fe in Aland b) 0.01 at.% 57Fe in Cu [95]. The VDOS of Fe in Al shows a strong peakaround 15 meV that is very likely due to resonance modes, because its energyis well below the Al cutoff energy of about 40 meV. On the other hand, for Fein Cu one observes additional modes above the Cu cutoff energy of 30.6 meVthat may be localized modes. For a theoretical description of the data, thetheory developed by Mannheim et al. [96, 97, 98] was applied here. Thistheory treats isolated impurities bound by central forces that are limited tothe first-nearest neighbors. It contains as the only free parameter the ratioA/A′ of the host-host force constant A and the host-impurity force constantA′. Together with the ratio M/M ′ of the average mass M of the host atomsand the mass M ′ of the impurity atom, the VDOS D′(ω) of the impurity isexpressed in terms of the VDOS D(ω) of the host lattice:
D′(ω) =M
M ′
[D(ω)
[ 1 + (ω)S(ω) ]2 + [π ω (ω)G(ω)/2 ]2(5.33)
+δ(ω − ωL)
(ω)2 T (ω) + M/M ′ − [ 1 + (ω) ]2
],
5.4 Vibrational Properties of Thin Films and Nanostructures 211
Fig. 5.18. Vibrational density of states of Fe impurity atoms, measured via inelasticnuclear resonant scattering. (a) VDOS of 0.017 at.% 57Fe in Al, (b) VDOS of 0.01at.% 57Fe in Cu. The middle panels show calculations of the VDOS according to(5.33), assuming force-constant ratios A/A′ = 0.94 for Fe in Al and A/A′ = 0.79for Fe in Cu. The lower panels show the phonon DOS of the host lattices forcomparison. (Data taken from Seto et al. [95])
where
(ω) =M
M ′ − 1 +ω2 [ 1 − A/A′ ]
µ(2), S(ω) = P
∞∫
0
ω′ 2 D(ω′)ω′ 2 − ω2
dω′ (5.34)
T (ω) = ω4
∞∫
0
D(ω′)ω′ 2 − ω2
dω′, and µ(n) =
∞∫
0
ωn D(ω) dω . (5.35)
P denotes the principal value of the integral. The localized mode at ωL onlyexists if 1+(ωL)S(ωL) = 0 and ωL > ωmax. In this formalism, the localizedmode is represented by a Dirac δ-function. In real cases, however, such a modehas a finite lifetime due to anharmonic effects, resulting in a broadening ofthe line.
From simulations according to this formalism, one obtains an effectiveforce-constant ratio of A/A′ = 0.94(3) for Fe in Al and A/A′ = 0.79(3) for Fein Cu. The resulting vibrational DOS of the Fe impurity atoms are shown as
212 5 Inelastic Nuclear Resonant Scattering
solid lines in Fig. 5.18. For comparison, the dashed lines show the VDOS ofthe host lattices as determined from inelastic neutron scattering experimentsand compiled in [49]. Due to the considerable mass difference between Fe andAl (M/M ′ = M(Al)/M(Fe) = 0.47), the resonance mode around 15 meV isvery pronounced. In case of Fe in Cu, the mass ratio is M/M ′ = 1.1, so thatlocalized modes can be expected. In this experiment, however, their existenceis not very conclusive, because the spectral features in the phonon spectrumare strongly broadened. It is therefore hard to distinguish possible localizedmodes from the tails of the broadened phonon lines close to the cutoff energyat 30 meV. Systems in which the mass ratio M/M ′ is larger may be bettercandidates to observe these modes.
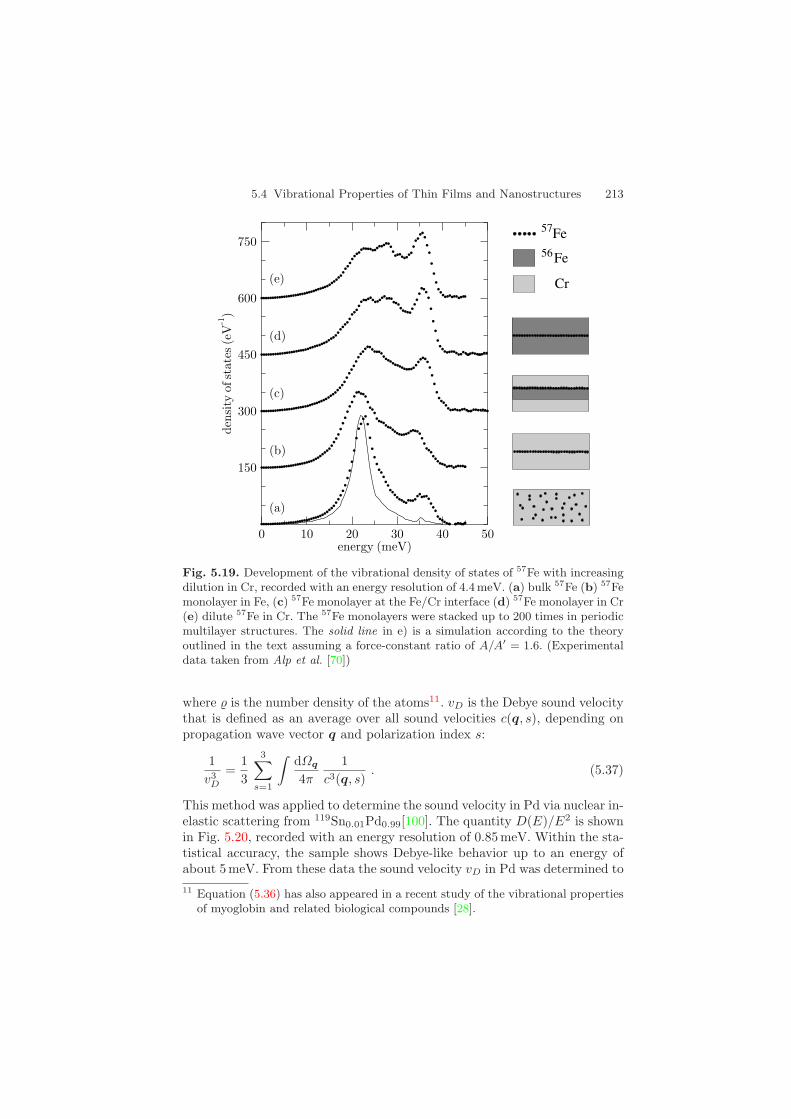
Another example demonstrates the transition from bulk (3-dimensional)lattice dynamics via thin-film (2-dimensional) vibrational behavior to vibra-tional modes of impurity atoms (1-dimensional). Figure 5.19 shows the devel-opment of the VDOS along this route. The samples were Fe/Cr multilayerscontaining 57Fe monolayers in various environments [99]. While the densityof states of bcc Fe is basically the same as that of a 57Fe monolayer withinFe, significant changes can be observed when the monolayer is located at theinterface between Fe and Cr: While the high-energy modes around 35 meVare damped, the modes around 25 meV are strongly enhanced. This tendencycontinues drastically, if the 57Fe probe layers are embedded within Cr: TheVDOS of the Fe atoms around 25 meV is now twice as large compared to theregion around 35 meV. In the case of 57Fe impurities in Cr, this peak mergesinto a strong resonance mode around 22 meV. This can be described by theformalism outlined above: The solid line is a theoretical simulation accordingto (5.33) assuming a force-constant ratio of A/A′ = 1.6.
The measurements discussed here demonstrate the high sensitivity of themethod to very small amounts of material. While this is not only an inter-esting testbed for lattice dynamical theories of impurity atoms, it may alsolead to further applications: The impurity atoms may be used to probe thedynamics of the host lattice, as shown in the following.
Determination of Sound Velocities
An interesting application of the vibrational spectroscopy of impurities insolids is the determination of the sound velocity of the host matrix [100]. Foran isotropic or a polycrystalline sample, the low-energy part of the phonondensity of states can be approximated by
D(E) =(
M ′
M
)E2
2π23 v3D
, (5.36)
5.4 Vibrational Properties of Thin Films and Nanostructures 213
Cr
Fe57
Fe56
Fig. 5.19. Development of the vibrational density of states of 57Fe with increasingdilution in Cr, recorded with an energy resolution of 4.4 meV. (a) bulk 57Fe (b) 57Femonolayer in Fe, (c) 57Fe monolayer at the Fe/Cr interface (d) 57Fe monolayer in Cr(e) dilute 57Fe in Cr. The 57Fe monolayers were stacked up to 200 times in periodicmultilayer structures. The solid line in e) is a simulation according to the theoryoutlined in the text assuming a force-constant ratio of A/A′ = 1.6. (Experimentaldata taken from Alp et al. [70])
where is the number density of the atoms11. vD is the Debye sound velocitythat is defined as an average over all sound velocities c(q, s), depending onpropagation wave vector q and polarization index s:
1v3
D
=13
3∑
s=1
∫dΩq
4π
1c3(q, s)
. (5.37)
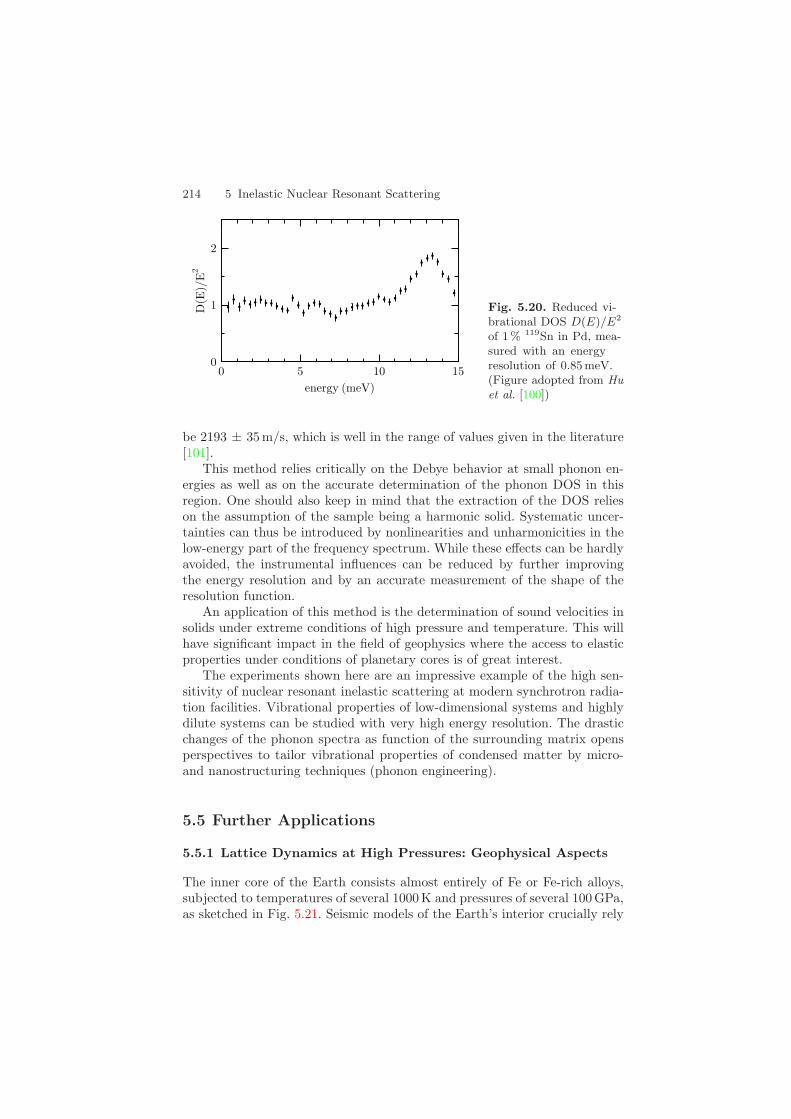
This method was applied to determine the sound velocity in Pd via nuclear in-elastic scattering from 119Sn0.01Pd0.99[100]. The quantity D(E)/E2 is shownin Fig. 5.20, recorded with an energy resolution of 0.85 meV. Within the sta-tistical accuracy, the sample shows Debye-like behavior up to an energy ofabout 5 meV. From these data the sound velocity vD in Pd was determined to11 Equation (5.36) has also appeared in a recent study of the vibrational properties
of myoglobin and related biological compounds [28].
214 5 Inelastic Nuclear Resonant Scattering
Fig. 5.20. Reduced vi-brational DOS D(E)/E2
of 1% 119Sn in Pd, mea-sured with an energyresolution of 0.85 meV.(Figure adopted from Huet al. [100])
be 2193 ± 35 m/s, which is well in the range of values given in the literature[101].
This method relies critically on the Debye behavior at small phonon en-ergies as well as on the accurate determination of the phonon DOS in thisregion. One should also keep in mind that the extraction of the DOS relieson the assumption of the sample being a harmonic solid. Systematic uncer-tainties can thus be introduced by nonlinearities and unharmonicities in thelow-energy part of the frequency spectrum. While these effects can be hardlyavoided, the instrumental influences can be reduced by further improvingthe energy resolution and by an accurate measurement of the shape of theresolution function.
An application of this method is the determination of sound velocities insolids under extreme conditions of high pressure and temperature. This willhave significant impact in the field of geophysics where the access to elasticproperties under conditions of planetary cores is of great interest.
The experiments shown here are an impressive example of the high sen-sitivity of nuclear resonant inelastic scattering at modern synchrotron radia-tion facilities. Vibrational properties of low-dimensional systems and highlydilute systems can be studied with very high energy resolution. The drasticchanges of the phonon spectra as function of the surrounding matrix opensperspectives to tailor vibrational properties of condensed matter by micro-and nanostructuring techniques (phonon engineering).
5.5 Further Applications
5.5.1 Lattice Dynamics at High Pressures: Geophysical Aspects
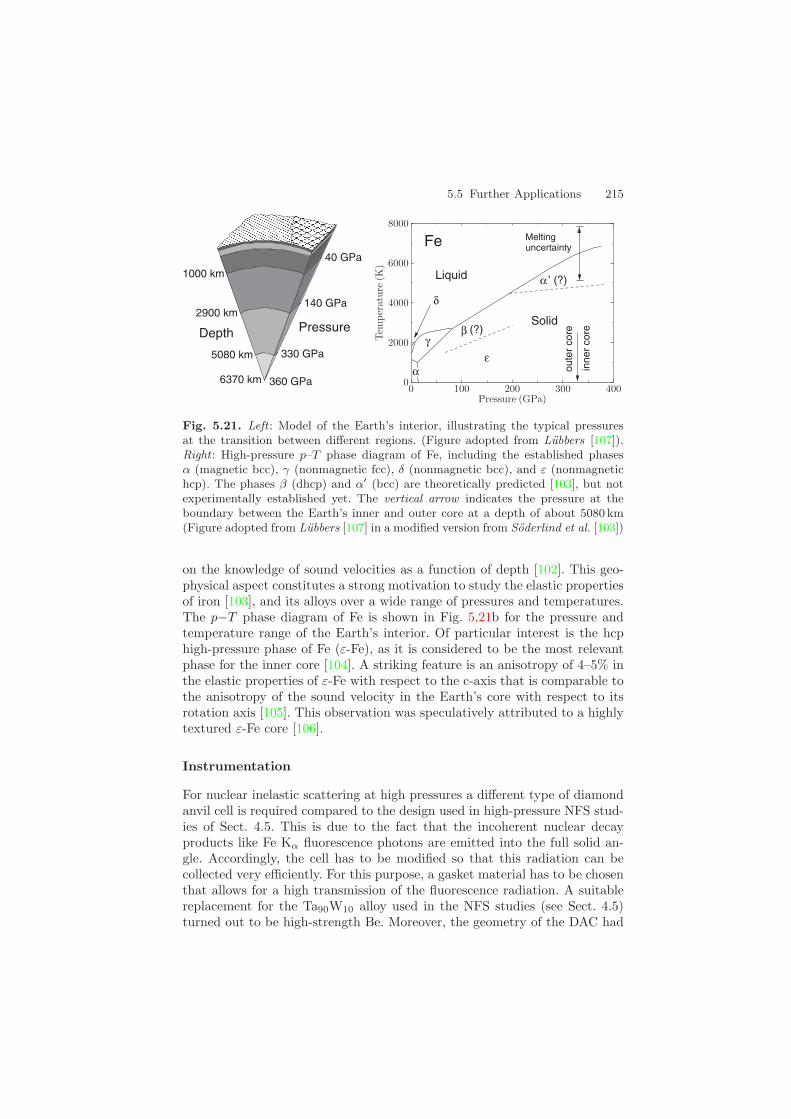
The inner core of the Earth consists almost entirely of Fe or Fe-rich alloys,subjected to temperatures of several 1000 K and pressures of several 100 GPa,as sketched in Fig. 5.21. Seismic models of the Earth’s interior crucially rely
5.5 Further Applications 215
Fe
Liquid
Melting
βγ
ε
δ
α
Solid
inne
r co
re
oute
r co
re
uncertainty
α ’ (?)
(?)Depth Pressure2900 km
5080 km
6370 km 360 GPa
330 GPa
140 GPa
40 GPa
1000 km
Fig. 5.21. Left : Model of the Earth’s interior, illustrating the typical pressuresat the transition between different regions. (Figure adopted from Lubbers [107]).Right : High-pressure p–T phase diagram of Fe, including the established phasesα (magnetic bcc), γ (nonmagnetic fcc), δ (nonmagnetic bcc), and ε (nonmagnetichcp). The phases β (dhcp) and α′ (bcc) are theoretically predicted [103], but notexperimentally established yet. The vertical arrow indicates the pressure at theboundary between the Earth’s inner and outer core at a depth of about 5080 km(Figure adopted from Lubbers [107] in a modified version from Soderlind et al. [103])
on the knowledge of sound velocities as a function of depth [102]. This geo-physical aspect constitutes a strong motivation to study the elastic propertiesof iron [103], and its alloys over a wide range of pressures and temperatures.The p−T phase diagram of Fe is shown in Fig. 5.21b for the pressure andtemperature range of the Earth’s interior. Of particular interest is the hcphigh-pressure phase of Fe (ε-Fe), as it is considered to be the most relevantphase for the inner core [104]. A striking feature is an anisotropy of 4–5% inthe elastic properties of ε-Fe with respect to the c-axis that is comparable tothe anisotropy of the sound velocity in the Earth’s core with respect to itsrotation axis [105]. This observation was speculatively attributed to a highlytextured ε-Fe core [106].
Instrumentation
For nuclear inelastic scattering at high pressures a different type of diamondanvil cell is required compared to the design used in high-pressure NFS stud-ies of Sect. 4.5. This is due to the fact that the incoherent nuclear decayproducts like Fe Kα fluorescence photons are emitted into the full solid an-gle. Accordingly, the cell has to be modified so that this radiation can becollected very efficiently. For this purpose, a gasket material has to be chosenthat allows for a high transmission of the fluorescence radiation. A suitablereplacement for the Ta90W10 alloy used in the NFS studies (see Sect. 4.5)turned out to be high-strength Be. Moreover, the geometry of the DAC had
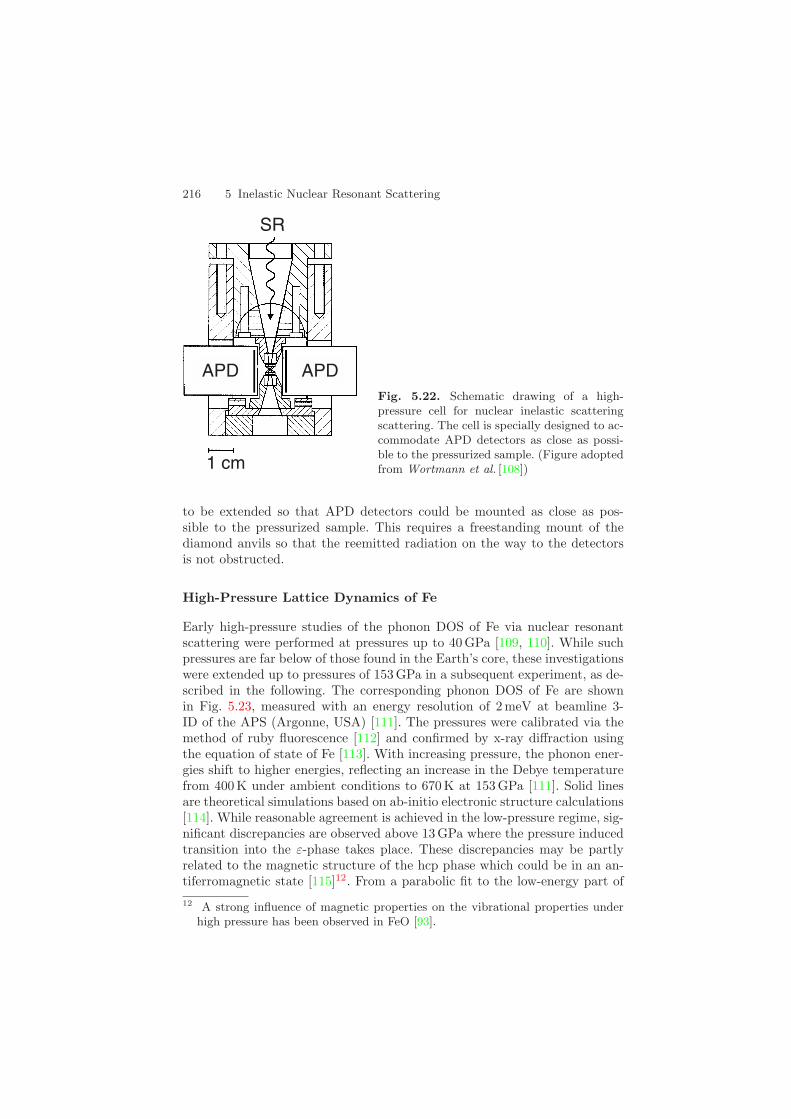
216 5 Inelastic Nuclear Resonant Scattering
1 cm
APD APD
SR
Fig. 5.22. Schematic drawing of a high-pressure cell for nuclear inelastic scatteringscattering. The cell is specially designed to ac-commodate APD detectors as close as possi-ble to the pressurized sample. (Figure adoptedfrom Wortmann et al. [108])
to be extended so that APD detectors could be mounted as close as pos-sible to the pressurized sample. This requires a freestanding mount of thediamond anvils so that the reemitted radiation on the way to the detectorsis not obstructed.
High-Pressure Lattice Dynamics of Fe
Early high-pressure studies of the phonon DOS of Fe via nuclear resonantscattering were performed at pressures up to 40 GPa [109, 110]. While suchpressures are far below of those found in the Earth’s core, these investigationswere extended up to pressures of 153 GPa in a subsequent experiment, as de-scribed in the following. The corresponding phonon DOS of Fe are shownin Fig. 5.23, measured with an energy resolution of 2 meV at beamline 3-ID of the APS (Argonne, USA) [111]. The pressures were calibrated via themethod of ruby fluorescence [112] and confirmed by x-ray diffraction usingthe equation of state of Fe [113]. With increasing pressure, the phonon ener-gies shift to higher energies, reflecting an increase in the Debye temperaturefrom 400 K under ambient conditions to 670 K at 153 GPa [111]. Solid linesare theoretical simulations based on ab-initio electronic structure calculations[114]. While reasonable agreement is achieved in the low-pressure regime, sig-nificant discrepancies are observed above 13 GPa where the pressure inducedtransition into the ε-phase takes place. These discrepancies may be partlyrelated to the magnetic structure of the hcp phase which could be in an an-tiferromagnetic state [115]12. From a parabolic fit to the low-energy part of
12 A strong influence of magnetic properties on the vibrational properties underhigh pressure has been observed in FeO [93].
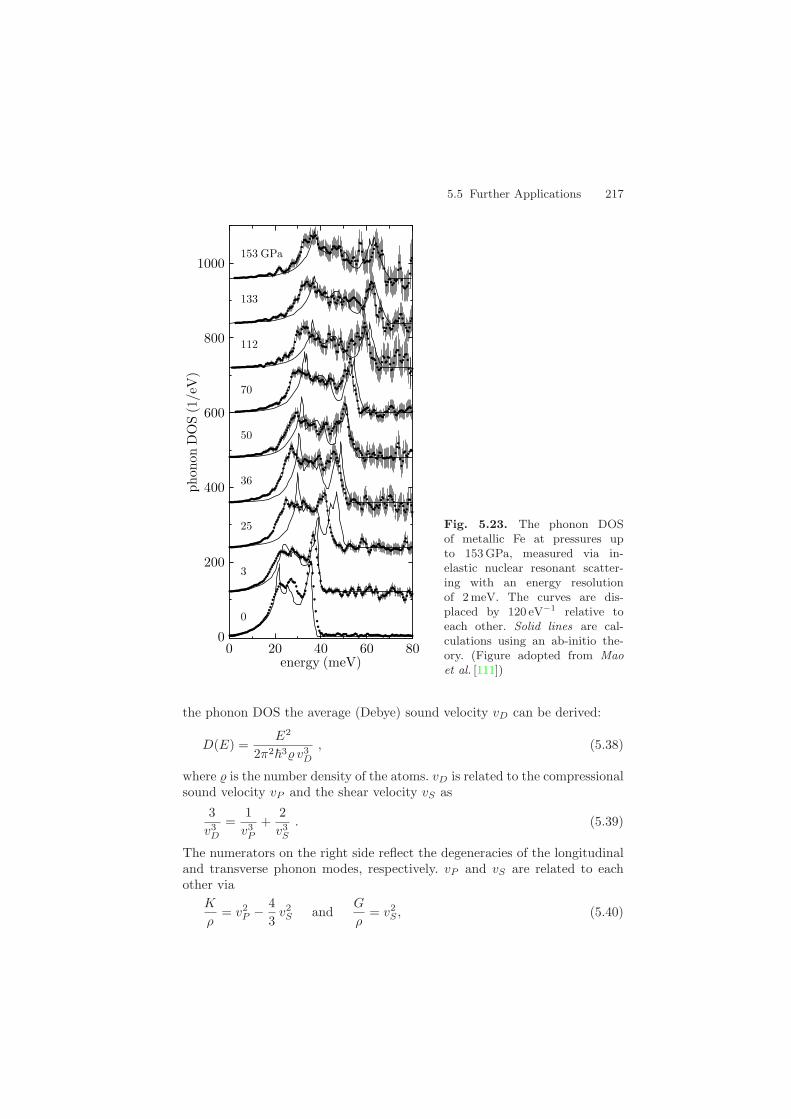
5.5 Further Applications 217
Fig. 5.23. The phonon DOSof metallic Fe at pressures upto 153GPa, measured via in-elastic nuclear resonant scatter-ing with an energy resolutionof 2meV. The curves are dis-placed by 120 eV−1 relative toeach other. Solid lines are cal-culations using an ab-initio the-ory. (Figure adopted from Maoet al. [111])
the phonon DOS the average (Debye) sound velocity vD can be derived:
D(E) =E2
2π23 v3D
, (5.38)
where is the number density of the atoms. vD is related to the compressionalsound velocity vP and the shear velocity vS as
3v3
D
=1v3
P
+2v3
S
. (5.39)
The numerators on the right side reflect the degeneracies of the longitudinaland transverse phonon modes, respectively. vP and vS are related to eachother via
K
ρ= v2
P − 43
v2S and
G
ρ= v2
S , (5.40)

218 5 Inelastic Nuclear Resonant Scattering
Fig. 5.24. Acoustic sound veloc-ity VP as derived from the phononDOS shown in Fig. 5.23 (solid cir-cles) [111] and from phonon dis-persion relations measured by in-elastic x-ray scattering (open cir-cles) [116]. The solid lines areBirch fits to the measured data.In both cases the extrapolation topressures in the Earth’s core leadsto values above the PREM data(open diamonds) [102]
where ρ is the density, K the bulk modulus and G the shear modulus. With ρand K determined by x-ray diffraction and vD determined from the phononDOS, the above equations can be solved for vP , vS and G. On the otherhand, vP can be determined directly from the initial slope of the LA phonondispersion relation, as determined via inelastic x-ray scattering up to a pres-sure of 110 GPa [116]. This measurement was performed on polycrystallineFe13 and thus yielded the orientationally averaged dispersion curves of theLA phonon branch. Figure 5.24 displays the acoustic sound velocities derivedfrom the phonon DOS together with the data from IXS measurements [116].The solid line is a fit assuming a linear relation between the density ρ andthe sound velocity vP (Birch’s law [117]). While the experimental data arein good agreement, the extrapolation to pressures at the inner core devi-ates from seismic data according to the Preliminary Reference Earth Model(PREM) [102]. This indicates that the Earth’s inner core may be of slightlylower density than hcp Fe. This finding, however, is at variance with the con-clusion derived in [111], where a heavier alloy, e.g., containing 5–10% Ni wassuggested.
It should be noted that all the experiments reported here were performedat ambient temperatures. More reliable data can be only obtained if also thetemperature can be adjusted to match conditions of the inner Earth. Firststudies in this field have been made with laser heating of the pressurizedsample [118]. Another interesting aspect is the pressure-induced texturing of
13 Any single crystal of Fe transforms into a polycrystal upon the phase transitionfrom α - to ε- Fe.

5.5 Further Applications 219
ε-Fe with the c-axis aligned along the direction of uniaxial compression [119].This effect allows one to investigate the sound propagation along differentdirections in ε-Fe [108] and the anisotropy of its elastic parameters.
The experiments discussed here have shown that inelastic nuclear resonantscattering is a valuable method for the determination of sound velocities,which has significant impact for understanding the properties of planetarycores, for example. The measurements indicate the importance to obtainaccurate data in the low-energy region of the phonon spectrum. This canbe achieved by employing spectrometers with energy resolutions ∆E below2 meV or better. Uncertainties related to the subtraction of the elastic peakthen affect only a very small part of the phonon spectrum. For that reason,sound velocity data obtained in a previous study [110] (∆E = 6.4 meV)were deviating by 20% from those remeasured with better energy resolution(∆E = 3.5 meV) [109].
Another interesting approach in this field is the use of impurities of aresonant isotope to determine the sound velocity of the host material, asdescribed in Sect. 5.4.6. This would allow one to determine sound velocitiesin materials that do not contain resonant isotopes [100].
5.5.2 Dynamics of Biomolecules
Several metallic species play a crucial role in the function of biological macro-molecules. Prominent examples are Mg in chlorophyll and Fe in haemoglobinthat constitute essential components of plant and animal metabolism, re-spectively. Fe in physiologically essential proteins is most often found in thecenter of a planar heme group, particularly in such proteins as haemoglobinand cytochrome c oxidase that mediate the transport and usage of molecularoxygen. The function of such molecules is closely related to their dynamicsand conformational changes during reaction. Since these reactions often takeplace at a localized site, a route towards understanding the protein func-tion is the synthesis and investigation of small molecules that mimic thestructure of the active site. Model systems for the investigation of heme pro-teins are the iron-tetraphenylporphyrin Fe(TPP) compounds. For example,the heme model compound Fe(TPP)(2-MeHIm) mimics the active site ofdeoxymyoglobin, while Fe(TPP)(CO)(1-MeIm) represents the active site ofcarbonmonoxy myoglobin (MbCO). A useful model for heme proteins withfivefold coordinated Fe (with a ligand bound to the Fe), is Fe(TPP)(NO)[120, 121]. A model of this molecule is shown in Fig. 5.25. The Fe is locatedin the center of the planar heme group that consists of four pyrrole rings (I–IV), bridged by carbon atoms to which four phenyl groups are bound. It isbelieved that the out-of-plane motion of the Fe plays a fundamental role inthe binding and transport of O2 by haemoglobin [122]. This motion is a resultof the dynamics of the surrounding protein matrix that controls the access toand the reactivity of the heme group. Peripheral substituents seem to have alarge effect on the dynamics of the iron, especially for out-of-plane motions
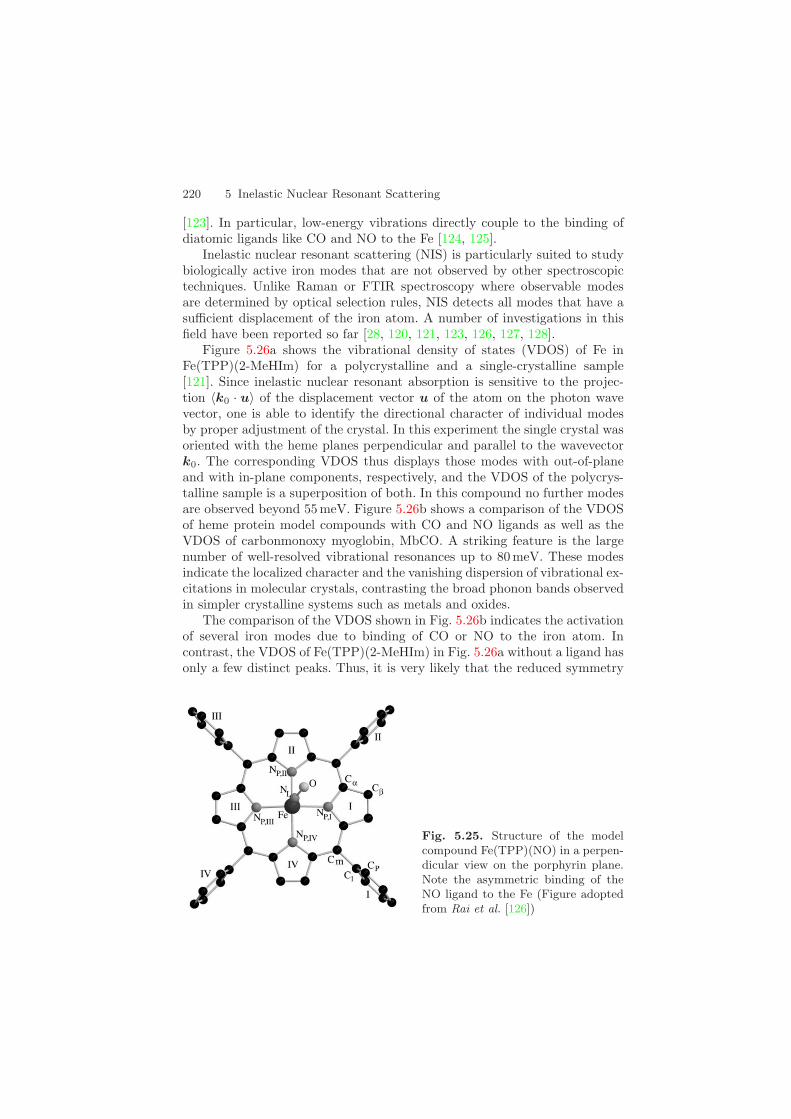
220 5 Inelastic Nuclear Resonant Scattering
[123]. In particular, low-energy vibrations directly couple to the binding ofdiatomic ligands like CO and NO to the Fe [124, 125].
Inelastic nuclear resonant scattering (NIS) is particularly suited to studybiologically active iron modes that are not observed by other spectroscopictechniques. Unlike Raman or FTIR spectroscopy where observable modesare determined by optical selection rules, NIS detects all modes that have asufficient displacement of the iron atom. A number of investigations in thisfield have been reported so far [28, 120, 121, 123, 126, 127, 128].
Figure 5.26a shows the vibrational density of states (VDOS) of Fe inFe(TPP)(2-MeHIm) for a polycrystalline and a single-crystalline sample[121]. Since inelastic nuclear resonant absorption is sensitive to the projec-tion 〈k0 · u〉 of the displacement vector u of the atom on the photon wavevector, one is able to identify the directional character of individual modesby proper adjustment of the crystal. In this experiment the single crystal wasoriented with the heme planes perpendicular and parallel to the wavevectork0. The corresponding VDOS thus displays those modes with out-of-planeand with in-plane components, respectively, and the VDOS of the polycrys-talline sample is a superposition of both. In this compound no further modesare observed beyond 55 meV. Figure 5.26b shows a comparison of the VDOSof heme protein model compounds with CO and NO ligands as well as theVDOS of carbonmonoxy myoglobin, MbCO. A striking feature is the largenumber of well-resolved vibrational resonances up to 80 meV. These modesindicate the localized character and the vanishing dispersion of vibrational ex-citations in molecular crystals, contrasting the broad phonon bands observedin simpler crystalline systems such as metals and oxides.
The comparison of the VDOS shown in Fig. 5.26b indicates the activationof several iron modes due to binding of CO or NO to the iron atom. Incontrast, the VDOS of Fe(TPP)(2-MeHIm) in Fig. 5.26a without a ligand hasonly a few distinct peaks. Thus, it is very likely that the reduced symmetry
Fig. 5.25. Structure of the modelcompound Fe(TPP)(NO) in a perpen-dicular view on the porphyrin plane.Note the asymmetric binding of theNO ligand to the Fe (Figure adoptedfrom Rai et al. [126])

5.5 Further Applications 221
NO
CO
CO
Fig. 5.26. (a) Vibrational spectra of Fe(TPP)(2-MeHIm) at 20K for a polycrys-talline sample and a single crystal with the porphyrin plane oriented parallel orperpendicular to the incident beam. This allows for identification of in-plane orout-of-plane vibrations of the Fe, respectively. (b) Comparison of the Fe VDOS forvarious model compounds and the heme protein carbonmonoxy-myoglobin (MbCO)(Figures adopted from Rai et al. [123])
of the Fe environment induced by the asymmetric binding of the ligands (seeFig. 5.25) contributes to the activation of these modes. The strongest featurein the VDOS of the CO and NO ligated compounds is the pair of modes at39.6 and 42.3 meV. These modes are associated to in-plane vibrations of thecore porphyrin. The modes indicated by the brackets are NO and CO bendand stretch modes, as will be discussed later.
The extraction of the VDOS from the measured vibrational spectra as-sumes a harmonic lattice. This was confirmed by monitoring the temperaturedependence of the vibrational modes in several different species of myoglobinup to 300 K [28]. In these studies no shift in the energetic positions of thelines has been observed. Therefore, it has been proven that the harmonicdynamics observed at low temperatures is present also in the physiologicaltemperature regime above 180 K.
A confident assignment of the observed vibrational modes, however, re-quires a normal mode analysis. For molecular systems that exhibit discretevibrational resonances, this approach provides a convenient basis for com-parison of the experimental vibrational spectra with normal-mode calcula-tions. This procedure is described, e.g., in [120, 121, 129]. In the case ofFe(TPP)(CO)(1-MeIm) the corresponding calculations allowed for a verygood simulation of the measured VDOS and thus for an identification ofindividual vibrational modes [123].
222 5 Inelastic Nuclear Resonant Scattering
Normal Mode Analysis
In the following we summarize the procedure how to extract mean-squaredisplacements of individual vibrational modes from the measured vibrationalspectrum [120]. In the low-temperature limit14 the normalized excitationprobability is given by
S(ω) = fL0(ω) +∑
α
φαL(ω − ωα) , (5.41)
with f being the recoilless fraction, i.e., the area fraction of the recoillessline. L0(ω) and L(ω) are the lineshape functions of the elastic line and thevibrational modes, respectively. φα is the area fraction of the mode α withfrequency ωα in the spectrum. It can be expressed as:
φα =ωR
ωα(k0 · ejα)2(nα + 1) f , (5.42)
where ωR is the recoil energy of the free atom15, k0 is the unit photonwavevector, and ejα is the eigenvector of the normal mode α of atom j. nα
is the mean occupation number of mode α at temperature T that is given by
nα =1
exp(ωα/kBT ) − 1. (5.43)
In the polycrystalline samples investigated here the orientational averagingof the projection factor in (5.42) yields:
〈(k0 · ejα)2〉 =13e2
jα , (5.44)
so that
φα =13
ωR
ωαe2
jα(nα + 1) f . (5.45)
The quantity e2jα is the so-called mode composition factor which plays a
central role in this analysis. It is closely related to the magnitude of theatomic fluctuations. In a harmonic system, the mean square deviation ofatom j from its equilibrium position is given by
〈r2j 〉 =
∑
α
(2nα + 1)〈r2jα〉0 with 〈r2
jα〉0 =
2mjωαe2
jα . (5.46)
〈r2jα〉0 is the contribution of mode α to the zero-point fluctuations of atom j in
the ground state. This means, the mode composition factor e2jα is proportional
to the contribution of mode α to the mean square fluctuations of atom j.For some simple cases, e2
jα can be calculated directly. For example, e2jα =
mj/M for an atom j with mass mj , participating in a translational mode of
14 We consider only the one-phonon transitions nα → nα ± 1 in the occupationnumber of the vibrational states.
15ωR = 1.96 meV for the 14.4 keV transition in 57Fe.
5.5 Further Applications 223
a molecule with total mass M . Another simple case is a two-body oscillatorconsisting of two groups of atoms with masses M1 and M2, where we have
e2jα =
mj
M1
M2
M1 + M2. (5.47)
For an experimental determination of the mode composition factors we usethe normalization of (5.41), and the fact that the line-shape functions haveunit area, to obtain
1 =∫
S(ω) dω = f +∑
α
φα . (5.48)
This equation is used to calculate the recoilless fraction f after determinationof all values φα from the measured spectrum:
f = 1 −∑
α
φα . (5.49)
With this value (5.45) is solved for the mode composition factor e2jα. For a
test of the accuracy one takes these values to calculate the recoilless fractionvia f = exp[−〈(k0 · rFe)2〉T ]. Assuming again a polycrystalline sample, i.e.,〈(k0 · rFe)2〉 = k2
0 〈r2Fe〉/3, we use (5.46) together with the expression for the
recoil energy ER = ωR = 2k2
0/2mj and obtain:
f = exp
[−1
3
∑
α
ωR
ωα(2nα + 1) e2
Fe,α
]. (5.50)
While f is dominated by low-energy modes, a more convincing test is thecomparison of the average kinetic energy
T =112
∑
α
ωα(2nα + 1) e2Fe,α (5.51)
with the model-independent value
T =〈E2〉 − E2
R
4ER(5.52)
that follows from Lipkin’s sum rules [22, 130], where 〈E2〉 denotes the secondmoment of the absorption probability S(E), defined in (5.8). The results ofthe mode composition analysis for the compound Fe(TPP)(NO) at T = 80 Kare shown in Fig. 5.27. The upper panel (a) shows the measured excitationprobability, while the lower panel (b) displays the mode composition factorsderived via the procedure described above. In this case (5.49) and (5.50) yieldconsistent values of f = 0.948 and f = 0.944, respectively. Also the averagekinetic energy determined via (5.51) and (5.52) is in good agreement withvalues of T = 9.17 meV and T = 9.42 meV, respectively.
The peak at 67 meV is associated with a Fe-NO stretching mode. In fact,the value e2
Fe = 0.34 observed here is very close to the value e2Fe = 0.31
predicted by (5.47) for a two-body Fe-NO oscillator. Moreover, the value
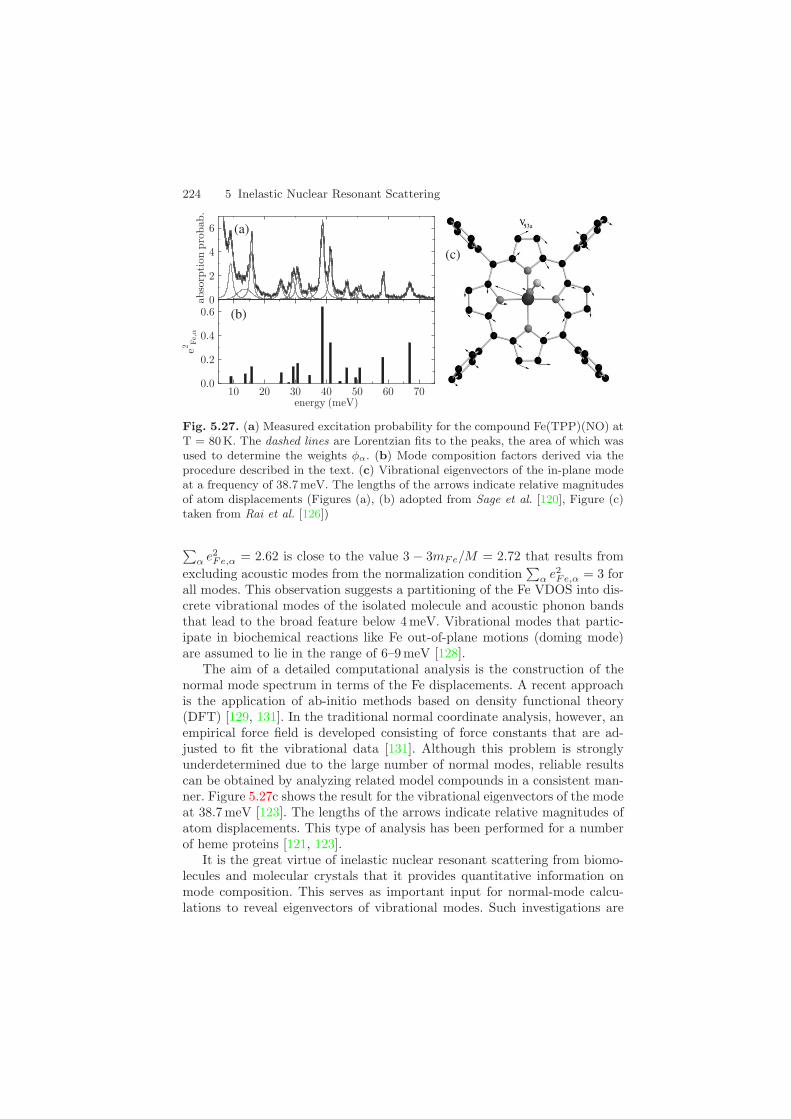
224 5 Inelastic Nuclear Resonant Scattering
(b)
(a)
(c)
Fig. 5.27. (a) Measured excitation probability for the compound Fe(TPP)(NO) atT = 80 K. The dashed lines are Lorentzian fits to the peaks, the area of which wasused to determine the weights φα. (b) Mode composition factors derived via theprocedure described in the text. (c) Vibrational eigenvectors of the in-plane modeat a frequency of 38.7 meV. The lengths of the arrows indicate relative magnitudesof atom displacements (Figures (a), (b) adopted from Sage et al. [120], Figure (c)taken from Rai et al. [126])
∑α e2
Fe,α = 2.62 is close to the value 3 − 3mFe/M = 2.72 that results fromexcluding acoustic modes from the normalization condition
∑α e2
Fe,α = 3 forall modes. This observation suggests a partitioning of the Fe VDOS into dis-crete vibrational modes of the isolated molecule and acoustic phonon bandsthat lead to the broad feature below 4 meV. Vibrational modes that partic-ipate in biochemical reactions like Fe out-of-plane motions (doming mode)are assumed to lie in the range of 6–9 meV [128].
The aim of a detailed computational analysis is the construction of thenormal mode spectrum in terms of the Fe displacements. A recent approachis the application of ab-initio methods based on density functional theory(DFT) [129, 131]. In the traditional normal coordinate analysis, however, anempirical force field is developed consisting of force constants that are ad-justed to fit the vibrational data [131]. Although this problem is stronglyunderdetermined due to the large number of normal modes, reliable resultscan be obtained by analyzing related model compounds in a consistent man-ner. Figure 5.27c shows the result for the vibrational eigenvectors of the modeat 38.7 meV [123]. The lengths of the arrows indicate relative magnitudes ofatom displacements. This type of analysis has been performed for a numberof heme proteins [121, 123].
It is the great virtue of inelastic nuclear resonant scattering from biomo-lecules and molecular crystals that it provides quantitative information onmode composition. This serves as important input for normal-mode calcu-lations to reveal eigenvectors of vibrational modes. Such investigations are
5.6 Comparison with Other Scattering Methods 225
not only of great importance to understand the function of physiologicallyrelevant molecules, but also for molecules like (CN3H6)2Fe(CN)5NO (guani-dinium nitroprusside) and Fe(tpa)(NCS)2 that are promising materials forhigh-density optical information storage [132, 133].
5.6 Comparison with Other Scattering Methods
The traditional method for measuring vibrational properties of condensedmatter are inelastic neutron scattering (INS) [134] and inelastic x-ray scatter-ing (IXS) [13, 14]. Both methods provide measurements of the fundamentalrelationship between the vibrational excitation frequency and the momentumtransfer, i.e., the dispersion relations, in bulk solids. From the dispersion re-lations of single crystals the phonon density of states can be calculated byintegration over momentum space [135]. Therefore, inelastic nuclear resonantscattering and INS or IXS provide complementary information.
In the following the most important differences between INS, IXS andnuclear inelastic scattering (NIS) shall be reviewed. Inelastic nuclear res-onant absorption of x-rays relies on the detection of decay products frominternal conversion that is an incoherent process with a very large nuclearcross section [30]. Since the phase relation between different detected waves(e.g., x-ray fluorescence radiation) is uncorrelated, the measured signal re-flects only single particle vibrations of the Mossbauer nuclei. This allows thedirect determination of the partial VDOS with a minimum of modeling, onlyassuming a harmonic lattice [11, 30]. The data treatment resembles that forincoherent inelastic neutron scattering. However, in contrast to the lattertechnique, averaging over phonon momenta is not achieved by the specificlocation of detectors. Momentum integration in inelastic nuclear scatteringis assured by monitoring the yield of the nonradiative channel of the nu-clear de-excitation, where the atomic fluorescence radiation does not enterthe momentum conservation law. Furthermore, the instrumental function ofhigh-resolution monochromators is constant, and the energy transfer scale isdefined with high precision. Therefore, even variations of the density of statesof only a few percent can be accurately determined [31].
Moreover, the measured signal in INS generally contains contributionsfrom coherent scattering (which allows the study of collective atomic vibra-tions, i.e., dispersion relations) and incoherent scattering (which is relatedto single-particle vibrations and the VDOS) [75]. Direct measurements ofVDOS from incoherent INS or IXS are difficult (if not impossible) due to thesmall incoherent cross sections usually involved. In the case of coherent INS,a generalized VDOS can be determined with partial contributions accordingto the scattering power of each element in the sample. However, the dataanalysis is not straightforward due to interference scattering and coherentmultiphonon scattering [75]. A comparison between the VDOS measured via

226 5 Inelastic Nuclear Resonant Scattering
inelastic nuclear resonant scattering and the generalized VDOS determinedfrom neutron scattering has been given for a bulk AlCuFe quasicrystal [136].
Compared with INS, a significant advantage of inelastic nuclear resonantabsorption is the small amount of material required. Due to the small scatter-ing cross sections, INS can be performed on bulk samples only; for instance,several grams of sample material are necessary [75]. This makes INS unsuit-able for the investigation of atomic dynamics in thin films. However, thesituation will improve with the next generation of pulsed neutron sources.
Other methods to probe dynamical properties like energy loss spec-troscopy with electrons or He atoms [45] or point-contact methods [46] areintrinsically too surface sensitive. Moreover, phonons with larger wave vectorsq are difficult to measure with electrons because the cross-section dependson q−4 [75]. Inelastic scattering of visible or infrared light (Brillouin or Ra-man scattering) has been used extensively to study vibrational excitations in(mostly semiconducting) thin films and multilayers [38, 47], but the limitedmomentum transfer does not allow a derivation of the VDOS. Further, thepenetration depth of light in metals is small, and thus the scattered intensityis very low and difficult to measure. Accordingly, inelastic nuclear resonantabsorption is the most promising method at present for deriving VDOS inthin films and nanoscale structures.
It should be noted again that inelastic nuclear resonant absorption in-trinsically exhibits a unique sensitivity to the probe nucleus. This is particu-larly promising for biological applications, because it is possible to selectivelyprobe vibrations of a single atom at the active site of a complex biomolecule,while avoiding interference from the vibrations of thousands of other atoms[127, 128, 137]. Moreover, inelastic nuclear resonant scattering does not facelimitations due to selection rules and solvent interference that hamper tradi-tional site-selective vibrational spectroscopies [120].
References
1. K. S. Singwi and A. Sjolander : Phys. Rev. 120, 1093 (1960) 181, 184, 185, 1892. W. M. Visscher : Ann. Phys. 9, 194 (1960) 1813. P. B. Moon : Proc. Phys. Soc. 63, 1189 (1950) 1814. G. Endres, F. Strohkendl, H. Langhoff, and F. Gmelin : Z. Phys. B - Condensed
Matter 44, 253 (1981) 1815. H. Weiss and H. Langhoff : Phys. Lett. 69A, 448 (1979) 181, 1826. H. Weiss and H. Langhoff : Z. Phys. B 33, 365 (1979) 1817. M. Kofferlein, W. Potzel, M. Steiner, H. Karzel, W. Schiessl, and
G. M. Kalvius : Phys. Rev. B 52, 13332 (1995) 1818. W. Sturhahn and A. I. Chumakov : Hyperfine Interact. 123/124, 809 (1999) 181, 1869. A. I. Chumakov, R. Ruffer, H. Grunsteudel, H. F. Grunsteudel, G. Grubel,
J. Metge, O. Leupold, and H. A. Goodwin : Europhys. Lett. 30, 427 (1995) 18110. M. Seto, Y. Yoda, S. Kikuta, X. W. Zhang, and M. Ando : Phys. Rev. Lett.
74, 3828 (1995) 181
References 227
11. W. Sturhahn, T. S. Toellner, E. E. Alp, X. Zhang, M. Ando, Y. Yoda,S. Kikuta, M. Seto, C. W. Kimball, and B. Dabrowski : Phys. Rev. Lett. 74,3832 (1995) 181, 182, 225
12. T. S. Toellner, M. Y. Hu, W. Sturhahn, K. Quast, and E. E. Alp : Appl. Phys.Lett. 71, 2112 (1997) 181, 187
13. E. Burkel : Inelastic Scattering of X-Rays with Very High Energy Resolution(Springer, Berlin 1991) 182, 225
14. E. Burkel : Rep. Prog. Phys. 63, 171 (2000) 182, 22515. A. I. Chumakov, A. Barla, R. Ruffer, J. Metge, H. H. Grunsteudel,
H. Grunsteudel, J. Plessel, H. Winkelmann, and M. M. Abd-Elemguid : Phys.Rev. B 58, 254 (1998) 183, 190
16. M. Y. Hu, W. Sturhahn, T. S. Toellner, P. M. Hession, J. P. Sutter, andE. E. Alp : Nucl. Instrum. Methods Phys. Res. A 428, 551 (1999) 183, 186
17. A. I. Chumakov, R. Ruffer, A. Q. R. Baron, H. Grunsteudel,H. F. Grunsteudel, and V. G. Kohn : Phys. Rev. B 56, 10758 (1997) 185
18. V. G. Kohn, A. I. Chumakov, and R. Ruffer : Phys. Rev. B 58, 8437 (1998) 18519. L. van Hove : Phys. Rev. 95, 249 (1954)20. W. Marshall and S. W. Lovesey : The Theory of Thermal Neutron Scattering
(Oxford University Press, London 1971) 18521. H. J. Lipkin : Ann. Phys. 9, 332 (1960) 18522. H. J. Lipkin : Phys. Rev. B 52, 10073 (1995) 185, 22323. V. G. Kohn and A. I. Chumakov : Hyperfine Interact. 125, 205 (2000) 186, 18924. W. Sturhahn : Hyperfine Interact. 125, 149 (2000) 186, 18925. V. J. Minkiewicz, G. Shirane, and R. Nathans : Phys. Rev. 162, 528 (1967) 187, 195, 20226. D. W. Johnson and J. C. H. Spence : J. Phys. D 7, 771 (1974) 18827. A. I. Chumakov and W. Sturhahn : Hyperfine Interact. 123/124, 781 (1999) 18928. K. Achterhold, C. Keppler, A. Ostermann, U. van Burck, W. Sturhahn,
E. E. Alp, and F. G. Parak : Phys. Rev. E 65, 051916 (2002) 190, 213, 220, 22129. B. Roldan Cuenya, W. Keune, W. Sturhahn, T. S. Toellner, and M. Y. Hu :
Phys. Rev. B 64, 235321 (2001) 19030. A. I. Chumakov and R. Ruffer : Hyperfine Interact. 113, 59 (1998) 191, 205, 22531. A. I. Chumakov, R. Ruffer, A. Q. R. Baron, H. Grunsteudel, and
H. F. Grunsteudel : Phys. Rev. B 54, 9596 (1996) 191, 22532. W. Sturhahn and T. S. Toellner : Phys. Rev. B, 65 134305 (2002) 19133. B. Fultz, T. A. Stephens, E. E. Alp, M. Y. Hu, J. P. Sutter, T. S. Toellner,
and W. Sturhahn : Phys. Rev. B 61, 14517 (2000) 19234. A. van de Walle and G. Ceder : Rev. Mod. Phys. 74, 11 (2002) 19235. U. Kurpick, A. Kara, and T. S. Rahman : Phys. Rev. Lett. 78, 1086 (1997) 19236. B. Fultz, T. A. Stephens, W. Sturhahn, T. S. Toellner, and E. E. Alp : Phys.
Rev. Lett. 80, 3304 (1998) 19237. M. A. Stroscio and M. Dutta : Phonons in Nanostructures (Cambridge Uni-
versity Press, Cambridge, England 2001) 192, 19838. B. Jusserand and M. Cardona, in : M. Cardona and G. Guntherodt (eds.),
Topics in Applied Physics: Light Scattering in Solids V (Springer, Berlin 1989) 193, 22639. H. Xia, G. X. Cheng, A. Hu, and X. K. Zhang : Solid State Commun. 77, 631
(1991) 19340. M. Grimsditch, J. E. Mattson, C. H. Sowers, S. D. Bader, and M. J. Peters :
Phys. Rev. Lett. 77, 2025 (1996) 193
228 5 Inelastic Nuclear Resonant Scattering
41. M. I. Flik, B. I. Choi, and K. E. Goodson : J. Heat Transfer 114, 666 (1992) 193, 19842. B. Bushan, J. N. Israelachvili, and U. Landman : Nature 374, 607 (1995) 19343. J. Krim, Reibung auf atomarer Ebene, Spektrum der Wissenschaft, December
1996 (in German) 19344. M. V. Gandhi and B. S. Thompson : Smart Materials and Structures (Chap-
man and Hall, London 1992) 19445. W. Kress and F. W. de Wette : Surface Phonons (Springer, Berlin 1991) 194, 22646. A. V. Khotkevich and I. K. Yanson : Atlas of Point Contact Spectra of
Electron-Phonon Interactions in Metals (Kluwer Academic Publishers, Am-sterdam 1995) 194, 226
47. F. Nizzoli and J. R. Sanderock : Dynamical Properties of Solids, Vol. 6 (North-Holland, Amsterdam 1990) 194, 226
48. R. Rohlsberger, W. Sturhahn, T. S. Toellner, K. W. Quast, P. Hession, M. Hu,J. Sutter, and E. E. Alp : J. Appl. Phys. 86, 584 (1999) 194, 195, 196, 197, 203, 204
49. H. R. Schober and P. H. Dederichs, in : Phonon States of Elements, ElectronStates and Fermi Surfaces of Alloys, ed. by K. H. Hellwege and J. L. Olsen,Landolt Bornstein, New Series, III/13a (Springer, Berlin 1981) 196, 198, 202, 212
50. B. Fak and B. Dorner : Institut Laue Langevin Technical Report No.92FA008S, 1992 (unpublished) 196
51. B. Fultz, C. C. Ahn, E. E. Alp, W. Sturhahn, and T. S. Toellner : Phys. Rev.Lett. 79, 937 (1997) 196, 197, 198, 200
52. H. R. Glyde and E. C. Svensson, in : Methods of Experimental Physics, Vol.23 B, edited by D. L. Price and K. Skold (Academic Press, New York 1987) 196
53. B. Dorner : Coherent Inelastic Neutron Scattering in Lattice Dynamics(Springer, New York 1982) 196
54. C. Masciovecchio, G. Monaco, G. Ruocco, F. Sette, A. Cunsolo, M. Krisch,A. Mermet, M. Soltwisch, and R. Verbeni : Phys. Rev. Lett. 80, 544 (1998) 196
55. E. Bonetti, L. Pasquini, E. Sampaolesi, A. Deriu, and G. Cicognani : J. Appl.Phys. 88, 4571 (2000) 198
56. H. Frase, B. Fultz, and J. L. Robertson : Phys. Rev. B 57, 898 (1998) 198, 20057. B. Fultz, L. Anthony, L. J. Nagel, R. M. Nicklow, and S. Spooner : Phys. Rev.
B 52, 3315 (1995) 19858. B. Fultz, J. L. Robertson, T. A. Stephens, L. J. Nagel, and S. Spooner : J.
Appl. Phys. 79, 8318 (1996) 19859. U. Stuhr, H. Wipf, K. H. Andersen, and H. Hahn : Phys. Rev. Lett. 81, 1449
(1998) 19860. J. Trampenau, K. Bauszuz, W. Petry, and U. Herr : Nanostruct. Mater. 6, 551
(1995) 19861. A. B. Papandrew, A. F. Yue, B. Fultz, I. Halevy, W. Sturhahn, T. S. Toellner,
E. E Alp, and H. K. Mao : Phys. Rev. B 69, 144301 (2004) 19862. L. Pasquini, A. Barla, A. I. Chumkov, O. Leupold, R. Ruffer, A. Deriu, and
E. Bonetti : Phys. Rev. B 66, 073410 (2002) 198, 199, 20063. A. Kara and T. S. Rahman : Phys. Rev. Lett. 81, 1453 (1998) 198, 20064. R. Meyer, L. J. Lewis, S. Prakash, and P. Entel : Phys. Rev. B 68, 104303
(2003) 198, 20365. D. Y. Sun, X. G. Gong, and X. Q. Wang : Phys. Rev. B 63, 193412 (2001) 198, 20066. D. Wolf, J. Wang, S. R. Phillpot, and H. Gleiter : Phys. Rev. Lett. 74, 4686
(1995) 198
References 229
67. C. G. Granqvist and R. A. Buhrman : J. Appl. Phys. 47, 2200 (1976) 19868. P. M. Derlet, R. Meyer, L. J. Lewis, U. Stuhr, and H. V. Swygenhoven : Phys.
Rev. Lett. 87, 205501 (2001) 20069. R. Ruffer and A. I. Chumakov : Hyperfine Interact. 97/98, 589 (1996) 20170. E. E. Alp, W. Sturhahn, and T. S. Toellner : Hyperfine Interact. 135, 295
(2001) and J. Phys.: Condens. Matter 13, 7645 (2001) 202, 21371. J. Jackle in : Amorphous Solids - Low Temperature Properties, edited by
W. A. Philips (Springer, Berlin 1981) 203, 204, 20972. W. A. Phillips (ed.) : Amorphous Solids – Low-Temperature Properties
(Springer, Berlin 1981) 20373. W. Schirmacher, G. Diezemann, and C. Ganter : Phys. Rev. Lett. 81, 136
(1998) 203, 204, 20974. W. Schirmacher, G. Diezemann, and C. Ganter : Physica B 284, 1147 (2000) 203, 20475. J. B. Suck and H. Rudin, in : Glassy metals II - Topics in Applied Physics
53, ed. H. Beck and H. J. Guntherodt, Topics in Applied Physics, Vol. 53(Springer, New York 1983) 203, 206, 225, 226
76. T. Ruckert, J. Tappert, R. A. Brand, and W. Keune : J. Magn. Magn. Mater.165, 411 (1997) 204
77. T. Ruckert, W. Keune, B. Sahoo, W. Sturhahn, T. S. Toellner, E. E. Alp, andR. Rohlsberger : Hyperfine Interact. 144/145, 65 (2003) 205, 206, 207
78. J. P. Eymery, A. Findiki, R. Krishnan, M. Tessier, and J. P. Vitton : Phys.Rev. B 38, 11931 (1988) 204
79. N. Heiman, K. Lee, and R. J. Potter : J. Appl. Phys. 47, 2634 (1976) 20480. M. Ghafari, U. Gonser, H. G. Wagner, and M. Naka : Nucl. Instrum. Methods
199, 197 (1982) 20481. K. M. Unruh and C. L. Chien : Phys. Rev. B 30 4968 (1984) 20482. W. Keune : private communication (2002) 20583. W. Keune, T. Ruckert, B. Sahoo, W. Sturhahn, T. S. Toellner, E. E. Alp, and
R. Rohlsberger : J. Phys. : Condensed Matter 16, 379 (2004) 20784. W. Kress : Phonon Dispersion Curves, One Phonon Density of States and
Impurity Vibrations of Metallic Systems, Physics Data Vol. 26-1 (Fachinfor-mationszentrum Karlsruhe, Karlsruhe, Germany, 1987) 205
85. J. A. Krumhansl and G. R. Barsch : Proc. of the Internat. Conf. on MartensiticTransformations 1992, p. 25 (Monterey Inst. of Advanced Studies, Carmel1992) 208
86. S. M. Shapiro, B. X. Yang, G. Shirane, Y. Noda, and L. E. Tanner : Phys.Rev. Lett. 62 1298 (1989) 207
87. M. Matsui, H. Yamada, and K. Adachi : J. Phys. Soc. Jpn. 48, 2161 (1980) 208, 20988. E. F. Wassermann in : Ferromagnetic Materials, edited by K. H. J. Buschow
and E. P. Wohlfarth (North Holland, Amsterdam 1990) 20889. F. E. Fujita in : Physics of New Materials, edited by F. E. Fujita (Springer,
Berlin 1994) 20890. N. Wiele, H. Franz, and W. Petry : Physica B 263-264, 716 (1999) 20991. S. R. Elliott : Physics of Amorphous Materials (Longmans, New York 1990) 20992. S. N. Taraskin, Y. L. Loh, G. Natarajan, and S. R. Elliott : Phys. Rev. Lett.
86, 1255 (2001) 209

230 5 Inelastic Nuclear Resonant Scattering
93. V. V. Struzhkin, H.-K. Mao, J. Hu, M. Schwoerer-Bohning, J. Shu, R. J. Hem-ley, W. Sturhahn, M. Y. Hu, E. E. Alp, P. Eng, and G. Shen : Phys. Rev. Lett.87, 255501 (2001) 210, 216
94. A. A. Maradudin, in : Solid State Physics, edited by F. Seitz and D. Turnbull(Academic Press, New York, 1966) 210
95. M. Seto, Y. Kobayashi, S. Kitao, R. Haruki, T. Mitsui, Y. Yoda, S. Nasu, andS. Kikuta : Phys. Rev. B 61, 11420 (2000) 210, 211
96. P. D. Mannheim : Phys. Rev. 165, 1011 (1968) 21097. P. D. Mannheim and S. S. Cohen : Phys. Rev. B 4, 3748 (1971) 21098. P. D. Mannheim : Phys. Rev. B 5, 745 (1972) 21099. W. Sturhahn, R. Rohlsberger, E. E. Alp, T. Ruckert, H. Schror, and W. Ke-
une : J. Magn. Magn. Mater. 198-199, 590 (1999) 212100. M. Y. Hu, W. Sturhahn, T. S. Toellner, P. D. Mannheim, D. E. Brown, J.
Zhao, and E. E. Alp : Phys. Rev. B 67, 094304 (2003) 212, 213, 214, 219101. G. Simmons and H. Wang : Single Crystal Elastic Constants and Calculated
Aggregate Properties (MIT Press, Cambridge 1971) 214102. A. M. Dziewonski and D. L. Anderson : Phys. Earth Planet. Inter. 25, 297
(1981) 215, 218103. P. Soderlind, J. A. Moriarty, J. M. Wills : Phys. Rev. B 53, 14063 (1996) 215104. C. S. Yoo, J. Akella, A. J. Campbell, H. K. Mao, and R. J. Hemley : Science
270, 1473 (1995) 215105. K. C. Creager : Nature 356, 309 (1992) 215106. L. Stixrude and R. E. Cohen : Science 267, 1972 (1995) 215107. R. Lubbers : PhD Thesis (Universitat Paderborn, 2000) 215108. G. Wortmann, K. Rupprecht, and H. Giefers : Hyperfine Interact. 144/145,
103 (2002) 216, 219109. H. Giefers, R. Lubbers, K. Rupprecht, G. Wortmann, D. Alfe, and A. I. Chu-
makov : High Press. Res. 22, 451 (2002) 216, 219110. R. Lubbers, H. F. Grunsteudel, A. I. Chumakov, and G. Wortmann : Science
287, 1250 (2000) 216, 219111. H. K. Mao, J. Xu, V. V. Struzhkin, J. Shu, R. J. Hemley, W. Sturhahn,
M. Y. Hu, E. E. Alp, L. Vocadlo, D. Alfe, G. D. Price, M. J. Gillan,M. Schwoerer-Bohning, D. Hausermann, P. Eng, G. Shen, H. Giefers,R. Lubbers, and G. Wortmann : Science 292, 914 (2001) 216, 217, 218
112. H. K. Mao, P. M. Bell, J. Shaner, and D. Steinberg : J. Appl. Phys. 49, 3276(1978) 216
113. H. K. Mao and Y. Wu and L. C. Chen and J. Shu, and A. P. Jephcoat :J. Geophys. Res. 95, 21737 (1990) 216
114. L. Vocadlo, J. Brodholt, D. Alfe, and G. D. Price : Geophys. Res. Lett. 26,1231 (1999) 216
115. G. Steinle-Neumann, L. Stixrude, and R. E. Cohen : Phys. Rev. B 60, 791(1999) 216
116. G. Fiquet, J. Badro, F. Guyot, H. Requardt, and M. Krisch : Science 291, 468(2001) 218
117. F. Birch, in : Solids under Pressure, edited by W. Paul and D. M. Warschauer(McGraw-Hill, New York 1963), pp. 137 - 162 218
118. W. Sturhahn : private communication (2003) 218
References 231
119. H. R. Wenk, S. Matthies, R. J. Hemley, H. K. Mao, and J. Shu : Nature 405,1044 (2000) 219
120. J. T. Sage, C. Paxson, G. R. A. Wyllie, W. Sturhahn, S. M. Durbin,P. M. Champion, E. E. Alp, and W. R. Scheidt : J. Phys.: Condens. Mat-ter 13, 7707 (2001) 219, 220, 221, 222, 224, 226
121. B. K. Rai, S. M. Durbin, E. W. Prohofsky, J. T. Sage, M. K. Ellison,W. R. Scheidt, W. Sturhahn, and E. E. Alp : Phys. Rev. E 66, 051904 (2002) 219, 220, 221, 224
122. M. Perutz : Nature 228, 726 (1970) 219123. B. K. Rai, S. M. Durbin, E. W. Prohofsky, J. T. Sage, M. K. Ellison, A. Roth,
W. R. Scheidt, W. Sturhahn, and E. E. Alp : J. Am. Chem. Soc. 125, 6927(2003) 220, 221, 224
124. R. H. Austin, M. W. Roberson, and P. Mansky : Phys. Rev. Lett. 62, 1912(1989) 220
125. L. Zhu, J. T. Sage, and P. M. Champion : Science 226, 629 (1994) 220126. B. K. Rai, S. M. Durbin, E. W. Prohofsky, J. T. Sage, G. R. A. Wyllie,
W. R. Scheidt, W. Sturhahn, and E. E. Alp : Biophys. J. 82, 2951 (2002) 220, 224127. K. Achterhold , C. Keppler, U. van Burck, W. Potzel, P. Schindelmann,
E. W. Knapp, B. Melchers, A. I. Chumakov, A. Q. R. Baron, R. Ruffer, andF. Parak : European Biophys. J. Lett. 25, 43 (1996) 220, 226
128. J. T. Sage, S. M. Durbin, W. Sturhahn, D. C. Wharton, P. M. Champion,P. M. Hession, J. P. Sutter, and E. E. Alp : Phys. Rev. Lett. 86, 4966 (2001) 220, 224, 226
129. H. Paulsen, H. Winkler, A. X. Trautwein, H. Grunsteudel, V. Rusanov, andH. Toftlund : Phys. Rev. B 59, 975 (1999) 221, 224
130. H. J. Lipkin : Ann. Phys. 18, 182 (1962) 223131. T. S. Rush, P. M. Kozlowski, C. A. Piffat, R. Kumble, M. Z. Zgierski, and
T. G. Spiro : J. Phys. Chem. B 104, 5020 (2000) 224132. B. Delley, J. Schefer, and Th. Woike : J. Chem. Phys. 107, 10067 (1997) 225133. P. Gutlich, A. Hauser, and H. Spiering : Angew. Chem. 106, 2109 (1994) 225134. P. Bruesch : Phonons: Theory and Experiment II (Springer, Berlin 1985) 225135. N. W. Ashcroft and N. D. Mermin : Solid State Physics (Holt-Saunders,
Philadelphia 1976) 225136. R. A. Brand, G. Coddens, A. I. Chumakov, and Y. Calvayrac : Phys. Rev. B
59, 14145 (1999) 226137. C. Keppler, K. Achterhold, A. Ostermann, U. van Burck, W. Potzel, A. I. Chu-
makov, A. Q. R. Baron, R. Ruffer, and F. Parak : European Biophys. J. Lett.25, 221 (1996) 226


![arXiv:1605.05541v1 [hep-ph] 18 May 20161 Introduction Deep-inelastic scattering provides one of the most direct methods to measure the strong coupling constant from precision data](https://static.fdocument.org/doc/165x107/60bb6787511ed5109750f235/arxiv160505541v1-hep-ph-18-may-2016-1-introduction-deep-inelastic-scattering.jpg)