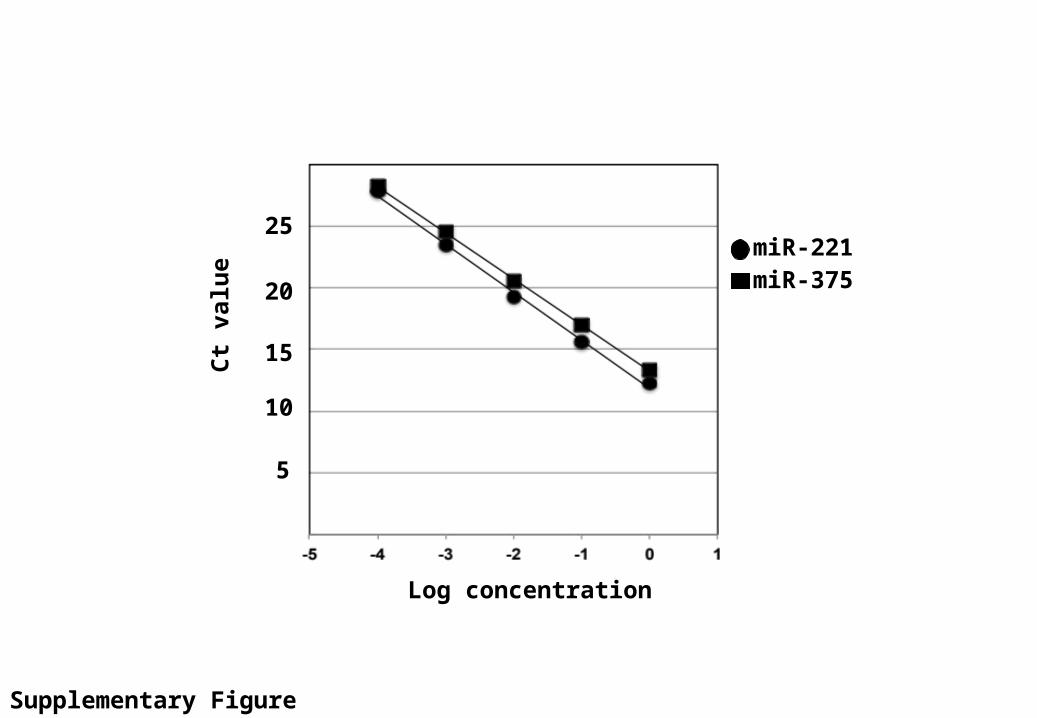
5 15 25 20 10 Ct value Log concentration miR-375 miR-221 Supplementary Figure S1.
5
5 15 25 20 10 Ct value Log concentration miR-375 miR-221 Supplementary Figure S1
-
Upload
lorin-hoover -
Category
Documents
-
view
229 -
download
4
Transcript of 5 15 25 20 10 Ct value Log concentration miR-375 miR-221 Supplementary Figure S1.
5
15
25
20
10
Ct
valu
e
Log concentration
miR-375miR-221
Supplementary Figure S1
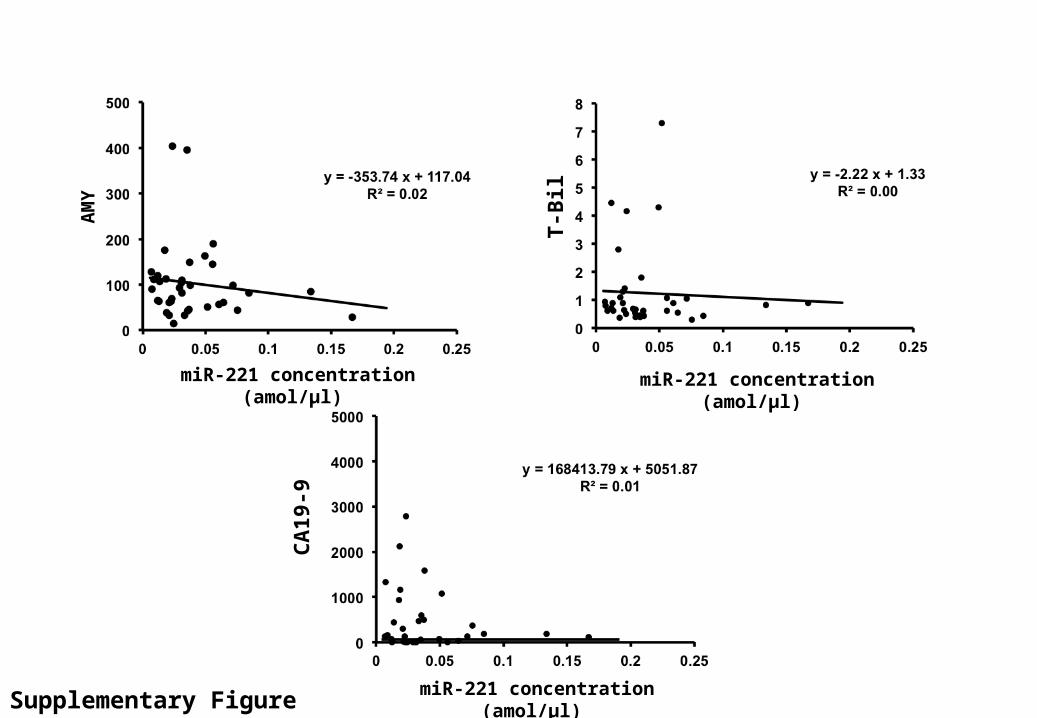
Supplementary Figure S2
T-B
il
CA
19-9
AM
Y
miR-221 concentration (amol/μl) miR-221 concentration (amol/μl)
miR-221 concentration (amol/μl)
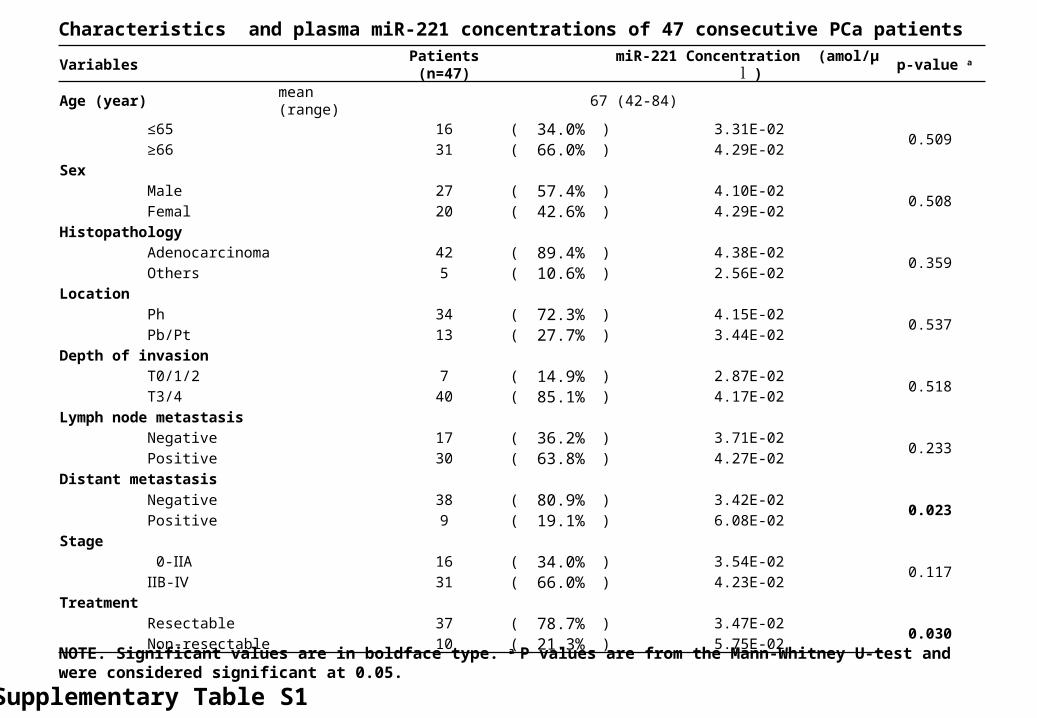
Variables Patients (n=47) miR-221 Concentration (amol/μ l ) p-value a
Age (year) mean (range) 67 (42-84)
≤65 16 ( 34.0% ) 3.31E-020.509
≥66 31 ( 66.0% ) 4.29E-02
Sex
Male 27 ( 57.4% ) 4.10E-020.508
Femal 20 ( 42.6% ) 4.29E-02
Histopathology
Adenocarcinoma 42 ( 89.4% ) 4.38E-020.359
Others 5 ( 10.6% ) 2.56E-02
Location
Ph 34 ( 72.3% ) 4.15E-020.537
Pb/Pt 13 ( 27.7% ) 3.44E-02
Depth of invasion
T0/1/2 7 ( 14.9% ) 2.87E-020.518
T3/4 40 ( 85.1% ) 4.17E-02
Lymph node metastasis
Negative 17 ( 36.2% ) 3.71E-020.233
Positive 30 ( 63.8% ) 4.27E-02
Distant metastasis
Negative 38 ( 80.9% ) 3.42E-020.023
Positive 9 ( 19.1% ) 6.08E-02
Stage
0- AⅡ 16 ( 34.0% ) 3.54E-020.117
ⅡB-Ⅳ 31 ( 66.0% ) 4.23E-02
Treatment
Resectable 37 ( 78.7% ) 3.47E-020.030
Non-resectable 10 ( 21.3% ) 5.75E-02
Characteristics and plasma miR-221 concentrations of 47 consecutive PCa patients
NOTE. Significant values are in boldface type. a P values are from the Mann-Whitney U-test and were considered significant at 0.05.
Supplementary Table S1
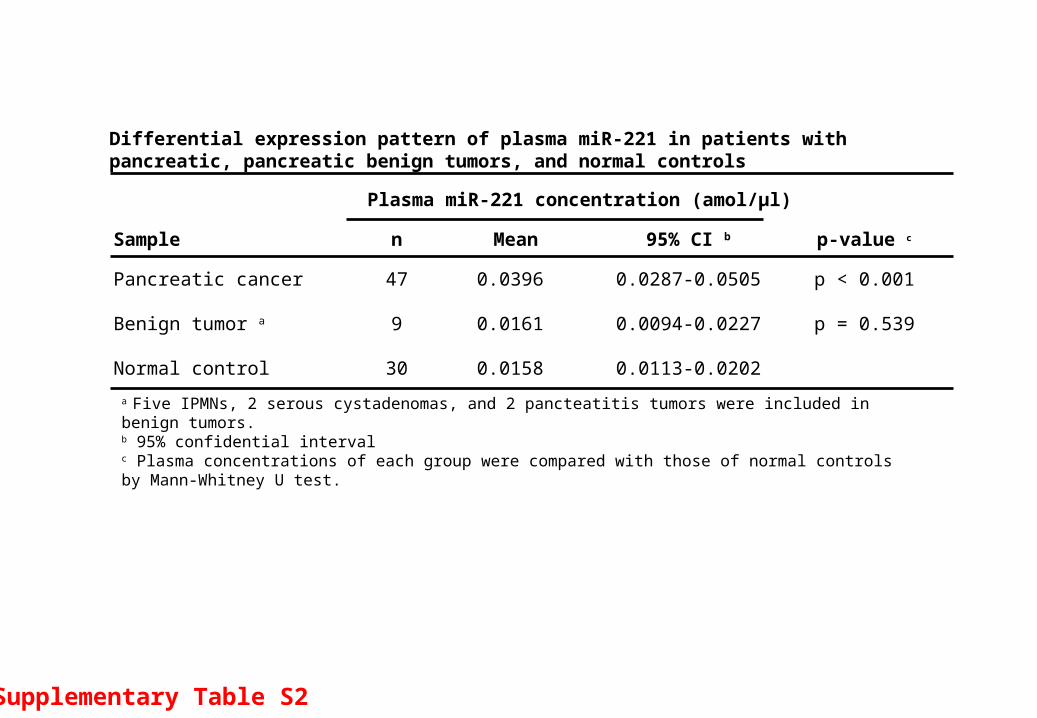
Supplementary Table S2
Plasma miR-221 concentration (amol/μl)
Sample n Mean 95% CI b p-value c
Pancreatic cancer 47 0.0396 0.0287-0.0505 p < 0.001
Benign tumor a 9 0.0161 0.0094-0.0227 p = 0.539
Normal control 30 0.0158 0.0113-0.0202
a Five IPMNs, 2 serous cystadenomas, and 2 pancteatitis tumors were included in benign tumors.b 95% confidential intervalc Plasma concentrations of each group were compared with those of normal controls by Mann-Whitney U test.
Differential expression pattern of plasma miR-221 in patients with pancreatic, pancreatic benign tumors, and normal controls
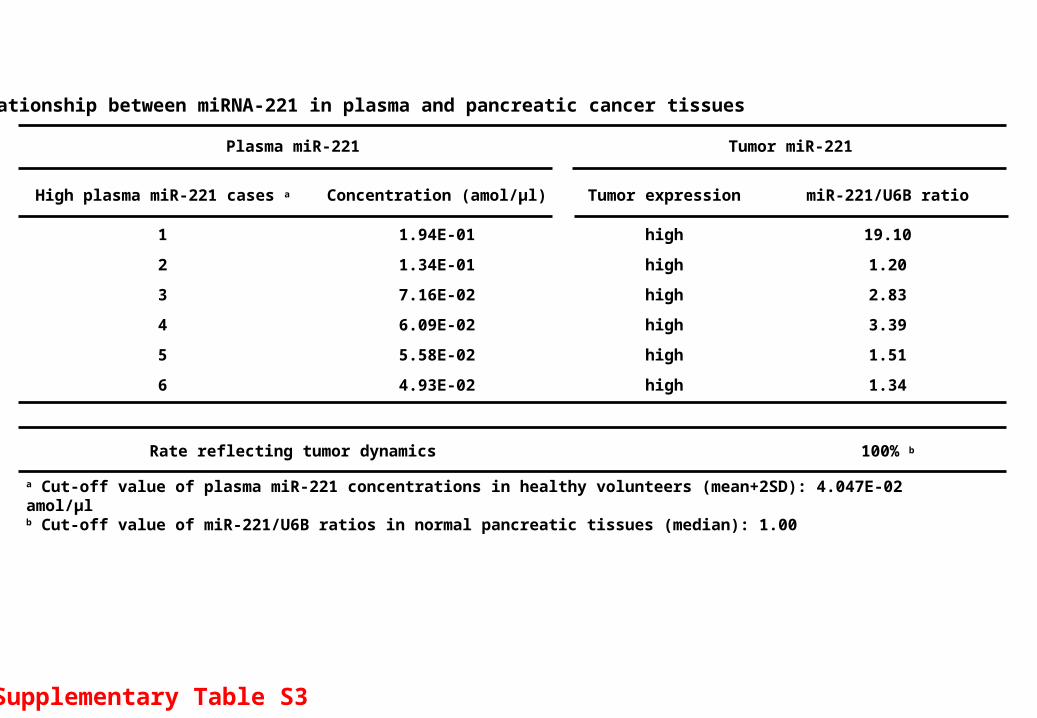
Plasma miR-221 Tumor miR-221
High plasma miR-221 cases a Concentration (amol/μl) Tumor expression miR-221/U6B ratio
1 1.94E-01 high 19.10
2 1.34E-01 high 1.20
3 7.16E-02 high 2.83
4 6.09E-02 high 3.39
5 5.58E-02 high 1.51
6 4.93E-02 high 1.34
Rate reflecting tumor dynamics 100% b
a Cut-off value of plasma miR-221 concentrations in healthy volunteers (mean+2SD): 4.047E-02 amol/μlb Cut-off value of miR-221/U6B ratios in normal pancreatic tissues (median): 1.00
Relationship between miRNA-221 in plasma and pancreatic cancer tissues
Supplementary Table S3