Primary Cell e Newsletter Issue 18 (jun 2016) Cell Applications
RESEARCH ARTICLE
Δ40p53α suppresses tumor cell proliferation and induces cellularsenescence in hepatocellular carcinoma cellsAkinobu Ota1, Haruhisa Nakao2,*, Yumi Sawada2, Sivasundaram Karnan1, MdWahiduzzaman1, Tadahisa Inoue2,Yuji Kobayashi2, Takaya Yamamoto2, Norimitsu Ishii2, Tomohiko Ohashi2, Yukiomi Nakade2, Ken Sato2,Kiyoaki Itoh2, Hiroyuki Konishi1, Yoshitaka Hosokawa1 and Masashi Yoneda2
ABSTRACTSplice variants of certain genes impact on genetic biodiversity inmammals. The tumor suppressor TP53 gene (encoding p53) plays animportant role in the regulation of tumorigenesis in hepatocellularcarcinoma (HCC). Δ40p53α is a naturally occurring p53 isoform thatlacks the N-terminal transactivation domain, yet little is known aboutthe role of Δ40p53α in the development of HCC. Here, we first reporton the role of Δ40p53α in HCC cell lines. In the TP53+/Δ40 cell clones,clonogenic activity and cell survival dramatically decreased, whereasthe percentage of senescence-associated β-galactosidase (SA-β-gal)-positive cells and p21 (also known as WAF1, CIP1 andCDKN1A) expression significantly increased. These observationswere clearly attenuated in the TP53+/Δ40 cell clones after Δ40p53αknockdown. In addition, exogenous Δ40p53 expression significantlysuppressed cell growth in HCC cells with wild-type TP53, and in thosethat were mutant or null for TP53. Notably, Δ40p53α-induced tumorsuppressor activity was markedly attenuated in cells expressing thehot-spot mutant Δ40p53α-R175H, which lacks the transcription factoractivity of p53. Moreover, Δ40p53α expression was associated withincreased full-length p53 protein expression. These findings enhancethe understanding of the molecular pathogenesis of HCC and showthat Δ40p53α acts as an important tumor suppressor in HCC cells.
KEYWORDS: Δ40p53, Gene targeting, Liver cancer, Tumorigenesis,Gene expression
INTRODUCTIONHepatocellular carcinoma (HCC), one of the most frequentmalignancies worldwide (Lozano et al., 2012), commonlydevelops in response to continuous microenvironmental stresses,including chemical exposure, chronic inflammation from hepatitisviral infection, tissue remodeling in the liver, and a high-fat diet (Liuet al., 2014; Nishida and Goel, 2011). As an initiating oncogenicevent in HCC, the disruption of the TP53 tumor suppressor gene(encoding p53) has been shown to be closely associated withhepatocarcinogenesis. Deletion of the equivalent gene in mice,Trp53, results in the development of liver tumors in a significant
number of mice (Katz et al., 2012; Morris et al., 2012), whilerestoring p53 in a murine liver carcinoma model limits tumor cellgrowth by mediating cellular senescence (Xue et al., 2007). Thus,accumulating evidence implicates TP53 gene dysfunction in thedevelopment of HCC.
In general, splice variants of certain genes play an important rolein biodiversity. It is known that the TP53 gene potentially encodes atleast 12 p53 isoforms, in which four different N-terminal p53 forms(full-length, Δ40, Δ133 and Δ160) are combined with three differentC-terminal domains (α, β and γ) (Marcel et al., 2011). Full-length(FL)-p53 protein (also called TAp53α) is the canonical p53 protein,while Δ40p53α (also known as p53 or p47), a p53 isoform that lacksthe 39 N-terminal amino acids corresponding to the firsttransactivation domain (TAD-I) of FL-p53, is translated from anin-frame second AUG at nucleotides 252–254 of TP53 mRNAthrough a second internal ribosome entry site (Olivares-Illana andFåhraeus et al., 2010;Wei et al., 2012). Recent studies demonstratedthe biological effects of Δ40p53α in both humans and mice.Transgenic mice overexpressing p44, the mouse homolog ofΔ40p53α, showed obvious signs of aging and a shorter lifespan(Maier et al., 2004; Qian and Chen, 2013). It has been reported thatΔ40p53α exerts anti-cancer properties in human lung cancer andmelanoma cells (Yin et al., 2002; Candeias et al., 2006; Takahashiet al., 2014). In contrast, Courtois et al. reported that Δ40p53αcounteracts growth suppression via FL-p53 in mouse fibroblasts(Courtois et al., 2002). Thus, the biological function of Δ40p53αpotentially varies according to cell type. Although accumulatingevidence has implicated Δ40p53α in aging and/or tumorsuppression, little is known about the involvement of Δ40p53α inthe development of HCC.
In the present study, we are the first to report the tumor suppressorrole of Δ40p53α (hereafter called Δ40p53) in the development ofHCC. We also discuss a possible molecular mechanism underlyingΔ40p53-induced tumor suppression and senescence.
RESULTSEstablishment of TP53+/Δ40 HepG2 cell clones expressingΔ40p53We first performed gene targeting of wild-type (WT) TP53 in thehuman HepG2 hepatoma cell line and generated isogenic cellclones harboring exon 2 deletions of TP53 to induce endogenousΔ40p53 expression using adeno-associated virus (AAV)-basedmethodology (Fig. S1A), as previously observed in colon cancerHCT116 TP53−/− cell clones previously (Thomas et al., 2013). Weestablished two independent heterozygous exon 2-deleted TP53HepG2 cell clones (denoted TP53+/Δ40 #1 and #2). Gene targetingwas successfully confirmed by PCR amplification of the targetedgenomic locus (Fig. S1B). In addition, we isolated cell clones thatunderwent random integration (RI) of the targeting vectors withinReceived 24 April 2016; Accepted 29 November 2016
1Department of Biochemistry, Aichi Medical University School of Medicine,Nagakute, Aichi, Japan. 2Division of Hepatology and Pancreatology, Department ofInternal Medicine, Aichi Medical University School of Medicine, Nagakute, Aichi,Japan.
*Author for correspondence ([email protected])
H.N., 0000-0003-1794-0886
This is an Open Access article distributed under the terms of the Creative Commons AttributionLicense (http://creativecommons.org/licenses/by/3.0), which permits unrestricted use,distribution and reproduction in any medium provided that the original work is properly attributed.
614
© 2017. Published by The Company of Biologists Ltd | Journal of Cell Science (2017) 130, 614-625 doi:10.1242/jcs.190736
Journal
ofCe
llScience
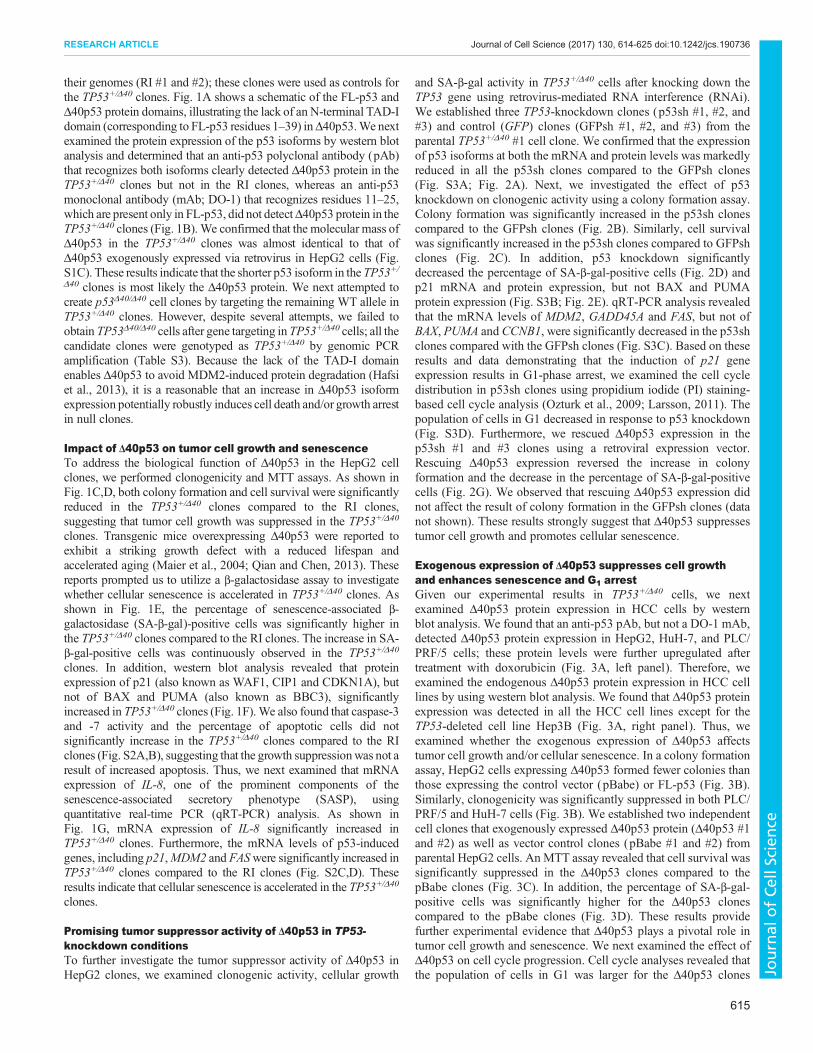
their genomes (RI #1 and #2); these clones were used as controls forthe TP53+/Δ40 clones. Fig. 1A shows a schematic of the FL-p53 andΔ40p53 protein domains, illustrating the lack of an N-terminal TAD-Idomain (corresponding to FL-p53 residues 1–39) inΔ40p53.We nextexamined the protein expression of the p53 isoforms by western blotanalysis and determined that an anti-p53 polyclonal antibody (pAb)that recognizes both isoforms clearly detected Δ40p53 protein in theTP53+/Δ40 clones but not in the RI clones, whereas an anti-p53monoclonal antibody (mAb; DO-1) that recognizes residues 11–25,which are present only in FL-p53, did not detectΔ40p53 protein in theTP53+/Δ40 clones (Fig. 1B). We confirmed that the molecular mass ofΔ40p53 in the TP53+/Δ40 clones was almost identical to that ofΔ40p53 exogenously expressed via retrovirus in HepG2 cells (Fig.S1C). These results indicate that the shorter p53 isoform in theTP53+/Δ40 clones is most likely the Δ40p53 protein. We next attempted tocreate p53Δ40/Δ40 cell clones by targeting the remaining WT allele inTP53+/Δ40 clones. However, despite several attempts, we failed toobtain TP53Δ40/Δ40 cells after gene targeting in TP53+/Δ40 cells; all thecandidate clones were genotyped as TP53+/Δ40 by genomic PCRamplification (Table S3). Because the lack of the TAD-I domainenables Δ40p53 to avoid MDM2-induced protein degradation (Hafsiet al., 2013), it is a reasonable that an increase in Δ40p53 isoformexpression potentially robustly induces cell death and/or growth arrestin null clones.
Impact of Δ40p53 on tumor cell growth and senescenceTo address the biological function of Δ40p53 in the HepG2 cellclones, we performed clonogenicity and MTT assays. As shown inFig. 1C,D, both colony formation and cell survival were significantlyreduced in the TP53+/Δ40 clones compared to the RI clones,suggesting that tumor cell growth was suppressed in the TP53+/Δ40
clones. Transgenic mice overexpressing Δ40p53 were reported toexhibit a striking growth defect with a reduced lifespan andaccelerated aging (Maier et al., 2004; Qian and Chen, 2013). Thesereports prompted us to utilize a β-galactosidase assay to investigatewhether cellular senescence is accelerated in TP53+/Δ40 clones. Asshown in Fig. 1E, the percentage of senescence-associated β-galactosidase (SA-β-gal)-positive cells was significantly higher inthe TP53+/Δ40 clones compared to the RI clones. The increase in SA-β-gal-positive cells was continuously observed in the TP53+/Δ40
clones. In addition, western blot analysis revealed that proteinexpression of p21 (also known as WAF1, CIP1 and CDKN1A), butnot of BAX and PUMA (also known as BBC3), significantlyincreased in TP53+/Δ40 clones (Fig. 1F).We also found that caspase-3and -7 activity and the percentage of apoptotic cells did notsignificantly increase in the TP53+/Δ40 clones compared to the RIclones (Fig. S2A,B), suggesting that the growth suppressionwas not aresult of increased apoptosis. Thus, we next examined that mRNAexpression of IL-8, one of the prominent components of thesenescence-associated secretory phenotype (SASP), usingquantitative real-time PCR (qRT-PCR) analysis. As shown inFig. 1G, mRNA expression of IL-8 significantly increased inTP53+/Δ40 clones. Furthermore, the mRNA levels of p53-inducedgenes, including p21,MDM2 and FASwere significantly increased inTP53+/Δ40 clones compared to the RI clones (Fig. S2C,D). Theseresults indicate that cellular senescence is accelerated in the TP53+/Δ40
clones.
Promising tumor suppressor activity of Δ40p53 in TP53-knockdown conditionsTo further investigate the tumor suppressor activity of Δ40p53 inHepG2 clones, we examined clonogenic activity, cellular growth
and SA-β-gal activity in TP53+/Δ40 cells after knocking down theTP53 gene using retrovirus-mediated RNA interference (RNAi).We established three TP53-knockdown clones (p53sh #1, #2, and#3) and control (GFP) clones (GFPsh #1, #2, and #3) from theparental TP53+/Δ40 #1 cell clone. We confirmed that the expressionof p53 isoforms at both the mRNA and protein levels was markedlyreduced in all the p53sh clones compared to the GFPsh clones(Fig. S3A; Fig. 2A). Next, we investigated the effect of p53knockdown on clonogenic activity using a colony formation assay.Colony formation was significantly increased in the p53sh clonescompared to the GFPsh clones (Fig. 2B). Similarly, cell survivalwas significantly increased in the p53sh clones compared to GFPshclones (Fig. 2C). In addition, p53 knockdown significantlydecreased the percentage of SA-β-gal-positive cells (Fig. 2D) andp21 mRNA and protein expression, but not BAX and PUMAprotein expression (Fig. S3B; Fig. 2E). qRT-PCR analysis revealedthat the mRNA levels of MDM2, GADD45A and FAS, but not ofBAX, PUMA and CCNB1, were significantly decreased in the p53shclones compared with the GFPsh clones (Fig. S3C). Based on theseresults and data demonstrating that the induction of p21 geneexpression results in G1-phase arrest, we examined the cell cycledistribution in p53sh clones using propidium iodide (PI) staining-based cell cycle analysis (Ozturk et al., 2009; Larsson, 2011). Thepopulation of cells in G1 decreased in response to p53 knockdown(Fig. S3D). Furthermore, we rescued Δ40p53 expression in thep53sh #1 and #3 clones using a retroviral expression vector.Rescuing Δ40p53 expression reversed the increase in colonyformation and the decrease in the percentage of SA-β-gal-positivecells (Fig. 2G). We observed that rescuing Δ40p53 expression didnot affect the result of colony formation in the GFPsh clones (datanot shown). These results strongly suggest that Δ40p53 suppressestumor cell growth and promotes cellular senescence.
Exogenous expression of Δ40p53 suppresses cell growthand enhances senescence and G1 arrestGiven our experimental results in TP53+/Δ40 cells, we nextexamined Δ40p53 protein expression in HCC cells by westernblot analysis. We found that an anti-p53 pAb, but not a DO-1 mAb,detected Δ40p53 protein expression in HepG2, HuH-7, and PLC/PRF/5 cells; these protein levels were further upregulated aftertreatment with doxorubicin (Fig. 3A, left panel). Therefore, weexamined the endogenous Δ40p53 protein expression in HCC celllines by using western blot analysis. We found that Δ40p53 proteinexpression was detected in all the HCC cell lines except for theTP53-deleted cell line Hep3B (Fig. 3A, right panel). Thus, weexamined whether the exogenous expression of Δ40p53 affectstumor cell growth and/or cellular senescence. In a colony formationassay, HepG2 cells expressing Δ40p53 formed fewer colonies thanthose expressing the control vector (pBabe) or FL-p53 (Fig. 3B).Similarly, clonogenicity was significantly suppressed in both PLC/PRF/5 and HuH-7 cells (Fig. 3B). We established two independentcell clones that exogenously expressed Δ40p53 protein (Δ40p53 #1and #2) as well as vector control clones (pBabe #1 and #2) fromparental HepG2 cells. AnMTT assay revealed that cell survival wassignificantly suppressed in the Δ40p53 clones compared to thepBabe clones (Fig. 3C). In addition, the percentage of SA-β-gal-positive cells was significantly higher for the Δ40p53 clonescompared to the pBabe clones (Fig. 3D). These results providefurther experimental evidence that Δ40p53 plays a pivotal role intumor cell growth and senescence. We next examined the effect ofΔ40p53 on cell cycle progression. Cell cycle analyses revealed thatthe population of cells in G1 was larger for the Δ40p53 clones
615
RESEARCH ARTICLE Journal of Cell Science (2017) 130, 614-625 doi:10.1242/jcs.190736
Journal
ofCe
llScience
Fig. 1. The cellular phenotype of TP53+/Δ40 HepG2 cells. (A) A schematic of the domain structures of the human p53 protein and the Δ40p53 isoform. Amonoclonal antibody, DO-1, recognizes the first TAD domain in p53 that is not present in Δ40p53. TAD, transactivation domain; PrD, proline-rich domain;DBD, DNA-binding domain; NLS, nuclear localization signal; OD, oligomerization domain; Reg, regulatory domain. (B) p53 protein levels were examinedby western blot (WB) analysis. We analyzed 5 μg of cell lysate by western blotting to detect p53 isoforms with an anti-p53 polyclonal antibody (poAb) or ananti-p53 monoclonal antibody DO-1. The HepG2 parental cells (P), RI clones (#1 and #2), and TP53+/Δ40 clones (#1 and #2) are shown. β-actin was used asan internal control. (C) A representative colony formation assay with HepG2 RI and TP53+/Δ40 clones; 200 were seeded in a 6-well plate. After 14 days, thecells were stained with Crystal Violet and imaged. Bar graphs represent the number of stained colonies. Data are presented as the mean±s.e.m. (n=6).(D) MTT analysis of the growth rate of HepG2 RI and TP53+/Δ40 clones. The optical density (595 nm) at each time point (day 0, 1, 3 and 5) is presented asthe mean±s.e.m. (n=4). *P<0.05; **P<0.005 compared to RI clone #1. (E) Analysis of cellular senescence using the SA-β-gal assay; 20,000 cells wereseeded in 12-well plates, and then incubated for 48 h. After incubation, the cells were stained for SA-β-gal to determine the β-gal activity. Representativeresult of SA-β-gal staining (taken at a magnification of ×100) is shown above. Bar graphs represent the percentage of SA-β-gal-positive cells. Data arepresented as the mean±s.e.m. (n=3). Scale bar: 200 µm. (F) Protein expression of p21, BAX, and PUMA. We analyzed 5 μg of the protein by westernblotting with an antibody specific to p21, BAX, and PUMA. β-actin was used as an internal control. After normalization to β-actin protein levels, the proteinlevels of p21 are expressed relative to the protein expression in the HepG2/RI #1 cells, which was arbitrarily defined as 1. The data are represented as themean±s.e.m. of three separate experiments. (G) qRT-PCR analysis of the gene expression levels of IL-8 in RI clone and HepG2/TP53+/Δ40 clones. Theprimers used for qRT-PCR are shown in Table S3. Relative gene expression levels are shown after normalization to GAPDH mRNA expression. The dataare expressed relative to the mRNA levels found in the corresponding sample of HepG2/RI clone #1 cells, which was arbitrarily defined as 1. The valuesshown represent the mean±s.e.m. (n=3).
616
RESEARCH ARTICLE Journal of Cell Science (2017) 130, 614-625 doi:10.1242/jcs.190736
Journal
ofCe
llScience
(Fig. 3E), and these clones were desensitized to serum-induced cellcycle progression (data not shown). These results suggest thatΔ40p53 may block cell cycle progression at G1. We then examined
the effect of Δ40p53 on p53 transcription factor activity (asmonitored by a Luciferase-based system) and TP53-induced geneexpression, and found that the mRNA and protein expression of p21
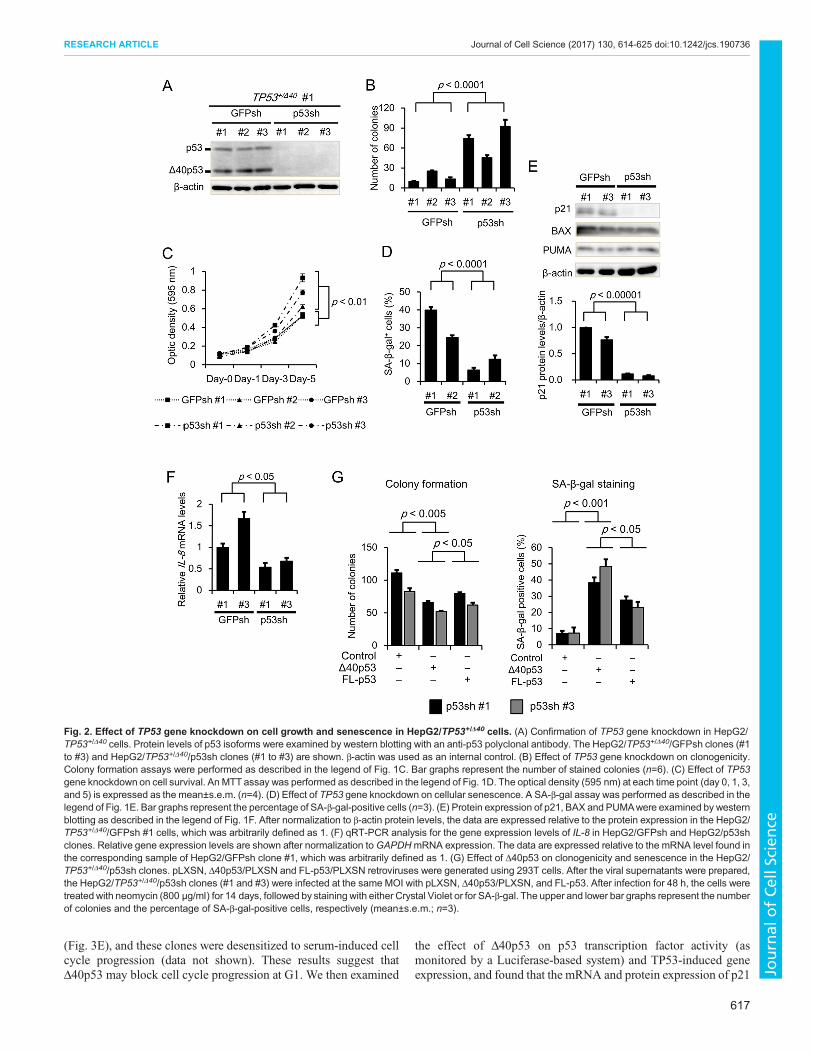
Fig. 2. Effect of TP53 gene knockdown on cell growth and senescence in HepG2/TP53+/Δ40 cells. (A) Confirmation of TP53 gene knockdown in HepG2/TP53+/Δ40 cells. Protein levels of p53 isoforms were examined by western blotting with an anti-p53 polyclonal antibody. The HepG2/TP53+/Δ40/GFPsh clones (#1to #3) and HepG2/TP53+/Δ40/p53sh clones (#1 to #3) are shown. β-actin was used as an internal control. (B) Effect of TP53 gene knockdown on clonogenicity.Colony formation assays were performed as described in the legend of Fig. 1C. Bar graphs represent the number of stained colonies (n=6). (C) Effect of TP53gene knockdown on cell survival. An MTT assay was performed as described in the legend of Fig. 1D. The optical density (595 nm) at each time point (day 0, 1, 3,and 5) is expressed as the mean±s.e.m. (n=4). (D) Effect of TP53 gene knockdown on cellular senescence. A SA-β-gal assay was performed as described in thelegend of Fig. 1E. Bar graphs represent the percentage of SA-β-gal-positive cells (n=3). (E) Protein expression of p21, BAX and PUMAwere examined by westernblotting as described in the legend of Fig. 1F. After normalization to β-actin protein levels, the data are expressed relative to the protein expression in the HepG2/TP53+/Δ40/GFPsh #1 cells, which was arbitrarily defined as 1. (F) qRT-PCR analysis for the gene expression levels of IL-8 in HepG2/GFPsh and HepG2/p53shclones. Relative gene expression levels are shown after normalization toGAPDHmRNA expression. The data are expressed relative to the mRNA level found inthe corresponding sample of HepG2/GFPsh clone #1, which was arbitrarily defined as 1. (G) Effect of Δ40p53 on clonogenicity and senescence in the HepG2/TP53+/Δ40/p53sh clones. pLXSN, Δ40p53/PLXSN and FL-p53/PLXSN retroviruses were generated using 293T cells. After the viral supernatants were prepared,the HepG2/TP53+/Δ40/p53sh clones (#1 and #3) were infected at the same MOI with pLXSN, Δ40p53/PLXSN, and FL-p53. After infection for 48 h, the cells weretreated with neomycin (800 μg/ml) for 14 days, followed by staining with either Crystal Violet or for SA-β-gal. The upper and lower bar graphs represent the numberof colonies and the percentage of SA-β-gal-positive cells, respectively (mean±s.e.m.; n=3).
617
RESEARCH ARTICLE Journal of Cell Science (2017) 130, 614-625 doi:10.1242/jcs.190736
Journal
ofCe
llScience
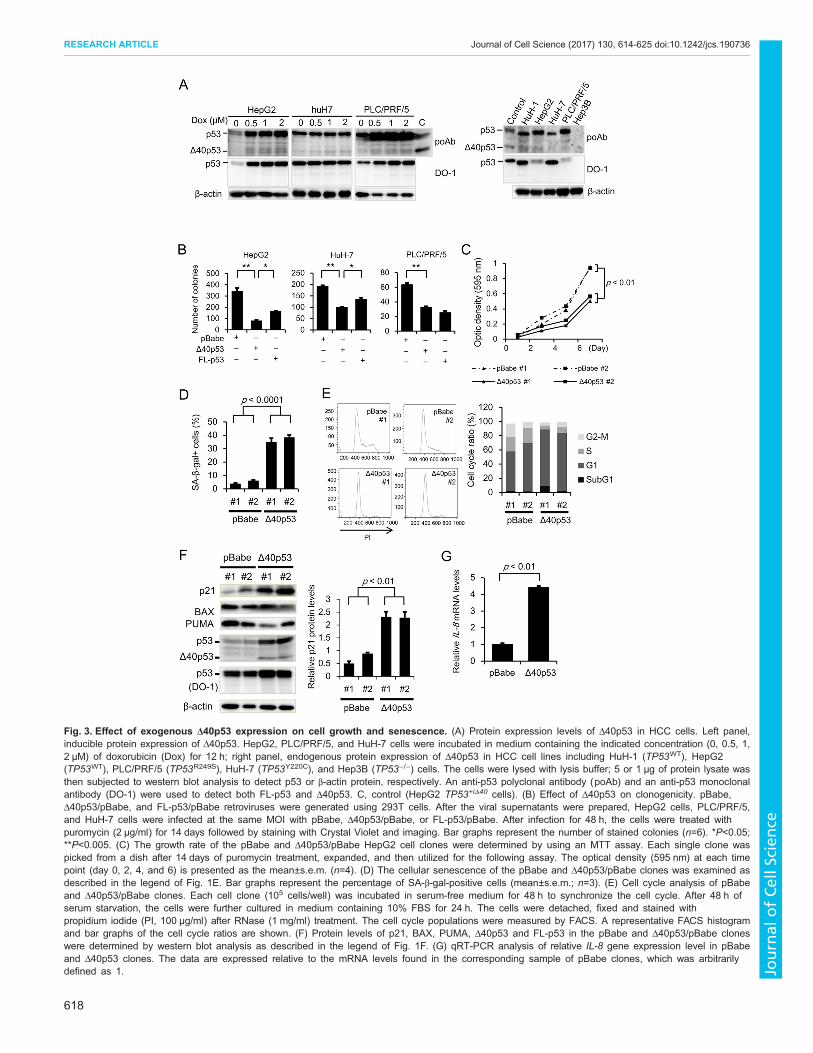
Fig. 3. Effect of exogenous Δ40p53 expression on cell growth and senescence. (A) Protein expression levels of Δ40p53 in HCC cells. Left panel,inducible protein expression of Δ40p53. HepG2, PLC/PRF/5, and HuH-7 cells were incubated in medium containing the indicated concentration (0, 0.5, 1,2 μM) of doxorubicin (Dox) for 12 h; right panel, endogenous protein expression of Δ40p53 in HCC cell lines including HuH-1 (TP53WT), HepG2(TP53WT), PLC/PRF/5 (TP53R249S), HuH-7 (TP53Y220C), and Hep3B (TP53−/−) cells. The cells were lysed with lysis buffer; 5 or 1 μg of protein lysate wasthen subjected to western blot analysis to detect p53 or β-actin protein, respectively. An anti-p53 polyclonal antibody (poAb) and an anti-p53 monoclonalantibody (DO-1) were used to detect both FL-p53 and Δ40p53. C, control (HepG2 TP53+/Δ40 cells). (B) Effect of Δ40p53 on clonogenicity. pBabe,Δ40p53/pBabe, and FL-p53/pBabe retroviruses were generated using 293T cells. After the viral supernatants were prepared, HepG2 cells, PLC/PRF/5,and HuH-7 cells were infected at the same MOI with pBabe, Δ40p53/pBabe, or FL-p53/pBabe. After infection for 48 h, the cells were treated withpuromycin (2 μg/ml) for 14 days followed by staining with Crystal Violet and imaging. Bar graphs represent the number of stained colonies (n=6). *P<0.05;**P<0.005. (C) The growth rate of the pBabe and Δ40p53/pBabe HepG2 cell clones were determined by using an MTT assay. Each single clone waspicked from a dish after 14 days of puromycin treatment, expanded, and then utilized for the following assay. The optical density (595 nm) at each timepoint (day 0, 2, 4, and 6) is presented as the mean±s.e.m. (n=4). (D) The cellular senescence of the pBabe and Δ40p53/pBabe clones was examined asdescribed in the legend of Fig. 1E. Bar graphs represent the percentage of SA-β-gal-positive cells (mean±s.e.m.; n=3). (E) Cell cycle analysis of pBabeand Δ40p53/pBabe clones. Each cell clone (105 cells/well) was incubated in serum-free medium for 48 h to synchronize the cell cycle. After 48 h ofserum starvation, the cells were further cultured in medium containing 10% FBS for 24 h. The cells were detached, fixed and stained withpropidium iodide (PI, 100 μg/ml) after RNase (1 mg/ml) treatment. The cell cycle populations were measured by FACS. A representative FACS histogramand bar graphs of the cell cycle ratios are shown. (F) Protein levels of p21, BAX, PUMA, Δ40p53 and FL-p53 in the pBabe and Δ40p53/pBabe cloneswere determined by western blot analysis as described in the legend of Fig. 1F. (G) qRT-PCR analysis of relative IL-8 gene expression level in pBabeand Δ40p53 clones. The data are expressed relative to the mRNA levels found in the corresponding sample of pBabe clones, which was arbitrarilydefined as 1.
618
RESEARCH ARTICLE Journal of Cell Science (2017) 130, 614-625 doi:10.1242/jcs.190736
Journal
ofCe
llScience
as well as the p53 transcription factor activity was significantlyincreased in the Δ40p53 cell clones (Fig. 3F; Fig. S4A,B). Similarly,mRNA expression level of IL-8 significantly increased in Δ40p53cell clone (Fig. 3G). Unexpectedly, FL-p53 protein expression wasfound to be higher in the Δ40p53 clones compared to the pBabeclones (Fig. 3F, see below). qRT-PCR analysis showed that themRNA expression of MDM2 and FAS, but not of BAX, PUMA,GADD45A and CCNB1, was significantly increased in the Δ40p53clones compared to the pBabe clones (Fig. S4C), indicating thatΔ40p53 exerts tumor suppressor activity by promoting TP53-induced gene expression.
Tumor suppressor activity of Δ40p53 and its mutantsIt has been reported that TP53 gene mutations impair p53-mediatedapoptosis and/or p53 transcription factor activity (Serrano et al.,1997; Cui et al., 2002). Thus, we decided to ascertain the effect ofΔ40p53 harboring a TP53 hot-spot missense mutation, R175H, onclonogenic activity and senescence in HepG2 cells. Theclonogenicity assay revealed that cells expressing WT Δ40p53formed fewer colonies; this reduction was significantly attenuated incells expressing Δ40p53-R175H (Fig. 4A). In addition, thepercentage of SA-β-gal-positive cells was significantly higheramong those expressingWT Δ40p53; this increase was attenuated incells expressing Δ40p53-R175H (Fig. 4B). We confirmed that bothp53 transcription factor activity and p21 protein expression weremarkedly increased in cells expressing WT-Δ40p53 compared tocontrol cells, but was not increased in those expressing Δ40p53-R175H (Fig. 4C,D). Furthermore, qRT-PCR analysis demonstratedthat Δ40p53-R175H failed to increase the mRNA levels of MDM2and FAS (Fig. 4E). These results suggest that Δ40p53-inducedtranscription is closely associated with the roles of Δ40p53 in tumorsuppression and/or cellular senescence.
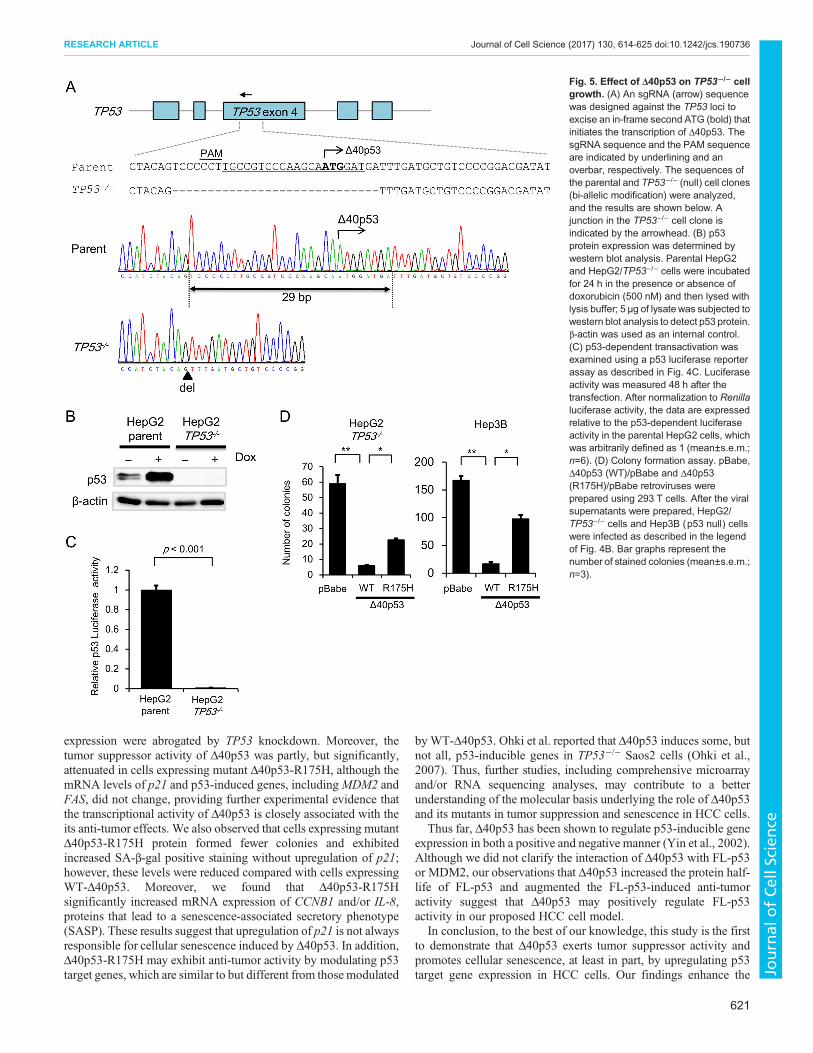
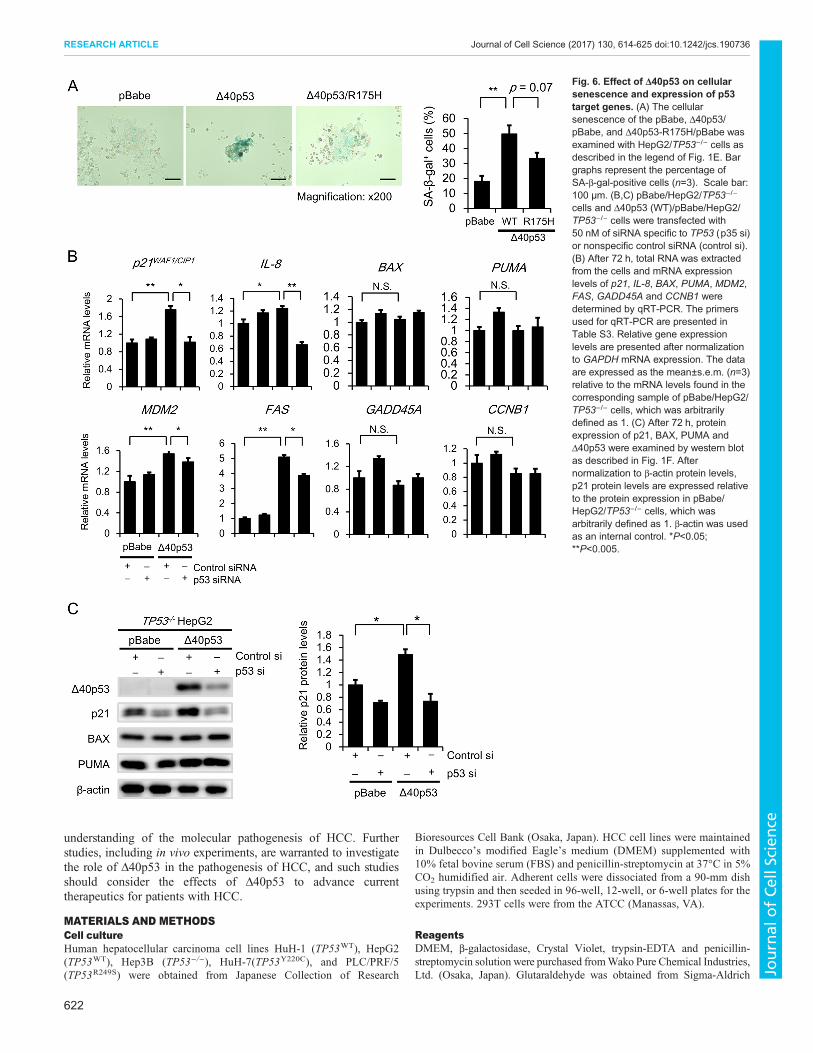
Δ40p53 itself exerts tumor suppressor activity in TP53-deleted cellsBecause our experimental cell model was generated in the presenceof FL-p53, it was difficult to exclude the possibility that Δ40p53exerts tumor suppressor activity that is dependent upon theexpression of FL-p53. To investigate whether Δ40p53independently exerts tumor suppressor activity, we established aTP53−/− HepG2 cell clone using the CRISPR/Cas9 system(Fig. 5A). Western blot analysis revealed that FL-p53 wasundetectable in the TP53−/− HepG2 cell clone, whereas it wasdetected in parental HepG2 cells after 24 h of incubation in thepresence or absence of doxorubicin (Fig. 5B). We also confirmedthat p53 transcription factor activity was minimal in the TP53−/− cellclone (Fig. 5C). Thus, we investigated the effect of exogenousΔ40p53 expression on clonogenic activity in the absence of FL-p53.Cells expressing Δ40p53 formed fewer colonies than thoseexpressing control (pBabe) or Δ40p53-R175H (Fig. 5D). Similarresults were observed in p53-deleted Hep3B cells (Fig. 5D).Furthermore, the percentage of SA-β-gal-positive cells wassignificantly higher among those expressing WT-Δ40p53; thisincrease was partly attenuated in cells expressing Δ40p53-R175H(Fig. 6A). We then examined the effect of Δ40p53 on expression ofp53 target genes under TP53 knockdown. We found that p21mRNA and protein expression of significantly increased in theΔ40p53/pBabe/HepG2/TP53−/− cells compared with the pBabe/HepG2/TP53−/− cells; this increase was attenuated after knockdownof Δ40p53 (Fig. 6B,C). Similarly, mRNA expression level of IL-8,MDM2 and FAS significantly increased in Δ40p53 cell clones; theseincreases were reversed after knockdown of Δ40p53 (Fig. 6C). In
addition, we examined the effects of mutant Δ40p53-R175H onp21, CCNB1 and IL-8 gene expression. We then compared theeffects with those obtained in the cells expressing control vector(pBabe) and WT-Δ40p53. qRT-PCR analysis revealed that mRNAexpression of CCNB1 and IL-8 but not p21 significantly increasedin the cells expressing Δ40p53-R175H (Fig. S4D). These resultsstrongly suggest that Δ40p53 itself exerts tumor suppressor activity.
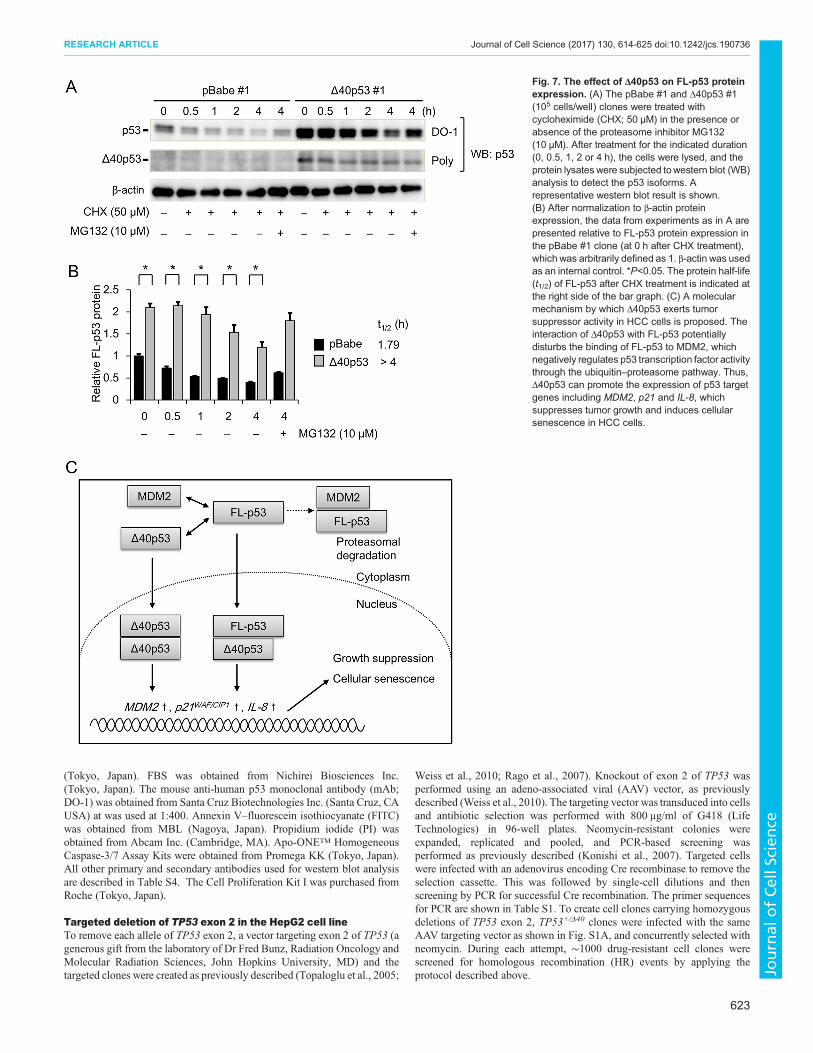
Δ40p53 increases the protein levels of FL-p53Finally, we examined the effect of Δ40p53 on FL-p53 proteinexpression using western blot analysis. FL-p53 protein levels weresignificantly increased in the Δ40p53#1 cells compared to thepBabe#1 cells (Fig. 7A,B). Moreover, the protein levels of FL-p53were reduced in a time-dependent manner after cycloheximide(CHX) treatment in both pBabe#1 and Δ40p53#1 cells; thisreduction was clearly delayed in the Δ40p53#1 cells (Fig. 7B), asindicated by the longer half-life of FL-p53 protein in Δ40p53#1cells (t1/2>4 h) compared to pBabe#1 cells (t1/2=1.26 h). In addition,the reduction in FL-p53 protein levels after CHX treatment waspartly attenuated by treatment with the proteasome inhibitorMG132, suggesting that Δ40p53 may preserve the protein levelsof FL-p53 by affecting its proteasomal degradation. To furtherinvestigate the effect of Δ40p53 on FL-p53-induced anti-tumoractivity, we performed a clonogenic assay in the HepG2/TP53−/−
cells expressing pBabe, Δ40p53, FL-p53, and FL-p53 plus Δ40p53(co-expression). The clonogenic assay revealed that cells expressingFL-p53 formed fewer colonies; this reduction was significantlyaugmented in cells co-expressing FL-p53 and Δ40p53 (Fig. S4F).
Collectively, these results strongly suggest that Δ40p53 exertsgrowth suppressive activity and promotes senescence in HCC cells(Fig. 7C).
DISCUSSIONIn the present study, we demonstrate for the first time that Δ40p53exerts tumor suppressor activity in HCC cells. To investigate thebiological function of Δ40p53, we established TP53 gene-modifiedcell models, including TP53+/Δ40 HepG2 cells expressingendogenous Δ40p53, parental HepG2 cells expressing exogenousΔ40p53, and CRISPR/Cas9-mediated TP53−/− HepG2 cellsharboring a disrupted TP53 gene. Takahashi et al. reported thatΔ40p53 elicits apoptosis in humanmelanoma cells (Takahashi et al.,2014). Our data showed that caspase-3 and -7 activity and theannexin V- and PI-positive population were not increased in theTP53+/Δ40 cell clones, indicating that the tumor suppressor activityof Δ40p53 may not be mediated through apoptosis.
HepG2 cells express WT p53, whereas HuH-7 and PLC/PRF/5cells harbor mutated p53 (HuH-7, TP53Y220C; PLC/PRF/5,TP53R249S) (Hsu et al., 1993). Retroviral-induced Δ40p53expression suppressed colony formation in all three HCCcell lines, in TP53−/− Hep3B cells, and in genetically engineeredTP53−/− HepG2 cells. These results strongly suggest that Δ40p53exerts tumor suppressor activity regardless of the FL-p53 status.Furthermore, both endogenous and exogenous Δ40p53 expressionsignificantly suppressed clonogenicity, induced cellularsenescence, and upregulated p53 target gene expression in thepresence of FL-p53 with or without the TP53 mutation, stronglysuggesting that Δ40p53, which lacks the MDM2-interactive TAD-Idomain, may exhibit higher tumor suppressor activity than FL-p53.We detected endogenous expression of Δ40p53 and its upregulationafter doxorubicin treatment in both HepG2 and PLC/PRF/5 cells,indicating that Δ40p53 potentially has important anti-tumor effectsin HCC cells. Given that Δ40p53 exerted promising anti-tumor
619
RESEARCH ARTICLE Journal of Cell Science (2017) 130, 614-625 doi:10.1242/jcs.190736
Journal
ofCe
llScience
activity in HCC cells, it would be interesting to examine whetherchanges in Δ40p53 expression are related to liver carcinogenesisin vitro and/or in vivo.Senescence is a recognized barrier to cellular proliferation (Maier
et al., 2004). In this study, there were significantly more SA-β-gal-positive cells among the HepG2 TP53+/Δ40 and Δ40p53/pBabe cellclones compared to the control cell clones. In addition, the increasednumber of SA-β-gal-positive cells was clearly suppressed by TP53
knockdown, suggesting that Δ40p53 may play a pivotal role incellular senescence. p21, a well-known p53 target gene, isupregulated during replicative senescence and functions as aninhibitor of proliferation (Lanigan et al., 2011; Brugarolas et al.,1995). We found that the expression levels of both p21 and p53-inducible genes, including MDM2 and FAS, were significantlyupregulated in HepG2 TP53+/Δ40 and Δ40p53/pBabe cell clonescompared to the control cell clones. These changes in gene
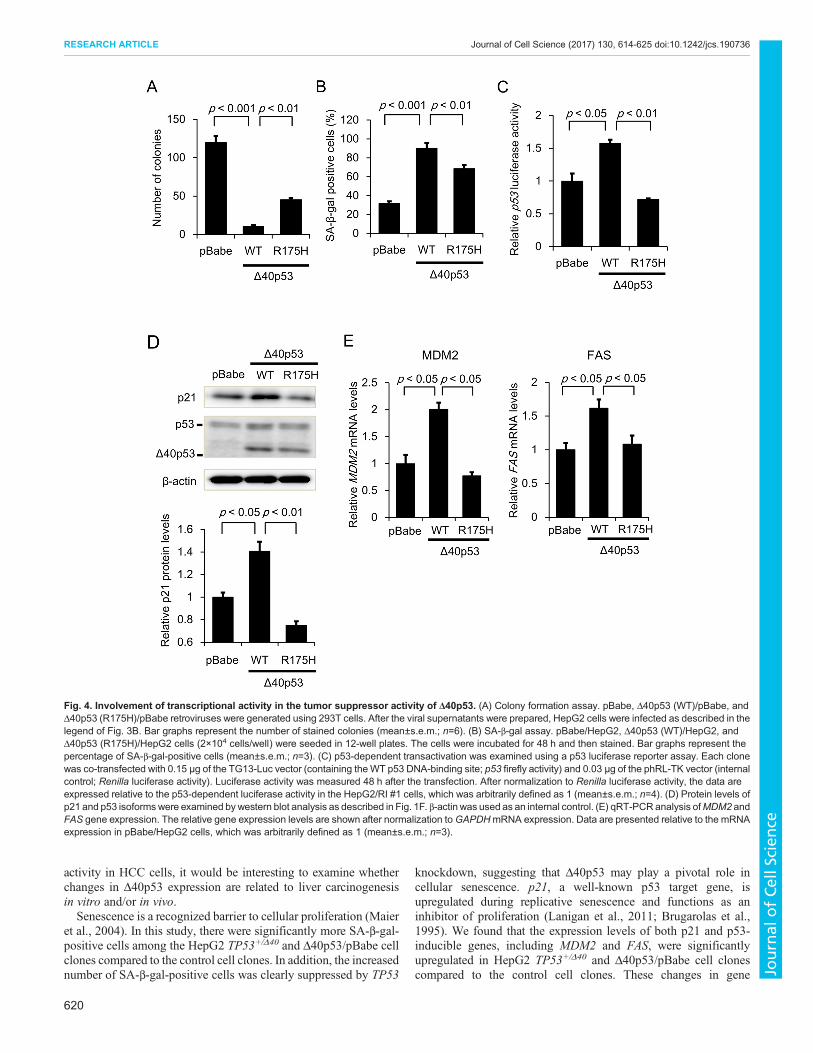
Fig. 4. Involvement of transcriptional activity in the tumor suppressor activity of Δ40p53. (A) Colony formation assay. pBabe, Δ40p53 (WT)/pBabe, andΔ40p53 (R175H)/pBabe retroviruses were generated using 293T cells. After the viral supernatants were prepared, HepG2 cells were infected as described in thelegend of Fig. 3B. Bar graphs represent the number of stained colonies (mean±s.e.m.; n=6). (B) SA-β-gal assay. pBabe/HepG2, Δ40p53 (WT)/HepG2, andΔ40p53 (R175H)/HepG2 cells (2×10⁴ cells/well) were seeded in 12-well plates. The cells were incubated for 48 h and then stained. Bar graphs represent thepercentage of SA-β-gal-positive cells (mean±s.e.m.; n=3). (C) p53-dependent transactivation was examined using a p53 luciferase reporter assay. Each clonewas co-transfected with 0.15 μg of the TG13-Luc vector (containing theWT p53 DNA-binding site; p53 firefly activity) and 0.03 μg of the phRL-TK vector (internalcontrol; Renilla luciferase activity). Luciferase activity was measured 48 h after the transfection. After normalization to Renilla luciferase activity, the data areexpressed relative to the p53-dependent luciferase activity in the HepG2/RI #1 cells, which was arbitrarily defined as 1 (mean±s.e.m.; n=4). (D) Protein levels ofp21 and p53 isoformswere examined by western blot analysis as described in Fig. 1F. β-actin was used as an internal control. (E) qRT-PCRanalysis ofMDM2 andFAS gene expression. The relative gene expression levels are shown after normalization toGAPDHmRNA expression. Data are presented relative to the mRNAexpression in pBabe/HepG2 cells, which was arbitrarily defined as 1 (mean±s.e.m.; n=3).
620
RESEARCH ARTICLE Journal of Cell Science (2017) 130, 614-625 doi:10.1242/jcs.190736
Journal
ofCe
llScience
expression were abrogated by TP53 knockdown. Moreover, thetumor suppressor activity of Δ40p53 was partly, but significantly,attenuated in cells expressing mutant Δ40p53-R175H, although themRNA levels of p21 and p53-induced genes, includingMDM2 andFAS, did not change, providing further experimental evidence thatthe transcriptional activity of Δ40p53 is closely associated with theits anti-tumor effects. We also observed that cells expressing mutantΔ40p53-R175H protein formed fewer colonies and exhibitedincreased SA-β-gal positive staining without upregulation of p21;however, these levels were reduced compared with cells expressingWT-Δ40p53. Moreover, we found that Δ40p53-R175Hsignificantly increased mRNA expression of CCNB1 and/or IL-8,proteins that lead to a senescence-associated secretory phenotype(SASP). These results suggest that upregulation of p21 is not alwaysresponsible for cellular senescence induced by Δ40p53. In addition,Δ40p53-R175H may exhibit anti-tumor activity by modulating p53target genes, which are similar to but different from those modulated
by WT-Δ40p53. Ohki et al. reported that Δ40p53 induces some, butnot all, p53-inducible genes in TP53−/− Saos2 cells (Ohki et al.,2007). Thus, further studies, including comprehensive microarrayand/or RNA sequencing analyses, may contribute to a betterunderstanding of the molecular basis underlying the role of Δ40p53and its mutants in tumor suppression and senescence in HCC cells.
Thus far, Δ40p53 has been shown to regulate p53-inducible geneexpression in both a positive and negative manner (Yin et al., 2002).Although we did not clarify the interaction of Δ40p53 with FL-p53or MDM2, our observations that Δ40p53 increased the protein half-life of FL-p53 and augmented the FL-p53-induced anti-tumoractivity suggest that Δ40p53 may positively regulate FL-p53activity in our proposed HCC cell model.
In conclusion, to the best of our knowledge, this study is the firstto demonstrate that Δ40p53 exerts tumor suppressor activity andpromotes cellular senescence, at least in part, by upregulating p53target gene expression in HCC cells. Our findings enhance the
Fig. 5. Effect of Δ40p53 on TP53−/− cellgrowth. (A) An sgRNA (arrow) sequencewas designed against the TP53 loci toexcise an in-frame second ATG (bold) thatinitiates the transcription of Δ40p53. ThesgRNA sequence and the PAM sequenceare indicated by underlining and anoverbar, respectively. The sequences ofthe parental and TP53−/− (null) cell clones(bi-allelic modification) were analyzed,and the results are shown below. Ajunction in the TP53−/− cell clone isindicated by the arrowhead. (B) p53protein expression was determined bywestern blot analysis. Parental HepG2and HepG2/TP53−/− cells were incubatedfor 24 h in the presence or absence ofdoxorubicin (500 nM) and then lysed withlysis buffer; 5 μg of lysatewas subjected towestern blot analysis to detect p53 protein.β-actin was used as an internal control.(C) p53-dependent transactivation wasexamined using a p53 luciferase reporterassay as described in Fig. 4C. Luciferaseactivity was measured 48 h after thetransfection. After normalization to Renillaluciferase activity, the data are expressedrelative to the p53-dependent luciferaseactivity in the parental HepG2 cells, whichwas arbitrarily defined as 1 (mean±s.e.m.;n=6). (D) Colony formation assay. pBabe,Δ40p53 (WT)/pBabe and Δ40p53(R175H)/pBabe retroviruses wereprepared using 293 T cells. After the viralsupernatants were prepared, HepG2/TP53−/− cells and Hep3B (p53 null) cellswere infected as described in the legendof Fig. 4B. Bar graphs represent thenumber of stained colonies (mean±s.e.m.;n=3).
621
RESEARCH ARTICLE Journal of Cell Science (2017) 130, 614-625 doi:10.1242/jcs.190736
Journal
ofCe
llScience
understanding of the molecular pathogenesis of HCC. Furtherstudies, including in vivo experiments, are warranted to investigatethe role of Δ40p53 in the pathogenesis of HCC, and such studiesshould consider the effects of Δ40p53 to advance currenttherapeutics for patients with HCC.
MATERIALS AND METHODSCell cultureHuman hepatocellular carcinoma cell lines HuH-1 (TP53WT), HepG2(TP53WT), Hep3B (TP53−/−), HuH-7(TP53Y220C), and PLC/PRF/5(TP53R249S) were obtained from Japanese Collection of Research
Bioresources Cell Bank (Osaka, Japan). HCC cell lines were maintainedin Dulbecco’s modified Eagle’s medium (DMEM) supplemented with10% fetal bovine serum (FBS) and penicillin-streptomycin at 37°C in 5%CO2 humidified air. Adherent cells were dissociated from a 90-mm dishusing trypsin and then seeded in 96-well, 12-well, or 6-well plates for theexperiments. 293T cells were from the ATCC (Manassas, VA).
ReagentsDMEM, β-galactosidase, Crystal Violet, trypsin-EDTA and penicillin-streptomycin solution were purchased fromWako Pure Chemical Industries,Ltd. (Osaka, Japan). Glutaraldehyde was obtained from Sigma-Aldrich
Fig. 6. Effect of Δ40p53 on cellularsenescence and expression of p53target genes. (A) The cellularsenescence of the pBabe, Δ40p53/pBabe, and Δ40p53-R175H/pBabe wasexamined with HepG2/TP53−/− cells asdescribed in the legend of Fig. 1E. Bargraphs represent the percentage ofSA-β-gal-positive cells (n=3). Scale bar:100 μm. (B,C) pBabe/HepG2/TP53−/−
cells and Δ40p53 (WT)/pBabe/HepG2/TP53−/− cells were transfected with50 nM of siRNA specific to TP53 (p35 si)or nonspecific control siRNA (control si).(B) After 72 h, total RNA was extractedfrom the cells and mRNA expressionlevels of p21, IL-8, BAX, PUMA, MDM2,FAS, GADD45A and CCNB1 weredetermined by qRT-PCR. The primersused for qRT-PCR are presented inTable S3. Relative gene expressionlevels are presented after normalizationto GAPDH mRNA expression. The dataare expressed as the mean±s.e.m. (n=3)relative to the mRNA levels found in thecorresponding sample of pBabe/HepG2/TP53−/− cells, which was arbitrarilydefined as 1. (C) After 72 h, proteinexpression of p21, BAX, PUMA andΔ40p53 were examined by western blotas described in Fig. 1F. Afternormalization to β-actin protein levels,p21 protein levels are expressed relativeto the protein expression in pBabe/HepG2/TP53−/− cells, which wasarbitrarily defined as 1. β-actin was usedas an internal control. *P<0.05;**P<0.005.
622
RESEARCH ARTICLE Journal of Cell Science (2017) 130, 614-625 doi:10.1242/jcs.190736
Journal
ofCe
llScience
(Tokyo, Japan). FBS was obtained from Nichirei Biosciences Inc.(Tokyo, Japan). The mouse anti-human p53 monoclonal antibody (mAb;DO-1) was obtained from Santa Cruz Biotechnologies Inc. (Santa Cruz, CAUSA) at was used at 1:400. Annexin V–fluorescein isothiocyanate (FITC)was obtained from MBL (Nagoya, Japan). Propidium iodide (PI) wasobtained from Abcam Inc. (Cambridge, MA). Apo-ONE™ HomogeneousCaspase-3/7 Assay Kits were obtained from Promega KK (Tokyo, Japan).All other primary and secondary antibodies used for western blot analysisare described in Table S4. The Cell Proliferation Kit I was purchased fromRoche (Tokyo, Japan).
Targeted deletion of TP53 exon 2 in the HepG2 cell lineTo remove each allele of TP53 exon 2, a vector targeting exon 2 of TP53 (agenerous gift from the laboratory of Dr Fred Bunz, Radiation Oncology andMolecular Radiation Sciences, John Hopkins University, MD) and thetargeted clones were created as previously described (Topaloglu et al., 2005;
Weiss et al., 2010; Rago et al., 2007). Knockout of exon 2 of TP53 wasperformed using an adeno-associated viral (AAV) vector, as previouslydescribed (Weiss et al., 2010). The targeting vector was transduced into cellsand antibiotic selection was performed with 800 μg/ml of G418 (LifeTechnologies) in 96-well plates. Neomycin-resistant colonies wereexpanded, replicated and pooled, and PCR-based screening wasperformed as previously described (Konishi et al., 2007). Targeted cellswere infected with an adenovirus encoding Cre recombinase to remove theselection cassette. This was followed by single-cell dilutions and thenscreening by PCR for successful Cre recombination. The primer sequencesfor PCR are shown in Table S1. To create cell clones carrying homozygousdeletions of TP53 exon 2, TP53+/Δ40 clones were infected with the sameAAV targeting vector as shown in Fig. S1A, and concurrently selected withneomycin. During each attempt, ∼1000 drug-resistant cell clones werescreened for homologous recombination (HR) events by applying theprotocol described above.
Fig. 7. The effect of Δ40p53 on FL-p53 proteinexpression. (A) The pBabe #1 and Δ40p53 #1(105 cells/well) clones were treated withcycloheximide (CHX; 50 μM) in the presence orabsence of the proteasome inhibitor MG132(10 μM). After treatment for the indicated duration(0, 0.5, 1, 2 or 4 h), the cells were lysed, and theprotein lysates were subjected towestern blot (WB)analysis to detect the p53 isoforms. Arepresentative western blot result is shown.(B) After normalization to β-actin proteinexpression, the data from experiments as in A arepresented relative to FL-p53 protein expression inthe pBabe #1 clone (at 0 h after CHX treatment),which was arbitrarily defined as 1. β-actin was usedas an internal control. *P<0.05. The protein half-life(t1/2) of FL-p53 after CHX treatment is indicated atthe right side of the bar graph. (C) A molecularmechanism by which Δ40p53 exerts tumorsuppressor activity in HCC cells is proposed. Theinteraction of Δ40p53 with FL-p53 potentiallydisturbs the binding of FL-p53 to MDM2, whichnegatively regulates p53 transcription factor activitythrough the ubiquitin–proteasome pathway. Thus,Δ40p53 can promote the expression of p53 targetgenes including MDM2, p21 and IL-8, whichsuppresses tumor growth and induces cellularsenescence in HCC cells.
623
RESEARCH ARTICLE Journal of Cell Science (2017) 130, 614-625 doi:10.1242/jcs.190736
Journal
ofCe
llScience
qRT-PCR analysisHepG2 cells (2×10⁵ cells/well) were seeded in 6-well plates and incubatedfor 48 h. Total RNA was then extracted using a PureLink® RNA Mini Kit(Life Technologies Japan, Tokyo, Japan), and 2 μg of total RNA was usedfor cDNA synthesis, which was performed using High Capacity cDNAReverse Transcription Kits (Life Technologies Japan). qRT-PCR analysiswas performed using SYBR Green I, as previously described (Takahashiet al., 2013). Glyceraldehyde-3-phosphate dehydrogenase (GAPDH) wasused as an internal control. The primers used in this study are described inTable S2.
Western blot analysisHepG2 cells were seeded in a 6-well culture plate (2×10⁵ cells/well) andincubated for 48 h. Preparation of cell extracts and western blot analysiswere performed as previously described (Hossain et al., 2015). Immunecomplexes were detected using ImmunoStar LD (Wako) with a LAS-4000image analyzer (GE Healthcare, Tokyo, Japan). Band intensity wasmeasured using ImageQuant TL software (GE Healthcare). Relativeprotein levels were calculated after normalization against the internalcontrol β-actin.
RetrovirusA fragment containing the Δ40p53 open reading frame (ORF) wasamplified from HepG2 cDNA using KOD PlusNeo polymerase(TOYOBO; Tokyo, Japan) and the following primer set: forward, 5′-GG-ATCCCAAGCAATGGATGAT-3′ and reverse, 5′-TCAGTCTGAGTCA-GGCCCTT-3′. A fragment of the Δ40p53 ORF carrying the R175H orR273H mutation was amplified from pCMV-Neo-Bam p53 R175H(plasmid 16436, obtained from Addgene) or pCMV-Neo-Bam p53R273H (plasmid 16439, obtained from Addgene), respectively. Eachfragment was inserted into a pBabe-puro vector or a pLXSN vector(Clontech Laboratories, Inc., Mountain View, CA). The retroviral plasmidswere packaged in 293T cells using the pCL10A vector. Viral supernatantswere harvested 96 h after transfection and filtered before infection.Experimental HCC cells were infected with retroviruses in the presence of8 μg/ml Polybrene (Sigma-Aldrich). Antibiotic selection (puromycin; 2 μg/ml for pBabe-puro or neomycin; 800 μg/ml for pLXSN) was begun 48 hafter infection and continued for at least 3 days.
Knockdown of p53pMKO.1-puro p53 shRNA-2 and pMKO.1-puro GFP shRNA were giftsfrom William Hahn (Dept. Medical Oncology, Dana-Farber CancerInstitute, MA; Addgene plasmids #10671 and #10675, respectively;Masutomi et al., 2003). To obtain cell clones that exhibited stablydecreased p53 expression, either the p53 shRNA vector or the controlGFP shRNA vector was introduced into HepG2/TP53+/Δ40 #1 cells. Theretroviral plasmids and supernatants were prepared as described above.Following infection and antibiotic selection, single colonies were manuallyselected, expanded and examined for the expression of p53 at either themRNA or protein level by using qRT-PCR analysis or western blot analysis,respectively. Transient p53 knockdown was performed using TP53 siRNA(Cell Signaling Technology).
Clonogenic assayHepG2 cell clones were seeded in a 12-well culture plate (200 cells/well)and incubated for 14 days to form colonies, as described previously (Attardiet al., 2004). For retroviral vector-based clonogenic assays, HepG2 cellswere seeded into a 6-well culture plate (1×10⁵ cells/well) 1 day beforeinfection. qRT-PCR analysis was performed to quantify the level ofretroviral RNA by measuring the copy number of the puromycin N-acetyl-transferase (PAC derived from Streptomyces strains) gene with a primer set(Table S2). The cells were then infected with the same multiplicity ofinfection (MOI) for 48 h, which was followed by antibiotic selection, asdescribed above. After incubation for 14 days, the cells were fixed and thenstained with 0.1% Crystal Violet in PBS. The number of stained colonieswas counted manually.
Cell proliferation assayFor the MTT cell proliferation assay, HepG2 cells were plated in a 96-wellculture plate (103 cells/well) and incubated at 37°C for the indicateddurations. After incubation, cell proliferation was assessed by using a CellProliferation Kit I (Roche). Absorbance was measured at 595 nm using aSpectraMax M5 spectrophotometer (Molecular Devices, Sunnyvale, CA).
Annexin V and cellular caspase-3 and -7 activity assayHepG2 cells were stained with AxV–FITC and PI (10 µg/ml) at roomtemperature for 15 min. Fluorescent intensities were determined byfluorescence-activated cell sorting (FACS) in a FACSCantoII (BD,Franklin Lakes, NJ), which analyzes 10,000 events (determined byforward and side scatter). The caspase-3 and -7 assay was performed byusing an Apo-ONE™ Homogeneous Caspase-3/7 Assay Kit (Promega)according to the manufacturer’s instructions. Fluorescence intensity(499 nm excitation and 521 nm emission) was measured using aSpectraMax M5 spectrophotometer (Molecular Devices).
Cell cycle analysisHepG2 cells were seeded in a 6-well culture plate (105 cells/well) andincubated for 24 h. To synchronize the cell cultures, the cells were rinsed inPBS and serum-free DMEM was then added. After serum starvation for48 h, the cells were released into the cell cycle by the addition of FBS. ForFACS analysis, the cells were detached using trypsin at 24 h after serumtreatment and fixed in ice-cold 70% ethanol overnight. After fixation, thecells were treated with RNase A (100 μg/ml) and stained with PI (100 μg/ml). The percentages of cells in the sub-G1, G1, S, and G2–M phases weremeasured using FlowJo software (Tree Star Inc., Ashland, OR).
TP53 knockout using the CRISPR-Cas9 systemThe CRISPR-Cas9 system was used to disrupt the expression of the TP53gene, as described previously (Ran et al., 2013). pSpCas9(BB)-2A-Puro(PX459) was a gift from Feng Zhang (Broad Institute of MIT and Harvard,MA; Addgene plasmid #48139) (Ran et al., 2013). In brief, a singleguide RNA (sgRNA) sequence was selected using OptimizedCRISPR Design (http://crispr.mit.edu/). The sgRNA sequence forTP53 was 5′-ATCCATTGCTTGGGACGGCA-3′ (hereafter calledTP53 sgRNA). The plasmid expressing human Cas9 and the TP53sgRNAwere prepared by ligating oligonucleotides into the BbsI siteof PX459 (TP53/PX459). To examine the efficacy of the sgRNA,we used pCAG-EGxxFP, which was a gift from Masahito Ikawa(Osaka University, Japan; Addgene plasmid #50716) (Mashikoet al., 2013). An ∼500 bp long genomic fragment containing thesgRNA target sequence was amplified using PCR and clonedbetween the EGFP fragments of pCAG-EGxxFP (TP53/pCAG-EGxxFP). We then co-transfected 293T cells with TP53/PX459 andTP53/pCAG-EGxxFP. After 4 days of transfection, the efficacy ofHR of the EGFP genewas evaluated using fluorescence microscopyanalysis (BZ-9000, KEYENCE, Osaka, Japan). To establish aTP53−/− clone, HepG2 cells (1×10⁶ cells/dish) were seeded in a10 cm dish. The cells were then transfected with 10 μg of TP53/PX459 using Lipofectamine 3000 (Life Technologies). Antibioticselection (puromycin; 2 μg/ml) was begun 72 h after infection andcontinued for at least 3 days. A single clone was selected, expanded,and then used for biological assays. For sequence analysis of theTP53 gene, the following primer set was used: 5′-CAGCCATTC-TTTTCCTGCTC-3′ and 5′-TGCCCTGGTAGGTTTTCTGG-3′.
Statistical analysisAt least three independent experiments and three replications per experimentwere performed. The results are expressed as the mean±s.e.m. Statisticalsignificance between groups was determined using one-way ANOVA andDunnett’s comparison. Statistical analyses were performed using SPSS 23.0(SPSS Inc; Chicago, IL).
624
RESEARCH ARTICLE Journal of Cell Science (2017) 130, 614-625 doi:10.1242/jcs.190736
Journal
ofCe
llScience
Competing interestsThe authors declare no competing or financial interests.
Author contributionsConception and design: A.O., H.K. and H.N. Development of methodology: A.O.,H.K. and Y.H. Acquisition of data (provided cells, provided facilities, etc.): A.O., Y.S.,S.K. and M.W. Analysis and interpretation of data (e.g. statistical analysis,biostatistics, computational analysis): Y.S., M.W., T.I., Y.K., N.I., T.Y., T.O., Y.N.,K.S., K.I., H.N. and M.Y. Writing, review, and/or revision of the manuscript: A.O.,H.K. and H.N. Administrative, technical, or material support (i.e. reporting ororganizing data, preparing vectors): S.K., M.W., T.I., Y.K., N.I., Y.S., Y.N., T.Y., T.O.,K.S., K.I. and H.N. Study supervision: H.K., Y.H. and H.N.
FundingThis work was supported in part by Grants-in-Aid for Scientific Research from theJapan Society for the Promotion of Science (23590997 to H.N., Y.N., and H.K.;16K09381 to H.N., and A.O.). Deposited in PMC for immediate release.
Supplementary informationSupplementary information available online athttp://jcs.biologists.org/lookup/doi/10.1242/jcs.190736.supplemental
ReferencesAttardi, L. D., de Vries, A. and Jacks, T. (2004). Activation of the p53-dependentG1 checkpoint response in mouse embryo fibroblasts depends on the specificDNA damage inducer. Oncogene 23, 973-980.
Brugarolas, J., Chandrasekaran, C., Gordon, J. I., Beach, D., Jacks, T. andHannon, G. J. (1995). Radiation-induced cell cycle arrest compromised by p21deficiency. Nature 377, 552-557.
Candeias, M. M., Powell, D. J., Roubalova, E., Apcher, S., Bourougaa, K.,Vojtesek, B., Bruzzoni-Giovanelli, H. and Fåhraeus, R. (2006). Expression ofp53 and p53/47 are controlled by alternative mechanisms of messenger RNAtranslation initiation. Oncogene 25, 6936-6947.
Courtois, S., Verhaegh, G., North, S., Luciani, M.-G., Lassus, P., Hibner, U.,Oren, M. and Hainaut, P. (2002). DeltaN-p53, a natural isoform of p53 lacking thefirst transactivation domain, counteracts growth suppression by wild-type p53.Oncogene 21, 6722-6728.
Cui, H., Schroering, A. and Ding, H. F. (2002). p53 mediates DNA damaging drug-induced apoptosis through a caspase-9-dependent pathway in SH-SY5Yneuroblastoma cells. Mol. Cancer Ther. 1, 679-686.
Hafsi, H., Santos-Silva, D., Courtois-Cox, S. and Hainaut, P. (2013). Effects ofΔ40p53, an isoform of p53 lacking the N-terminus, on transactivation capacity ofthe tumor suppressor protein p53. BMC Cancer 13, 134.
Hossain, E., Ota, A., Karnan, S., Takahashi, M., Mannan, S. B., Konishi, H. andHosokawa, Y. (2015). Lipopolysaccharide augments the uptake of oxidized LDLby up-regulating lectin-like oxidized LDL receptor-1 in macrophages. Mol. Cell.Biochem. 400, 29-40.
Hsu, I. C., Tokiwa, T., Bennett, W., Metcalf, R. A.,Welsh, J. A., Sun, T. andHarris,C. C. (1993). p53 genemutation and integrated hepatitis B viral DNA sequences inhuman liver cancer cell lines. Carcinogenesis 14, 987-992.
Katz, S. F., Lechel, A., Obenauf, A. C., Begus-Nahrmann, Y., Kraus, J. M.,Hoffmann, E. M., Duda, J., Eshraghi, P., Hartmann, D., Liss, B. et al. (2012).Disruption of Trp53 in livers of mice induces formation of carcinomas with bilinealdifferentiation. Gastroenterology 142, 1229-1239.e3.
Konishi, H., Lauring, J., Garay, J. P., Karakas, B., Abukhdeir, A. M., Gustin, J. P.,Konishi, Y. and Park, B. H. (2007). A PCR-based high-throughput screen withmultiround sample pooling: application to somatic cell gene targeting.Nat. Protoc.2, 2865-2874.
Lanigan, F., Geraghty, J. G. and Bracken, A. P. (2011). Transcriptional regulationof cellular senescence. Oncogene 30, 2901-2911.
Larsson, L.-G. (2011). Oncogene- and tumor suppressor gene-mediatedsuppression of cellular senescence. Semin. Cancer Biol. 21, 367-376.
Liu, M., Jiang, L. and Guan, X.-Y. (2014). The genetic and epigenetic alterations inhuman hepatocellular carcinoma: a recent update. Protein Cell 5, 673-691.
Lozano, R., Naghavi, M., Foreman, K., Lim, S., Shibuya, K., Aboyans, V.,Abraham, J., Adair, T., Aggarwal, R., Ahn, S. Y. et al. (2012). Global and
regional mortality from 235 causes of death for 20 age groups in 1990 and 2010: asystematic analysis for the Global Burden of Disease Study 2010. Lancet 380,2095-2128.
Maier, B., Gluba, W., Bernier, B., Turner, T., Mohammad, K., Guise, T.,Sutherland, A., Thorner, M. and Scrable, H. (2004). Modulation of mammalianlife span by the short isoform of p53. Genes Dev. 18, 306-319.
Marcel, V., Dichtel-Danjoy, M.-L., Sagne, C., Hafsi, H., Ma, D., Ortiz-Cuaran, S.,Olivier, M., Hall, J., Mollereau, B., Hainaut, P. et al. (2011). Biological functionsof p53 isoforms through evolution: lessons from animal and cellular models. CellDeath Differ. 18, 1815-1824.
Mashiko, D., Fujihara, Y., Satouh, Y., Miyata, H., Isotani, A. and Ikawa, M. (2013).Generation of mutant mice by pronuclear injection of circular plasmid expressingCas9 and single guided RNA. Sci. Rep. 3, 3355.
Masutomi, K., Yu, E. Y., Khurts, S., Ben-Porath, I., Currier, J. L., Metz, G. B.,Brooks, M. W., Kaneko, S., Murakami, S., DeCaprio, J. A. et al. (2003).Telomerase maintains telomere structure in normal human cells. Cell 114,241-253.
Morris, S. M., Baek, J. Y., Koszarek, A., Kanngurn, S., Knoblaugh, S. E. andGrady, W. M. (2012). Transforming growth factor-beta signaling promoteshepatocarcinogenesis induced by p53 loss. Hepatology 55, 121-131.
Nishida, N. and Goel, A. (2011). Genetic and epigenetic signatures in humanhepatocellular carcinoma: a systematic review. Curr. Genomics 12, 130-137.
Ohki, R., Kawase, T., Ohta, T., Ichikawa, H. and Taya, Y. (2007). Dissectingfunctional roles of p53 N-terminal transactivation domains by microarrayexpression analysis. Cancer Sci. 98, 189-200.
Olivares-Illana, V. and Fåhraeus, R. (2010). p53 isoforms gain functions.Oncogene 29, 5113-5119.
Ozturk, M., Arslan-Ergul, A., Bagislar, S., Senturk, S. and Yuzugullu, H. (2009).Senescence and immortality in hepatocellular carcinoma. Cancer Lett. 286,103-113.
Qian, Y. and Chen, X. (2013). Senescence regulation by the p53 protein family.Methods Mol. Biol. 965, 37-61.
Rago, C., Vogelstein, B. and Bunz, F. (2007). Genetic knockouts and knockins inhuman somatic cells. Nat. Protoc. 2, 2734-2746.
Ran, F. A., Hsu, P. D., Wright, J., Agarwala, V., Scott, D. A. and Zhang, F. (2013).Genome engineering using the CRISPR-Cas9 system.Nat. Protoc. 8, 2281-2308.
Serrano, M., Lin, A. W., McCurrach, M. E., Beach, D. and Lowe, S. W. (1997).Oncogenic ras provokes premature cell senescence associated withaccumulation of p53 and p16INK4a. Cell 88, 593-602.
Takahashi, M., Ota, A., Karnan, S., Hossain, E., Konishi, Y., Damdindorj, L.,Konishi, H., Yokochi, T., Nitta, M. and Hosokawa, Y. (2013). Arsenic trioxideprevents nitric oxide production in lipopolysaccharide -stimulated RAW 264.7 byinhibiting a TRIF-dependent pathway. Cancer Sci. 104, 165-170.
Takahashi, R., Markovic, S. N. and Scrable, H. J. (2014). Dominant effects ofΔ40p53 on p53 function and melanoma cell fate. J. Invest. Dermatol. 134,791-800.
Thomas, S. E., Malzer, E., Ordon ez, A., Dalton, L. E., van ‘t Wout, E. F., Liniker,E., Crowther, D. C., Lomas, D. A. and Marciniak, S. J. (2013). p53 andtranslation attenuation regulate distinct cell cycle checkpoints during endoplasmicreticulum (ER) stress. J. Biol. Chem. 288, 7606-7617.
Topaloglu, O., Hurley, P. J., Yildirim, O., Civin, C. I. and Bunz, F. (2005).Improved methods for the generation of human gene knockout and knockin celllines. Nucleic Acids Res. 33, e158.
Wei, J., Zaika, E. and Zaika, A. (2012). p53 family: role of protein isoforms in humancancer. J. Nucleic Acids 2012, 687359.
Weiss, M. B., Vitolo, M. I., Mohseni, M., Rosen, D. M., Denmeade, S. R., Park,B. H., Weber, D. J. and Bachman, K. E. (2010). Deletion of p53 in humanmammary epithelial cells causes chromosomal instability and altered therapeuticresponse. Oncogene 29, 4715-4724.
Xue, W., Zender, L., Miething, C., Dickins, R. A., Hernando, E., Krizhanovsky,V., Cordon-Cardo, C. and Lowe, S. W. (2007). Senescence and tumourclearance is triggered by p53 restoration in murine liver carcinomas. Nature 445,656-660.
Yin, Y., Stephen, C. W., Luciani, M. G. and Fåhraeus, R. (2002). p53 Stability andactivity is regulated by Mdm2-mediated induction of alternative p53 translationproducts. Nat. Cell Biol. 4, 462-467.
625
RESEARCH ARTICLE Journal of Cell Science (2017) 130, 614-625 doi:10.1242/jcs.190736
Journal
ofCe
llScience


![β-Adrenergic signaling blocks murine CD8+ T-cell metabolic ...through the β2-AR [10]. Other studies have also confirmed that activated and memory CD8+ T-cells express β2-ARs, and](https://static.fdocument.org/doc/165x107/5f91257189255658a70ea675/-adrenergic-signaling-blocks-murine-cd8-t-cell-metabolic-through-the-2-ar.jpg)