4003 - Riemann’s Sums AP Calculus. A). Accumulation Rate * Time = Distance T R ab Area under the...
25
4003 - Riemann’s Sums AP Calculus
-
Upload
phyllis-gray -
Category
Documents
-
view
216 -
download
0
Transcript of 4003 - Riemann’s Sums AP Calculus. A). Accumulation Rate * Time = Distance T R ab Area under the...
4003 - Riemann’s Sums
AP Calculus
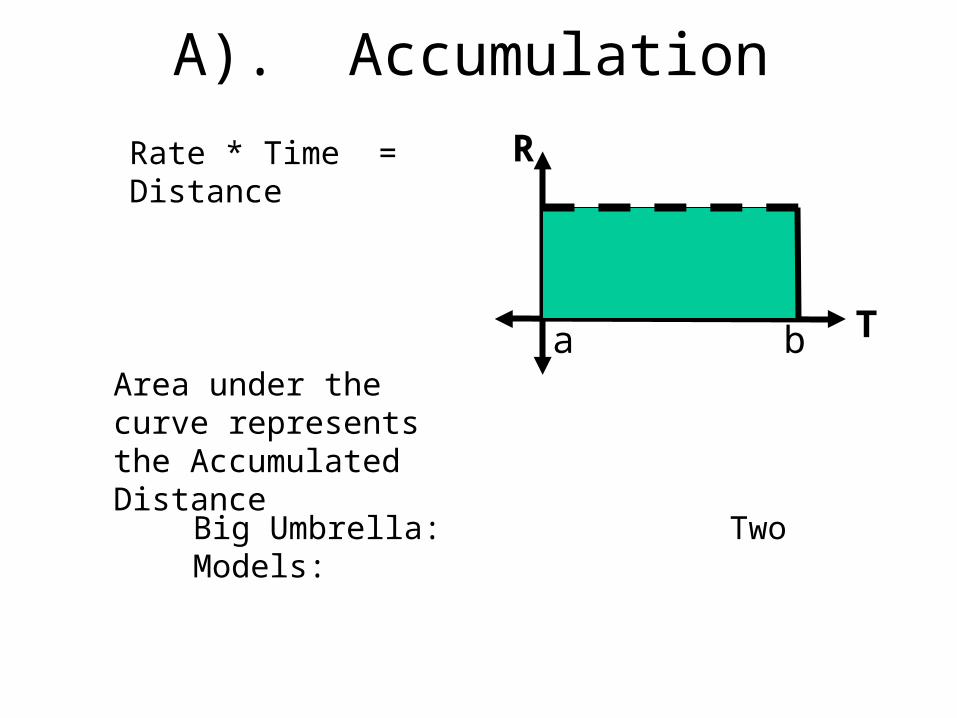
A). Accumulation
Rate * Time = Distance
T
R
a bArea under the curve represents the Accumulated Distance
Big Umbrella: Two Models:
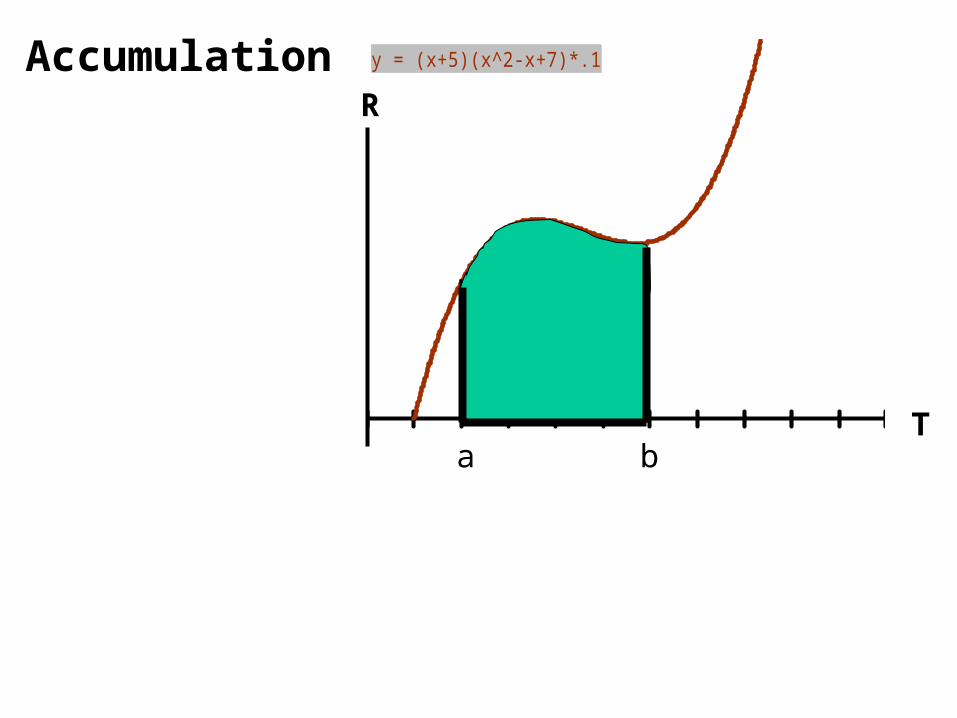
y = (x+5)(x^2-x+7)*.1
a b
R
T
Accumulation
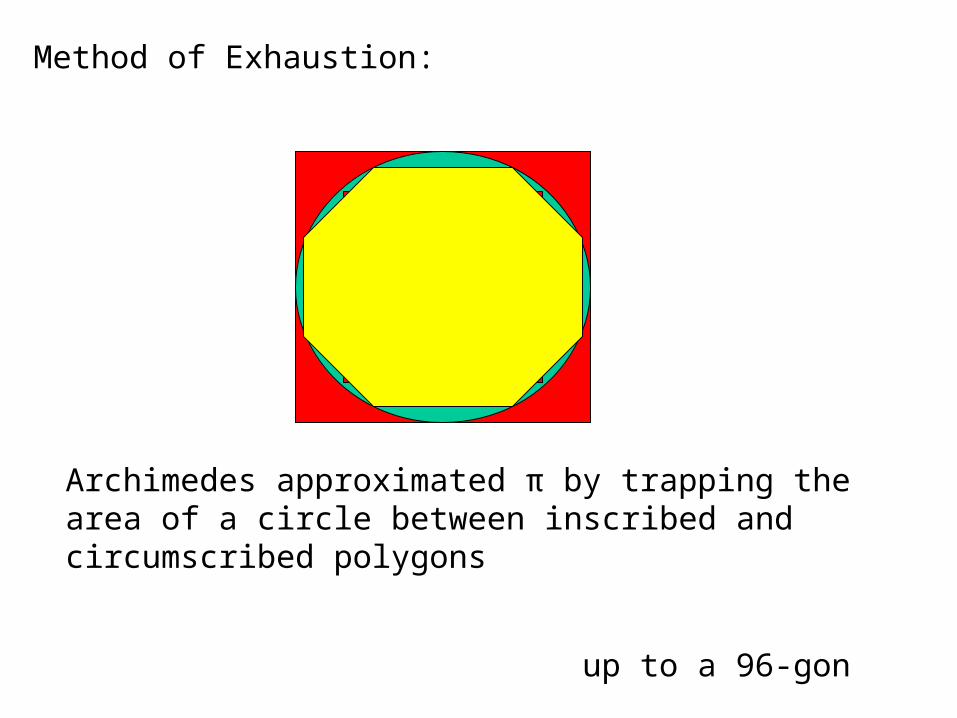
Method of Exhaustion:
Archimedes approximated π by trapping the area of a circle between inscribed and circumscribed polygons
up to a 96-gon
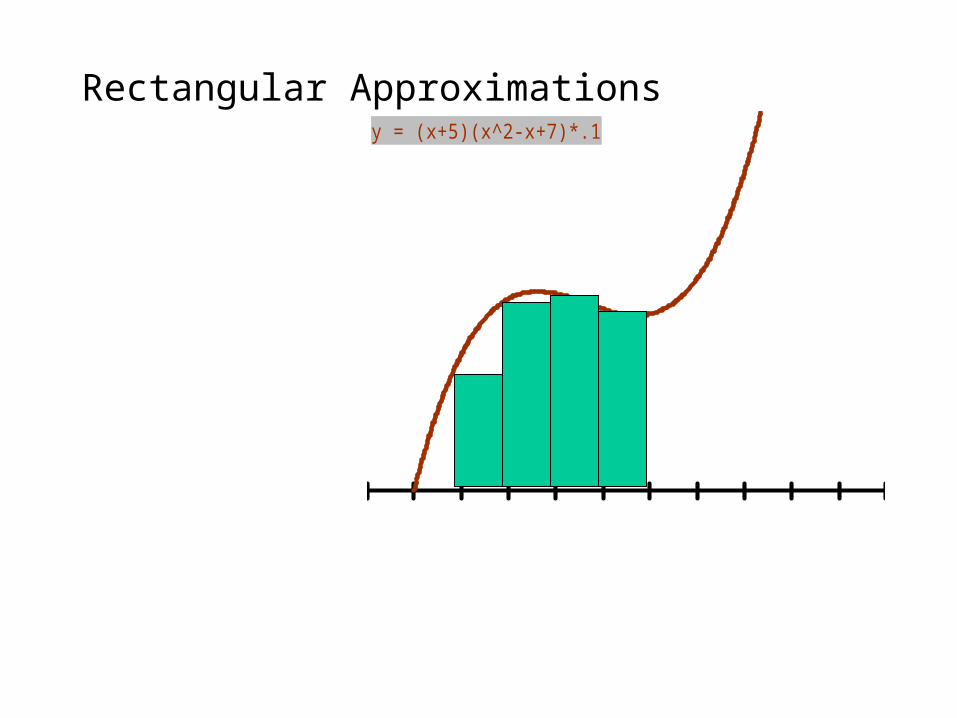
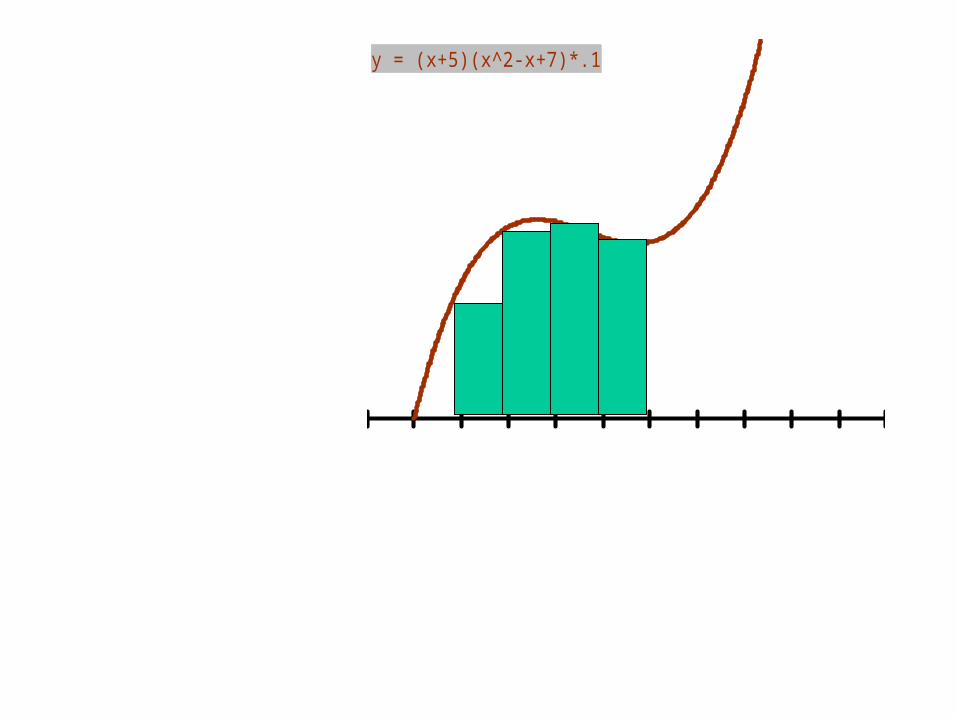
Rectangular Approximations y = (x+5)(x^2-x+7)*.1
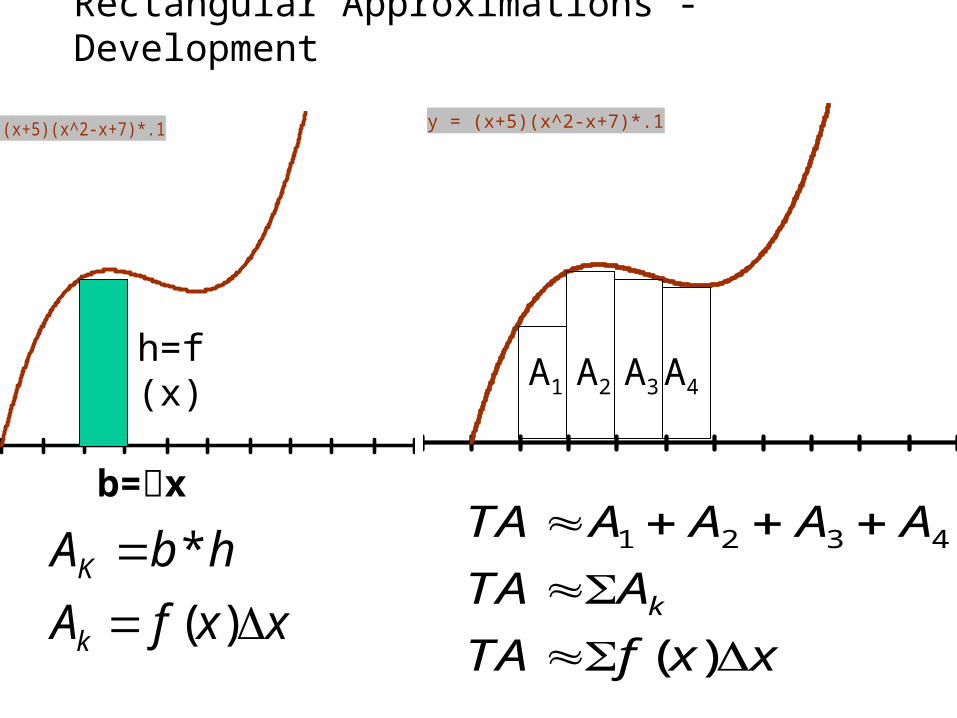
Rectangular Approximations - Development
y = (x+5)(x^2-x+7)*.1
1 2 3 4
( )k
TA A A A A
TA A
TA f x x
y = (x+5)(x^2-x+7)*.1
A1 A2 A3A4
b=x
h=f (x)
*
( )K
k
A b h
A f x x
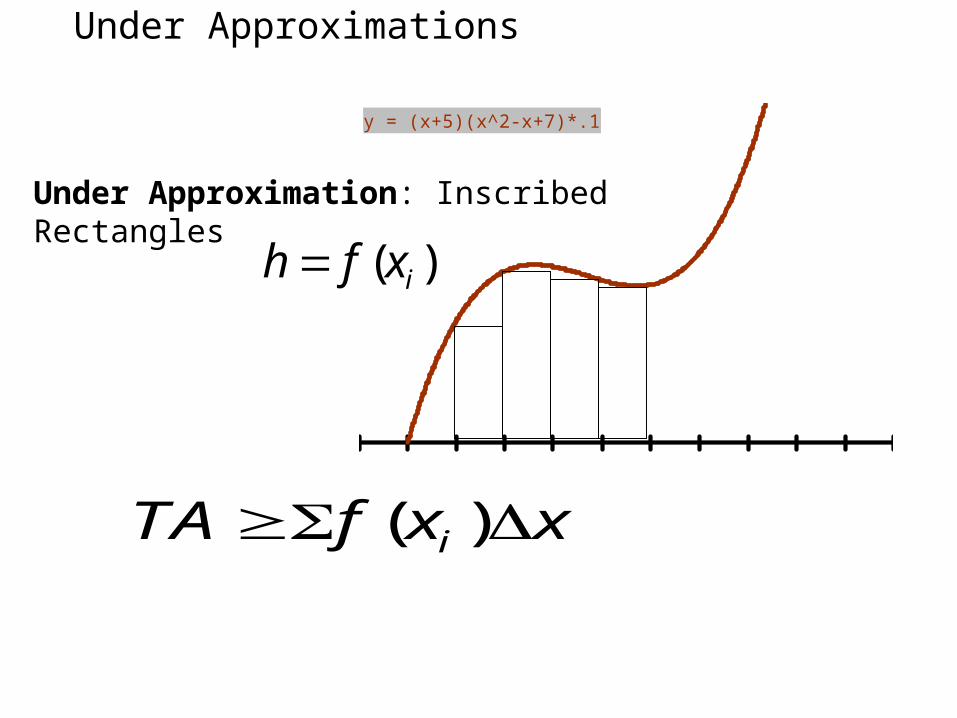
Under Approximations
y = (x+5)(x^2-x+7)*.1
Under Approximation: Inscribed Rectangles
( )ih f x
( )iTA f x x
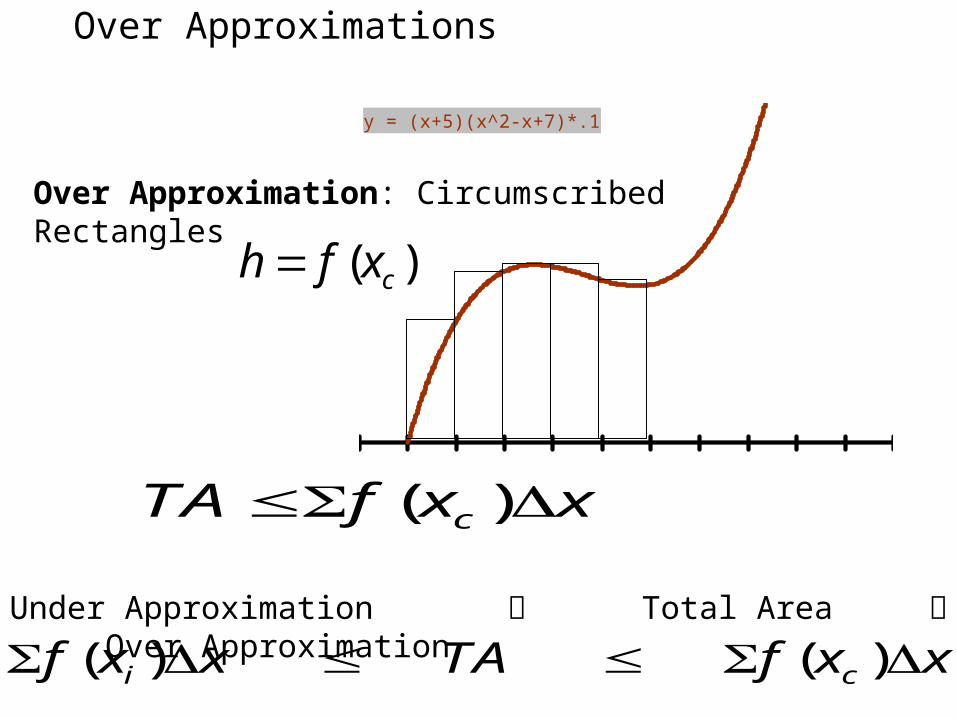
Over Approximations
y = (x+5)(x^2-x+7)*.1
Over Approximation: Circumscribed Rectangles
( )ch f x
( )cTA f x x
Under Approximation Total Area Over Approximation
( ) ( )i cf x x TA f x x
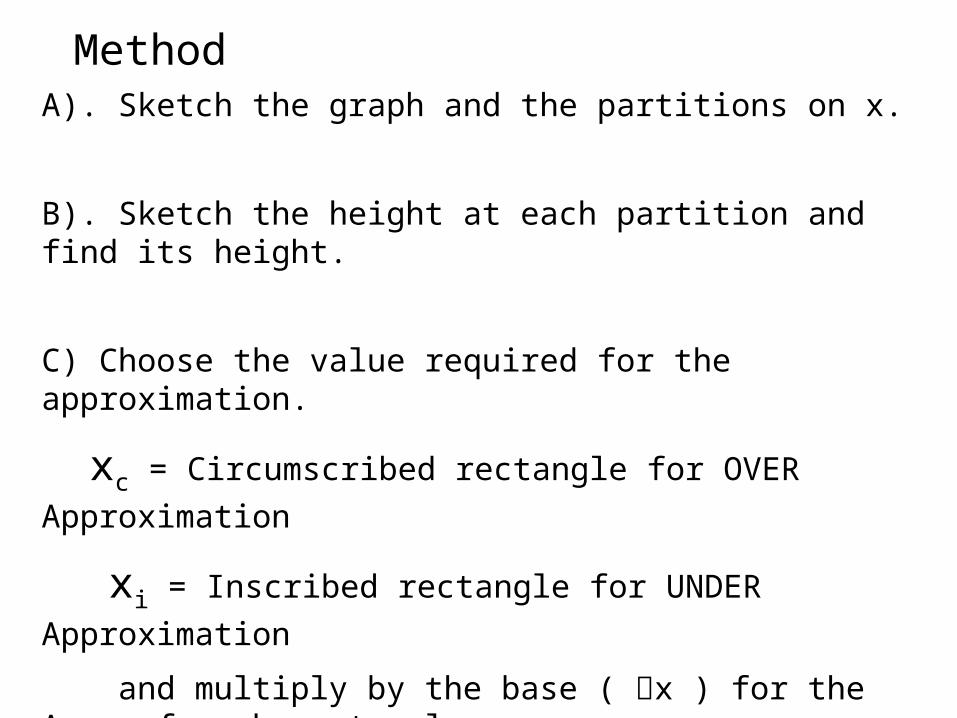
MethodA). Sketch the graph and the partitions on x.
B). Sketch the height at each partition and find its height.
C) Choose the value required for the approximation.
xc = Circumscribed rectangle for OVER Approximation
xi = Inscribed rectangle for UNDER Approximation
and multiply by the base ( x ) for the Area of each rectangle.
D) Add the areas.
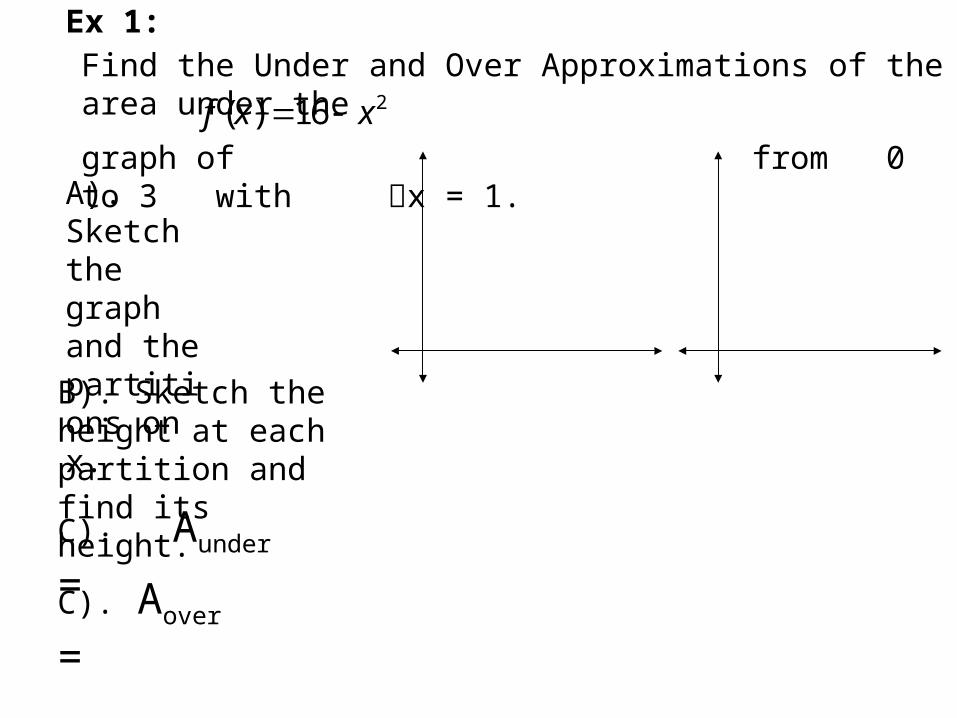
Ex 1:Find the Under and Over Approximations of the area under the
graph of from 0 to 3 with x = 1. 2( ) 16f x x
A). Sketch the graph and the partitions on x.
B). Sketch the height at each partition and find its height.
C). Aunder =
C). Aover =
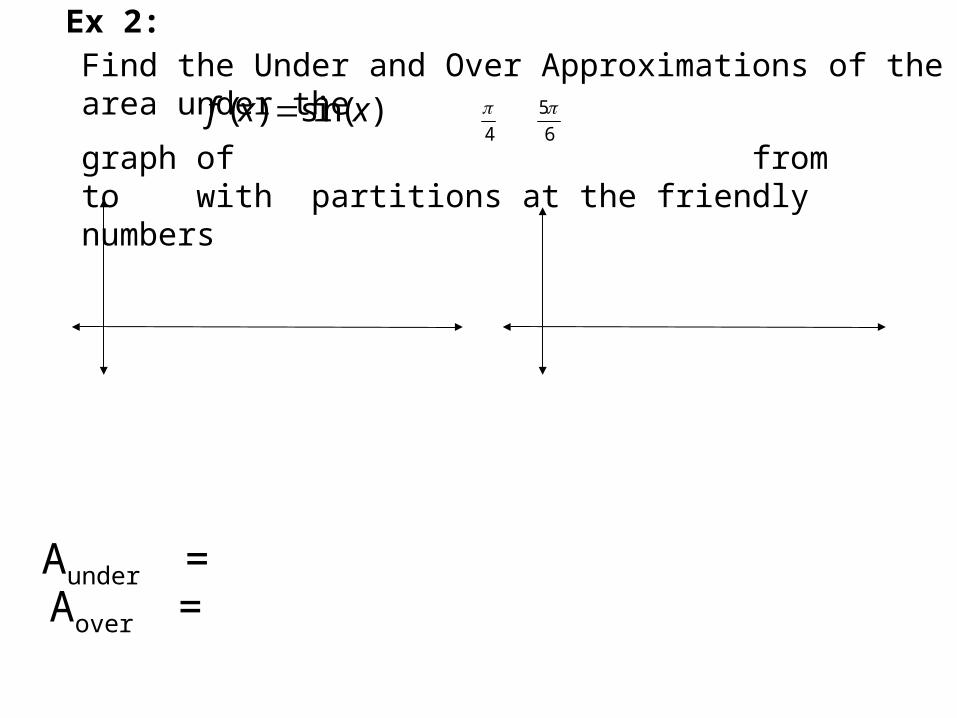
Ex 2:Find the Under and Over Approximations of the area under the
graph of from to with partitions at the friendly numbers
( ) sin( )f x x
Aover =Aunder =
4
5
6
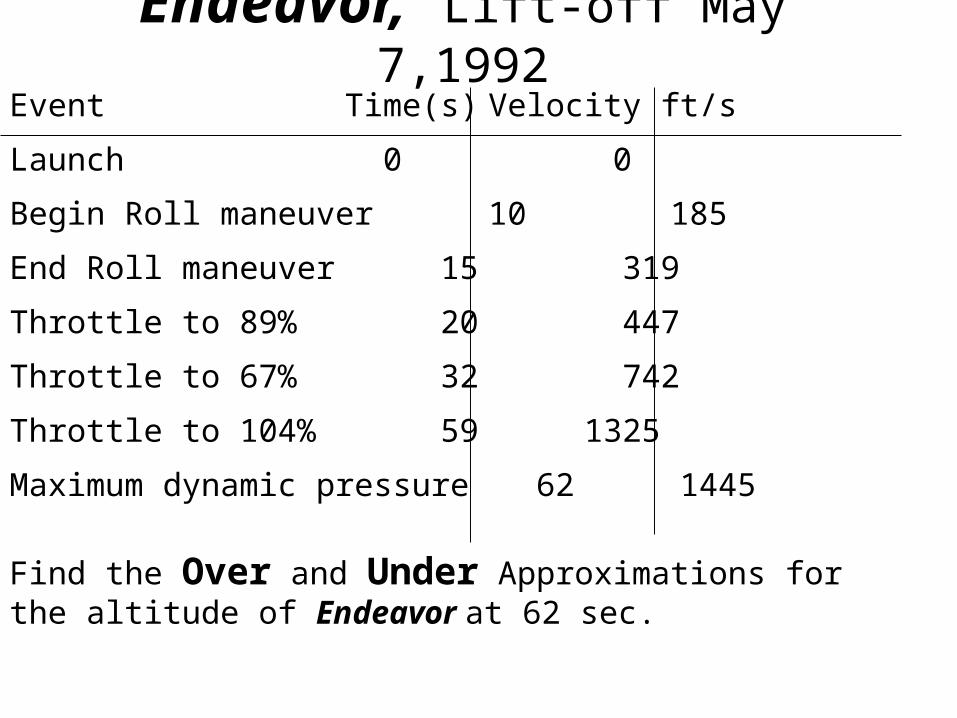
Event Time(s) Velocity ft/s
Launch 0 0
Begin Roll maneuver 10 185
End Roll maneuver 15 319
Throttle to 89% 20 447
Throttle to 67% 32 742
Throttle to 104% 59 1325
Maximum dynamic pressure 62 1445
Endeavor, Lift-off May 7,1992
Find the Over and Under Approximations for the altitude of Endeavor at 62 sec.
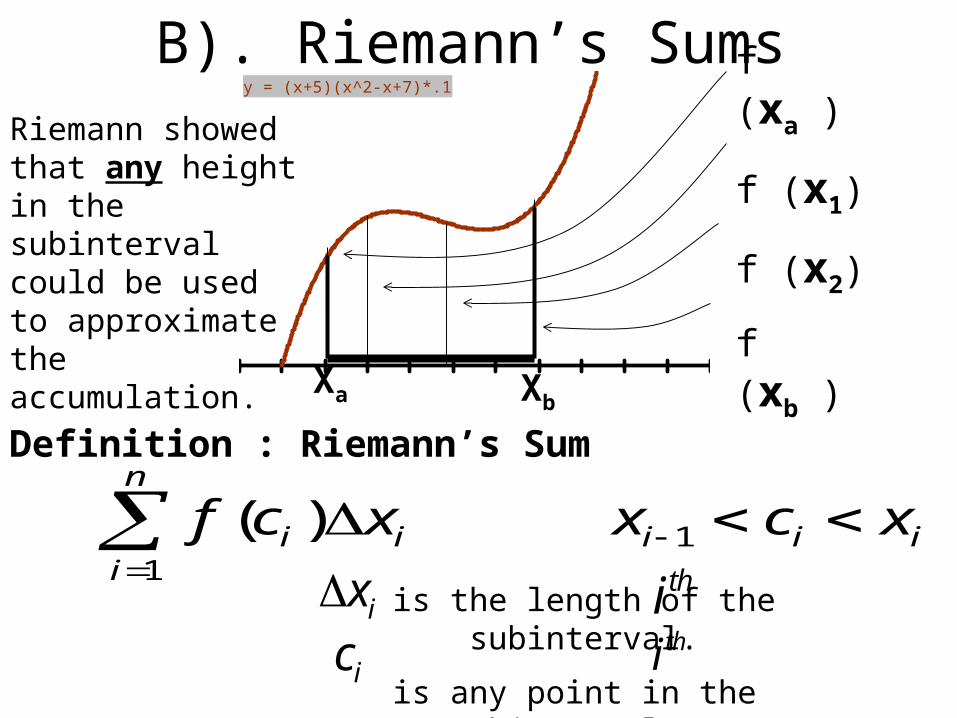
B). Riemann’s Sumsy = (x+5)(x^2-x+7)*.1
Xa Xb
f (xa )
f (x1)
f (x2)
f (xb )
Riemann showed that any height in the subinterval could be used to approximate the accumulation.
Definition : Riemann’s Sum
11
( )n
i i i i ii
f c x x c x
is the length of the subinterval.
is any point in the subinterval
ix thithiic
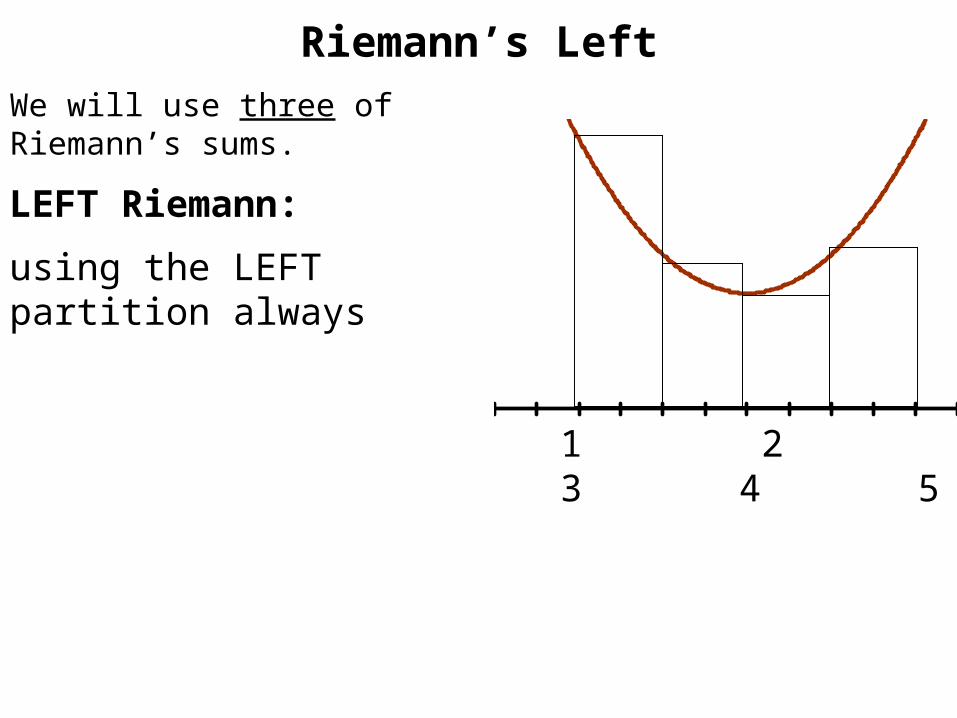
Riemann’s Left
We will use three of Riemann’s sums.
LEFT Riemann:
using the LEFT partition always
1 2 3 4 5
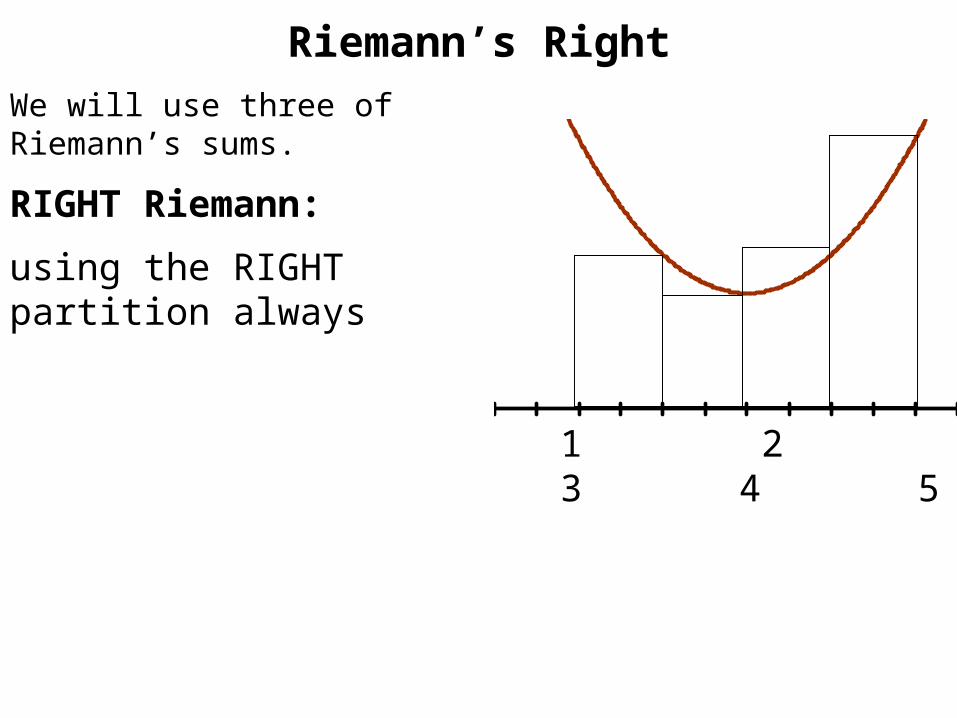
Riemann’s Right
We will use three of Riemann’s sums.
RIGHT Riemann:
using the RIGHT partition always
1 2 3 4 5
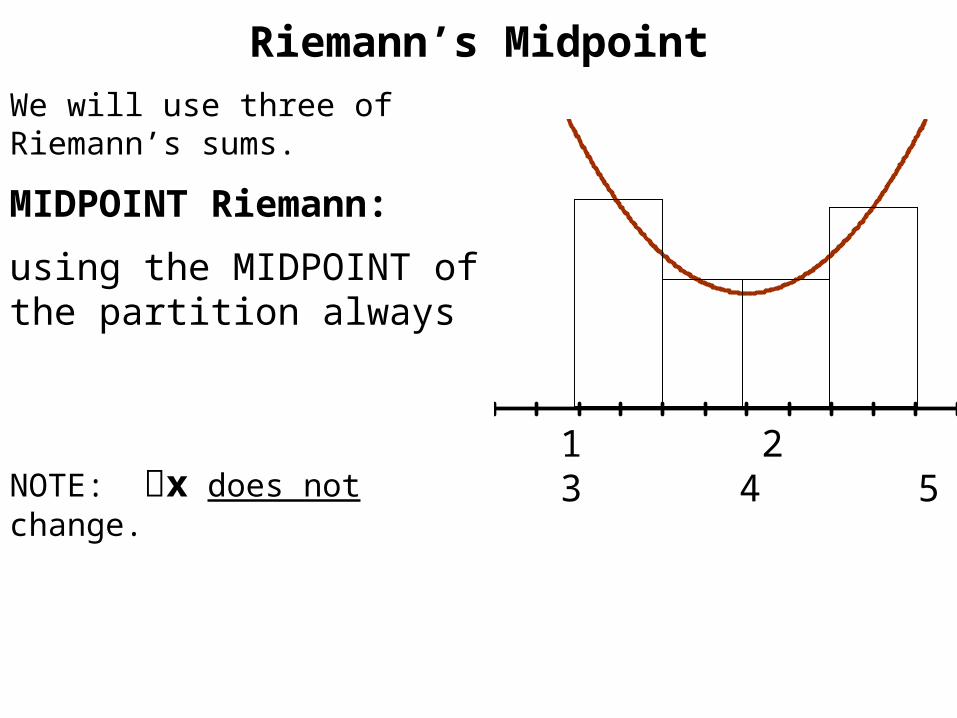
Riemann’s Midpoint
We will use three of Riemann’s sums.
MIDPOINT Riemann:
using the MIDPOINT of the partition always
NOTE: x does not change. 1 2 3 4 5
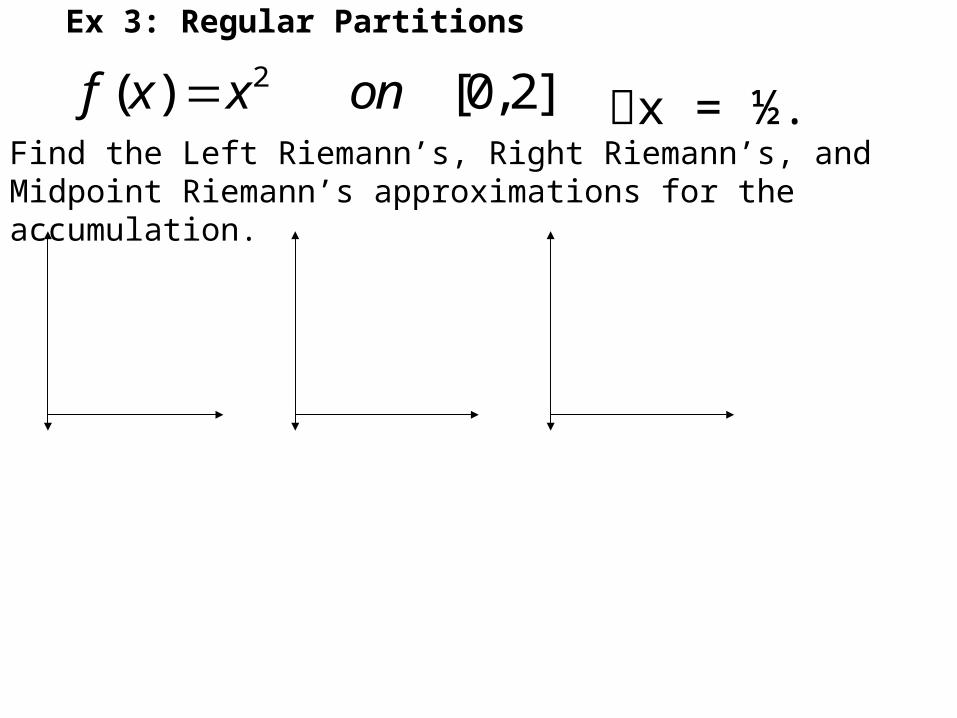
Ex 3: Regular Partitions
Find the Left Riemann’s, Right Riemann’s, and Midpoint Riemann’s approximations for the accumulation.
2( ) [0,2]f x x on x = ½.
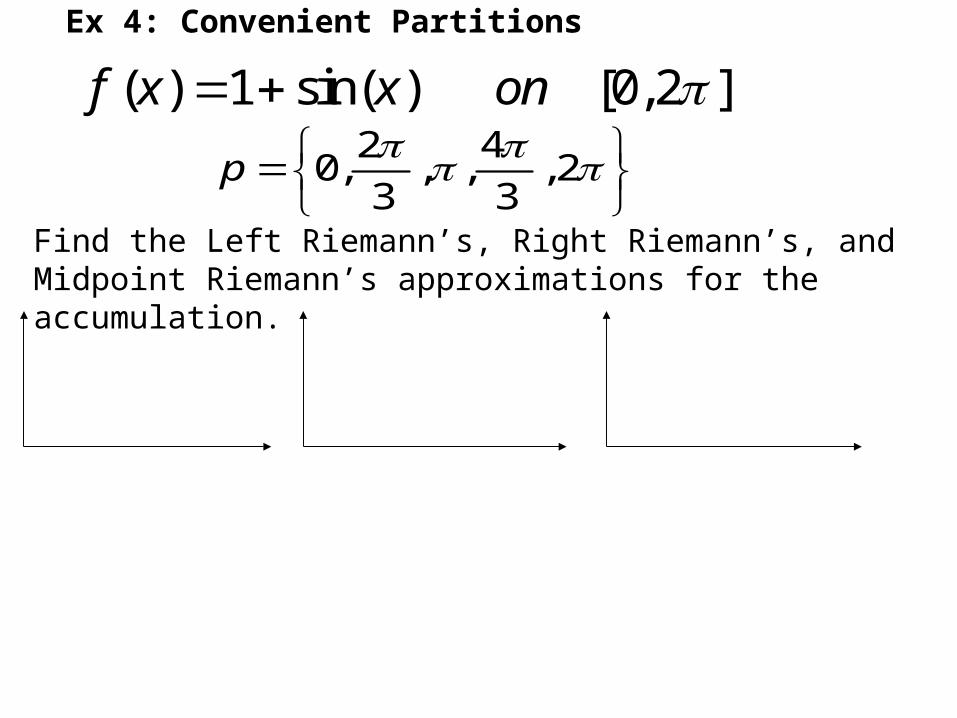
Ex 4: Convenient Partitions
Find the Left Riemann’s, Right Riemann’s, and Midpoint Riemann’s approximations for the accumulation.
( ) 1 sin( ) [0,2 ]f x x on 2 4
0, , , ,23 3
p
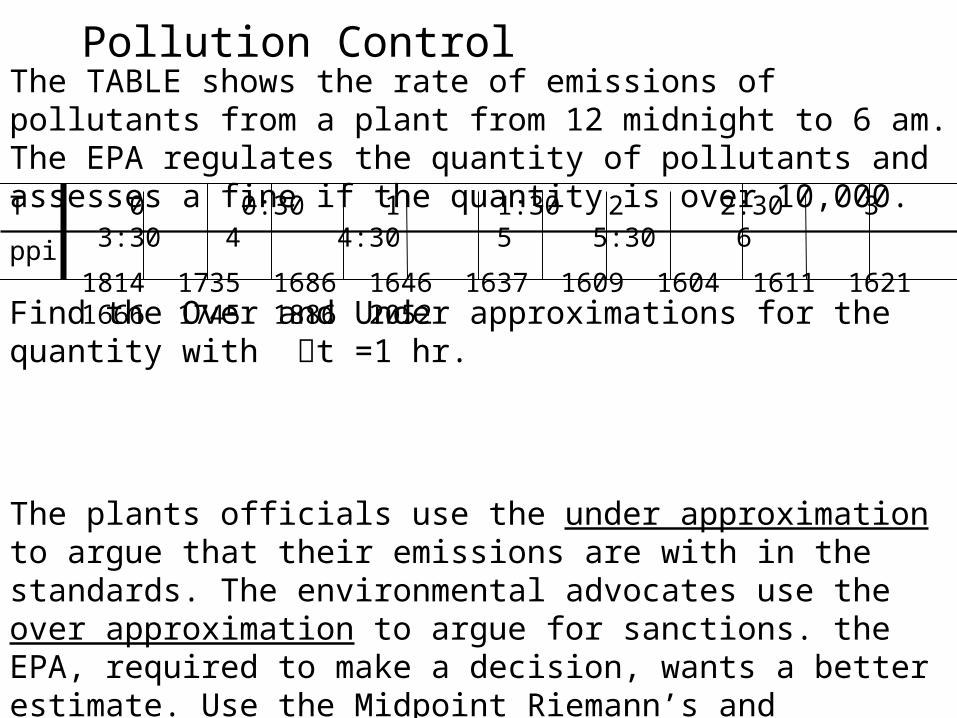
Pollution ControlThe TABLE shows the rate of emissions of pollutants from a plant from 12 midnight to 6 am. The EPA regulates the quantity of pollutants and assesses a fine if the quantity is over 10,000.
0 0:30 1 1:30 2 2:30 3 3:30 4 4:30 5 5:30 6
1814 1735 1686 1646 1637 1609 1604 1611 1621 1666 1745 1886 2052
T
ppi
Find the Over and Under approximations for the quantity with t =1 hr.
The plants officials use the under approximation to argue that their emissions are with in the standards. The environmental advocates use the over approximation to argue for sanctions. the EPA, required to make a decision, wants a better estimate. Use the Midpoint Riemann’s and determine if sanctions are required.

Last Update:
• 01/03/07
• Assignment : worksheet
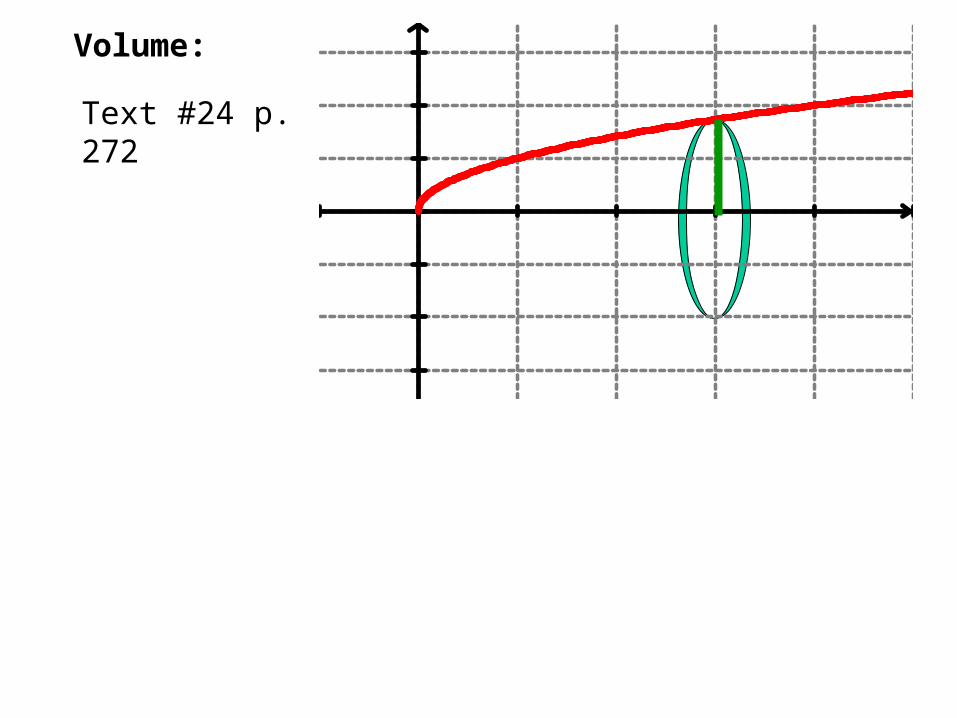
Volume:
Text #24 p. 272
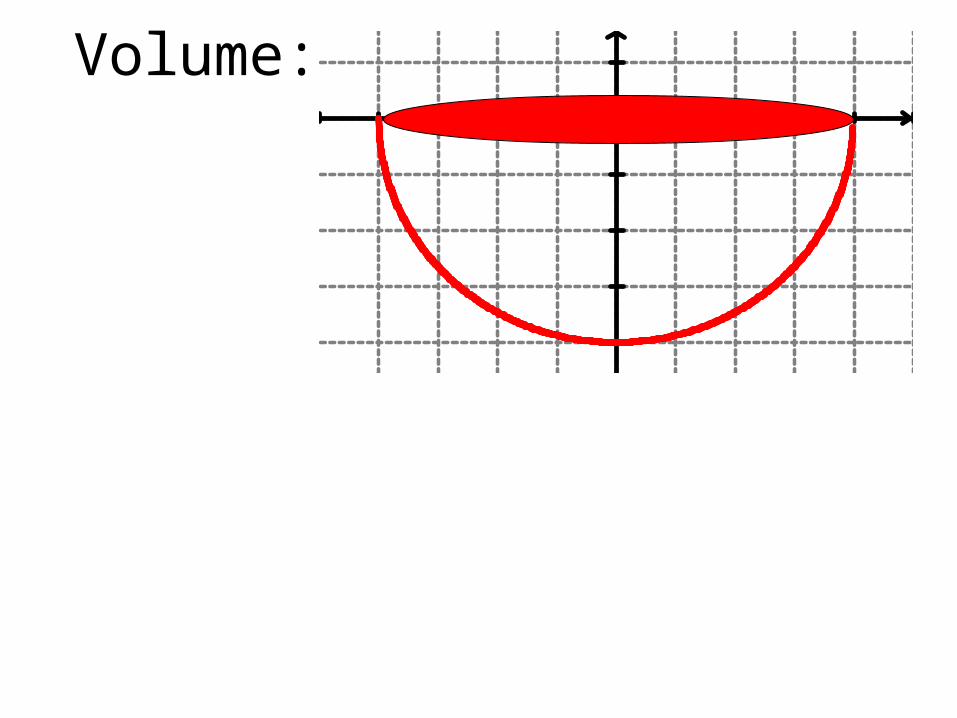
Volume:
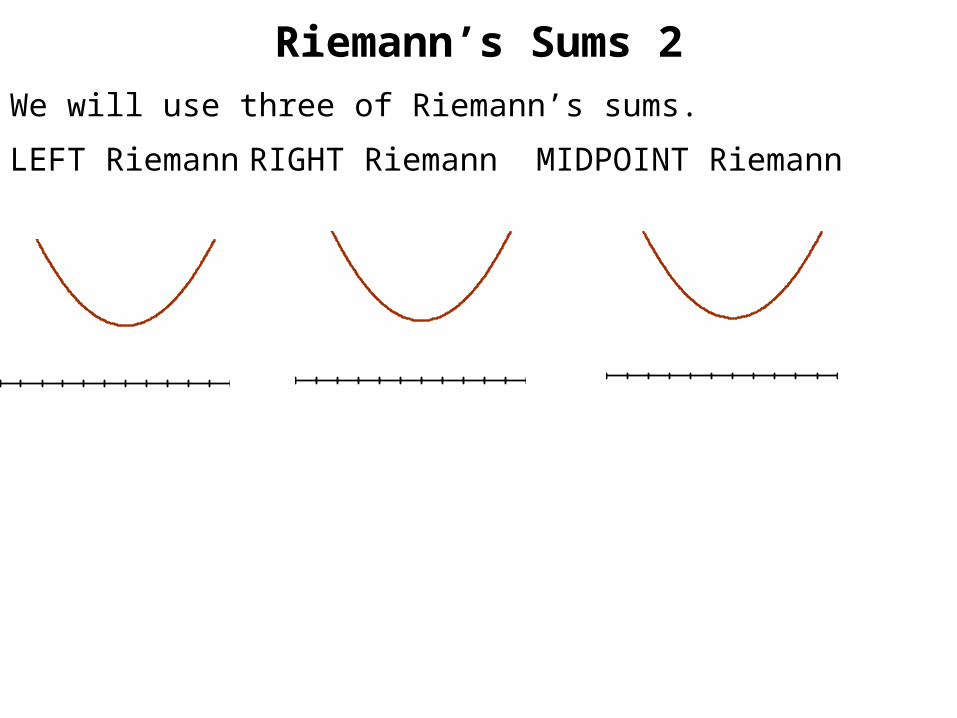
Riemann’s Sums 2
We will use three of Riemann’s sums.
LEFT Riemann RIGHT Riemann MIDPOINT Riemann
y = (x+5)(x^2-x+7)*.1
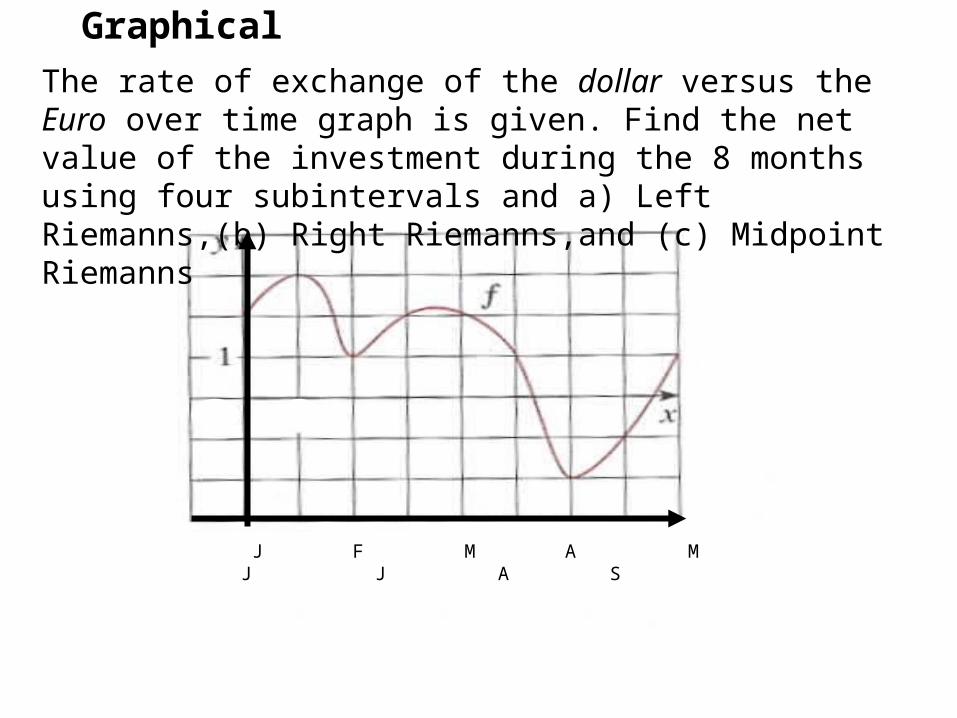
The rate of exchange of the dollar versus the Euro over time graph is given. Find the net value of the investment during the 8 months using four subintervals and a) Left Riemanns,(b) Right Riemanns,and (c) Midpoint Riemanns
Graphical
J F M A M J J A S