2013: A COMPARISON OF PORE-SCALE CENTRIFUGE, …jgmaas.com/SCA/2013/SCA2013-049.pdf · ·...
6
SCA2013-49 1/6 A COMPARISON OF PORE-SCALE CENTRIFUGE, MERCURY INTRUSION AND POROUS PLATE CAPILLARY DRAINAGE NUMERICAL EXPERIMENTS Igor Shikhov and Christoph H. Arns School of Petroleum Engineering, University of New South Wales, Sydney, Australia This paper was prepared for presentation at the International Symposium of the Society of Core Analysts held in Napa Valley, California, USA, 16-19 September, 2013 ABSTRACT Capillary pressure measurements are an essential tool for the characterization of petroleum bearing reservoirs. Three commonly used laboratory techniques, namely, the porous plate (PP), centrifuge, and mercury intrusion (MICP) drainage methods, often provide non-identical capillary pressure curves and consequently residuals, which are difficult to reconcile. We use reconstructed images of Fontainebleau sandstone at high resolution and derive saturation profiles numerically in 3D at the pore scale through morphological distance transforms to model above experiments. The capillary pressure field gradient present in the centrifuge experiment is realized by using as structural element in the invasion simulation a ball with varying diameter. To assess the effect on heterogeneous rock samples we compare the computed saturation profiles on the homogeneous Fontainebleau rock to a numerical model of rock generated by a mixture of a Gaussian random field approach for the large scale features, and two Poisson particle processes at the small scale. The image-based pore-scale numerical interpretation approach for capillary drainage experiments demonstrates the influence of boundary conditions and heterogeneity on the resulting saturation profiles and may provide non- trivial insight into the role of micro-porosity under partial saturation conditions by comparison to experiment. INTRODUCTION Of the three common methods to obtain capillary pressure curves for a rock core, the porous plate technique is usually considered the most accurate. It can be combined with other measurements, e.g. for resistivity index, leads to a relatively homogeneous saturation profile, and allows further analysis with the core. It is however very slow. Mercury intrusion capillary pressure measurements (MICP) are fast and provide access to very small pores, but prevent the use of the sample for further measurements and the fluid might not be representative. An alternative and fast method to setup saturations, first proposed by Hassler and Brunner [1], is high-speed centrifuging (Fig.1). In a centrifuge drainage experiment, a core saturated with wetting fluid is rotated with step-wise increasing rotational speeds. The core holder contains non-wetting fluid, which is allowed to drain into the core. The amount of displaced fluid provides the estimate of average core saturation at each rotational speed. At hydrostatic equilibrium, the pressure discontinuity across the interface (capillary pressure) of two immiscible phases is defined
Transcript of 2013: A COMPARISON OF PORE-SCALE CENTRIFUGE, …jgmaas.com/SCA/2013/SCA2013-049.pdf · ·...
SCA2013-49 1/6
A COMPARISON OF PORE-SCALE CENTRIFUGE,
MERCURY INTRUSION AND POROUS PLATE
CAPILLARY DRAINAGE NUMERICAL EXPERIMENTS
Igor Shikhov and Christoph H. Arns
School of Petroleum Engineering, University of New South Wales, Sydney, Australia
This paper was prepared for presentation at the International Symposium of the Society
of Core Analysts held in Napa Valley, California, USA, 16-19 September, 2013
ABSTRACT
Capillary pressure measurements are an essential tool for the characterization of
petroleum bearing reservoirs. Three commonly used laboratory techniques, namely, the
porous plate (PP), centrifuge, and mercury intrusion (MICP) drainage methods, often
provide non-identical capillary pressure curves and consequently residuals, which are
difficult to reconcile. We use reconstructed images of Fontainebleau sandstone at high
resolution and derive saturation profiles numerically in 3D at the pore scale through
morphological distance transforms to model above experiments. The capillary pressure
field gradient present in the centrifuge experiment is realized by using as structural
element in the invasion simulation a ball with varying diameter. To assess the effect on
heterogeneous rock samples we compare the computed saturation profiles on the
homogeneous Fontainebleau rock to a numerical model of rock generated by a mixture of
a Gaussian random field approach for the large scale features, and two Poisson particle
processes at the small scale. The image-based pore-scale numerical interpretation
approach for capillary drainage experiments demonstrates the influence of boundary
conditions and heterogeneity on the resulting saturation profiles and may provide non-
trivial insight into the role of micro-porosity under partial saturation conditions by
comparison to experiment.
INTRODUCTION
Of the three common methods to obtain capillary pressure curves for a rock core, the
porous plate technique is usually considered the most accurate. It can be combined with
other measurements, e.g. for resistivity index, leads to a relatively homogeneous
saturation profile, and allows further analysis with the core. It is however very slow.
Mercury intrusion capillary pressure measurements (MICP) are fast and provide access to
very small pores, but prevent the use of the sample for further measurements and the fluid
might not be representative. An alternative and fast method to setup saturations, first
proposed by Hassler and Brunner [1], is high-speed centrifuging (Fig.1). In a centrifuge
drainage experiment, a core saturated with wetting fluid is rotated with step-wise
increasing rotational speeds. The core holder contains non-wetting fluid, which is
allowed to drain into the core. The amount of displaced fluid provides the estimate of
average core saturation at each rotational speed. At hydrostatic equilibrium, the pressure
discontinuity across the interface (capillary pressure) of two immiscible phases is defined
SCA2013-49 2/6
by the difference in hydrostatic pressure between them: PC = ∆ρ H a, where H - is
hydrostatic height, ∆ρ - density difference, a – local gravity strength, which in case of
acceleration in centrifugal field is a function of angular velocity ω and position to the
center of rotation r, a = - ω2 r. According to Hassler and Brunner (HB), assuming a core
is homogeneous, the grain matrix incompressible, and interfacial tension constant
(isothermal conditions), the drainage capillary pressure along a sufficiently short core
subjected to spinning can be described by the following simple integral [1]:
-
, (1)
where r2 is the radial distance from the axis to the outer face of the plug and r the radial
distance from the axis to the arbitrary point of the plug (see Figure 1). By applying the
limits, the solution is given by
. (2)
For the Hassler-Brunner outflow boundary condition of (for a discussion see
e.g. [2]), negligible equilibration time, absence of end-piece and radial effects, absence of
bubble formation, and short cores: , an analytical solution can be given by
, (3)
where is average saturation and r1 the distance from the rotational axis to the near end
(inlet face) of the core [1]. Forbes [3] pointed out that for typical centrifuging conditions
this HB approximation (3) can provide a poor estimate, while other known interpretation
techniques provide estimates with associated error of ±3 saturation units at best (in
addition to experimental error). Significant improvements in interpretation of centrifuge
experimental results have been achieved in recent years due to the development of
techniques enabling registration of saturation profiles, including CT assisted imaging [4],
nuclear tracers imaging [5] and MRI [6]. While the previously proposed approaches rely
on experiments, we develop a pore-scale technique characterizing the saturation
distribution within the centrifuged rock plug based on mathematical morphology and a
realistic digitized representation of the sample.
ROCK SAMPLE REPRESENTATION
We use two idealized samples in this study. The first represents a homogeneous sample
and consists of a 15 mm long and 3.75 mm wide reconstructed Fontainebleau sandstone
(Latief et al. [7]), discretised at a resolution of 3.66μm (1024x1024x4096 voxel). The
second is constructed as a dual scale medium by using a Gaussian Random Field (GRF)
to spatially separate two independent Poisson particle placement processes of spheres and
oblate disks, discretised at a resolution 9.375μm (800x800x1600 voxel). The length of
the samples (15mm) is selected to be sufficiently short in respect to standard Beckman
centrifuge distance to inlet to test the Hassler-Brunner approximation (3), which is
supposed to work well if r1/r2 >0.7. Here we have r1=7.1cm and r2=8.6cm and therefore
r1/r2 = 0.83. Cross-sections of the considered samples are depicted in Figure 2 (first row).
SCA2013-49 3/6
CAPILLARY DRAINAGE PERCOLATION MODEL
The numerical simulation of MICP experiments on micro-CT images was successfully
demonstrated by Arns et al. [8]. A good account of the method is given by Hilpert et al.
[9]. Here we consider for all following numerical drainage experiments perfectly wetting
conditions of the invading phase, e.g. a contact angle of θ=180°. All three drainage
experiments, porous plate (PP), mercury intrusion capillary pressure (MICP), and the
centrifuge method (CM), are simulated in 3D by considering the invasion of the structure
using as structuring element bR a ball of radius R, with the radius being inversely
proportional to capillary pressure – for CM this implies that for a given rotational speed
the size of bR is a function of distance from the inlet (see Figure 1). For the PP and CM
techniques, the invasion occurs just from one side (inlet, Figure 1, large b(z), Figures 2c-f,
left) with the other boundaries closed to the draining fluid, while for MICP invasion
occurs from all sides. The outlet boundaries for PP and CM are given by semi-permeable
membranes which only the wetting fluid can traverse (without resistance), while for
MICP the defending phase is considered to be vacuum.
The saturation of each voxel is calculated by considering the union of balls bR, whose
centers form a cluster connected to the inlet(s). For PP and MICP a series of capillary
pressures is considered by increasing the pressure of the invading phase, leading to a
particular saturation map for each step in capillary pressure (R=const.) with a constant
structuring element bR [10]. These saturation maps are combined into a single field by
storing for each voxel the largest invasion radius when the voxel is drained (Figure 2, c-f).
A saturation map for a particular capillary pressure can then be extracted by thresholding
this field with a desired radius cut-off corresponding to a target capillary pressure. For the
centrifuge capillary pressure simulation the approach is similar, with the difference that
the size of the structuring element is now a function of position, R=R(z). The size of the
structuring element bR can be calculated via equation (2) by converting the capillary
pressure at location z to an equivalent capillary pressure, leading to a structuring element
b(z). A saturation map is now defined for each chosen rotational speed and the natural
way of accumulating all saturation maps is by storing the rotational speed at which a
particular voxel is drained (Figure 2, g-h). A saturation map for a particular rotational
speed, representing a whole range of capillary pressures, can then be recovered by
thresholding this RPM-map (rotations per minute).
RESULTS
The simulated drainage experiments on Fontainebleau sandstone and the dual-scale
GRF/Boolean model structure provide the saturation maps (Figure 2) and profiles (Figure
3, 4) over a broad range of capillary pressures and rotational speeds. Figure 2.c-h depicts
the x-z cross-sections of the drainage maps for the central y-slice. The invasion from all
sides for MICP is clearly visible and for the GRF some pores in the center of the structure
are still invaded at lower pressure. Furthermore, there is a clear ordering in the invasion
of small and large porosity for the GRF/Boolean system. Figure 2 also illustrates the
relative homogeneity of the saturation profiles for PP and MICP away from the
boundaries, resulting in similar saturation profiles (not shown). Figure 3 shows the
SCA2013-49 4/6
relative homogeneity of the saturation profiles for the PP method. In comparison, the
saturation profiles for the centrifuge method (Figure 4) show strong trends. The maps as
well as the saturation profiles illustrate clearly the difference in propagation of a
saturation front a) for the different capillary drainage techniques and b) between
homogeneous Fontainebleau sandstone and the heterogeneous dual scale GRF/Boolean
model system. The resulting capillary pressure curves according to (3) are depicted in
Figure 5.
CONCLUSIONS
We present a numerical approach enabling comparisons of the three main capillary
drainage experimental techniques. The impact of heterogeneity on capillary drainage
estimates is demonstrated by simulation on two different systems: homogeneous
Fontainebleau and heterogeneous GRF. For the sufficiently homogeneous system of
appropriate size the Hassler-Brunner approximation agrees well with porous plate and
MICP results.
ACKNOWLEDGMENTS
CHA acknowledges the Australian Research Council for an ARC Future Fellowship. We
acknowledge R. Hilfer for providing the reconstructed image of Fontainebleau sandstone.
REFERENCES
1. Hassler, G.L. and E. Brunner, E., “Measurement of capillary pressures in small core
samples”, Trans. AIME, (1945) 160, 114-123.
2. O’Meara, D.J., G.J. Hirasaki and J.A. Rohan, “Centrifuge measurements of capillary
pressure: Part 1 - Outflow boundary condition”, SPE Res. Eng., (1992) 7, 1,
[SPEv18296], 133-142.
3. Forbes, P., “Centrifuge data analysis techniques: an SCA survey on the calculation of
drainage capillary pressure curves from centrifuge measurements”, SCA Survey,
[SCA-9714], 1997.
4. Wunderlich, R.W., “Imaging of wetting and nonwetting phase distributions:
application to centrifuge capillary pressure measurements”, 60th
Ann. Tech. Conf. and
Exhib. of SPE Trans.: SPE, [SPE 14422], 1985.
5. Graue, A., Borno, T., Spinler, E.A., and Baldwin, B.A., “A method for measuring in-
situ capillary pressures at different wettabilities using live crude oil at reservoir
conditions, Part 1: Feasibility study”, Int. Symp. SCA, [SCA2002-18], 2002.
6. Green, D.P., J.R. Dick, M. McAloon, P.F. de J. Cano-Barrita, J. Burger and B.
Balcom, “Oil/water imbibition and drainage capillary pressure determined by MRI on
a wide sampling of rocks”, Int. Symp. SCA, [SCA2008-01], 2008.
7. Latief, F., B. Biswal, U. Fauzi and R. Hilfer, “Continuum reconstruction of the pore
scale microstructure for Fontainebleau”, Phys. A, (2010) 389, 1607-1618.
8. Arns, C.H., H. Averdunk, F. Bauget, A. Sakellariou, T.J. Senden, A.P. Sheppard,
SCA2013-49 5/6
R.M. Sok, W.V. Pinczewski and M.A. Knackstedt, “Digital Core Laboratory:
Reservoir core analysis from 3D images”, 6th
North Am. Rock Mech. Symp. Trans.:
ARMA, 2004.
9. Hilpert, M. and C.T. Miller, “Pore-morphology-based simulation of drainage in
totally wetting porous media”, Adv. In Water Resources, (2001) 24, 243-255.
10. Arns, C.H., M.A. Knackstedt and N.S. Martys, “Cross-property correlations and
permeability estimation in sandstone”, Phys. Rev. E, (2005) 72, 046304, 1-12.
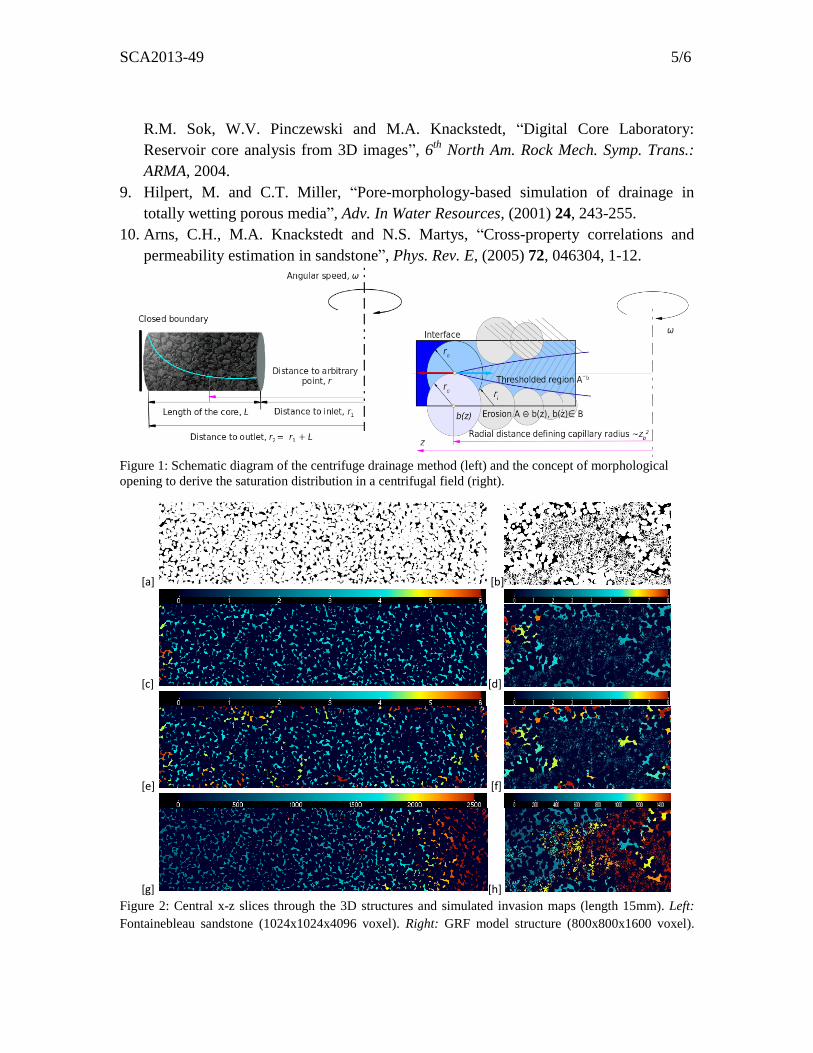
Figure 1: Schematic diagram of the centrifuge drainage method (left) and the concept of morphological
opening to derive the saturation distribution in a centrifugal field (right).
Figure 2: Central x-z slices through the 3D structures and simulated invasion maps (length 15mm). Left:
Fontainebleau sandstone (1024x1024x4096 voxel). Right: GRF model structure (800x800x1600 voxel).
[a] [b]
[c] [d]
[e] [f]
[g] [h]
SCA2013-49 6/6
[a,b] phase images, [c,d] porous plate, [e,f] MICP and [g,h] centrifuge drainage profile respectively. The
inlet (PP, CM) is on the left side, or on all sides (MICP). The colourbars denote the invasion radius for
which a voxel can be first invaded in voxel units [c-f], or the rotational speed in rpm at which a voxel is
drained [g,h]. The region close to the outlet ([g,h]) desaturates only at high rotational speeds.
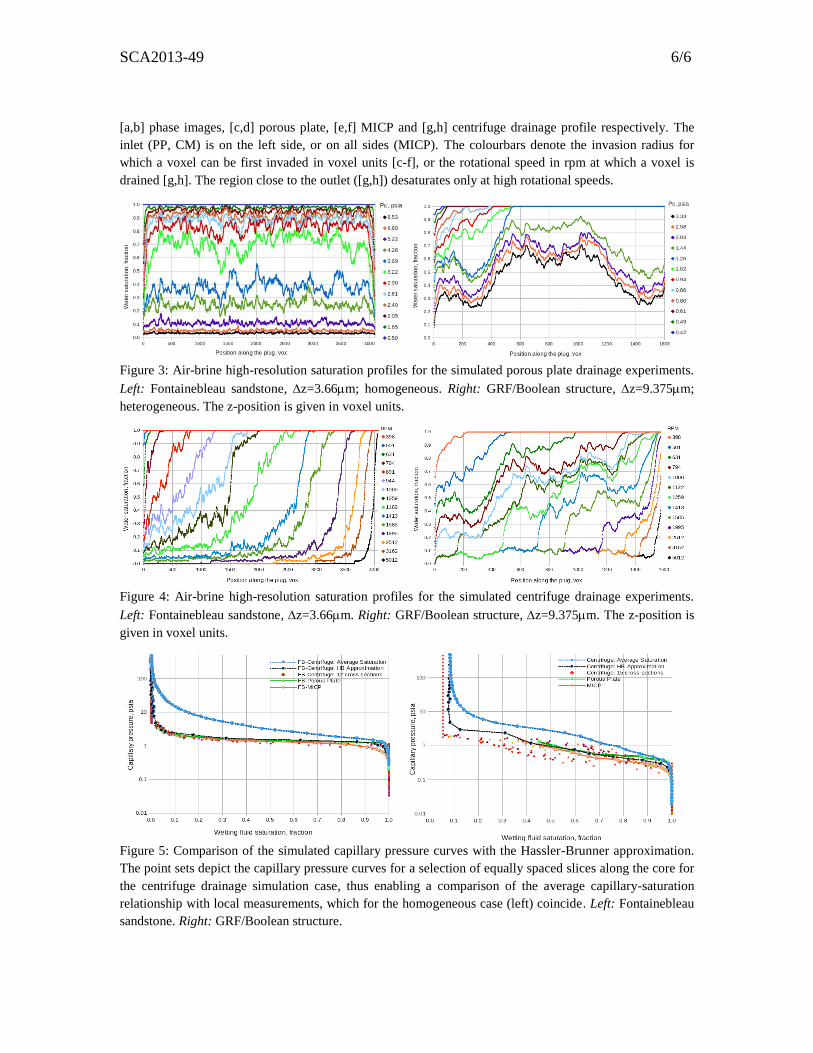
Figure 3: Air-brine high-resolution saturation profiles for the simulated porous plate drainage experiments.
Left: Fontainebleau sandstone, z=3.66m; homogeneous. Right: GRF/Boolean structure, z=9.375m;
heterogeneous. The z-position is given in voxel units.
Figure 4: Air-brine high-resolution saturation profiles for the simulated centrifuge drainage experiments.
Left: Fontainebleau sandstone, z=3.66m. Right: GRF/Boolean structure, z=9.375m. The z-position is
given in voxel units.
Figure 5: Comparison of the simulated capillary pressure curves with the Hassler-Brunner approximation.
The point sets depict the capillary pressure curves for a selection of equally spaced slices along the core for
the centrifuge drainage simulation case, thus enabling a comparison of the average capillary-saturation
relationship with local measurements, which for the homogeneous case (left) coincide. Left: Fontainebleau
sandstone. Right: GRF/Boolean structure.