2005 2014: a review of 101 exploration wells - EBN
19
www.ebn.nl 2005 – 2014: a review of 101 exploration wells Henk Koster 18.02.2016
Transcript of 2005 2014: a review of 101 exploration wells - EBN

www.ebn.nl
2005 – 2014:
a review of 101 exploration wells
Henk Koster 18.02.2016
www.ebn.nl
Outline
• Results:
- POS and success ratios
- Volumes: predrill vs actual
• Depth forecasting at target level
• Success ratios and depth accuracy; creaming curves
• UK results
• Conclusions and recommendations
2
www.ebn.nl
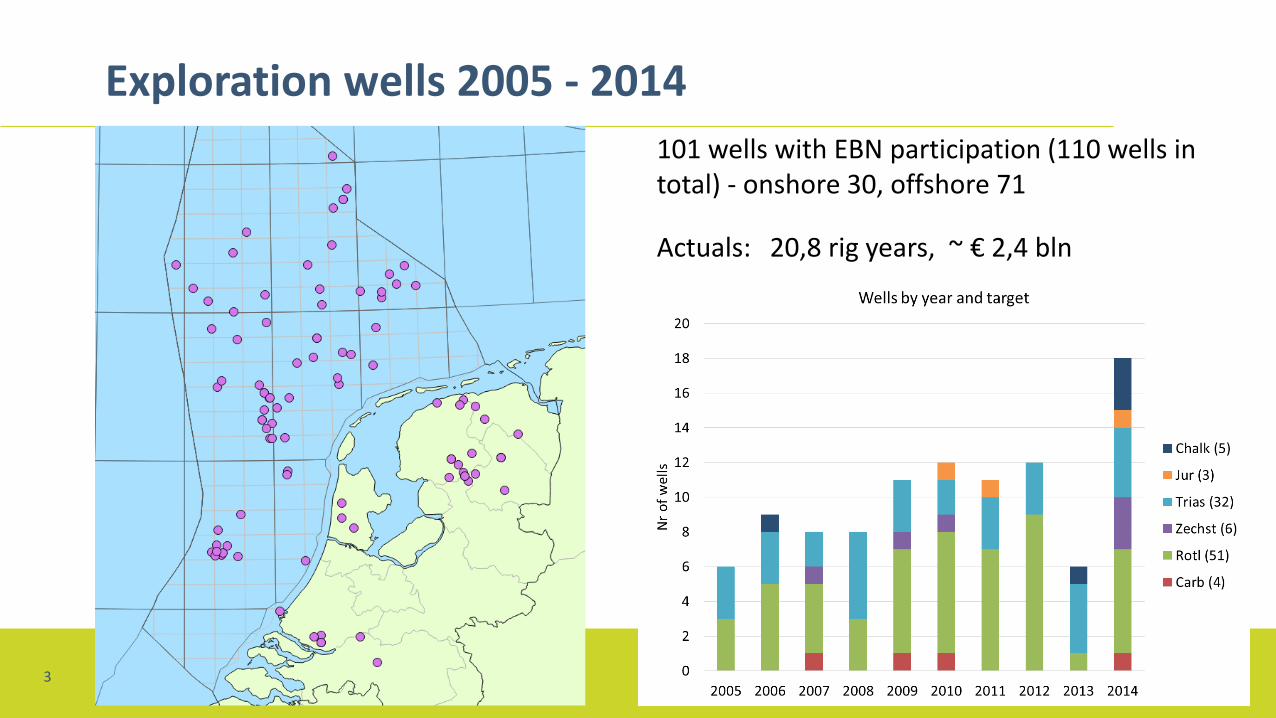
Exploration wells 2005 - 2014
3
101 wells with EBN participation (110 wells in total) - onshore 30, offshore 71
Actuals: 20,8 rig years, ~ € 2,4 bln
www.ebn.nl
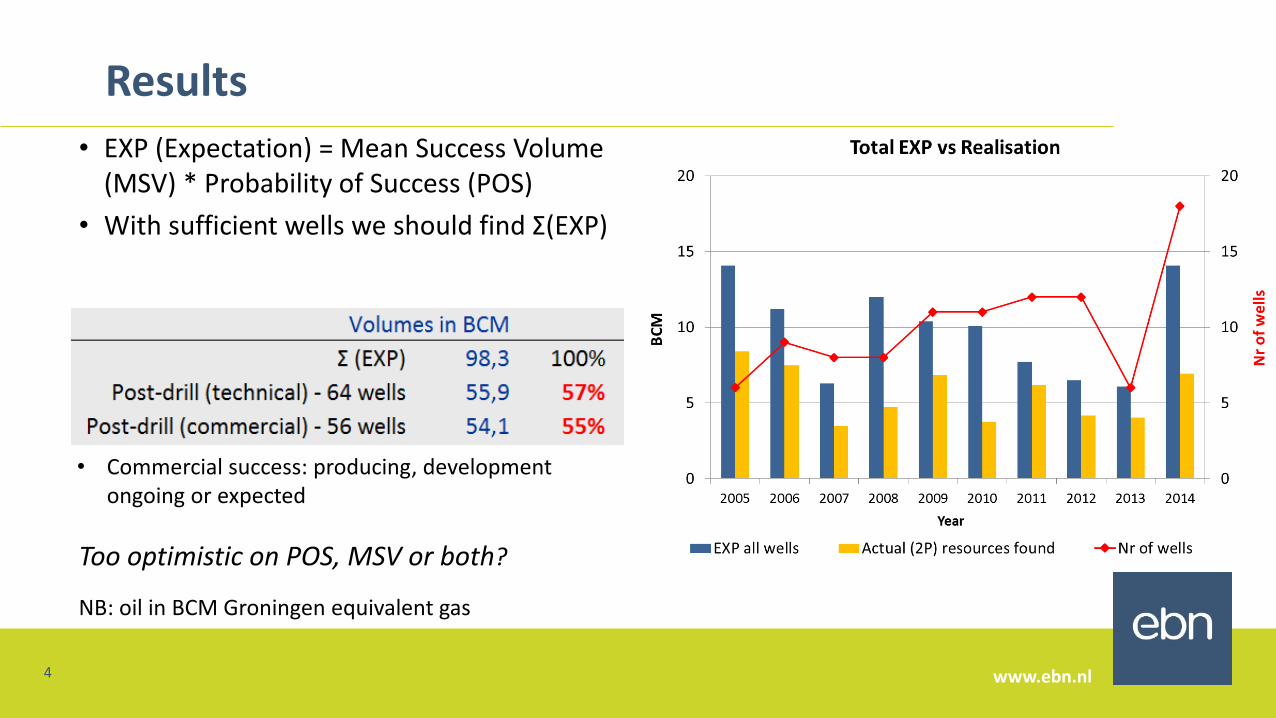
• EXP (Expectation) = Mean Success Volume (MSV) * Probability of Success (POS)
• With sufficient wells we should find Σ(EXP)
NB: oil in BCM Groningen equivalent gas
Results
4
Too optimistic on POS, MSV or both?
• Commercial success: producing, development ongoing or expected
www.ebn.nl
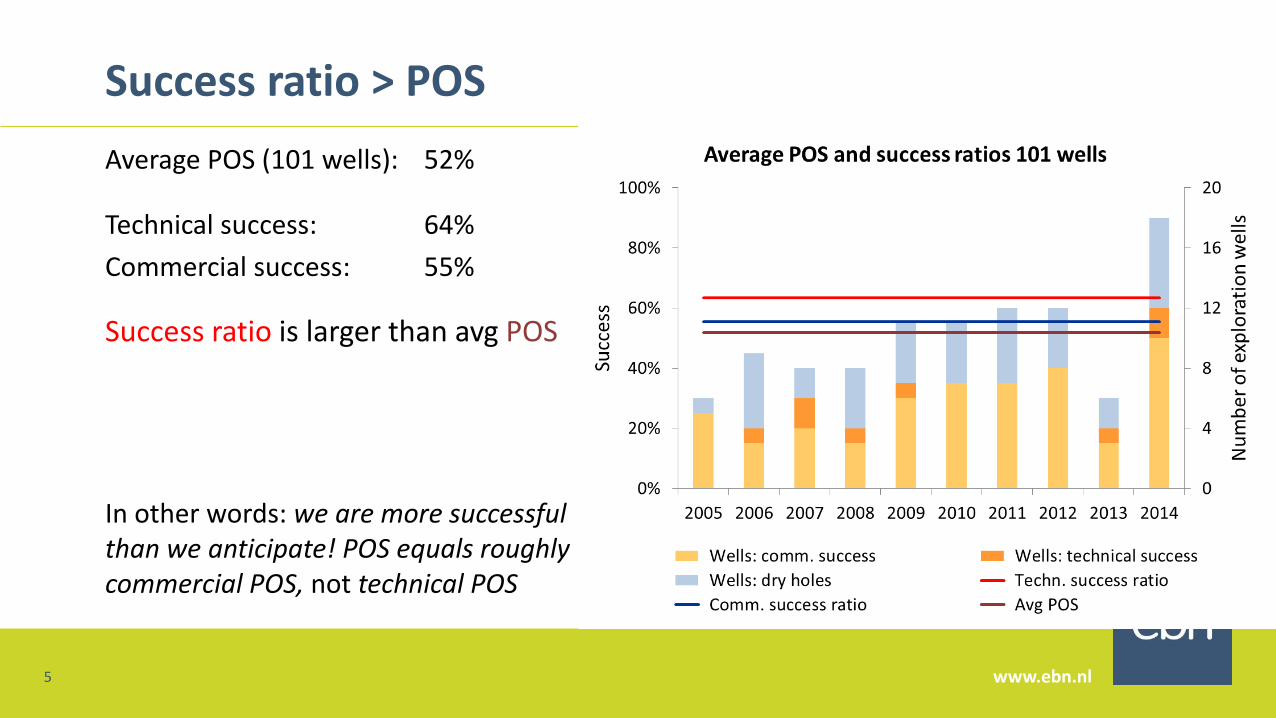
Success ratio > POS
5
Average POS (101 wells): 52%
Technical success: 64%
Commercial success: 55%
Success ratio is larger than avg POS
In other words: we are more successful than we anticipate! POS equals roughly commercial POS, not technical POS
www.ebn.nl
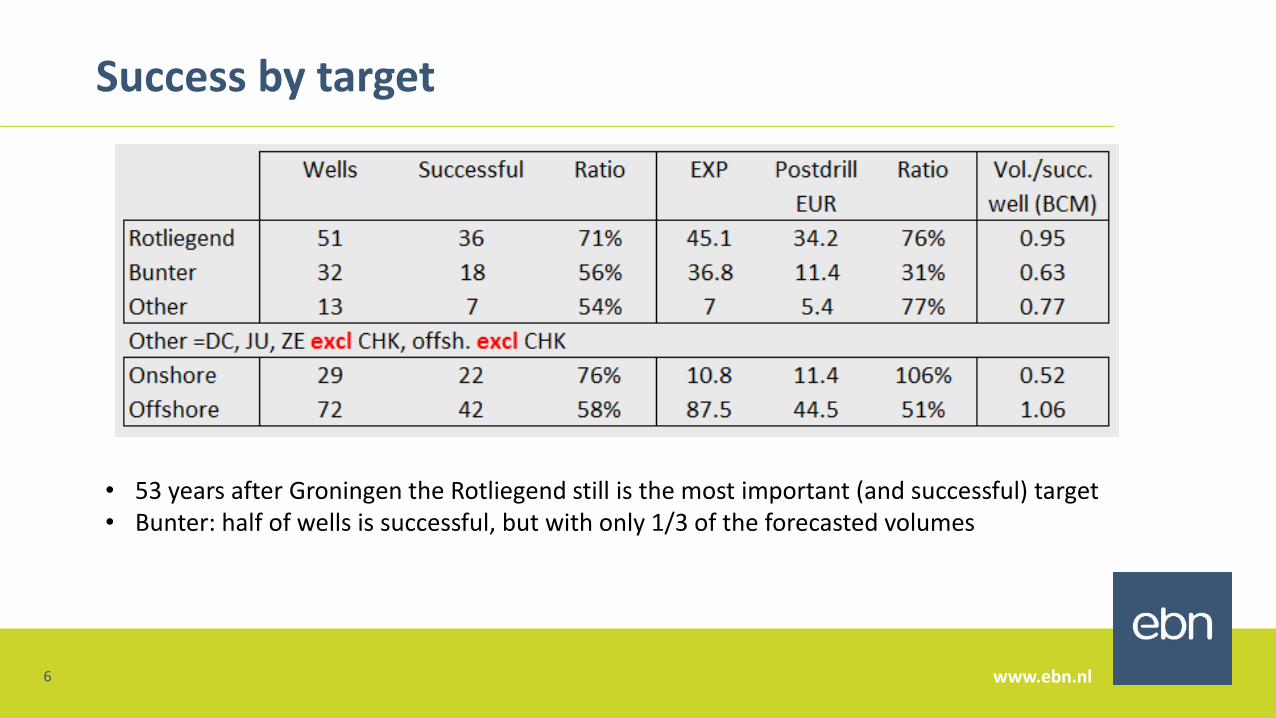
Success by target
6
• 53 years after Groningen the Rotliegend still is the most important (and successful) target• Bunter: half of wells is successful, but with only 1/3 of the forecasted volumes
www.ebn.nl
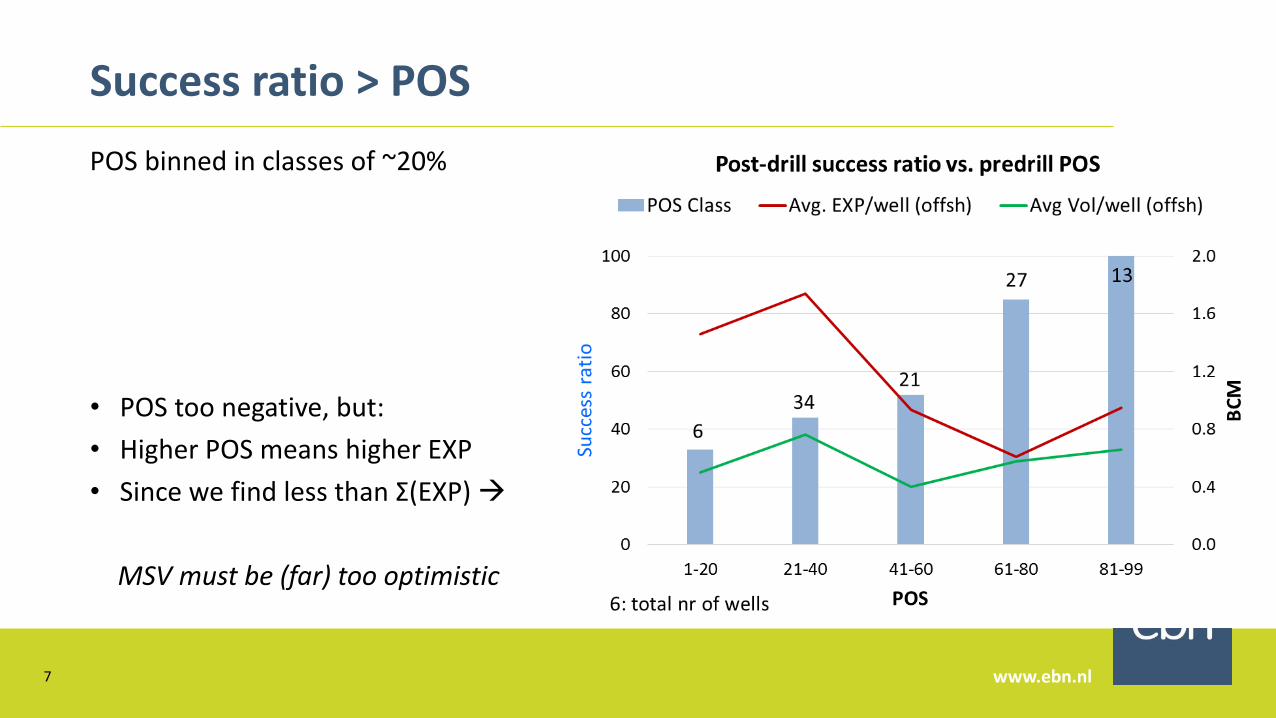
Success ratio > POS
POS binned in classes of ~20%
7
• POS too negative, but:
• Higher POS means higher EXP
• Since we find less than Σ(EXP)
MSV must be (far) too optimistic
www.ebn.nl
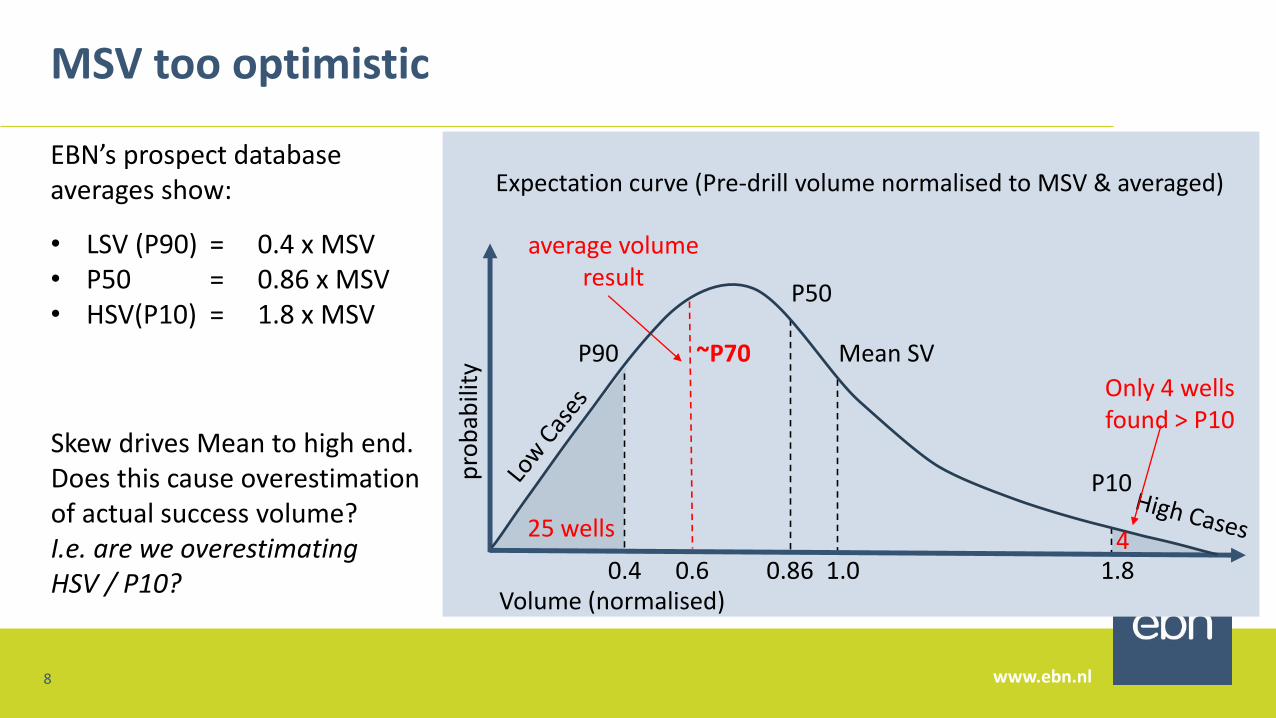
MSV too optimistic
8
EBN’s prospect database averages show:
• LSV (P90) = 0.4 x MSV• P50 = 0.86 x MSV• HSV(P10) = 1.8 x MSV
Skew drives Mean to high end. Does this cause overestimation of actual success volume? I.e. are we overestimating HSV / P10? 1.0 1.80.6 0.860.4
P50
Mean SV
P10
Expectation curve (Pre-drill volume normalised to MSV & averaged)
average volume result
~P70
Only 4 wellsfound > P10
Volume (normalised)
pro
bab
ility
425 wells
P90
www.ebn.nl
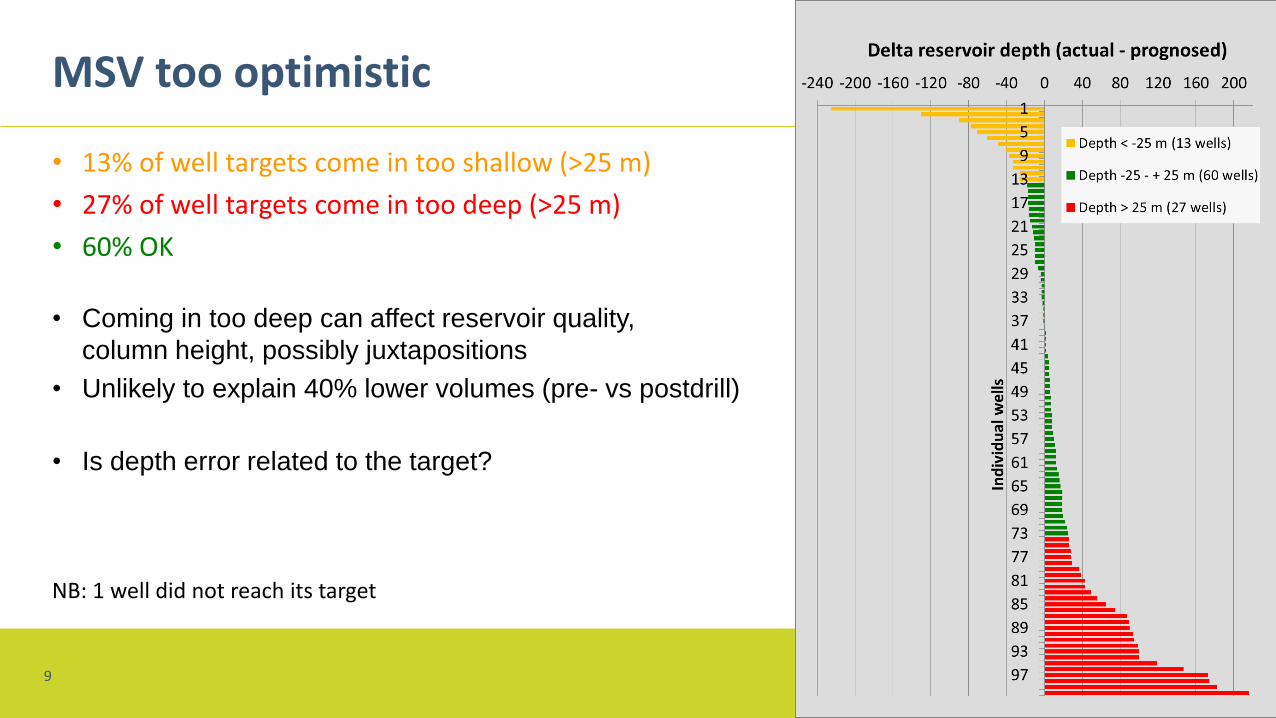
MSV too optimistic
• 13% of well targets come in too shallow (>25 m)
• 27% of well targets come in too deep (>25 m)
• 60% OK
NB: 1 well did not reach its target
9
• Coming in too deep can affect reservoir quality,
column height, possibly juxtapositions
• Unlikely to explain 40% lower volumes (pre- vs postdrill)
• Is depth error related to the target?
www.ebn.nl
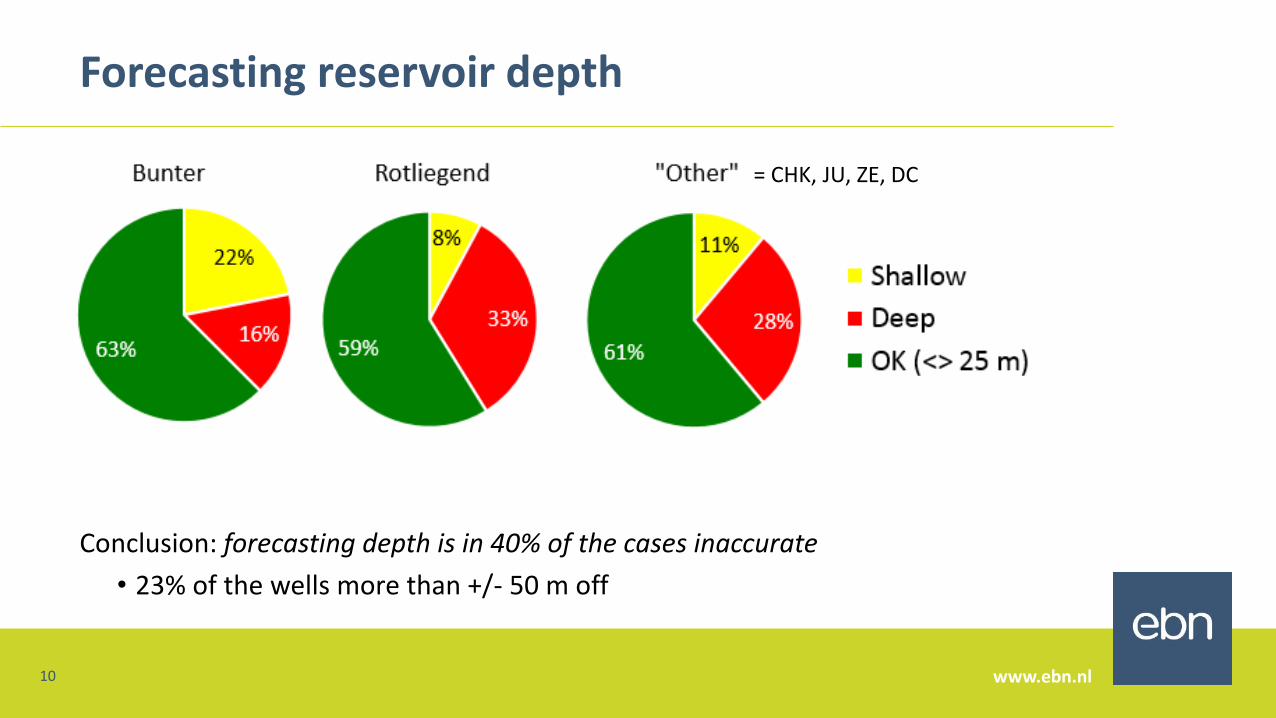
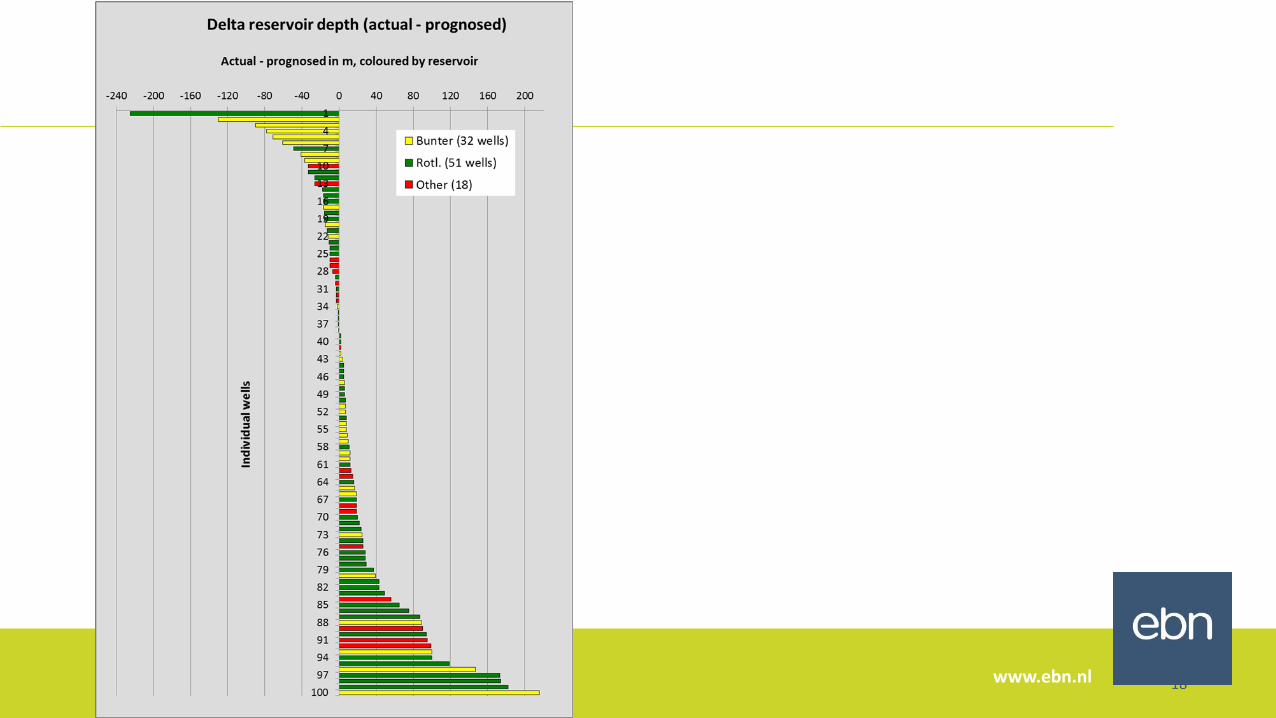
Forecasting reservoir depth
Conclusion: forecasting depth is in 40% of the cases inaccurate
• 23% of the wells more than +/- 50 m off
10
= CHK, JU, ZE, DC
www.ebn.nl
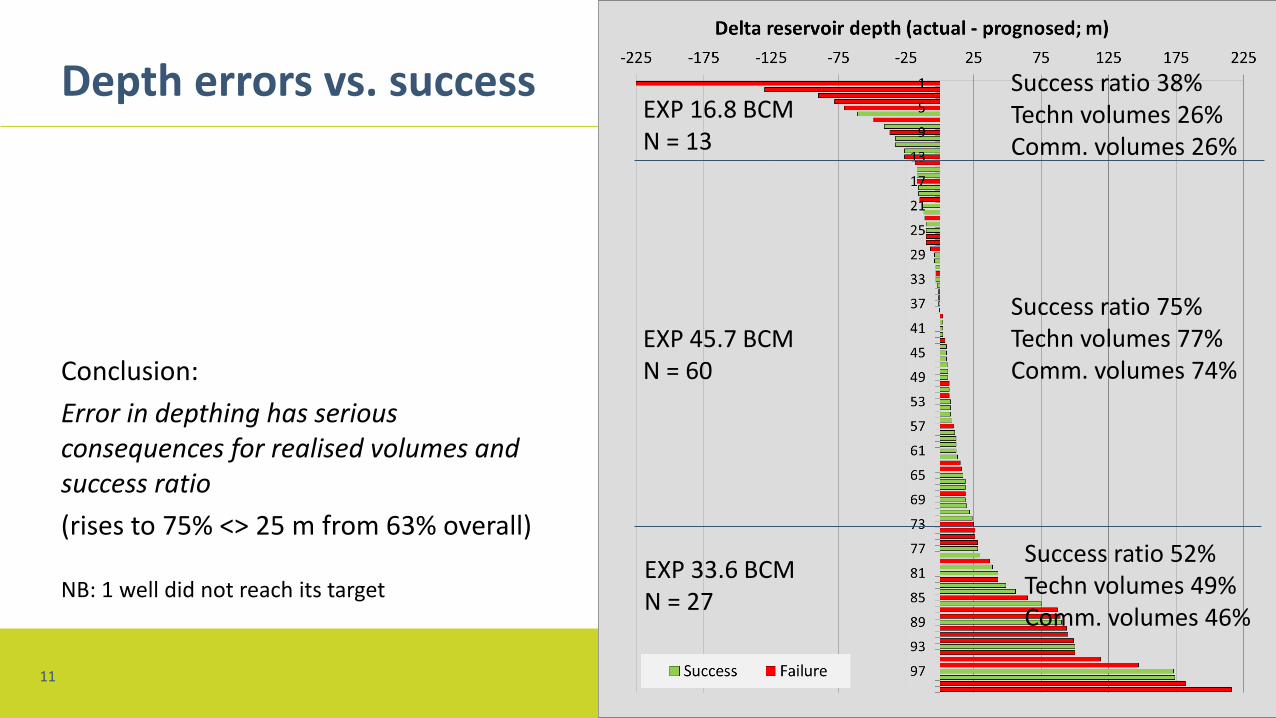
Depth errors vs. success
11
Conclusion:
Error in depthing has serious consequences for realised volumes and success ratio
(rises to 75% <> 25 m from 63% overall)
NB: 1 well did not reach its target
Success ratio 75%Techn volumes 77%Comm. volumes 74%
Success ratio 38%Techn volumes 26%Comm. volumes 26%
Success ratio 52%Techn volumes 49%Comm. volumes 46%
EXP 45.7 BCMN = 60
EXP 16.8 BCMN = 13
EXP 33.6 BCMN = 27
www.ebn.nl
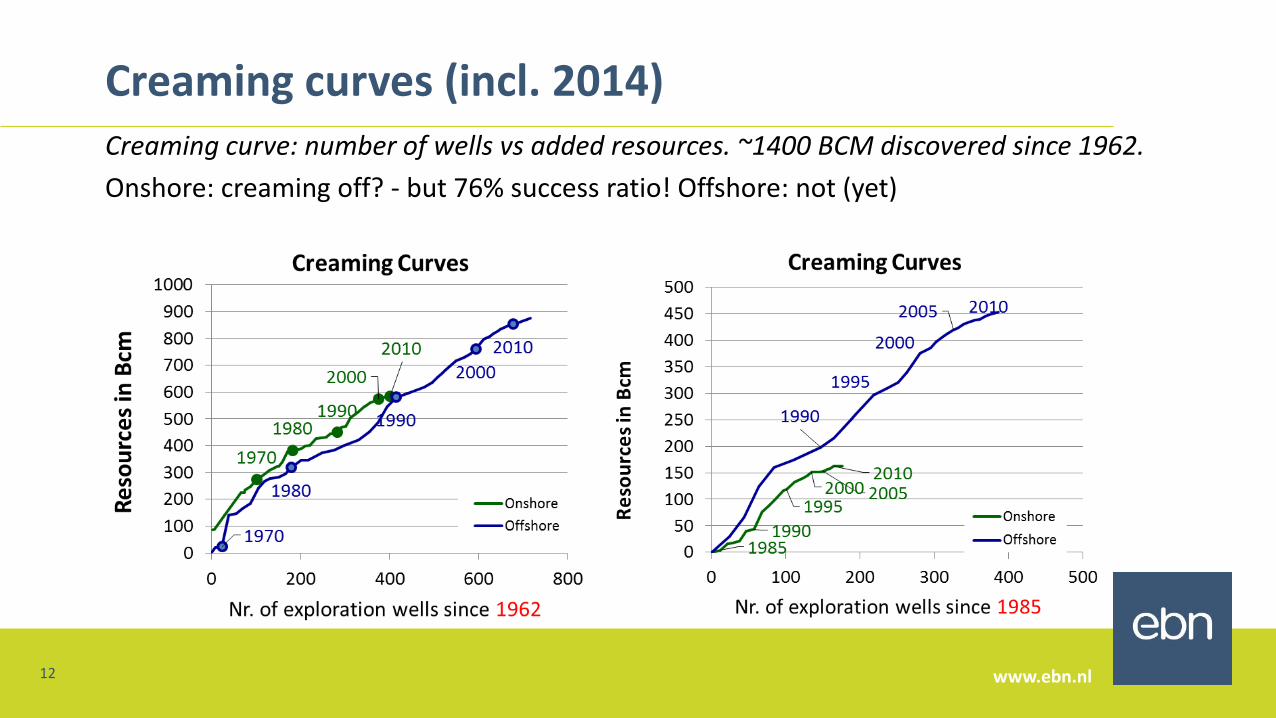
Creaming curves (incl. 2014)
12
Creaming curve: number of wells vs added resources. ~1400 BCM discovered since 1962.
Onshore: creaming off? - but 76% success ratio! Offshore: not (yet)
www.ebn.nl
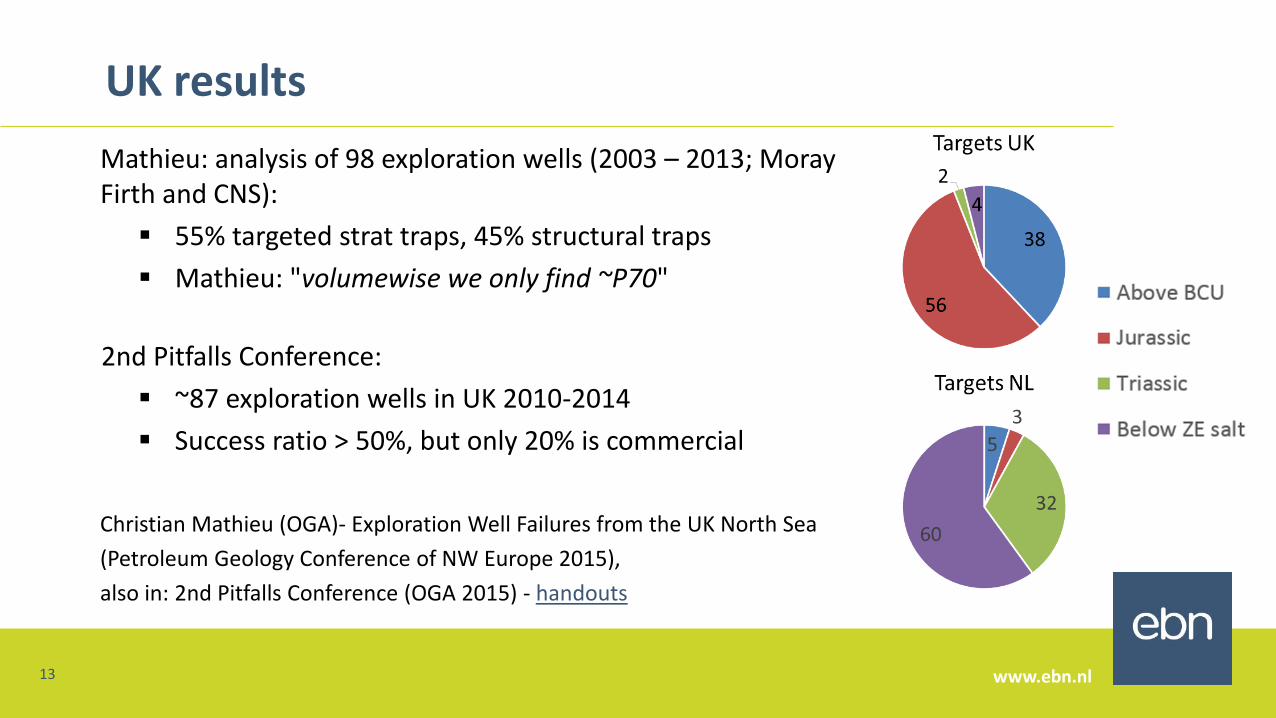
UK results
Mathieu: analysis of 98 exploration wells (2003 – 2013; Moray Firth and CNS):
55% targeted strat traps, 45% structural traps
Mathieu: "volumewise we only find ~P70"
13
2nd Pitfalls Conference:
~87 exploration wells in UK 2010-2014
Success ratio > 50%, but only 20% is commercial
Christian Mathieu (OGA)- Exploration Well Failures from the UK North Sea
(Petroleum Geology Conference of NW Europe 2015),
also in: 2nd Pitfalls Conference (OGA 2015) - handouts
www.ebn.nl
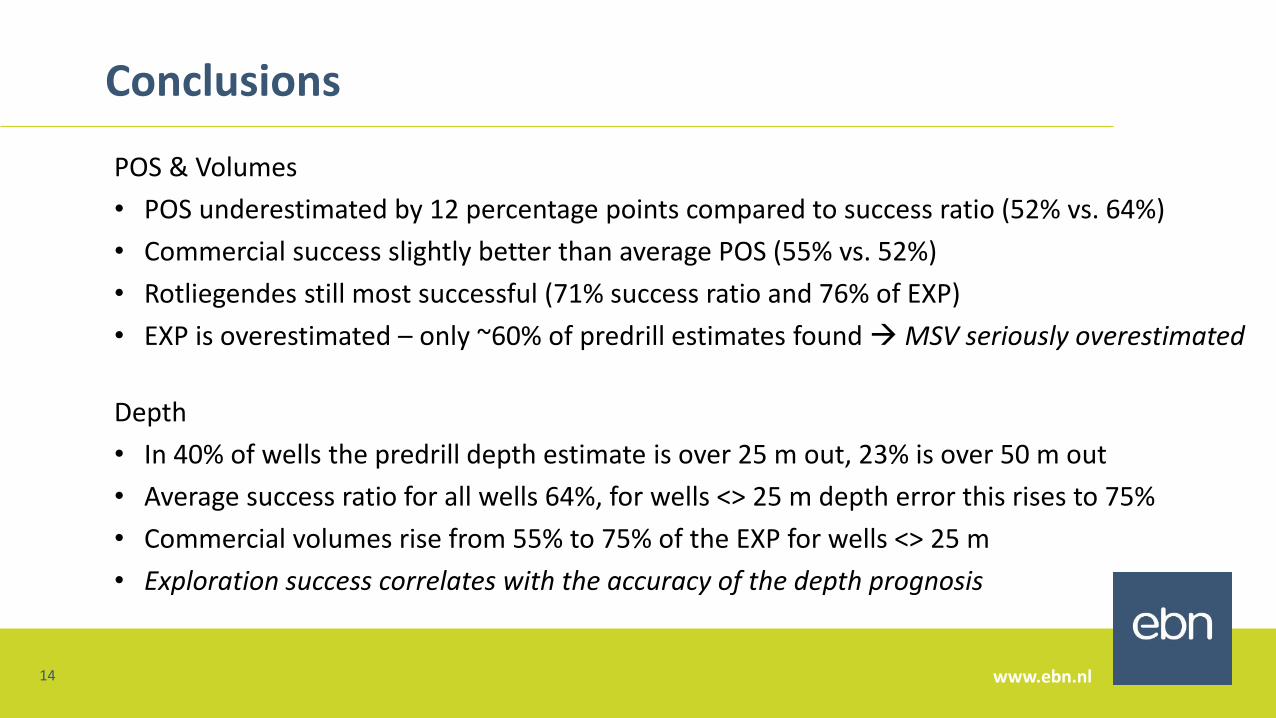
Conclusions
POS & Volumes
• POS underestimated by 12 percentage points compared to success ratio (52% vs. 64%)
• Commercial success slightly better than average POS (55% vs. 52%)
• Rotliegendes still most successful (71% success ratio and 76% of EXP)
• EXP is overestimated – only ~60% of predrill estimates found MSV seriously overestimated
14
Depth
• In 40% of wells the predrill depth estimate is over 25 m out, 23% is over 50 m out
• Average success ratio for all wells 64%, for wells <> 25 m depth error this rises to 75%
• Commercial volumes rise from 55% to 75% of the EXP for wells <> 25 m
• Exploration success correlates with the accuracy of the depth prognosis
www.ebn.nl
Recommendations
• Proper time/depth conversion is essential
• Don't be too negative on risking
• Pay attention to the (parameters for) High Success Volumes (>P10): are these realistic or do they cause an unfounded drift of the Mean to the high end
• Proper post-well analyses - we must learn from our mistakes (and our successes)
• Co-operation: talk to other operators with similar wells; trade wells and seismic
• Peer reviews
• Remember: people are your best asset - staff turnover can lead to loss of corporate memory and regional knowledge
15

www.ebn.nl16
Nevertheless, success can be elusive…
Thank you for your attention.Any questions?
Thanks to Guido Hoetz for constructive reviews

www.ebn.nl
Backup
17
www.ebn.nl 18
www.ebn.nl
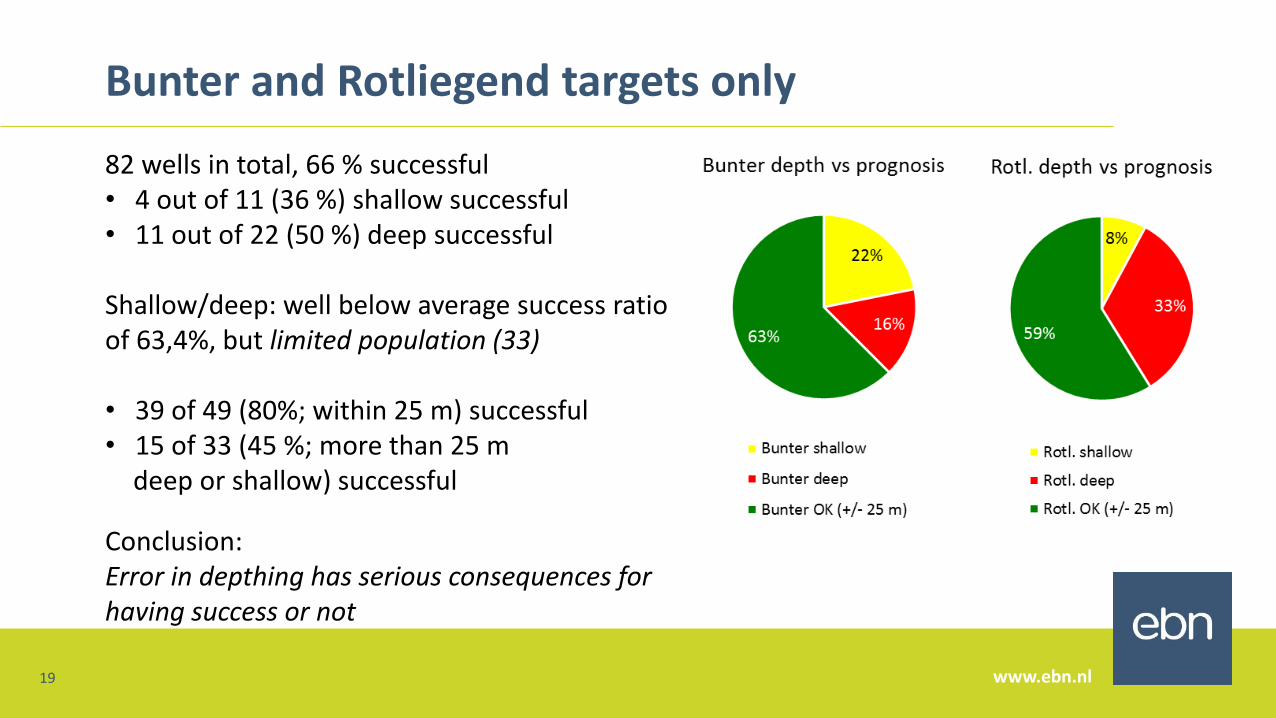
Bunter and Rotliegend targets only
19
82 wells in total, 66 % successful• 4 out of 11 (36 %) shallow successful• 11 out of 22 (50 %) deep successful
Shallow/deep: well below average success ratio of 63,4%, but limited population (33)
• 39 of 49 (80%; within 25 m) successful• 15 of 33 (45 %; more than 25 m
deep or shallow) successful
Conclusion: Error in depthing has serious consequences for having success or not