13C FRACTIONATION IN : STIRRED VERSUS … GLOBAL ENVIRONMENTAL SCIENCE . UNDERGRADUATE DIVISION IN...
32
13 C FRACTIONATION IN EMILIANIA HUXLEYI: STIRRED VERSUS UNSTIRRED DILUTE BATCH CULTURES A THESIS SUBMITTED TO THE GLOBAL ENVIRONMENTAL SCIENCE UNDERGRADUATE DIVISION IN PARTIAL FULFILLMENT OF THE REQUIREMENTS FOR THE DEGREE OF BACHELOR OF SCIENCE IN GLOBAL ENVIRONMENTAL SCIENCE MAY 2002 By Jamie K. Tanimoto Thesis Advisor Dr. Brian N. Popp
Transcript of 13C FRACTIONATION IN : STIRRED VERSUS … GLOBAL ENVIRONMENTAL SCIENCE . UNDERGRADUATE DIVISION IN...
13C FRACTIONATION IN EMILIANIA HUXLEYI: STIRRED VERSUS
UNSTIRRED DILUTE BATCH CULTURES
A THESIS SUBMITTED TO THE GLOBAL ENVIRONMENTAL SCIENCE
UNDERGRADUATE DIVISION IN PARTIAL FULFILLMENT OF THE REQUIREMENTS FOR THE DEGREE OF
BACHELOR OF SCIENCE
IN
GLOBAL ENVIRONMENTAL SCIENCE
MAY 2002
By Jamie K. Tanimoto
Thesis Advisor
Dr. Brian N. Popp
I certify that I have read this thesis and that, in my opinion, it is
satisfactory in scope and quality as a thesis for the degree of Bachelor of
Science in Global Environmental Science.
THESIS ADVISOR
________________________________ Brian N. Popp
Department of Geology and Geophysics
ii

ACKNOWLEDGMENTS
I would like to acknowledge and thank David Hashimoto for his tutelage and
assistance in growing phytoplankton cultures and in several analytical techniques
necessary for my study. I would also like to thank Terri M. Rust for her assistance in
analyzing particulate organic material samples as well as for invaluable guidance and
assistance in the laboratory. I would like to thank Dr. Nicolas Cassar for imparting upon
me great knowledge of several vital analytical techniques. Lastly, I would like to thank
Dr. Brian Popp for his patience, guidance, and seemingly endless knowledge.
iii
ABSTRACT
It has been shown that δ13C of phytoplankton (δ13CP) varies with [CO2(aq)] and
rate of algal growth. It is possible that, by using δ13CP from sediments, [CO2(aq)] can be
inferred. However, other factors can complicate the relationship between δ13CP and
[CO2(aq)]. Discrepancies in results acquired by different culturing methods (chemostat
and dilute batch cultures) is an important issue in understanding carbon isotope
fractionation in phytoplankton that must be resolved before paleo-CO2 can be inferred
from sediment cores. In this study, dilute batch cultures of Emiliania huxleyi were grown
to observe possible differences in carbon isotopic fractionation (εP) in stirred and
unstirred conditions. Three sets of experiments were performed and, in each set of
cultures, stirred cultures exhibit greater fractionation than their unstirred counterparts.
We postulate that phytoplankton in stirred cultures have greater εP because the boundary
layer immediately surrounding the cells is constantly agitated and does not become
enriched in 12C over time as carbon dioxide is assimilated into the cell. Stirred cultures
displayed εP values 1.73‰, 6.71‰, and 2.34‰ greater than unstirred cultures of the same
sets (using mean values of εP when applicable). However, this does not completely
account for the magnitude of differences in and trends of fractionation observed in the
chemostat and dilute batch cultures. Factors that may contribute to these discrepancies
are discussed.
iv
TABLE OF CONTENTS ACKNOWLEDGEMENTS………………………………………………………………iii ABSTRACT……………………………………………...……………………………....iv LIST OF TABLES………………………………………………………………………..vi LIST OF FIGURES………………………………………………………………………vi LIST OF ABBREVIATIONS………………………………………………………….…vi 1. INTRODUCTION…………………………………………………………….….……1 1.1 Background: δ13C of Phytoplankton……………………………………….…1 1.2 Discrepencies Between Culturing Methods…………………………………..4 1.3 This Study……………………………………………………………………..5 2. MATERIALS AND METHODS………………………………………………………8
2.1 Algal Culturing……………………………………………………………….8 2.2 Determination of εP………………………………………………………...…9
3. RESULTS AND DISCUSSION……………………………………………………...12
3.1 Stirred vs. Unstirred Cultures in This Study………………………………...12 3.2 Comparing the Three Studies………………………………………………..16 3.3 Exploring Possiblities Beyond Stirring……………………………………...18
4. CONCLUSIONS……………………………………………………………………..22 REFERENCES…………………………………………………………………………..24
v
LIST OF TABLES
Table 1. Comparison of culturing methods……………………………………………….7
Table 2. Results of stirred and unstirred dilute batch cultures of Emiliania huxleyi……13
Table 3. C:N and carbon per cell for the three studies…………………………………..19
LIST OF FIGURES
Figure 1. (A-C) Growth rates of cultures in Sets 1-3 of this study………………………14
Figure 2. εP vs. μ/CO2 for stirred and unstirred dilute batch cultures of E. huxleyi……..15
Figure 3. εP vs μ/CO2 for combined studies……………………………………………..16
LIST OF ABBREVIATIONS
1. εP = carbon isotope fractionation in phytoplankton
2. μ = growth rate of phytoplankton
3. [CO2(aq)] = aqueous carbon dioxide concentration
4. CO2 = carbon dioxide
5. δ13CX = carbon isotopic composition of specified material, X
vi
1. INTRODUCTION
The quest to understand the breadth and depth of the consequences of human
activity on the environment is a complex, ongoing study. Scientists from a wide range of
disciplines struggle to characterize the many components of the Earth’s dynamic system.
A growing awareness of people’s dependency on the well-being of the environment, as
well as a consciousness of changes already affected by human activities, drives the
movement to understand the environment. However, to predict future effects of
anthropogenic activities on varying ecosystems and on the natural environment as a
whole, we must go beyond studying the present day environment. A strong
understanding of the forces within the environment requires knowledge of how it has
changed and behaved over time.
The importance of one particular component in the environment is well agreed
upon: the carbon cycle (e.g. Berner,1999; Pagani et al., 1999). Given that humans are
very dependent on burning fossil fuels for energy, it is of interest how anthropogenic
additions of carbon dioxide to the atmosphere will affect radiative forcing. The
uncertainties of predicting the effects of these activities on the carbon cycle can be
alleviated by an improved understanding of past climate change and the associated
behavior of atmospheric carbon dioxide concentration.
1.1 Background: δ13C of Phytoplankton
Great strides in paleoclimatology have been made in recent decades. In
recognition of the sensitivity displayed by many marine organisms to environmental
conditions during growth and development, paleoceanographers have developed varying
1
methods of paleosea-surface temperature reconstruction (Brassell, 1993). For example,
oxygen isotopic abundance in planktonic formainferal tests and the degree of
unsaturation in alkenones are two methods that have been studied and refined (e.g.
Muller, et al., 1998). Much work is required to reliably quantify and constrain factors
involved in the relationship between biomarker and signal. However, once established,
these relationships may be used to interpret the paleoclimate records embedded in
sediments.
Past studies have linked the carbon isotopic composition of marine organic
matter, δ13Corg, to aqueous CO2 concentration (Arthur et al., 1985; Hayes et al., 1989;
Popp et al., 1989, Rau et al., 1989). An offset in carbon isotopic composition between
aqueous CO2 and marine organic matter exists that could possibly relate 13C abundances
of sedimentary organic matter to the aqueous carbon dioxide concentration during the
formation of that matter. Because sediment diagenesis does not appear to alter isotopic
abundances in organic matter (e.g. Arthur et al., 1985), the sedimentary isotopic record
remains intact. However, it has become apparent that δ13Corg varies beyond the range of
the δ13C of dissolved inorganic carbon in ocean water (e.g., Rau et al., 1997). These
variations have been linked to photosynthetic fractionation of 13C and other possible
sources of discrimination in or by the cell. Studies have shown that factors such as cell
geometry, growth rate or cellular carbon demand, the ability to actively assimilate
inorganic carbon, and light cause variations in carbon isotopic fractionation by marine
microalgae or εP (Rau et al., 1992; Goericke et al., 1994; Rau et al., 1996; Laws et al.,
1995 & 1997; Bidigare et al., 1997; Popp et al., 1998 & 1999; Riebesell et al., 2000; Rost
et al., 2002).
2
Under the assumption that CO2 (aq) passively diffuses through the cell membrane
to support photosynthesis, a link between the δ13C of phytoplankton (δ13CP) and [CO2 (aq)]
has been made with the possibility that sedimentary records of δ13Corg may give insight to
[CO2 (aq)] (Rau et al. 1997). Recent studies have shown that 13C fractionation by
phytoplankton is linearly related to growth rate (μ) and [CO2(aq)] in natural conditions
(Laws et al., 1995 & 1997; Bidigare et al., 1997). In addition, Popp et al. (1998) account
for much of the variation found in εP by different species of phytoplankton by factoring
cell geometry into the relationship. With many important strides being made in
understanding εP, methods of relating the significant offset of δ13C of phytoplankton to
ambient conditions of [CO2] have been proposed and are, at present, in the refinement
stages. However, it is recognized that carbon isotope fractionation is complex and many
factors exceed the scope of this paper. Thus, only a few variables of particular interest
are discussed.
A mathematical model introduced by Rau et al. (1996) evaluates the effects of
varying growth rate, cell radius, temperature, ambient [CO2 (aq)], cell wall permeability
and enzymatic fractionation. The model shows that with increasing cell radius, εp
decreases and that this effect is amplified with increasing growth rate. Naturally, εp
mirrors the activity of the fractionation associated with the enzymes responsible for
inorganic carbon fixation, εf, increasing or decreasing with it. εp increases with
increasing ambient [CO2(aq)] and cell wall permeability to CO2. However, with
increasing growth rate, fractionation and δ13C are less sensitive to changes in ambient
[CO2(aq)] and cell wall permeability. With increasing growth rate and cellular carbon
demand, there is a greater disequilibrium between extracellular and intracellular carbon
3
concentrations. Under these conditions, the importance of enzymatic fractionation
decreases relative to diffusive fractionation in seawater (Rau et al., 1996). Lastly, as
temperature increases, a slight increase in fractionation is observed, though it must be
noted that this is probably a reflection of the dependence of growth rate or CO2 solubility
on temperature. The model by Rau et al. (1996) shows that while 13C fractionation is not
simple, it is not impossible to understand and hopefully constrain.
Furthermore, under certain conditions a “boundary layer” effect may contribute to
variability in the isotopic composition of the cell. As CO2 is drawn from the bulk media,
concentrations decline in the immediate vicinity, or boundary layer, of the cell. This
leaves more 13C-enriched inorganic carbon in the boundary layer. Also, as 13C is
discriminated against during diffusive uptake and enzymatic fractionation, the boundary
layer is further enriched in 13C relative to the surrounding seawater. Goericke et al.
(1994) state that CO2 uptake can be diffusion limited with the CO2 in the boundary layer
enriched in 13C relative to that in the bulk media. A correlation between turbulence and
δ13C has been seen, with low turbulence associated with high δ13C (Goericke et al.,
1994). However, this is not always the case and it may be a matter of the species of
carbon utilized and whether or not active uptake of inorganic carbon is employed.
1.2 Discrepencies Between Culturing Methods
Besides the expected complications in constraining natural factors in 13C
fractionation, discrepancies exist between various culturing methods (see Laws et al.,
2001). The applicability of these methods to the ocean environment is uncertain and
direct field measurements to compare with laboratory measurements are often
4
problematic to obtain. Differences in δ13C of the same species grown under similar
conditions have been observed in experiments performed in different labs, which may be
a result of varying culturing methods (Bidigare et al., 1997; Riebesell et al., 2000). For
example, studies with similar [CO2(aq)] and growth rates show variation in εp for the same
algal species in chemostats and dilute batch cultures (Bidigare et al., 1997; Popp, et al.,
1998; Riebesell et al., 2000). Maximum fractionation in continuous cultures (i.e.
chemostats) approaches that of the consensus maximum fractionation caused by key
enzymes in carbon fixation reactions, such as ribulose bisphosphate carboxylase-
oxygenase (RUBISCO): ~25-27‰ (Laws et al., 1995 & 1997; Bidigare et al., 1997, Popp
et al., 1998; Rosenthal et al., 2000). Much lower values are observed in dilute batch
cultures: ~15‰ (Hinga et al., 1994; Burkhardt et al., 1999; Riebesell et al., 2000). Also,
there is a strong dependence of εp on μ/CO2 in chemostats, while in dilute batch cultures,
the dependence observed is weak.
Differences observed between culturing methods may be a product of different
light cycles (continuous vs. light:dark cycles), nutrient saturation or limitation,
differences in turbulence (stirring vs. occasional agitation), and phases of growth (steady
state vs. exponential growth). While the debate of which culturing methods are most
representative of natural systems is important, it is also necessary to understand why
different methods cause variations in 13C fractionation.
1.3 This Study
The goal of this study is to resolve the discrepencies in observations from
continuous cultures (nutrient limited chemostats) and dilute batch cultures as reported by
Bidigare et al., 1997 and Riebesell et al., 2000. While there are several differences
5
between the culturing methods of the two studies (see Table 1), this study examines the
effects of media agitation specifically. We show that a difference in fractionation exists
between stirred and unstirred cultures and speculate that this difference is influenced by a
boundary layer effect that occurs in cultures that are only gently agitated 1-2 times a day.
Emiliania huxleyi is used to best replicate studies in which differences in observations
may be atrributed to culturing methods.
6

Tabl
e 1.
Det
ails
of c
ultu
ring
met
hods
as p
erfo
rmed
by
Rie
bese
ll et
al.
(200
0), B
idig
are
et a
l. (1
997)
, and
in th
is st
udy.
This
Wor
k
Dilu
te B
atch
Cul
ture
Emili
ania
hux
leyi
BT6
and
55a
, no
n-ca
lcify
ing
stra
ins
Con
tinuo
us, S
atur
ated
Nut
rient
Rep
lete
Com
bina
tion
of c
ultu
res
cont
inuo
usly
stirr
ed a
nd in
verte
d 2-
3 tim
es a
day
Inno
cula
ted
at ~
300
cells
mL-1
H
arve
sted
at 3
0,00
0±10
,000
cel
ls
mL-1
Air-
equi
libra
ted
at m
anip
ulat
ed
and/
or re
cord
ed te
mpe
ratu
res
Bid
igar
e et
al.,
199
7
Con
tinuo
us C
hem
osta
t
Emili
ania
hux
leyi
B92
/11,
ca
lcify
ing
stra
in; E
mili
ania
hu
xley
i B
T6, n
onca
lcify
ing
Con
tinuo
us, S
atur
ated
Nitr
ate-
Lim
ited
Con
tinuo
usly
stirr
ed b
y m
agne
tic
stir
bar
Cul
ture
gro
wn
to d
esire
d de
nsity
, of
ten
mor
e th
an 5
00,0
00 c
ells
m
L-1
Air
mix
ture
bub
bled
in a
t rat
es
vary
ing
by d
esire
d gr
owth
rate
Rie
bese
ll et
al.,
200
0
Dilu
te B
atch
Cul
ture
Emili
ania
hux
leyi
B92
/11,
ca
lcify
ing
stra
in
Ligh
t:Dar
k C
ycle
16
:8 h
ours
Nut
rient
Rep
lete
Gen
tly in
verte
d 2-
3 tim
es a
day
Inno
cula
ted
at <
300
cells
mL-1
H
arve
sted
at 3
0,00
0±10
,000
cel
ls
mL-1
Add
ition
of H
Cl o
r NaO
H to
cr
eate
var
ying
CO
2 co
ncen
tratio
ns
Cul
turin
g M
etho
d
Alg
al S
peci
es
Ligh
t Sou
rce
Nut
rient
s
Agi
tatio
n
Cul
ture
Den
sity
CO
2 sys
tem
m
anip
ulat
ions
7
2. MATERIALS AND METHODS
2.1 Algal Culturing
The haptophyte Emiliania huxleyi (noncalcifying strains BT6 and 55a CCMP
1742 obtained from the Center for Culture of Marine Phytoplankton, West Boothbay
Harbor, Maine) was grown in dilute batch cultures under conditions of nutrient and light
saturation at room temperature and also at a constant, controlled temperature. Dilute
batch culturing, defined here as <30,000 cells mL-1, allows several simultaneous
experiments in a short time period. In one experiment, 8 cultures of BT6 were kept at
room temperature, 4 of which were constantly agitated by stir bar and 4 were agitated 1-2
times a day by gentle inversion. In the other two experiments, three 4-liter polycarbonate
bottles were immersed in a temperature-controlled water bath kept at 15° and 20°C. Of
these, two cultures were constantly stirred and one culture was agitated 1-2 times a day.
For the temperature-controlled experiments, culture temperature was logged (Onset Stow
Away TidbiT temperature loggers) every two minutes for the entirety of the experiment.
Temperature varied by less than 0.7°C. For all three experiments, light was supplied
continuously by a bank of fluorescent lamps at an intensity of 318 μE m-2 s-1.
Each dilute batch culture consisted of 3.8 liters of sterilized, 0.2 μm filtered
seawater and nutrients according to f/2 media. Dissolved inorganic carbon (DIC) and
alkalinity samples were taken before inoculation to determine initial concentrations of
inorganic carbon in the media. The cultures were inoculated at 300 cells mL-1. Growth
rates, determined by daily change in cell density, varied from 0.35 d-1 to 1.23 d-1. Cell
density was determined using a Coulter Z1 dual threshold particle counter using a 50 μm
aperature tube and a 3-8 μm threshold to optimize detection of these ~5 um diameter
8
cells. Cultures were sampled at a cell density of ~30,000 cells mL-1, which was reached
in approximately 6-7 doublings. Harvesting cells at this density had been found to have a
minimal effect on seawater inorganic carbon chemistry (Goericke et al., 1994).
2.2 Determination of εp
Total dissolved inorganic carbon (DIC) and the δ13C of DIC (δ13CDIC) were
determined using a system modified after Kroopnick (1985). Samples for DIC (20 mL)
were preserved with 200 μL of HgCl2 and stored in precombusted glass crimp top vials at
4°C in the dark until analyzed. Briefly, 8.43 mL of 0.2 μm filtered seawater and
approximately 3.4 mL of 30% H3PO4 were sparged with N2 in a 13 mL column fitted at
the base with a fritted glass disk. The sparged CO2 from acidification of the DIC was
trapped using liquid nitrogen on a multiloop trap and transferred to a vacuum distillation
line where the quantity of CO2 was determined manometrically (MKS Baratron model
122). The concentration of DIC based on the P-V calculation yielded an accuracy and
precision of ~10 μM. Isotopic abundances were measured on cryogenically purified CO2
using a Finnigan MAT 252 mass spectrometer (Santrock et al., 1985). Analytical
uncertainty for carbon isotopic analyses was less than 0.1‰. Carbon isotopic
compositions are reported in δ-notation relative to Vienna PeeDee belemnite (VPDB).
Alkalinity samples (20 mL) were preserved with 20 μL of HgCl2 and stored in the
dark at 4°C in plastic scintillation vials with conical caps until analysis. Determinations
of total alkalinity were made using the Gran method using computer-controlled titration.
Precision and accuracy as determined by analyses of a certified seawater reference
material for oceanic CO2 measurements was less than, on average, 11 μeq kg-1.
9
Nutrients remaining in the dilute batch culture at time of harvest were collected
(25 mL), filtered (0.2 μm), and stored in an acid-washed plastic bottle and frozen until
analysis. Phosphate, silicate, and nitrate concentrations were determined using the
colorimetric techniques of Strickland and Parsons (1972) on a Technicon Auto Analyzer
II. Minimal detectable limits for this system are 0.13 μm L-1 for nitrate, 0.1 μm L-1 for
phosphates, and 0.5 μm L-1 for silicates.
The abundance of CO2(aq) was determined from concentrations of DIC, phosphate,
silicate, and total alkalinity following Millero (1995). The dissociation constants for
carbonic and boric acids used in this calculation were from Dickson (1990a,b) and Roy et
al. (1993). The isotopic composition of CO2(aq) was determined from δDIC, the relative
abundances of bicarbonate, carbonate, and CO2 and the temperature-fractionation
relationships of Deines et al. (1974) and Mook et al. (1974).
Samples of E. huxleyi for carbon isotopic analysis were filtered onto a
precombusted (500°C for a minimum of 4 hours) glass fiber filter (Whatman GF/F) from
250-300 mL of water. The filters were wrapped in precombusted aluminum foil, placed
immediately in liquid nitrogen, and stored frozen until analysis. Particulate organic
carbon (POC) contents and isotopic analyses were determined using a Carla Erba
elemental analyzer coupled with a Finnigan Delta Plus mass spectrometer. Analytic
uncertainty was less than 0.2‰.
Carbon-isotopic fractionation associated with photosynthesis (εp) is determined
using the carbon isotopic compositions of CO2(aq) and POC (δCO2 and δPOC, respectively).
The equation for εp by Freeman and Hayes (1992) is as follows:
10

100011000
1000POC
CO2(aq)
−
++
≡δδεP .
11
3. RESULTS AND DISCUSSION
3.1 Stirred vs. Unstirred Cultures in This Study
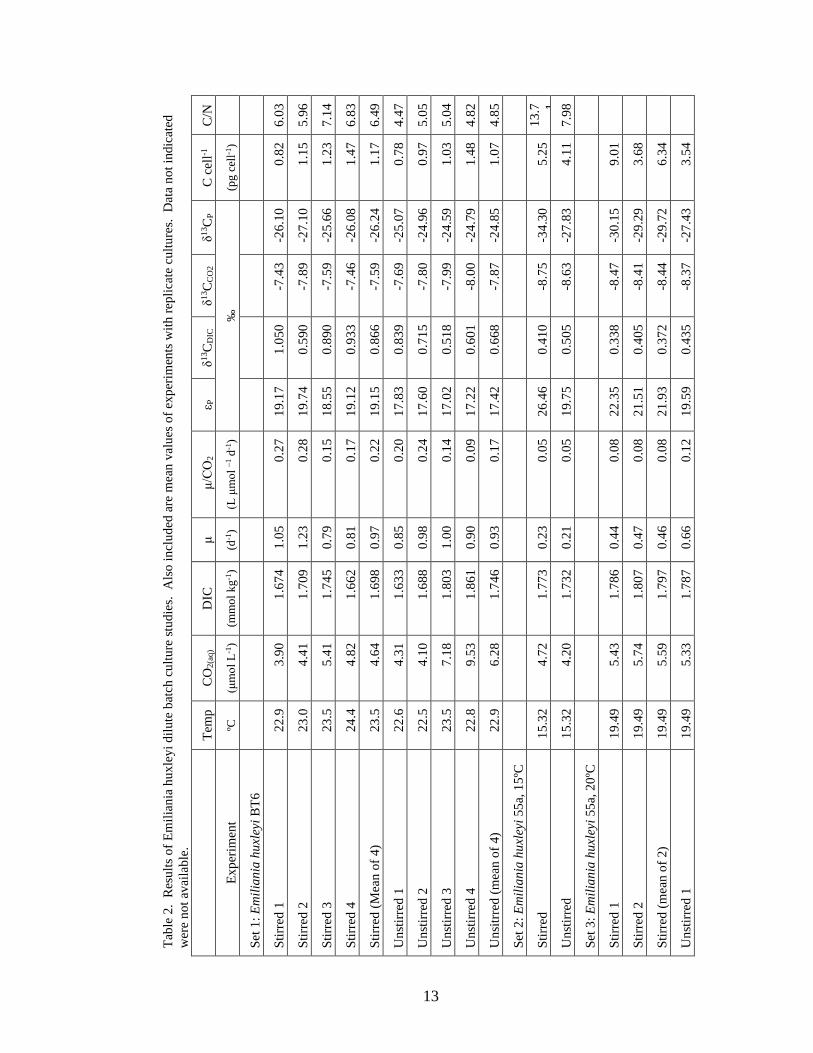
The results of this study are summarized in Table 2. In the first set of cultures,
eight dilute batch cultures with Emiliania huxleyi BT6 were grown at ambient room
temperature. Four of these cultures were stirred continuously with a stir bar and four
were gently agitated 2-3 times a day. In this experiment, the temperatures ranged from
22.5º - 24.4º C and the growth rates spanned 0.79 – 1.23 day-1. [CO2(aq)] ranged from
3.90 – 9.53 μmol L-1. εP ranged from 18.55‰ – 19.74‰ in the stirred cultures and
17.02‰ – 17.83‰ in the unstirred.
In the second set of cultures in this study, 1 stirred and 1 unstirred culture of
Emiliania huxleyi 55a were grown at a controlled temperature of 15.32º C. The stirred
culture had a growth rate of 0.23 day-1 and the unstirred had a growth rate of 0.21 day-1.
The stirred culture had a [CO2(aq)] of 4.72 μmol L-1 and εP was 26.46‰. The unstirred
culture had 4.20 μmol L-1 of aqueous carbon dioxide and εP was 19.75 ‰.
The third set, also with strain 55a, was conducted at 19.49º C. The stirred cultures
had 5.43 and 5.74 μmol L-1 of [CO2(aq)] while the unstirred had 5.33 μmol L-1. The
growth rates of the two stirred cultures were 0.44 and 0.47 day-1 and the unstirred culture
grew at a rate of 0.66 day-1. The stirred cultures exhibited fractionations of 22.35‰ and
21.51‰ while the unstirred had a lower εP of 19.59‰. Growth rates for each set of
experiments are shown in figure 1. High R2 values ranging from 0.86 – 0.99 indicate
high confidence in the calculated growth rates as well as the linearity and fit of data in the
calculation.
It is apparent from the three experiments performed that 13C fractionation in
12
Tabl
e 2.
Res
ults
of E
mili
ania
hux
leyi
dilu
te b
atch
cul
ture
stud
ies.
Als
o in
clud
ed a
re m
ean
valu
es o
f exp
erim
ents
with
repl
icat
e cu
lture
s. D
ata
not i
ndic
ated
w
ere
not a
vaila
ble.
C/N
6.03
5.96
7.14
6.83
6.49
4.47
5.05
5.04
4.82
4.85
13
.7 1 7.
98
C c
ell-1
(pg
cell-1
)
0.82
1.15
1.23
1.47
1.17
0.78
0.97
1.03
1.48
1.07
5.25
4.11
9.01
3.68
6.34
3.54
δ13C
P
‰
-26.
10
-27.
10
-25.
66
-26.
08
-26.
24
-25.
07
-24.
96
-24.
59
-24.
79
-24.
85
-34.
30
-27.
83
-30.
15
-29.
29
-29.
72
-27.
43
δ13C
CO
2
-7.4
3
-7.8
9
-7.5
9
-7.4
6
-7.5
9
-7.6
9
-7.8
0
-7.9
9
-8.0
0
-7.8
7
-8.7
5
-8.6
3
-8.4
7
-8.4
1
-8.4
4
-8.3
7
δ13C
DIC
1.05
0
0.59
0
0.89
0
0.93
3
0.86
6
0.83
9
0.71
5
0.51
8
0.60
1
0.66
8
0.41
0
0.50
5
0.33
8
0.40
5
0.37
2
0.43
5
ε P
19.1
7
19.7
4
18.5
5
19.1
2
19.1
5
17.8
3
17.6
0
17.0
2
17.2
2
17.4
2
26.4
6
19.7
5
22.3
5
21.5
1
21.9
3
19.5
9
μ/C
O2
(L μ
mol
–1 d
-1)
0.27
0.28
0.15
0.17
0.22
0.20
0.24
0.14
0.09
0.17
0.05
0.05
0.08
0.08
0.08
0.12
μ (d-1
)
1.05
1.23
0.79
0.81
0.97
0.85
0.98
1.00
0.90
0.93
0.23
0.21
0.44
0.47
0.46
0.66
DIC
(mm
ol k
g-1)
1.67
4
1.70
9
1.74
5
1.66
2
1.69
8
1.63
3
1.68
8
1.80
3
1.86
1
1.74
6
1.77
3
1.73
2
1.78
6
1.80
7
1.79
7
1.78
7
CO
2(aq
)
(μm
ol L
-1)
3.90
4.41
5.41
4.82
4.64
4.31
4.10
7.18
9.53
6.28
4.72
4.20
5.43
5.74
5.59
5.33
Tem
p
ºC
22.9
23.0
23.5
24.4
23.5
22.6
22.5
23.5
22.8
22.9
15.3
2
15.3
2
19.4
9
19.4
9
19.4
9
19.4
9
Expe
rimen
t
Set 1
: Em
ilian
ia h
uxle
yi B
T6
Stirr
ed 1
Stirr
ed 2
Stirr
ed 3
Stirr
ed 4
Stirr
ed (M
ean
of 4
)
Uns
tirre
d 1
Uns
tirre
d 2
Uns
tirre
d 3
Uns
tirre
d 4
Uns
itrre
d (m
ean
of 4
)
Set 2
: Em
ilian
ia h
uxle
yi 5
5a, 1
5ºC
Stirr
ed
Uns
tirre
d
Set 3
: Em
ilian
ia h
uxle
yi 5
5a, 2
0ºC
Stirr
ed 1
Stirr
ed 2
Stirr
ed (m
ean
of 2
)
Uns
tirre
d 1
13
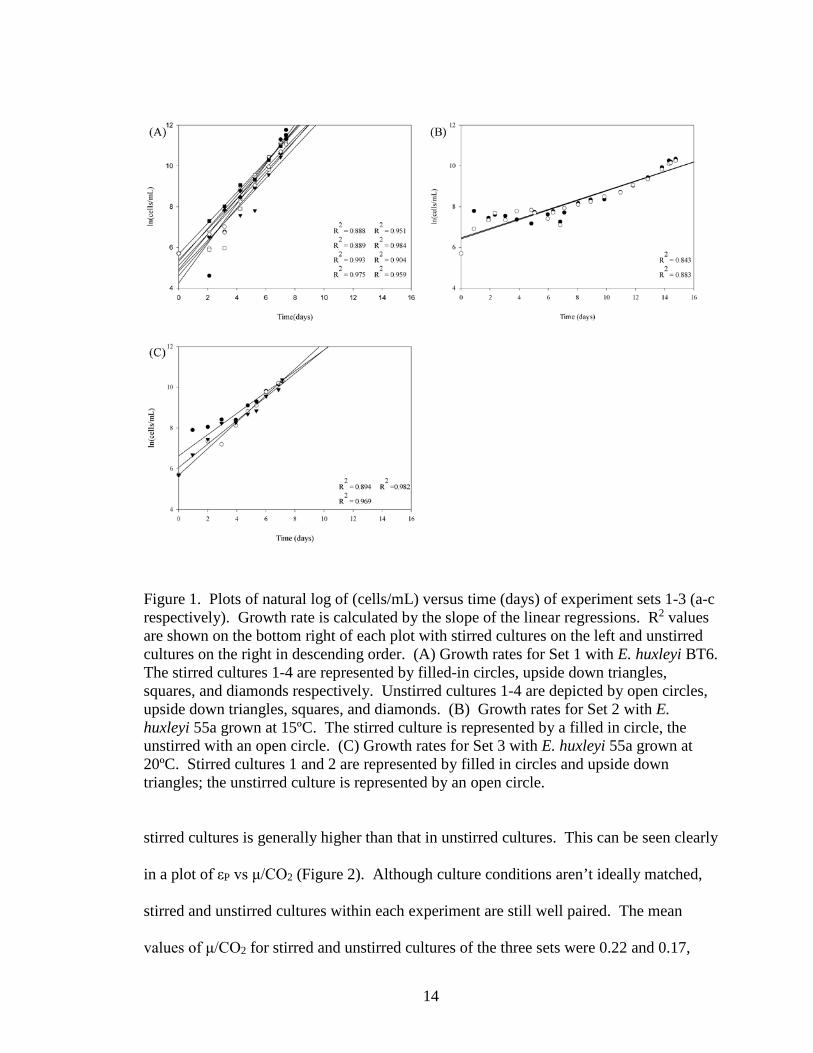
Figure 1. Plots of natural log of (cells/mL) versus time (days) of experiment sets 1-3 (a-c respectively). Growth rate is calculated by the slope of the linear regressions. R2 values are shown on the bottom right of each plot with stirred cultures on the left and unstirred cultures on the right in descending order. (A) Growth rates for Set 1 with E. huxleyi BT6. The stirred cultures 1-4 are represented by filled-in circles, upside down triangles, squares, and diamonds respectively. Unstirred cultures 1-4 are depicted by open circles, upside down triangles, squares, and diamonds. (B) Growth rates for Set 2 with E. huxleyi 55a grown at 15ºC. The stirred culture is represented by a filled in circle, the unstirred with an open circle. (C) Growth rates for Set 3 with E. huxleyi 55a grown at 20ºC. Stirred cultures 1 and 2 are represented by filled in circles and upside down triangles; the unstirred culture is represented by an open circle.
stirred cultures is generally higher than that in unstirred cultures. This can be seen clearly
in a plot of εP vs μ/CO2 (Figure 2). Although culture conditions aren’t ideally matched,
stirred and unstirred cultures within each experiment are still well paired. The mean
values of μ/CO2 for stirred and unstirred cultures of the three sets were 0.22 and 0.17,
14
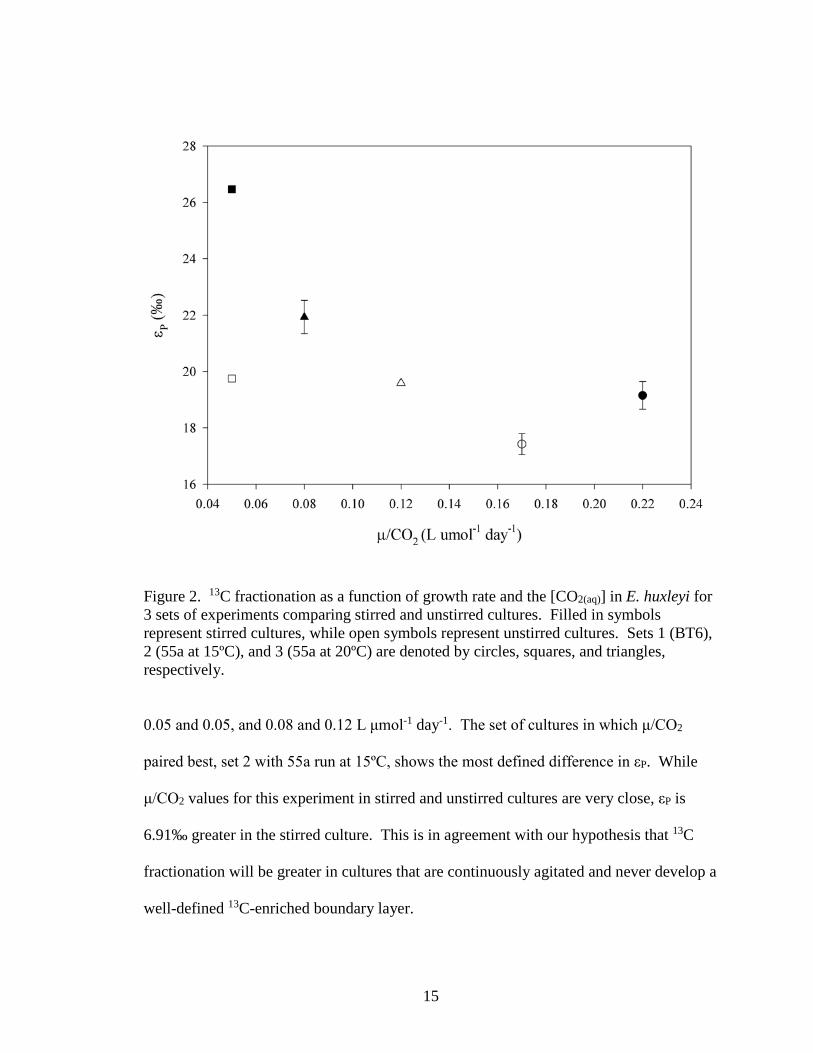
Figure 2. 13C fractionation as a function of growth rate and the [CO2(aq)] in E. huxleyi for 3 sets of experiments comparing stirred and unstirred cultures. Filled in symbols represent stirred cultures, while open symbols represent unstirred cultures. Sets 1 (BT6), 2 (55a at 15ºC), and 3 (55a at 20ºC) are denoted by circles, squares, and triangles, respectively.
0.05 and 0.05, and 0.08 and 0.12 L μmol-1 day-1. The set of cultures in which μ/CO2
paired best, set 2 with 55a run at 15ºC, shows the most defined difference in εP. While
μ/CO2 values for this experiment in stirred and unstirred cultures are very close, εP is
6.91‰ greater in the stirred culture. This is in agreement with our hypothesis that 13C
fractionation will be greater in cultures that are continuously agitated and never develop a
well-defined 13C-enriched boundary layer.
15
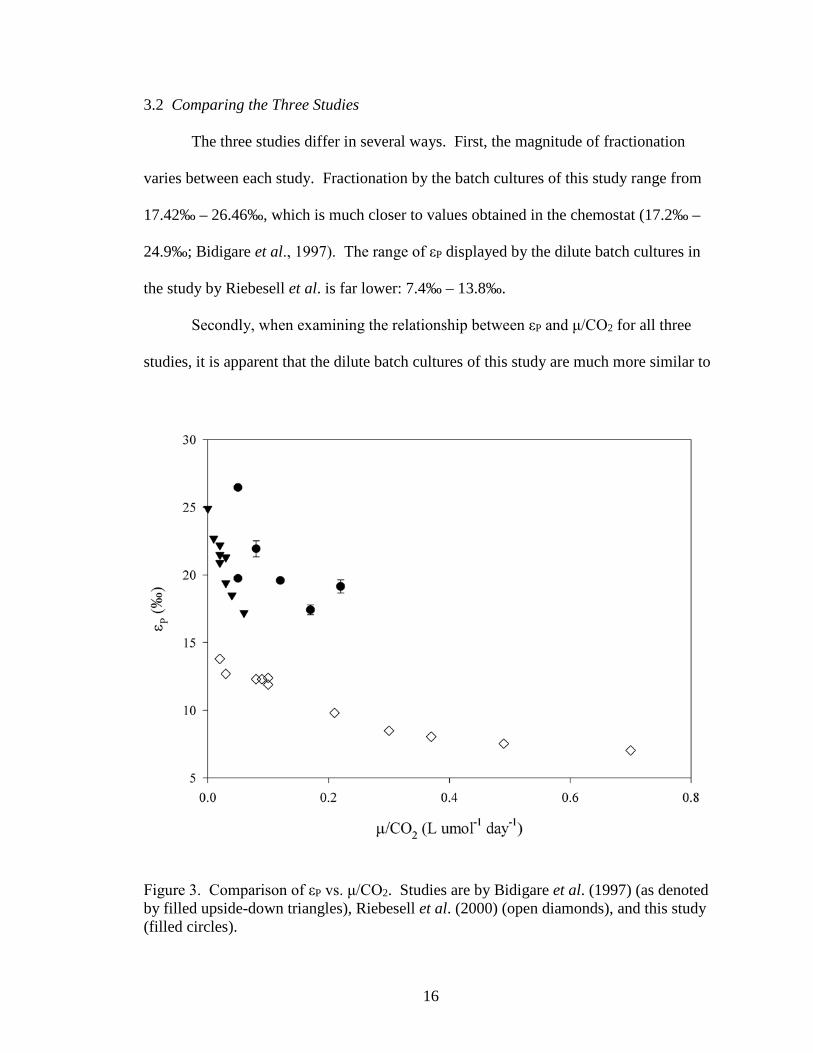
3.2 Comparing the Three Studies
The three studies differ in several ways. First, the magnitude of fractionation
varies between each study. Fractionation by the batch cultures of this study range from
17.42‰ – 26.46‰, which is much closer to values obtained in the chemostat (17.2‰ –
24.9‰; Bidigare et al., 1997). The range of εP displayed by the dilute batch cultures in
the study by Riebesell et al. is far lower: 7.4‰ – 13.8‰.
Secondly, when examining the relationship between εP and μ/CO2 for all three
studies, it is apparent that the dilute batch cultures of this study are much more similar to
Figure 3. Comparison of εP vs. μ/CO2. Studies are by Bidigare et al. (1997) (as denoted by filled upside-down triangles), Riebesell et al. (2000) (open diamonds), and this study (filled circles).
16
the chemostat work (Figure 3). Also, at comparable μ/CO2 values, εP in the chemostat
work is ~5‰ - 9‰ higher than in the dilute batch cultures by Riebesell et al. Dilute
batch cultures from this study show fractionation 2‰ - 9‰ greater than even the
chemostats, apparently regardless of the presence or absence of stirring. Both the
chemostat work and this study show a linear, negative trend in the relationship between
εP and μ/CO2. This is very dissimilar to the trend observed in results from dilute batch
cultures in the Riebesell study. These cultures show a non-linear trend that flattens out as
μ/CO2 increases. However, in considering the apparent trends of each study, it must be
noted that the range of μ/CO2 from this study and the chemostat study do not extend as
far as the dilute batch cultures by Riebesell et al. Therefore, it cannot be stated with
certainty how the trends seen in the chemostats and in this study may evolve over a larger
range.
Although the belief that stirred cultures will exhibit greater fractionation has been
enforced by results from the stirred and unstirred dilute batch cultures, the trends of these
results are quite contrary to preliminary expectations. If the presence of agitation truly
resolves the discrepancy between results from Bidigare’s and Riebesell’s studies, the
stirred cultures should appear to be very similar to Bidigare’s stirred chemostats and the
unstirred cultures from this study should be similar to that of dilute batch culture work by
Riebesell et al. (2000). As expected, the stirred dilute batch cultures show similar εP to
the stirred chemostats. While the unstirred cultures do exhibit less fractionation than the
stirred, the cultures don’t exhibit the same trend or magnitude of fractionation as
Riebesell’s unstirred cultures. In addition, εP values and trends of this study’s unstirred
dilute cultures are much more similar to those of stirred chemostats. This is contrary to
17
the initial belief that the dilute batch cultures performed in this study would mimic the
results of the study with the same stirring regime. It is clear that factors in addition to
culture method can affect the carbon isotopic fractionation of E. huxleyi.
3.3 Exploring Possiblities Beyond Stirring
The results of the stirred and unstirred dilute batch cultures infer that something
besides stirring is contributing to the discrepancy between chemostat and unstirred dilute
batch culture results. Comparing elements in culturing methods, this time between the
three studies, may provide some insight. One important difference between culturing
methods is nutrient availability. However this does not appear to have a differentiating
effect. The cultures of this study are grown under nutrient saturation, which is identical
to Riebesell’s cultures, though the results vary greatly. Instead, observed fractionation
and behavior is more like the nutrient limited chemostats, indicating that nutrient
availability is not causing the discrepancy.
Another factor is utilization of different strains of Emiliania huxleyi. A calcifying
strain of E. huxleyi was used in the unstirred dilute batch cultures (Riebesell et al., 2000)
while a non-calcifying strain was used in this study. However, in prior chemostat work,
very little difference in εP was observed between calcifying and non-calcifying strains
(Bidigare et al., 1997). Also, two strains are used in this study and do not display the
striking difference in fractionation seen between the Bidigare et al. and Riebesell et al.
work.
Possibly related to the use of different strains is the apparent difference in cellular
carbon. Cellular carbon content for each experiment varies greatly (Table 3). The dilute
18
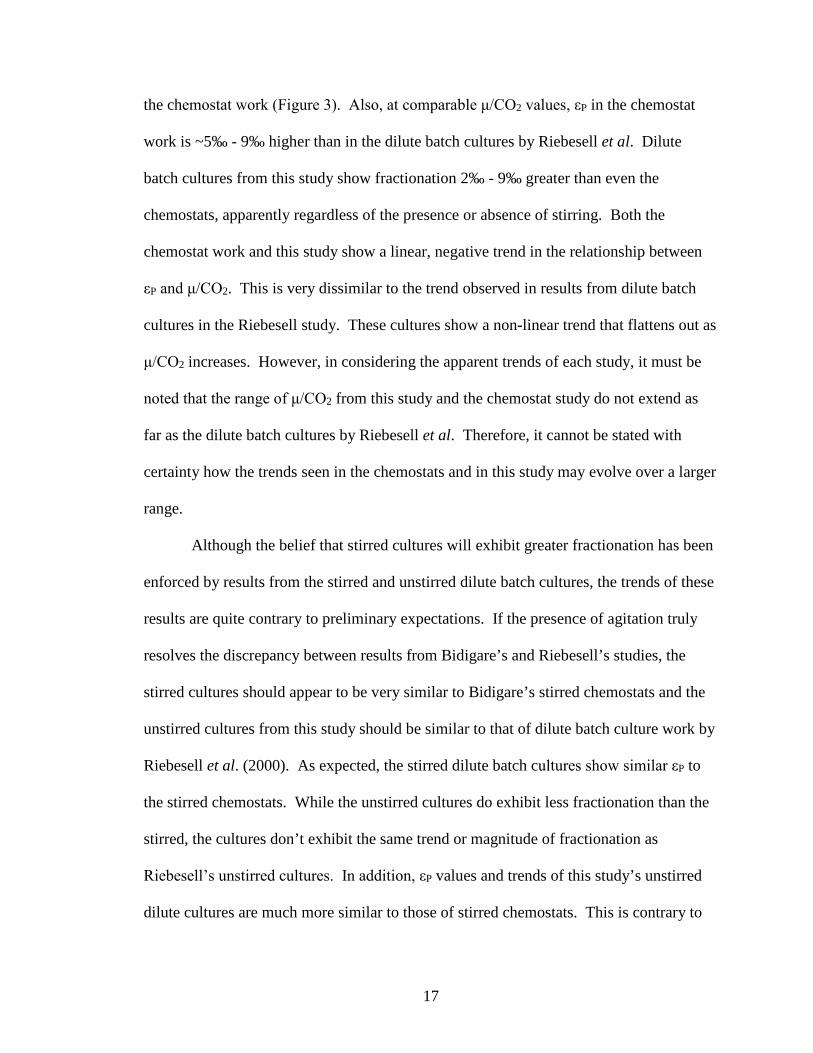
Table 3. Carbon to nitrogen ratios and cellular carbon contents of dilute batch cultures by Riebesell et al. (2000), this study, and chemostats by Bidigare et al. (1997). C:N data for Set 3 of this study and for the chemostats are not available.
Experiment C:N C Cell-1 (molar) (pg cell-1) Riebesell et al., 2000 1 7.5 5.3 1 7.4 6.0 1 8.2 9.2 1 8.4 10.2 1 8.2 9.0 1 9.4 10.4 1 8.6 9.4 2 8.0 11.4 2 7.5 10.6 2 7.5 10.0 2 7.6 11.7 This Study Set 1 stirred 1 6.0 0.8 Set 1 stirred 2 6.0 1.2 Set 1 stirred 3 7.1 1.2 Set 1 sitrred 4 6.8 1.5 Set 1 unstirred 1 4.5 0.8 Set 1 unstirred 2 5.1 1.0 Set 1 unstirred 3 5.0 1.0 Set 1 unstirred 4 4.8 1.5 Set 2 stirred 13.7 5.3 Set 2 unstirred 8.0 4.1 Set 3 stirred 1 - 9.0 Set 3 stirred 2 - 3.7 Set 3 unstirred - 3.5 Bidigare et al., 1997 an average, as stated in Popp et al., 1998 - 8.3
batch cultures of Riebesell have 5.3 – 11.7 pg of carbon per cell. This is much larger
than cells in dilute batch cultures performed in this study, which have 0.8 – 9.0 pg of
carbon per cell. The chemostats (Bidigare et al., 1997) have an average of 8.3 pg of
carbon per cell, which is much more similar to Riebesell’s batch cultures, but very
different from that of the dilute batch cultures of this study. Since the fractionation
displayed in the cultures of this study is more similar to that in the chemostats, variations
in cellular carbon cannot be linked to the discrepancies in results between studies.
19
However, such drastic variations in cellular carbon prove to be another factor that is not
kept constant between studies and methods, and thus its effects remain unknown.
Light cycles are another factor that may cause differences in results. The stirred
and unstirred dilute batch cultures and the chemostats were performed under light
saturation and continuous light. The dilute batch cultures by Riebesell et al., however,
were grown under a 16:8 light:dark cycle. A dramatic difference in εP between cultures
grown under continuous and 16:8 light:dark cycles was observed by Rost et al. (2002).
Continuous light cultures exhibited εP 6-8‰ greater than cultures with a 16:8 cycle. This
was also observed by Burkhardt et al. (1999b), though difference in εP was less (~6‰).
This may account for the fact that dilute batch cultures performed in this study showed
carbon isotope fractionation generally 10-13‰ greater than Riebesell’s dilute batch
cultures. However, it was also observed in chemostat cultures of Phaeodactylum
tricornutum that there is no apparent difference in εP between cultures grown under
continuous light or 12:12 light:dark cycles (Laws et al., 1995). In a plot of εP versus
μ/CO2, all of these chemostat cultures fall into a linear, negative trend, regardless of the
light cycle.
While the differences in culturing methods must be addressed and considered, it
should also be noted that the studies discussed do not have similar μ/CO2 ranges. This is
mostly due to the fact the chemostats are unable to have elevated [CO2(aq)] and higher
growth rates without detriment to the culture itself. Also, [CO2(aq)] alteration was not the
main focus of this study and was not performed. The ranges seen in this study and in
Bidigare’s chemostats do not exceed 0.22 μmol L-1 day-1. The batch cultures by
Riebesell ranged from 0.02 – 0.70 μmol L-1 day-1. It is difficult to predict how the
20

chemostats and the dilute batch cultures of this study will behave at conditions of higher
μ/CO2. In Rost et al. (2002), a plot of εP versus μ/(CO2 x Surface Area) shows that
cultures by Bidigare et al., Riebesell et al., and Rost et al. actually tie in together, rather
than disagree, as μ/(CO2 x Surface Area) increases.
21
4. CONCLUSIONS
While results of this study do not completely explain the discrepancies seen
between varying culturing methods, it can be concluded that stirring does have an effect
on 13C fractionation. The magnitude and trend of fractionation in both the stirred and
unstirred cultures appears to be very similar to the results of chemostat experiments
reported by Bidigare et al., though continuation of the trend over greater values of μ/CO2
has not yet been studied and is uncertain. Since the unstirred dilute batch cultures
performed in this study differ drastically from the unstirred dilute batch cultures of
Riebesell, it cannot be concluded that agitation is the sole reason of the discrepancy
between the studies by Riebesell et al. (2000) and Bidigare et al. (1997).
Many studies examine possible factors in εP and many have very different results.
Better understanding requires studies that will examine factors one by one, rather than
studies that differ in several ways. Future studies to better understand 13C fractionation in
phytoplankton may include the comparison of light:dark cycles in stirred and unstirred
cultures. This may reveal why the unstirred cultures of this study display much greater
fractionation than that of Riebesell, et al. Also, taking past studies and including surface
area and volume to the εP – μ – [CO2(aq)] relationship may provide new insights. A
primary form of additional research would be studying stirred and unstirred dilute batch
cultures over a greater range of μ/CO2. The trend of the dilute batch cultures performed
by this study only spans a range of 0.15 L μmol-1 day-1 and it is uncertain, as μ/CO2
increases, whether they will take a negative direction like that of the chemostats or
similar to Riebesell’s dilute batch cultures. Additional batch culture studies that span a
22
wider range of [CO2(aq)] could address this question and perhaps provide a better tie
between the two culturing methods.
While understanding the mechanisms of carbon isotope fractionation in laboratory
cultures is very important in the quest to reliably link the δ13C of sedimentary organic
matter to [CO2(aq)], understanding the applicability of laboratory studies to natural
systems is also very important. Pure lab cultures are not able to replicate species
competition or grazing pressures. To understand what happens in the ocean, field data
must be collected. Currently, projects are in progress that could further understanding of
growth rate in the ocean and therefore be able to observe fractionation as a function of
growth rate and carbon dioxide concentration in a natural setting (Laws et al., 2001).
Perhaps once a better grasp on how 13C fractionation in phytoplankton works in the ocean
is obtained, it will be easier to choose and analyze laboratory data that best represent
nature.
23
REFERENCES Arthur, M., W.E. Dean, and L.M. Pratt, Geochemical and climatic effects of increased marine organic carbon burial at the Cenomanian/Turonian boundary, Nature, 335, 714-717, 1985. Berner, R.A., Atmospheric oxygen over Phanerozoic time: National Academy of Sciences Proceedings, v. 96, 10,955-10,957, 1999. Bidigare, R.R., A. Fluegge, K.H. Freeman, K.L. Hanson, J.M. Hayes, D. Hollander, J.P. Jasper, L.L. King, E.A. Laws, J. Milder, F.J. Millero, R. Pancost, B.N. Popp, P.A. Steinberg, and S.G. Wakeham, Consistent fractionation of 13C in nature and in the laboratory: Growth rate effects in some haptophyte algae, Global Biogeochem. Cycles, 11, 279-292, 1997. Brassell, S.C., Applications of biomarkers for delineating marine paleoclimatic fluctuations during the Pleistocene, in Organic Geochmistry, edited by M.H. Engel and S.A. Macko, 699-738, Plenum, New York, 1993. Burkhardt, S., U. Riebesell, and I. Zondervan, Stable carbon isotope fractionation by marine phytoplankton in response to daylength, growth rate, and CO2 availability, Mar. Ecol. Prog. Series, 184, 31-41, 1999. Deines, P., D. Langmuir, and R.S. Harmon, Stable carbon isotope ratios and the existence of a gas phase in the evolution of carbonate ground waters, Geochim. Cosmochim. Acta, 38, 1147-1164, 1974. Dickson, A.G., Standard potential of the reactionL AgCl(s) + 1.2H2(g) = Ag(s) + HCl(aq), and the standard acidity constant of the ion HSO4
- in synthetic seawater from 273.15 to 318.15 K, J. Chem. Themodyn., 22, 113-127, 1990a. Dickson, A.G., Thermodynamics of the dissociation of boric acid in synthetic seawater from 273.15 to 318.15 K, Deep-Sea Res., Part A, 37, 755-766, 1990b. Freeman, K.H. and J.M. Hayes, Fractionation of carbon isotopes by phytoplankton and estimates of ancient CO2 levels, Global Biogeochem. Cycles, 6, 185-198, 1992. Goericke, R., J.P. Montoya, and B. Fry, Physiology of isotopic fractionation in algae and cyanobacteria, in Stable Isotopes in Ecology and Environmental Science, edited by Kate Lajtha and Robert H. Michener, pp. 187-221, Blackwell Scientific Publications, Oxford (or Cambridge), 1994. Hinga, K.R., M.A. Arthur, M.E.Q. Pilson, and D. Whitaker, Carbon isotope fractionation by marine phytoplankton in culture: The effects of CO2 concentration, pH, temperature and species, Global Biogeochem. Cycles, 8, 91-102, 1994. Hayes, J.M., B.N. Popp, R. Takigiku, M.W. Johnson, An isotopic study of biogeochemical relationships between carbonates and organic carbon in the Greenhorn formation, Geochim. Cosmochim. Acta, 53, 2961-2972, 1989. Kroopnick, P., The distribution of 13C in ΣCO2 in the world oceans, Deep-Sea Res., Part A, 32, 57-84, 1985. Laws, E.A., B.N. Popp, and R.R. Bidigare, M.C. Kennicut, and S.A. Macko, Dependence of phytoplankton carbon isotopic composition on growth rate and [CO2]aq: Theoretical considerations and experimental results, Geochim. Cosmochim. Acta, 59, 1131-1138, 1995. Laws, E.A., B.N. Popp, R.R. Bidigare, U. Riebesell, S. Burkhardt, and S.G. Wakeham, Controls on the molecular distribution and carbon isotopic composition of alkenones
24
in certain haptophyte algae, Geochem. Geophys. Geosyst., vol. 2, Paper number 2000GC000057, 2001. Laws, E.A., R.R. Bidigare, and B.N. Popp, Effect of growth rate and CO2 concentration on carbon fractionation by the marine diatom Phaeodactylum tricornutum, Limnol. Oceanogr., 42, 1552-1560, 1997. Millero, F.J., The thermodynamics of the carbon dioxide system in the oceans, Geochim. Cosmochim. Acta, 59, 661-677, 1995. Mook, W.G., J.C. Bommerson, and W.H. Staberman, Carbon isotope fractionation between dissolved bicarbonate and gaseous carbon dioxide, Earth Planet. Sci. Lett., 22, 169-176, 1974. Müller, P.J., G. Kirst, G. Ruhland, I. von Storch, and A. Rosell-Melé, Calibration of the alkenone paleotemperature index UK’
37 based on core-tops from the eastern South Atlantic and global ocean (60ºN-60ºS), Geochim. Cosmochim. Acta, 62, 1757-1772, 1998. Pagani, M., M.A. Arthur, and K.H. Freeman, Miocene evolution of atmospheric carbon dioxide, Paleoceanography, 14, 273-292, 1999. Popp, B.N., R. Takigiku, J.M. Hayes, J.W. Louda, and E.W. Baker, The post-Paleozoic chronology and mechanism of 13C depletion in primary marine organic matter, Am. J. Sci., 289, 436-454, 1989. Popp, B.N., E.A. Laws, R.R. Bidigare, J.E. Dore, K.L. Hanson, and S.G. Wakeham, Effect of phytoplankton cell geometry on carbon isotopic fractionation, Geochim. Cosmochim. Acta, 62, 69-77, 1998. Popp, B.N., K.L. Hanson, J.E. Dore, R.R. Bidigare, E.A. Laws, and S.G. Wakeham, Controls on the carbon isotopic composition of phytoplankton: Paleoceanographic perspectives, in Reconstructing Ocean History: A Window into the Future, edited by F. Abrantes and A. Mix, pp. 381-398, Kluwer Academic/Plenum Publishers, New York, 1999. Rau, G.H., T. Takahashi, and D.J. Des Marais, Latitudinal variations in plankton δ13C: Implications for CO2 and productivity in past oceans, Nature, 341, 516-518. 1989. Rau, G.H., T. Takahashi, D.J. Des Marais, D.J. Repeta, and J.H. Martin, The relationship between δ13C of organic matter and [CO2(aq)] in ocean surface water: Data from a JGOFS site in the northeast Atlantic Ocean and a model, Geochim. Cosmochim. Acta, 56, 1413-1419, 1992. Rau, G.H., U. Riebesell, and D. Wolf-Gladrow, A model of photosynthetic 13C fractionation by marine phytoplankton based on diffusive molecular CO2 uptake, Mar. Ecol. Prog. Ser., 133, 275-278, 1996. Rau, G.H., U. Riebesell, and D. Wolf-Gladrow, CO2aq-dependent photosynthetic 13C fractionation in the ocean: A model versus measurements, Global Biogeochem. Cycles, 11, 267-278, 1997. Riebesell, U., A.T. Revill, D.G. Holdsworth, and J.K. Volkman, The effects of carrying CO2 concentration on lipid composition and carbon isotope fractionation in Emiliania huxleyi, Geochem. Cosmochim. Acta, 64, 4179-4192, 2000. Rosenthal, Y., H. Stoll, K. Wyman, and P. Falkowski, Growth related variations in carbon isotopic fractionation and coccolith chemistry in Emiliania huxleyi, EOS Transaction of the Am. Geophys. Union 80, OS294, 2000. Rost, B., I. Zondervan, and U. Riebesell, Light-dependent carbon isotope fractionation in
25

the coccolithophorid Emiliania huxleyi, Limnol. Oceanogr., 47, 120-128, 2002. Roy, R.N., L.N. Roy, K.M. Vogel, C.P. Moore, T. Pearson, C.E. Good, F.J. Millero, and D.M. Cambell, Determination of the ionization constants of carbonic acid in seawater, Mar. Chem., 44, 249-268, 1993. Santrock, J., S.A. Studley, and J.H. Hayes, Isotopic analyses based on the mass spectrum of carbon dioxide, Anal. Chem., 57, 1444-1448, 1985.
26


![Untitled-5 [doj.gov.in]. (Nepali... · Atyacharko Ant : This book is based on legal awareness for the neoliterates on scheduled castes and scheduled tribes prevention of Atrocities](https://static.fdocument.org/doc/165x107/5f88ac6f7033cd7a8577b9ef/untitled-5-dojgovin-nepali-atyacharko-ant-this-book-is-based-on-legal.jpg)