Soft x-ray tomography on HT-7 tokamak K.Y. Chen, L.Q. Hu, Y.M. Duan HT-7.
Upload
francine-newtonCategory
view
218download
0
1
Simulation of energetic-particle behavior in Spherical Tokamak
Mou Maolin
Supervisor : Z.T. Wang, C.J.Tang
The Second A3 Foresight Workshop on Spherical TorusJan. 6-8, 2014,
Tsinghua University, Beijing, China
2
Outline
• Motivation
• Real orbit simulation
• Loss rate of energetic-particle in MAST
• α-particle prompt loss rate in ITER
• Conclusions
3
Motivation
• NBI is an important methord to heat plasmas in MAST. It produces large amount of energetic-particles. The real orbit loss rate is presented compared with gyro-averaged one.
• There's D-T reaction plan in ITER. It produces a lot of α-particles. α-particle real orbit loss rate is presented.
4
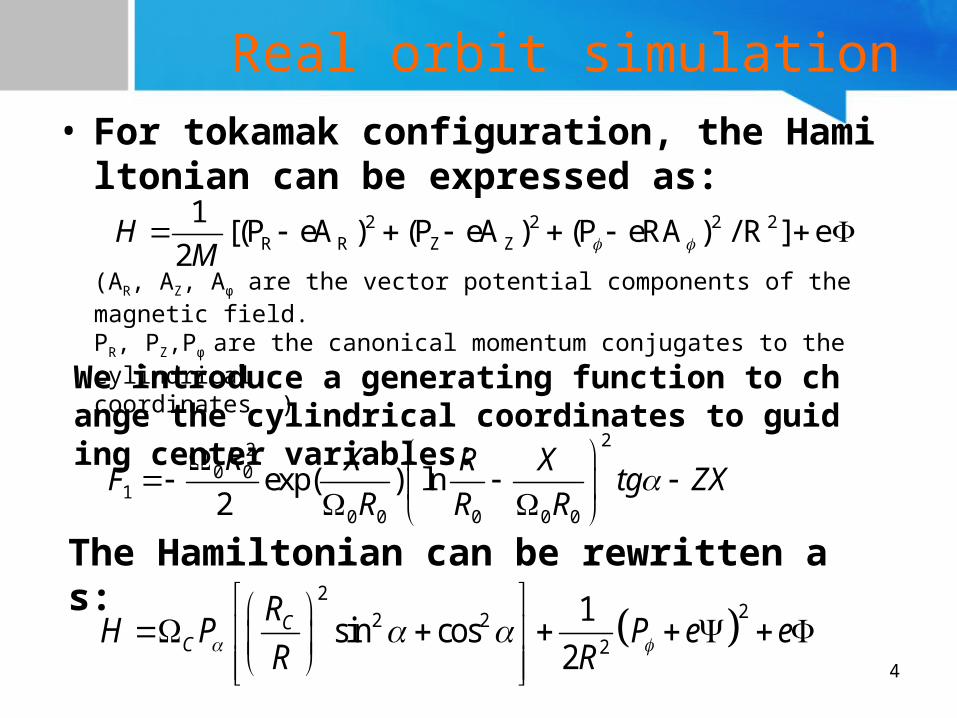
Real orbit simulation• For tokamak configuration, the Hamiltonian
can be expressed as:2 2 2 2
R R Z Z
1[(P eA ) (P eA ) (P eRA ) / R ] e
2H
M
(AR, AZ, Aφ are the vector potential components of the magnetic field.PR, PZ,Pφ are the canonical momentum conjugates to the cylindricalcoordinates. )
We introduce a generating function to change the cylindrical coordinates to guiding center variables:
220 0
10 0 0 0 0
exp( ) ln2
R X R XF tg ZX
R R R
2
22 22
1sin cos
2C
C
RH P P e e
R R
The Hamiltonian can be rewritten as:
5
Real orbit simulation
2
22 22
1sin cos
2C
C
RH P P e e
R R
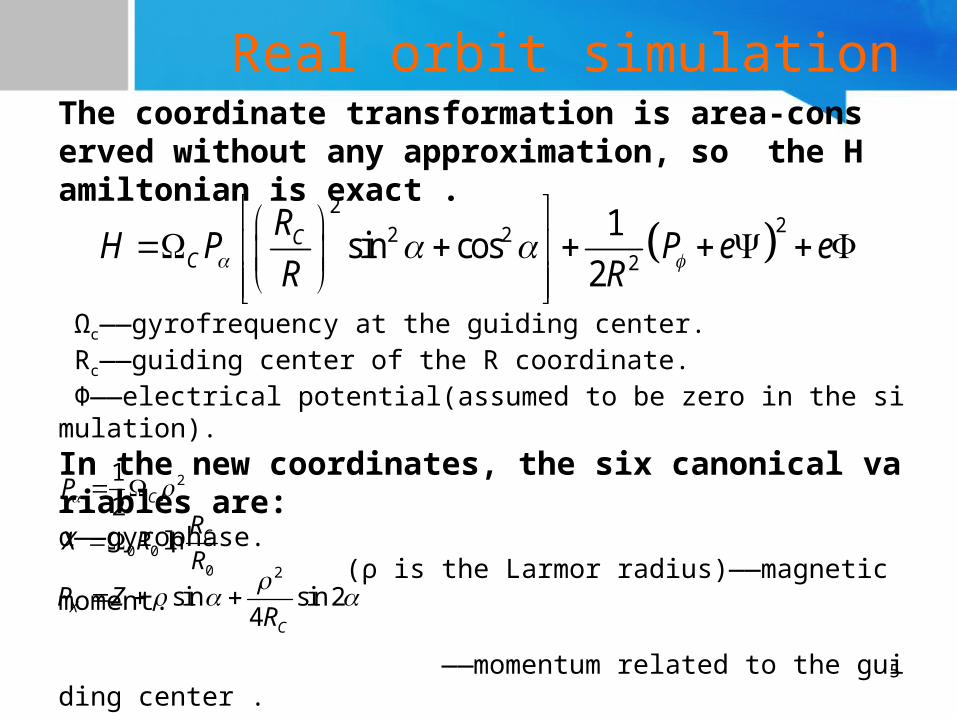
Ωc——gyrofrequency at the guiding center. Rc——guiding center of the R coordinate. Φ——electrical potential(assumed to be zero in the simulation).
In the new coordinates, the six canonical variables are:α——gyrophase. (ρ is the Larmor radius)——magnetic moment.
——momentum related to the guiding center .
——guiding center of the Z coordinate.φ——toroidal angle.Pφ——canonical momentum in the toroidal direction.
The coordinate transformation is area-conserved without any approximation, so the Hamiltonian is exact .
21
2 CP
0 00
ln CRX RR
2
sin sin 24X
C
P ZR
6
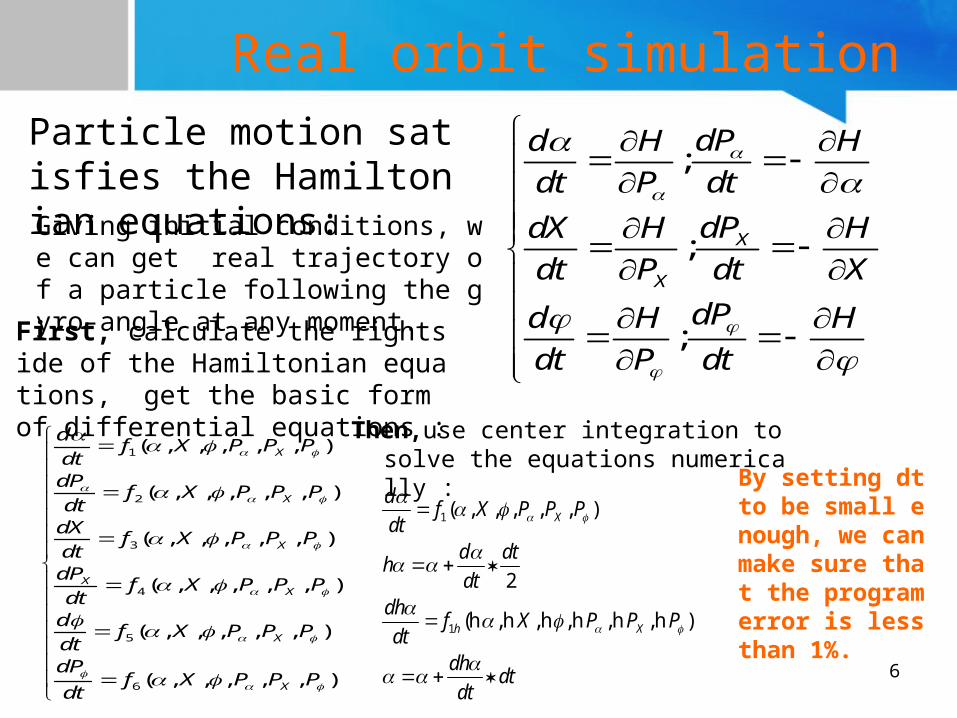
Real orbit simulationParticle motion satisfies the Hamiltonian equations: ;
;
;
X
X
dPd H H
dt P dt
dPdX H H
dt P dt X
dPd H H
dt P dt
Giving initial conditions, we can get real trajectory of a particle following the gyro-angle at any moment.
First, calculate the rightside of the Hamiltonian equations, get the basic form of differential equations :
1
2
3
4
5
6
( , , , , , )
( , , , , , )
( , , , , , )
( , , , , , )
( , , , , , )
( , , , , , )
X
X
X
XX
X
X
df X P P P
dtdP
f X P P PdtdX
f X P P PdtdP
f X P P Pdtd
f X P P PdtdP
f X P P Pdt
Then,use center integration to solve the equations numerically :
1
1
( , , , , , )
2
(h ,h ,h ,h ,h ,h )
X
h X
df X P P P
dtd dt
hdt
dhf X P P P
dtdh
dtdt
By setting dt to be small enough, we can make sure that the program error is less than 1%.
7
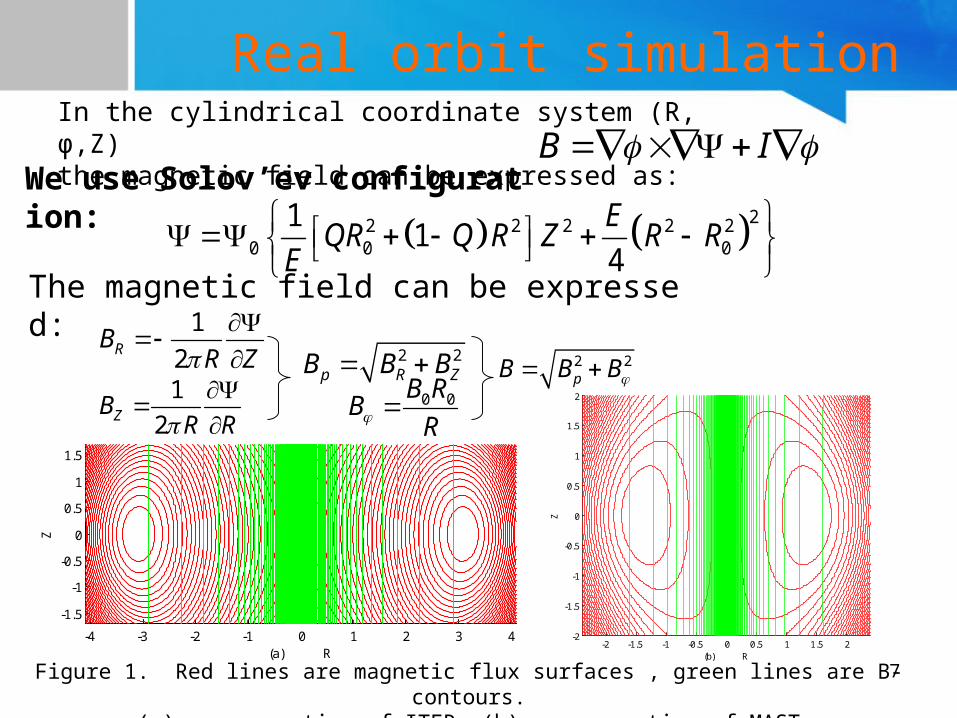
Real orbit simulationIn the cylindrical coordinate system (R,φ,Z) the magnetic field can be expressed as: B I
We use Solov’ev configuration:
22 2 2 2 20 0 0
11
4
EQR Q R Z R R
E
Figure 1. Red lines are magnetic flux surfaces , green lines are B-contours. (a) cross section of ITER, (b) cross section of MAST.
The magnetic field can be expressed:1
2RB R Z
1
2ZB R R
0 0B RB
R
2 2p R ZB B B 2 2
pB B B
-4 -3 -2 -1 0 1 2 3 4
-1.5
-1
-0.5
0
0.5
1
1.5
(a) R
Z
-2 -1.5 -1 -0.5 0 0.5 1 1.5 2-2
-1.5
-1
-0.5
0
0.5
1
1.5
2
(b) R
Z
8
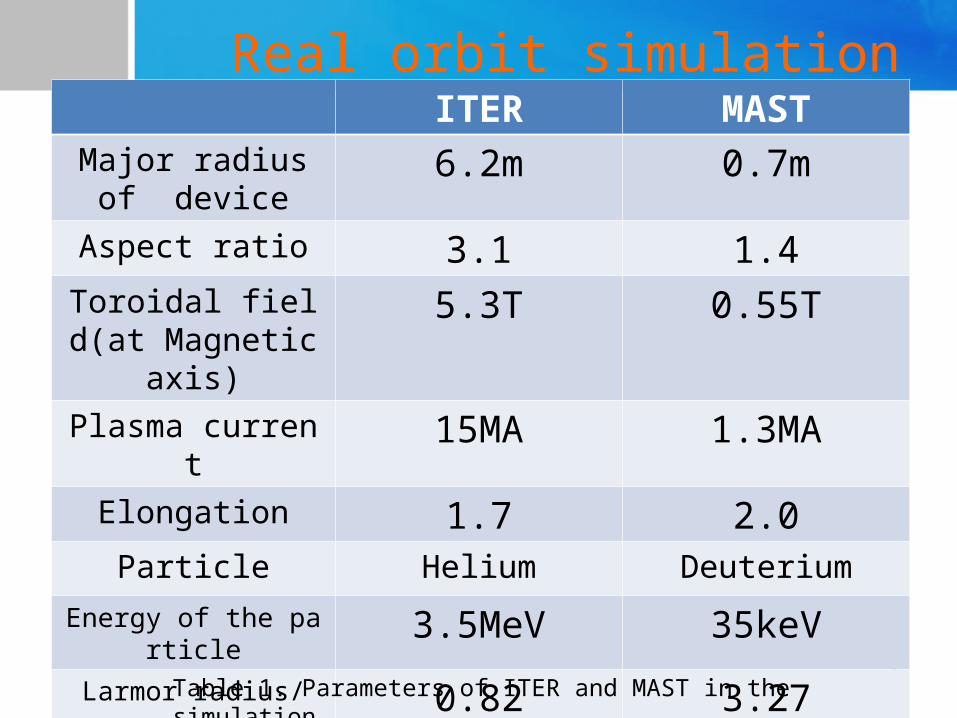
Real orbit simulationITER MAST
Major radius of device
6.2m 0.7m
Aspect ratio 3.1 1.4Toroidal field(at M
agnetic axis)5.3T 0.55T
Plasma current 15MA 1.3MAElongation 1.7 2.0
Particle Helium Deuterium
Energy of the particle 3.5MeV 35keVLarmor radius/
Major radius(%)0.82 3.27
Table 1. Parameters of ITER and MAST in the simulation
9
Real orbit simulation
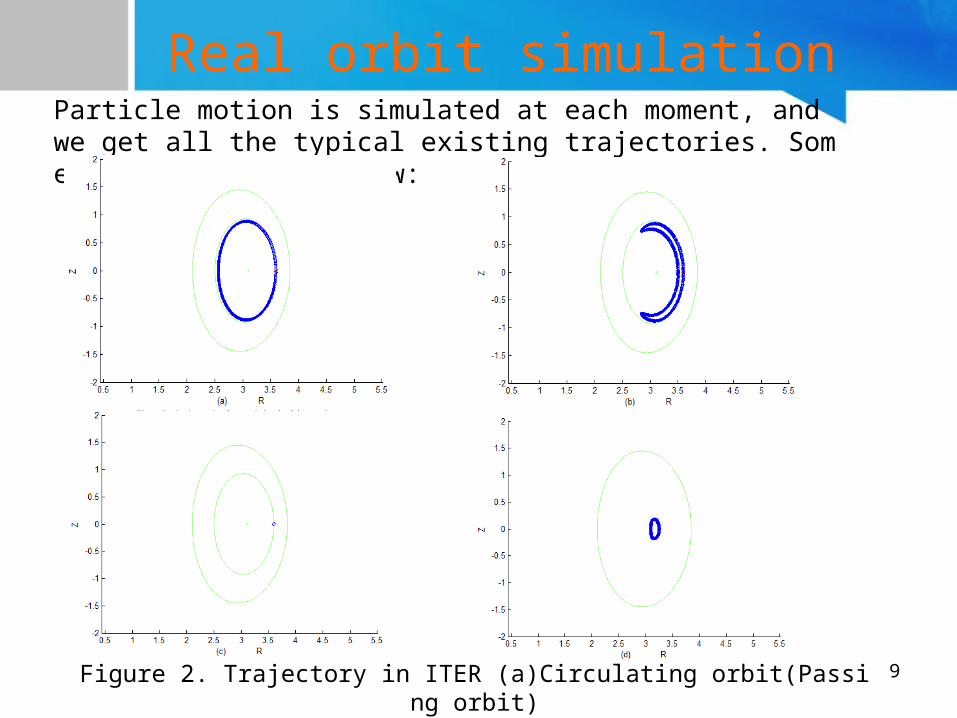
Figure 2. Trajectory in ITER (a)Circulating orbit(Passing orbit) (b)Trapped orbit(Banana orbit) (c)Stagnation orbit (d)Potato orbit
Particle motion is simulated at each moment, and we get all the typical existing trajectories. Some are showed as follow:
10
Real orbit simulation
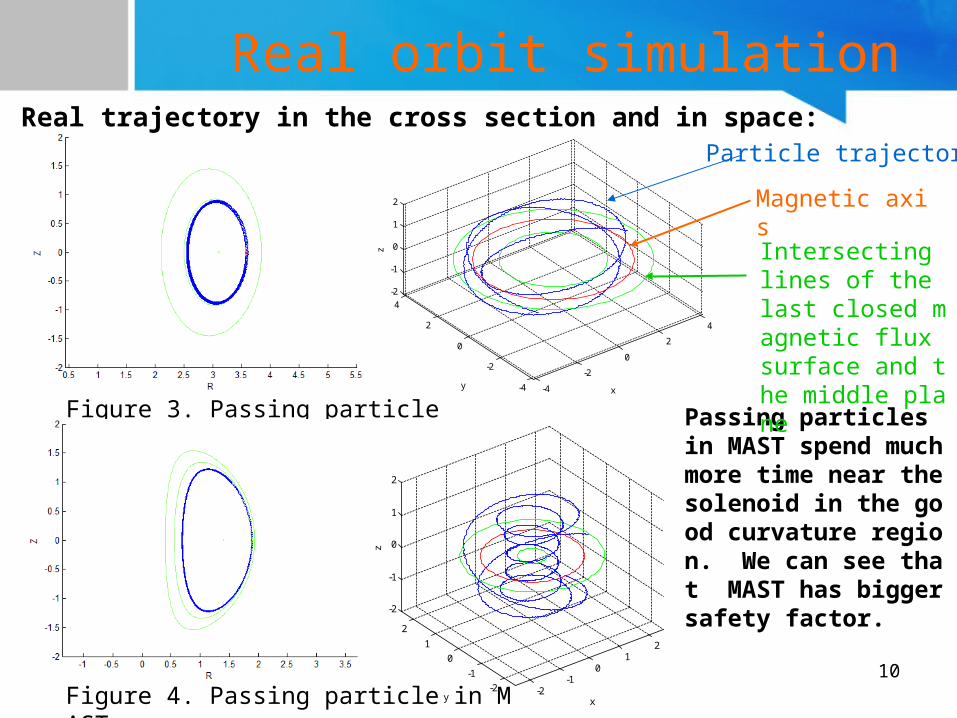
Figure 3. Passing particle in ITER
Real trajectory in the cross section and in space:
Figure 4. Passing particle in MAST -2-1
01
2
-2
-1
0
1
2
-2
-1
0
1
2
xy
z-4
-2
0
2
4
-4
-2
0
2
4
-2
-1
0
1
2
xyz
Passing particles in MAST spend much more time near the solenoid in the good curvature region. We can see that MAST has bigger safety factor.
Magnetic axis
Intersecting lines of the last closed magnetic flux surface and the middle plane
Particle trajectory
11
Real orbit simulation
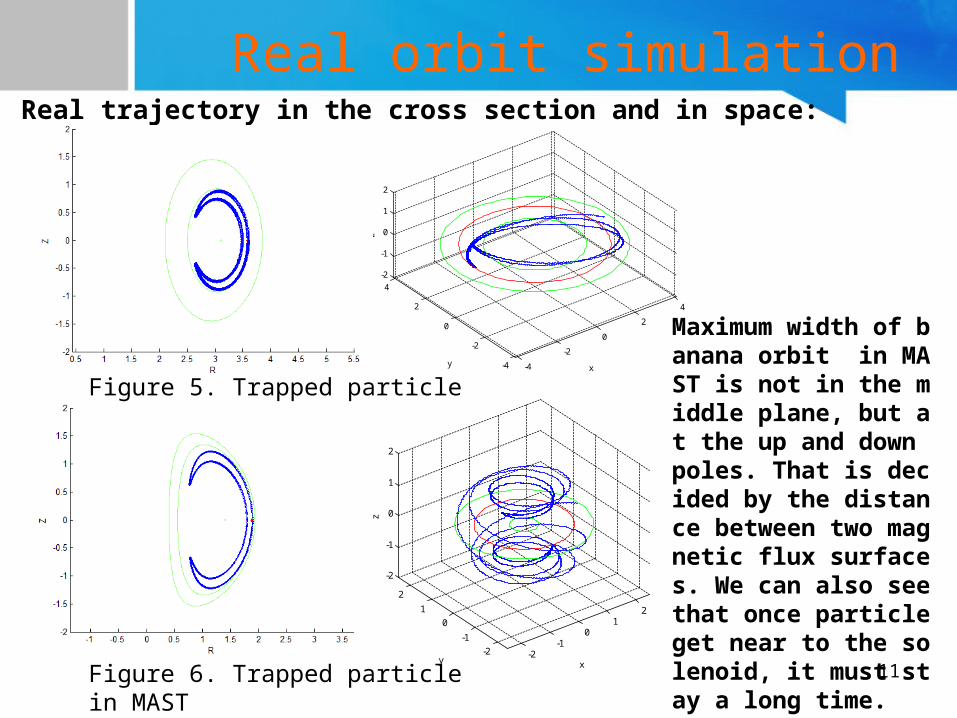
Figure 5. Trapped particle in ITER
Figure 6. Trapped particle in MAST
Maximum width of banana orbit in MAST is not in the middle plane, but at the up and down poles. That is decided by the distance between two magnetic flux surfaces. We can also see that once particle get near to the solenoid, it must stay a long time.
Real trajectory in the cross section and in space:
-4
-2
0
2
4
-4
-2
0
2
4
-2
-1
0
1
2
xyz
-2-1
01
2
-2
-1
0
1
2
-2
-1
0
1
2
xy
z
12
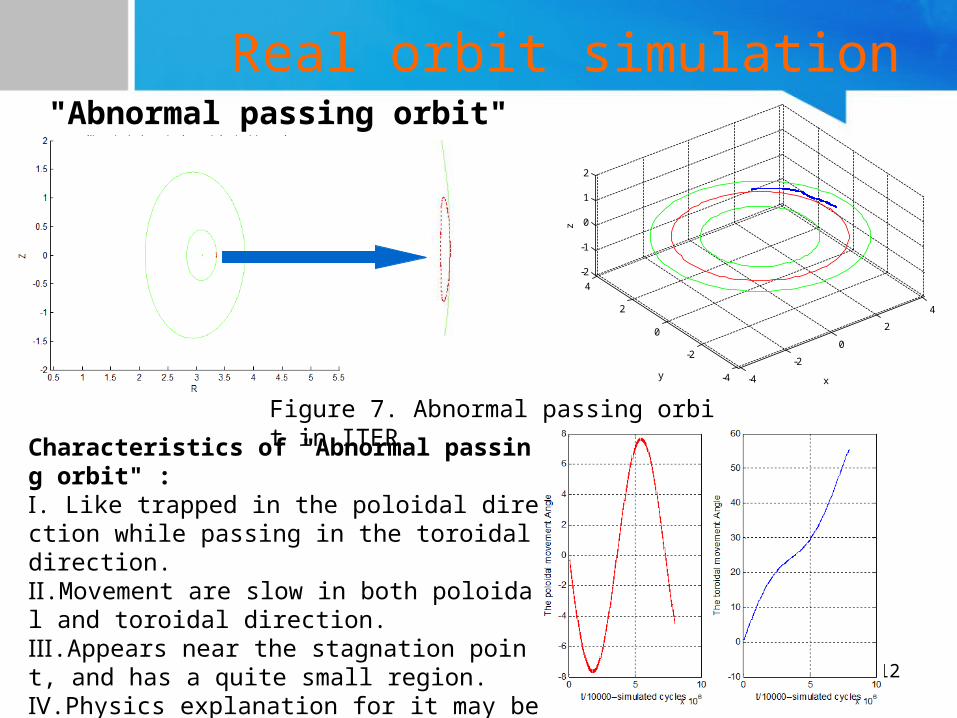
Real orbit simulation"Abnormal passing orbit"
Characteristics of "Abnormal passing orbit" :Ⅰ. Like trapped in the poloidal direction while passing in the toroidal direction.Ⅱ.Movement are slow in both poloidal and toroidal direction.Ⅲ.Appears near the stagnation point, and has a quite small region.Ⅳ.Physics explanation for it may be toroidal precession.
-4
-2
0
2
4
-4
-2
0
2
4
-2
-1
0
1
2
xy
z
Figure 7. Abnormal passing orbit in ITER
13
Real orbit simulation
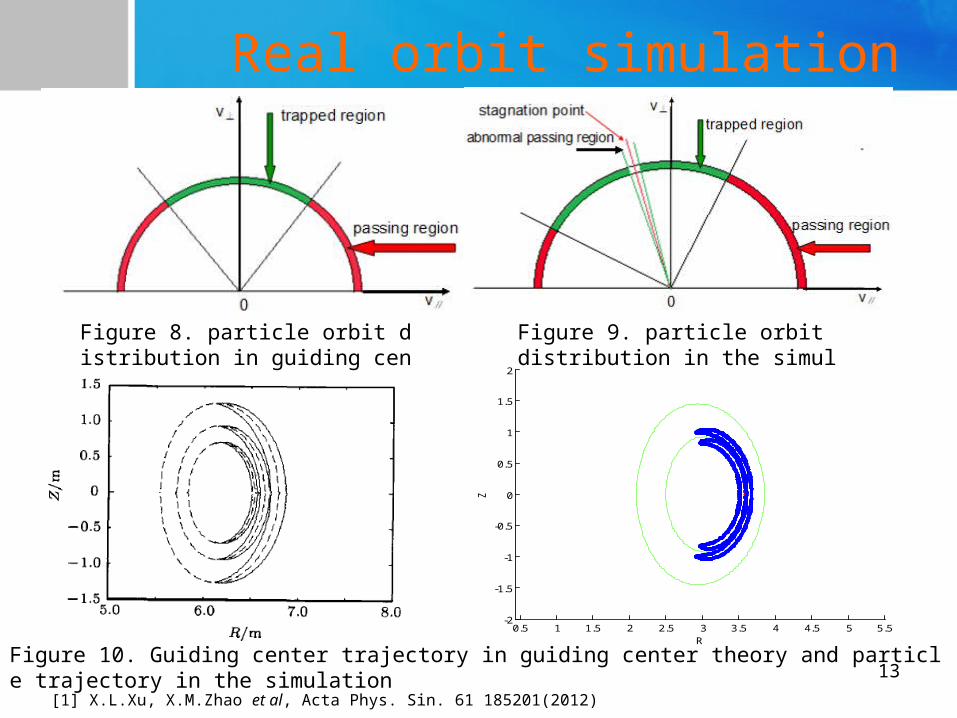
Figure 8. particle orbit distribution in guiding center theory[1]
Figure 9. particle orbit distribution in the simulation
Figure 10. Guiding center trajectory in guiding center theory and particle trajectory in the simulation
[1] X.L.Xu, X.M.Zhao et al, Acta Phys. Sin. 61 185201(2012)
0.5 1 1.5 2 2.5 3 3.5 4 4.5 5 5.5-2
-1.5
-1
-0.5
0
0.5
1
1.5
2
R
Z
14
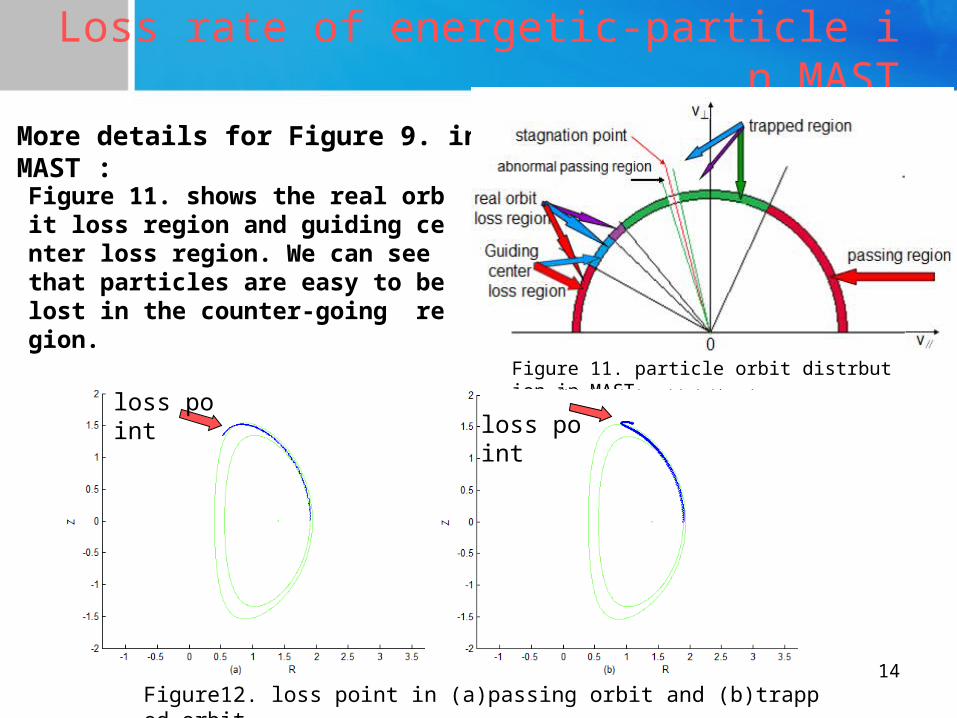
Loss rate of energetic-particle in MAST
More details for Figure 9. in MAST :
Figure 11. particle orbit distrbution in MAST
loss pointloss point
Figure12. loss point in (a)passing orbit and (b)trapped orbit
Figure 11. shows the real orbit loss region and guiding center loss region. We can see that particles are easy to be lost in the counter-going region.
15
Loss rate of energetic-particle in MAST
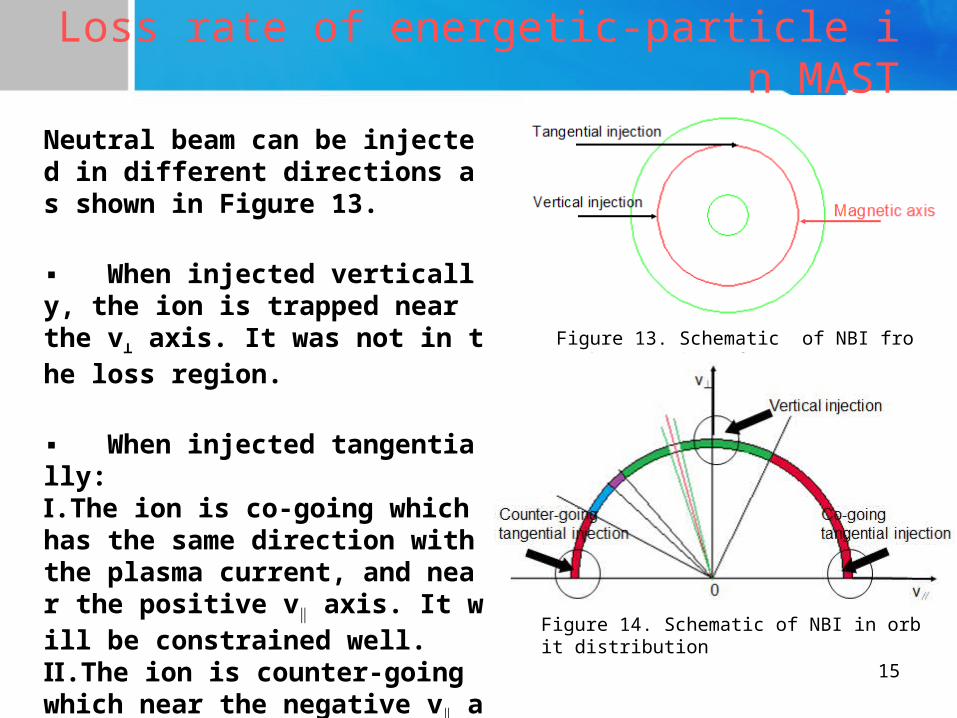
Figure 13. Schematic of NBI from the top view of MAST
Neutral beam can be injected in different directions as shown in Figure 13.
▪ When injected vertically, the ion is trapped near the v⊥ axis. It was not in the loss region.
▪ When injected tangentially:Ⅰ.The ion is co-going which has the same direction with the plasma current, and near the positive v∥ axis. It will be constrained well.Ⅱ.The ion is counter-going which near the negative v∥ axis. It will be lost.
Figure 14. Schematic of NBI in orbit distribution
16
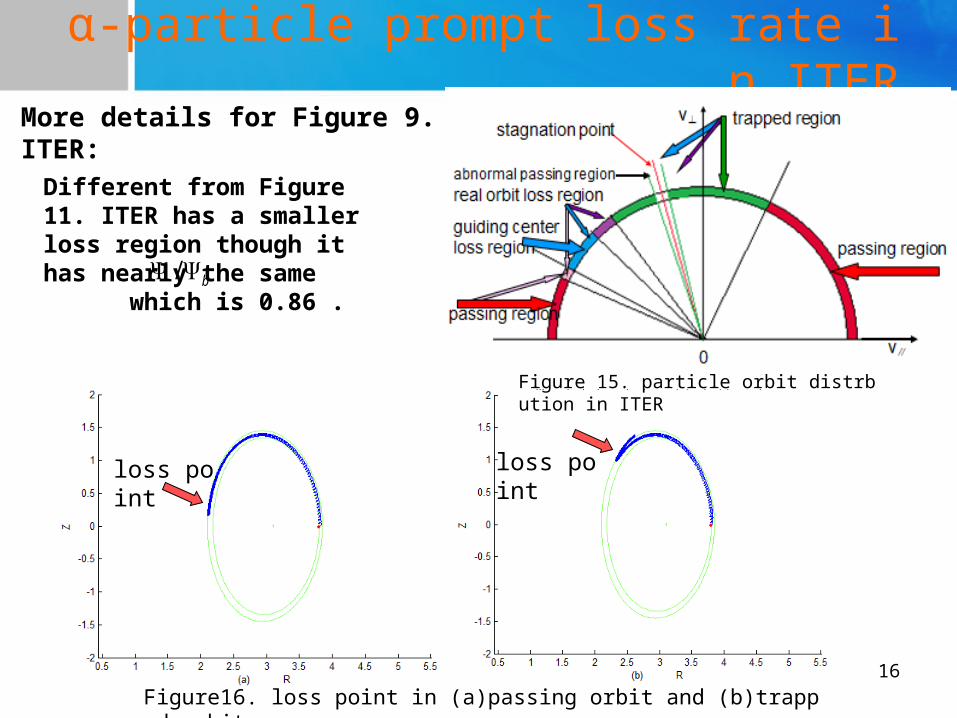
α-particle prompt loss rate in ITERMore details for Figure 9. in ITER:
Figure 15. particle orbit distrbution in ITER
Figure16. loss point in (a)passing orbit and (b)trapped orbit
loss point loss point
Different from Figure 11. ITER has a smaller loss region though it has nearly the same which is 0.86 . / b
17
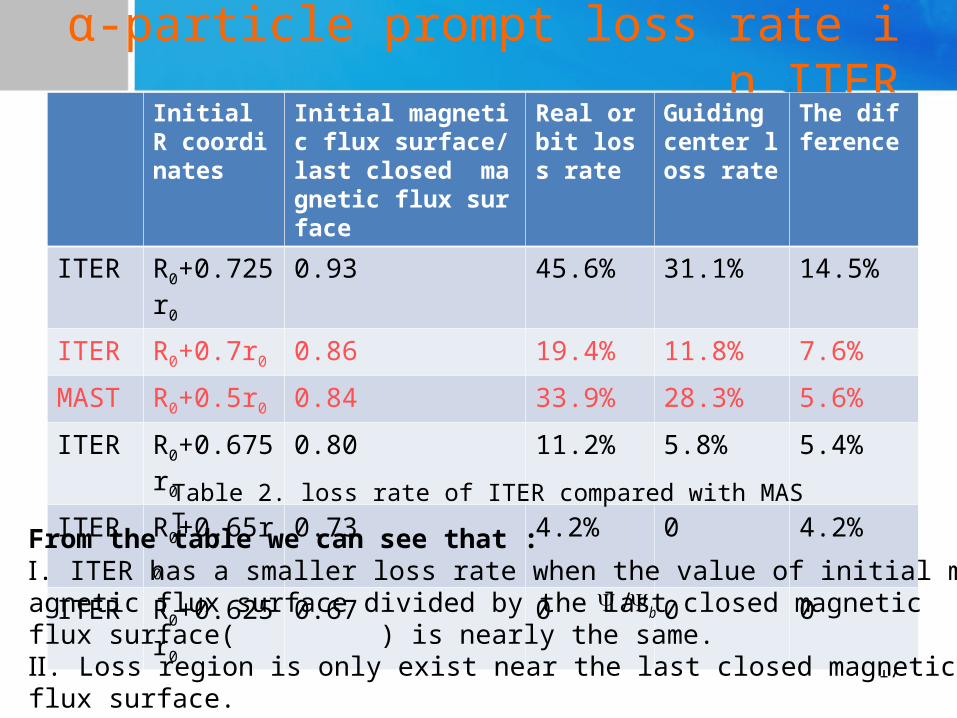
α-particle prompt loss rate in ITERInitial R coordinates
Initial magnetic flux surface/ last closed magnetic flux surface
Real orbit loss rate
Guiding center loss rate
The difference
ITER R0+0.725r0 0.93 45.6% 31.1% 14.5%
ITER R0+0.7r0 0.86 19.4% 11.8% 7.6%
MAST R0+0.5r0 0.84 33.9% 28.3% 5.6%
ITER R0+0.675r0 0.80 11.2% 5.8% 5.4%
ITER R0+0.65r0 0.73 4.2% 0 4.2%
ITER R0+0.625r0 0.67 0 0 0
Table 2. loss rate of ITER compared with MAST
From the table we can see that :Ⅰ. ITER has a smaller loss rate when the value of initial magnetic flux surface divided by the last closed magnetic flux surface( ) is nearly the same.Ⅱ. Loss region is only exist near the last closed magnetic flux surface.Ⅲ. Larmor radius effects the loss rate visibly.
/ b
18
Conclusions
• Transformation of Hamiltonian is accurate. It can discribe the real orbit of particle at any moment.
• Particles in MAST spend much time around the solenoid, and were better constrained in the good curvature region.
• We found a new kind of orbit which was passing in the toroidal direction while trapped in the poloidal direction.
• Ions injected into MAST is more likely to be lost in the counter-going tangential injection.
• when the value of is the same, ITER has a smaller loss rate than MAST because of the aspect ratio.
• The loss rate of the real orbit simulation is larger than the loss rate of guiding center theory because of the effect of Larmor radius.
/ b

19
Thanks for your attention !


![Part III - Snvhomesnvhome.net/ee-braude/introduction2eo/figures/figures 2... · Spherical waveform coming from a real point source (after [1]). Figure 48. Gaussian-spherical wave](https://static.fdocument.org/doc/165x107/6108a4141d2cbb6d0640185d/part-iii-2-spherical-waveform-coming-from-a-real-point-source-after-1.jpg)