1 P a g e h t t p s : / / w w w . c i e n o t e s . c o m
2
1 | Page https://www.cienotes.com/ Test Results Information t-test (Use a t-test table to look up your value of t) Obtained value > t value for a probability of 0.05 (the critical value), there is significant difference between A and B Whether two sets of continuous data are significantly different from one another Chi-squared (x2) test (Use a χ2 table to look up value of χ 2 ) Obtained value > χ 2 value for a probability of 0.05, there is significant difference between observed results and expected results Whether observed results differ significantly from your expected result Pearson’s linear correlation Value close to +1 indicates a positive linear correlation Value close to –1 indicates a negative linear correlation Value close to 0 indicates no correlation Whether there is a linear correlation between two paired sets of data Spearman’s rank correlation (Use correlation coefficient table to look up value of r s ) Obtained value of r s > r s value for a probability of 0.05, there is a significant correlation between your two values Whether there is a correlation between two random paired sets of data Simpson’s index of diversity, D 0 (lowest species diversity) – 1 (highest species diversity) To find species diversity after collecting data on species abundance Standard deviation Chi-squared test Standard error (S M ) Pearson’s linear correlation t-test Spearman’s rank correlation
Transcript of 1 P a g e h t t p s : / / w w w . c i e n o t e s . c o m
1 | P a g e h t t p s : / / w w w . c i e n o t e s . c o m /
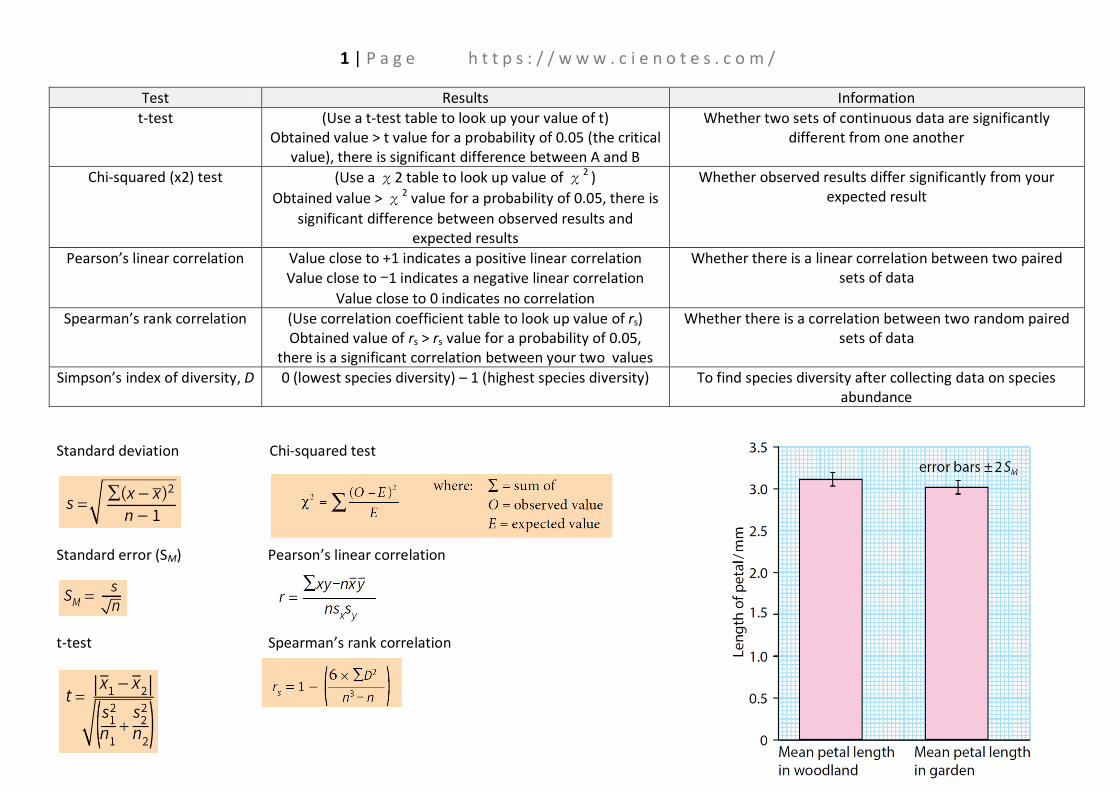
Test Results Information
t-test (Use a t-test table to look up your value of t) Obtained value > t value for a probability of 0.05 (the critical
value), there is significant difference between A and B
Whether two sets of continuous data are significantly different from one another
Chi-squared (x2) test (Use a χ2 table to look up value of χ2 )
Obtained value > χ2 value for a probability of 0.05, there is
significant difference between observed results and expected results
Whether observed results differ significantly from your expected result
Pearson’s linear correlation Value close to +1 indicates a positive linear correlation Value close to –1 indicates a negative linear correlation
Value close to 0 indicates no correlation
Whether there is a linear correlation between two paired sets of data
Spearman’s rank correlation (Use correlation coefficient table to look up value of rs) Obtained value of rs > rs value for a probability of 0.05,
there is a significant correlation between your two values
Whether there is a correlation between two random paired sets of data
Simpson’s index of diversity, D 0 (lowest species diversity) – 1 (highest species diversity) To find species diversity after collecting data on species abundance
Standard deviation Chi-squared test
Standard error (SM) Pearson’s linear correlation
t-test Spearman’s rank correlation
2 | P a g e h t t p s : / / w w w . c i e n o t e s . c o m /
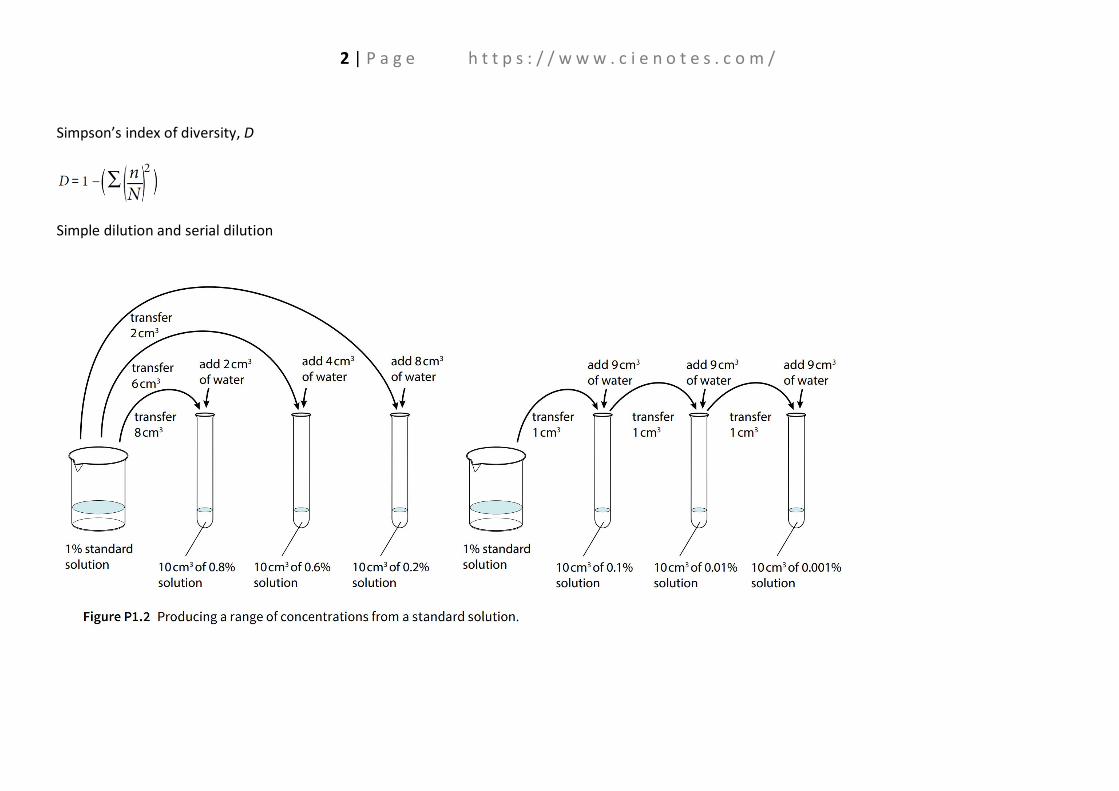
Simpson’s index of diversity, D
Simple dilution and serial dilution