1 Chi-Square Heibatollah Baghi, and Mastee Badii.
37
1 Chi-Square Heibatollah Baghi, and Mastee Badii
-
Upload
byron-singleton -
Category
Documents
-
view
223 -
download
1
Transcript of 1 Chi-Square Heibatollah Baghi, and Mastee Badii.

1
Chi-Square
Heibatollah Baghi, and
Mastee Badii
2
Different Scales, Different Measures of Association
Scale of Both Variables
Measures of Association
Nominal Scale Pearson Chi-Square: χ2
Ordinal Scale Spearman’s rho
Interval or Ratio Scale
Pearson r
3
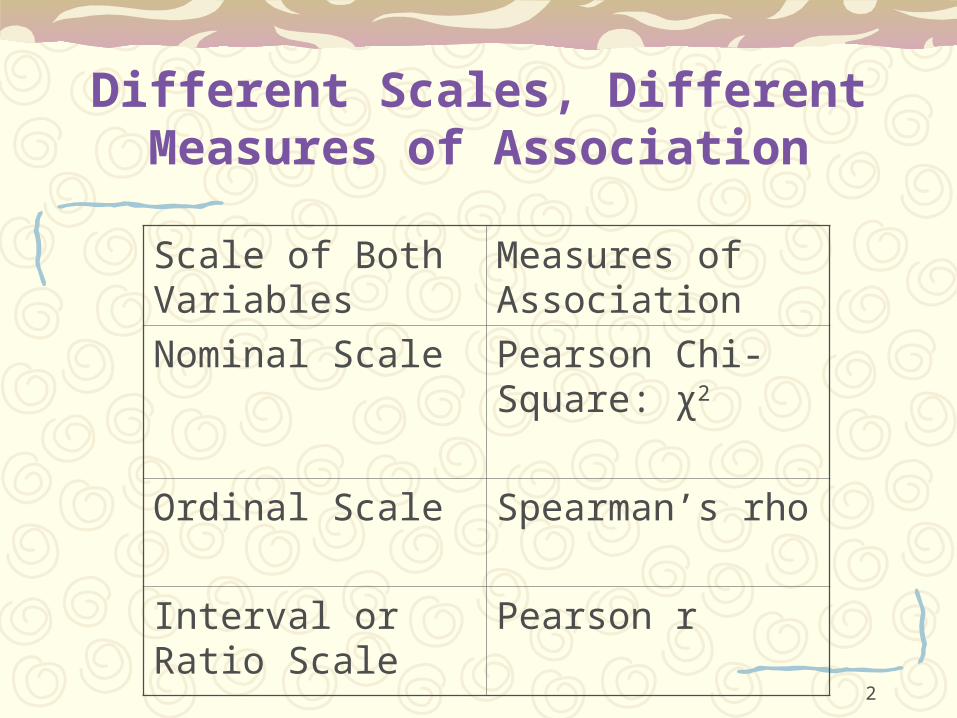
Chi-Square (χ2) and Frequency Data
Up to this point, the inference to the population has been concerned with “scores” on one or more variables, such as CAT scores, mathematics achievement, and hours spent on the computer.We used these scores to make the inferences about population means. To be sure not all research questions involve score data.Today the data that we analyze consists of frequencies; that is, the number of individuals falling into categories. In other words, the variables are measured on a nominal scale.The test statistic for frequency data is Pearson Chi-Square. The magnitude of Pearson Chi-Square reflects the amount of discrepancy between observed frequencies and expected frequencies.
4
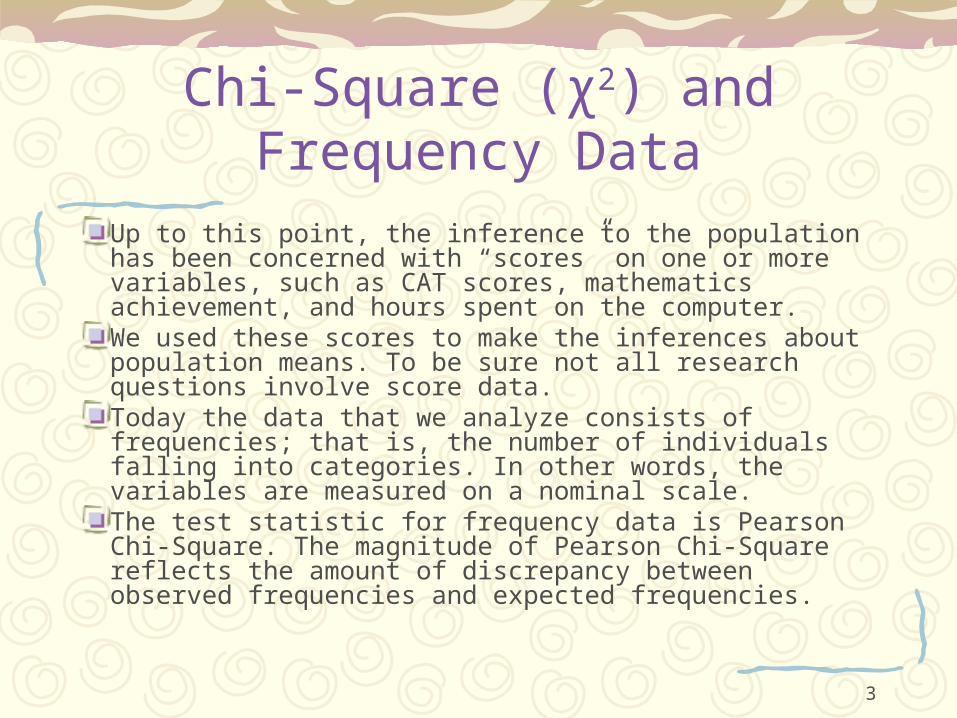
Steps in Test of Hypothesis
1. Determine the appropriate test 2. Establish the level of significance:α3. Formulate the statistical hypothesis4. Calculate the test statistic5. Determine the degree of freedom6. Compare computed test statistic against a
tabled/critical value
5
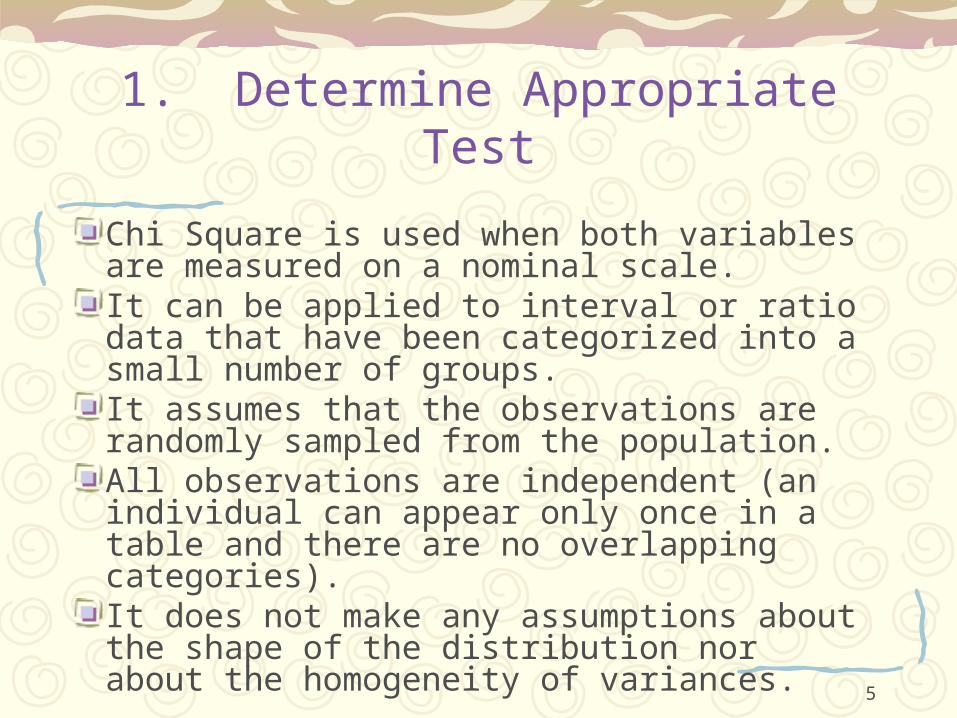
1. Determine Appropriate Test
Chi Square is used when both variables are measured on a nominal scale.It can be applied to interval or ratio data that have been categorized into a small number of groups.It assumes that the observations are randomly sampled from the population.All observations are independent (an individual can appear only once in a table and there are no overlapping categories).It does not make any assumptions about the shape of the distribution nor about the homogeneity of variances.
6
2. Establish Level of Significance
α is a predetermined value
The convention• α = .05
• α = .01
• α = .001
7
3. Determine The Hypothesis:Whether There is an Association
or NotHo : The two variables are independent
Ha : The two variables are associated
8
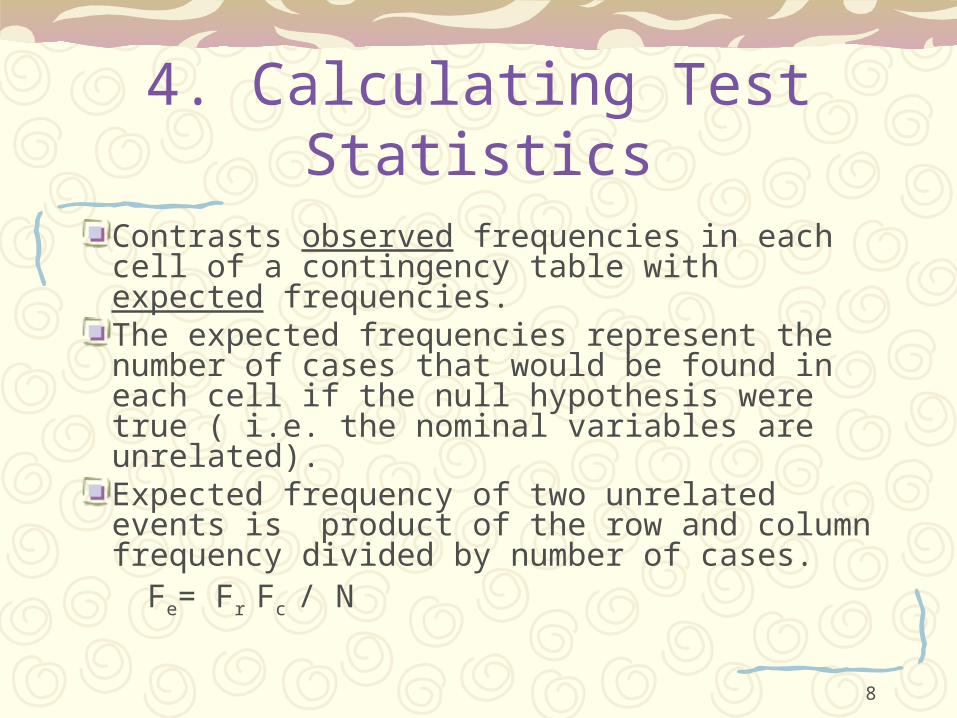
4. Calculating Test Statistics
Contrasts observed frequencies in each cell of a contingency table with expected frequencies.The expected frequencies represent the number of cases that would be found in each cell if the null hypothesis were true ( i.e. the nominal variables are unrelated).Expected frequency of two unrelated events is product of the row and column frequency divided by number of cases.
Fe= Fr Fc / N
9
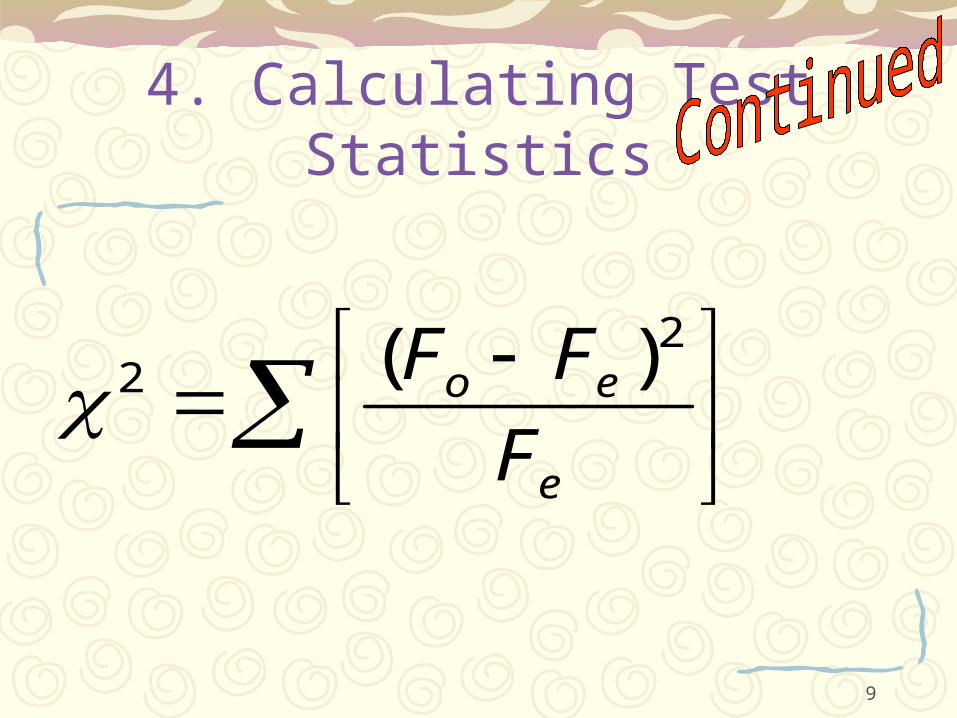
4. Calculating Test Statistics
e
eo
F
FF 22 )(
10
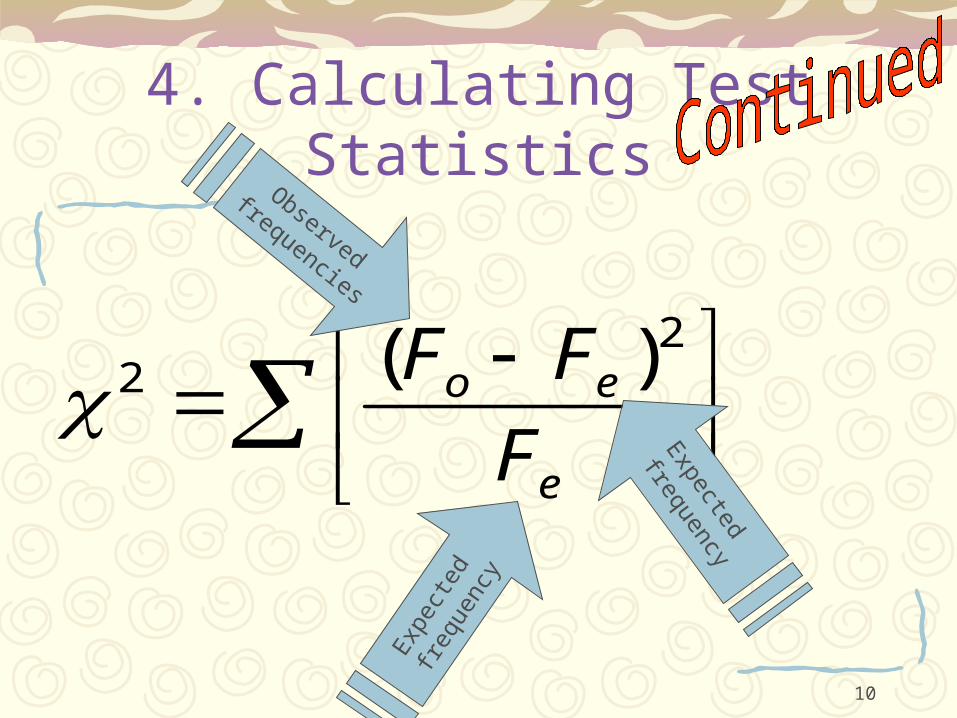
4. Calculating Test Statistics
e
eo
F
FF 22 )(
Observed
frequencies
Expe
cted
fre
quen
cy
Expected
frequency
11
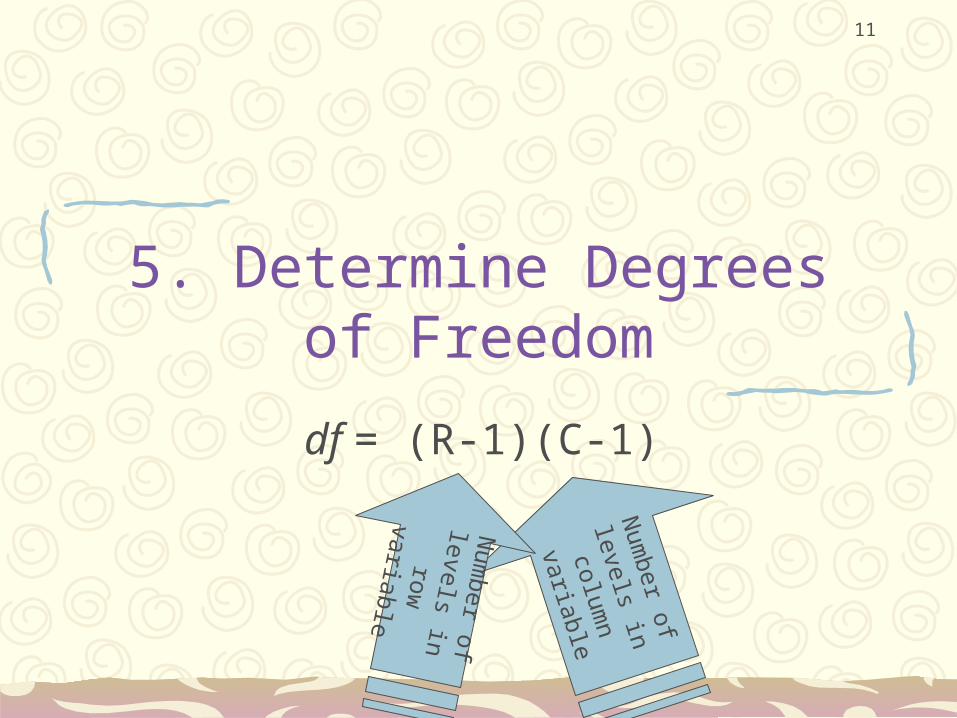
5. Determine Degrees of Freedom
df = (R-1)(C-1)
Num
ber of
levels in column
variable
Num
ber of levels in row
variable
12
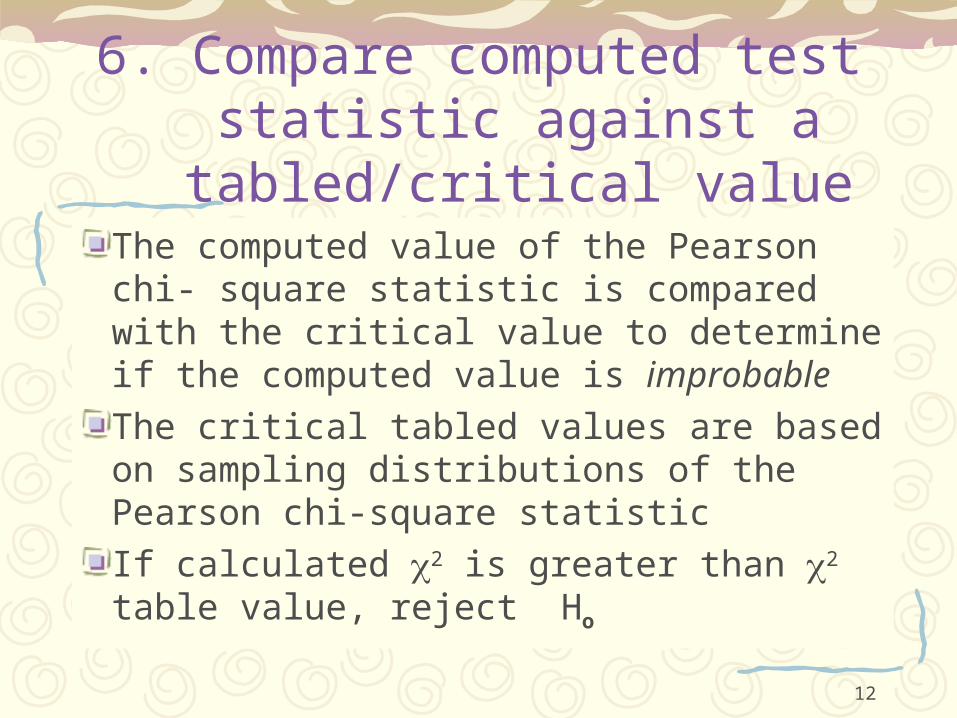
6. Compare computed test statistic against a tabled/critical value
The computed value of the Pearson chi- square statistic is compared with the critical value to determine if the computed value is improbable
The critical tabled values are based on sampling distributions of the Pearson chi-square statistic
If calculated 2 is greater than 2 table value, reject Ho
13
Example
Suppose a researcher is interested in voting preferences on gun control issues.
A questionnaire was developed and sent to a random sample of 90 voters.
The researcher also collects information about the political party membership of the sample of 90 respondents.
14
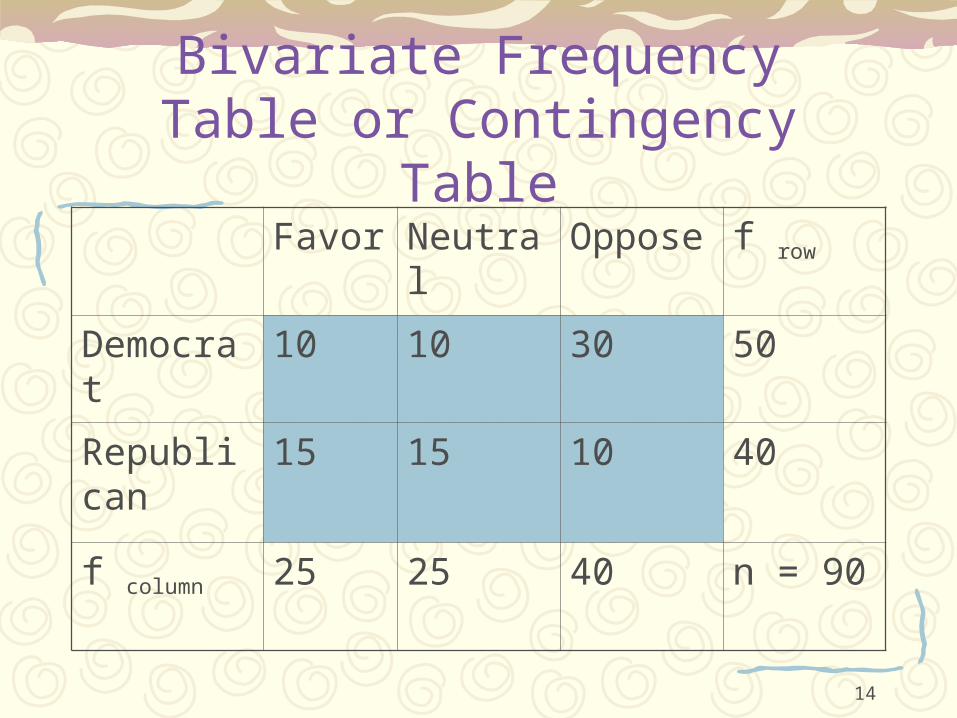
Bivariate Frequency Table or Contingency Table
Favor Neutral Oppose f row
Democrat 10 10 30 50
Republican 15 15 10 40
f column 25 25 40 n = 90
15
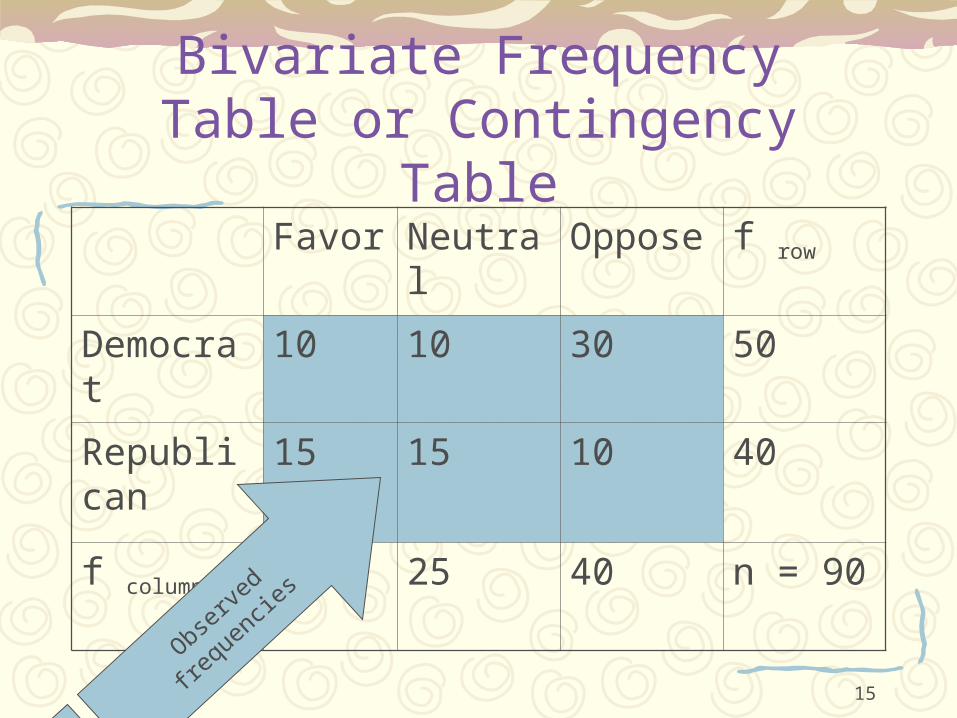
Bivariate Frequency Table or Contingency Table
Favor Neutral Oppose f row
Democrat 10 10 30 50
Republican 15 15 10 40
f column 25 25 40 n = 90
Observ
ed
frequ
encie
s
16
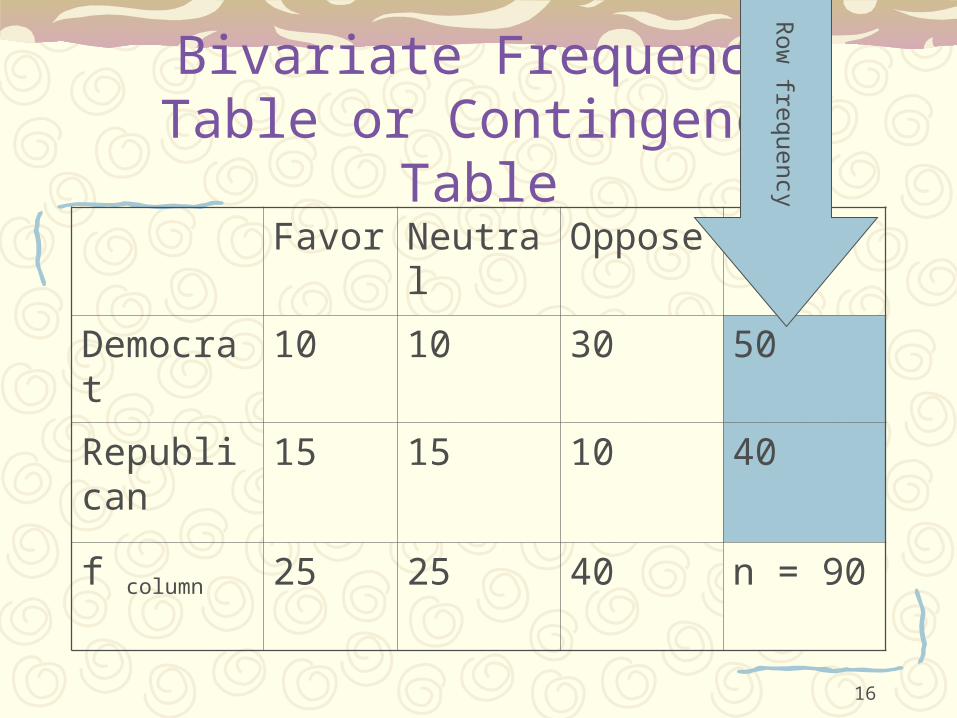
Bivariate Frequency Table or Contingency Table
Favor Neutral Oppose f row
Democrat 10 10 30 50
Republican 15 15 10 40
f column 25 25 40 n = 90
Row
frequency
17
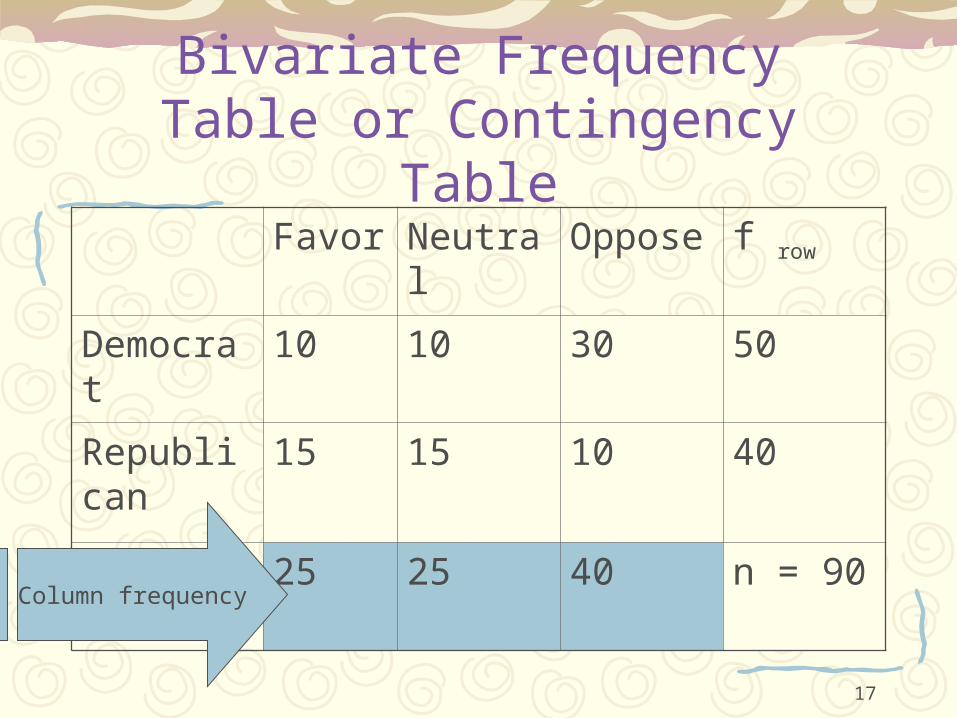
Bivariate Frequency Table or Contingency Table
Favor Neutral Oppose f row
Democrat 10 10 30 50
Republican 15 15 10 40
f column 25 25 40 n = 90Column frequency
18
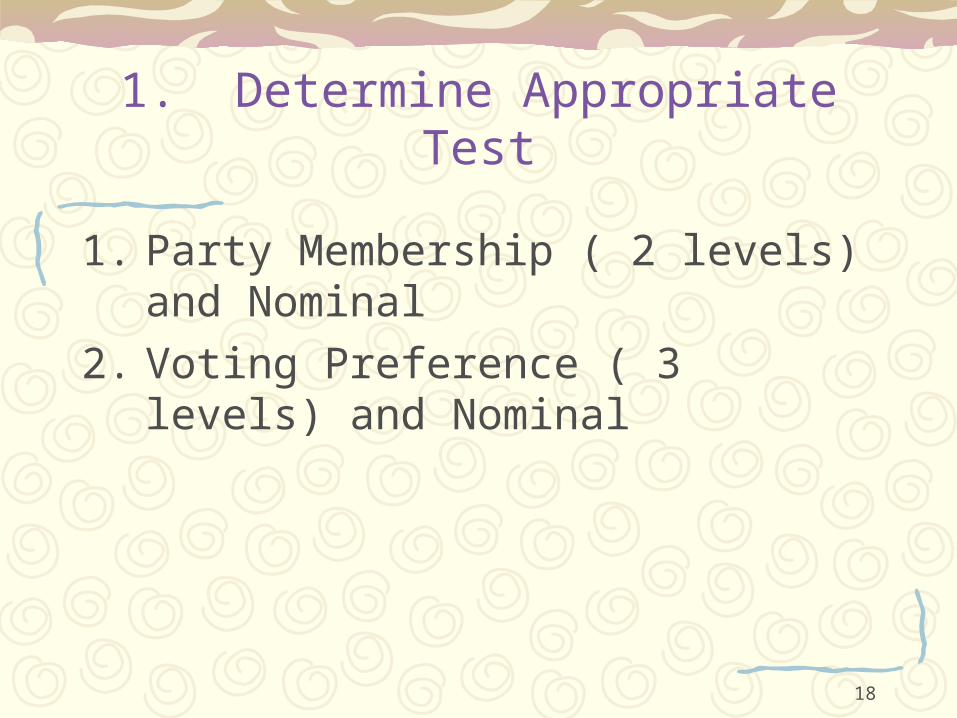
1. Determine Appropriate Test
1. Party Membership ( 2 levels) and Nominal
2. Voting Preference ( 3 levels) and Nominal

19
2. Establish Level of Significance
Alpha of .05
20
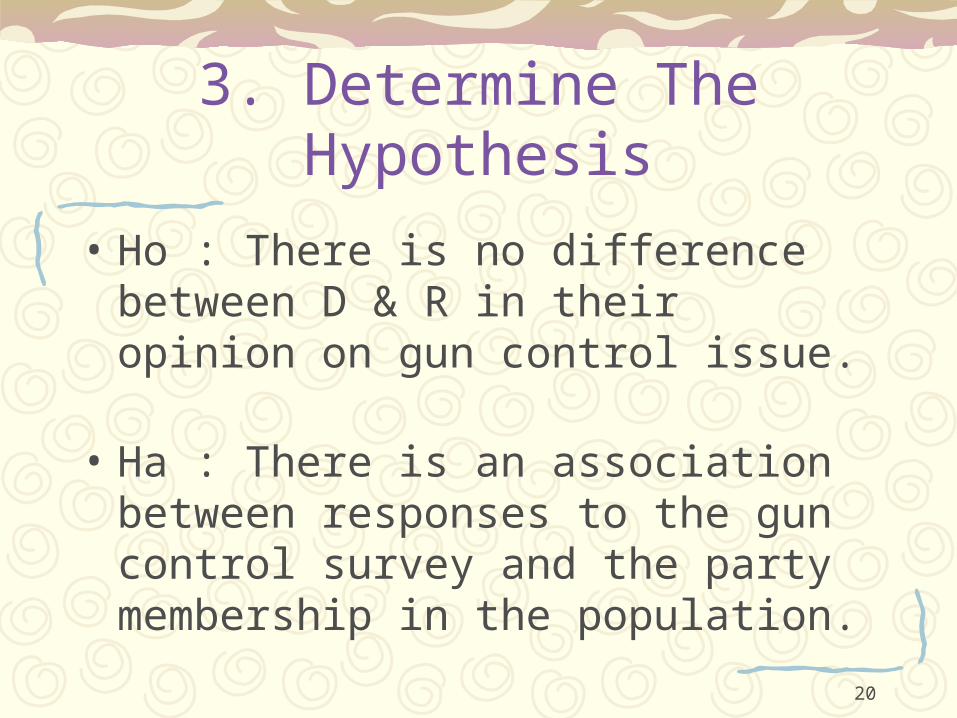
3. Determine The Hypothesis
• Ho : There is no difference between D & R in their opinion on gun control issue.
• Ha : There is an association between responses to the gun control survey and the party membership in the population.
21
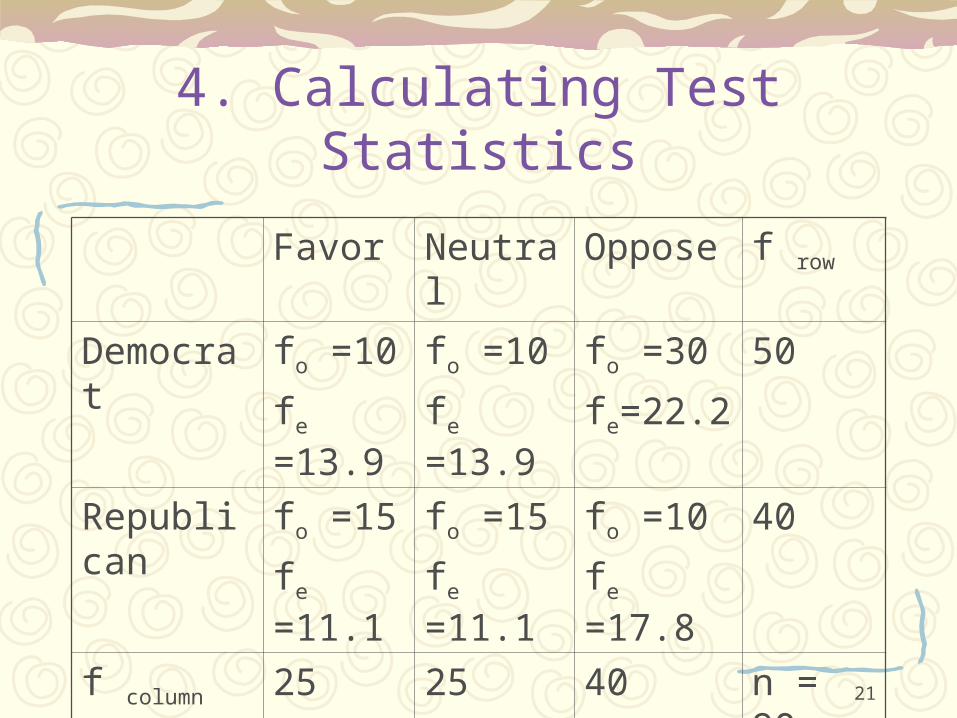
4. Calculating Test Statistics
Favor Neutral Oppose f row
Democrat fo =10
fe =13.9
fo =10
fe =13.9
fo =30
fe=22.2
50
Republican fo =15
fe =11.1
fo =15
fe =11.1
fo =10
fe =17.8
40
f column 25 25 40 n = 90
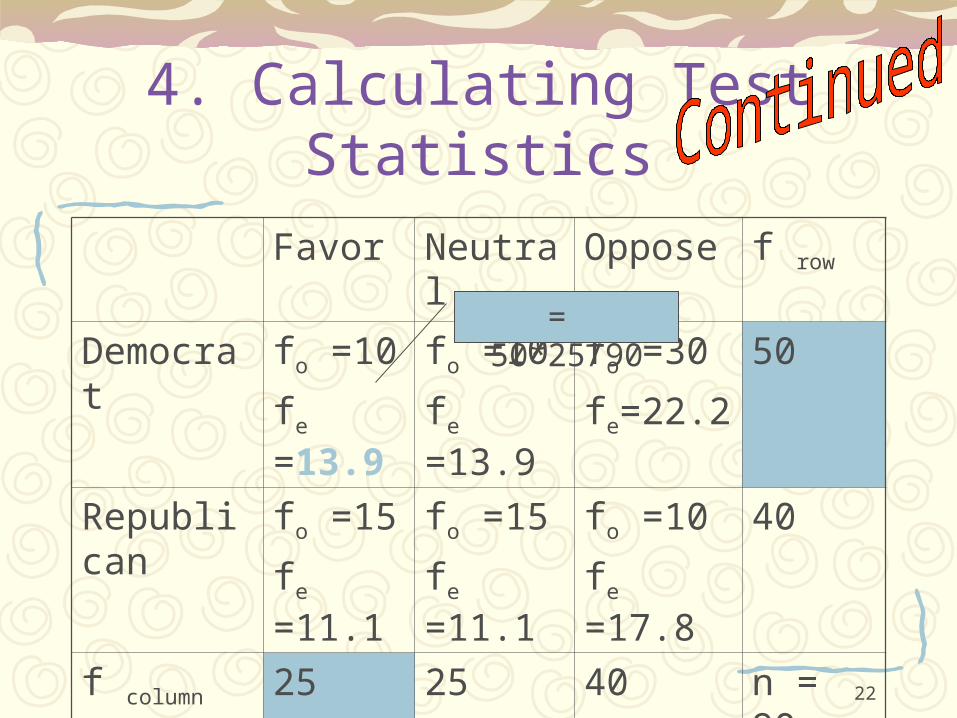
22
4. Calculating Test Statistics
Favor Neutral Oppose f row
Democrat fo =10
fe =13.9
fo =10
fe =13.9
fo =30
fe=22.2
50
Republican fo =15
fe =11.1
fo =15
fe =11.1
fo =10
fe =17.8
40
f column 25 25 40 n = 90
= 50*25/90
23
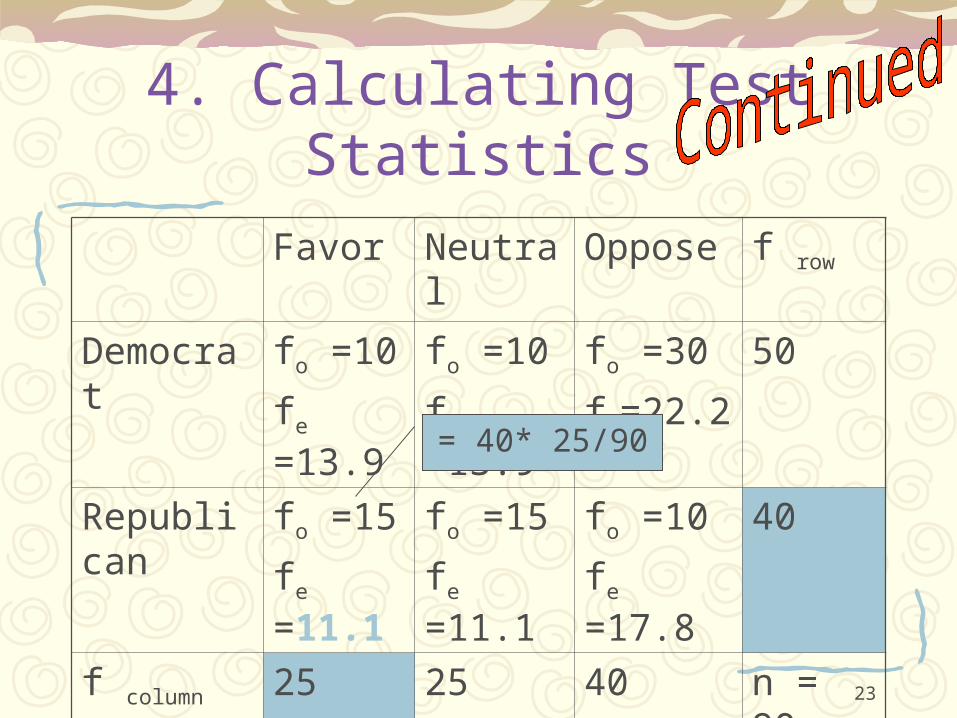
4. Calculating Test Statistics
Favor Neutral Oppose f row
Democrat fo =10
fe =13.9
fo =10
fe =13.9
fo =30
fe=22.2
50
Republican fo =15
fe =11.1
fo =15
fe =11.1
fo =10
fe =17.8
40
f column 25 25 40 n = 90
= 40* 25/90
24
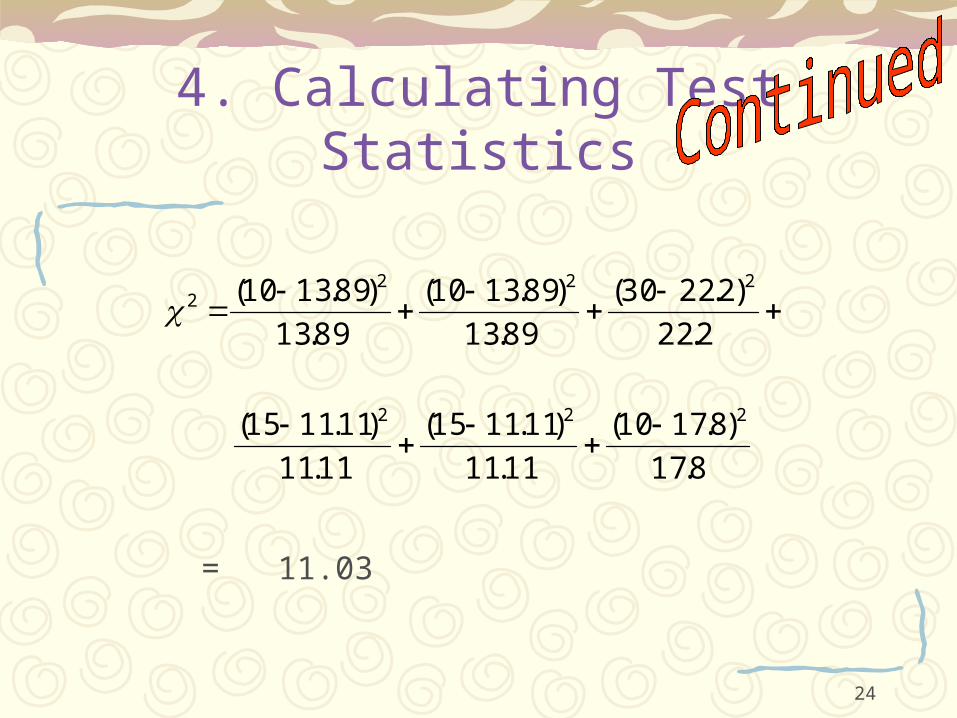
4. Calculating Test Statistics
8.17
)8.1710(
11.11
)11.1115(
11.11
)11.1115(
2.22
)2.2230(
89.13
)89.1310(
89.13
)89.1310(
222
2222
= 11.03

25
5. Determine Degrees of Freedom
df = (R-1)(C-1) =(2-1)(3-1) = 2
26
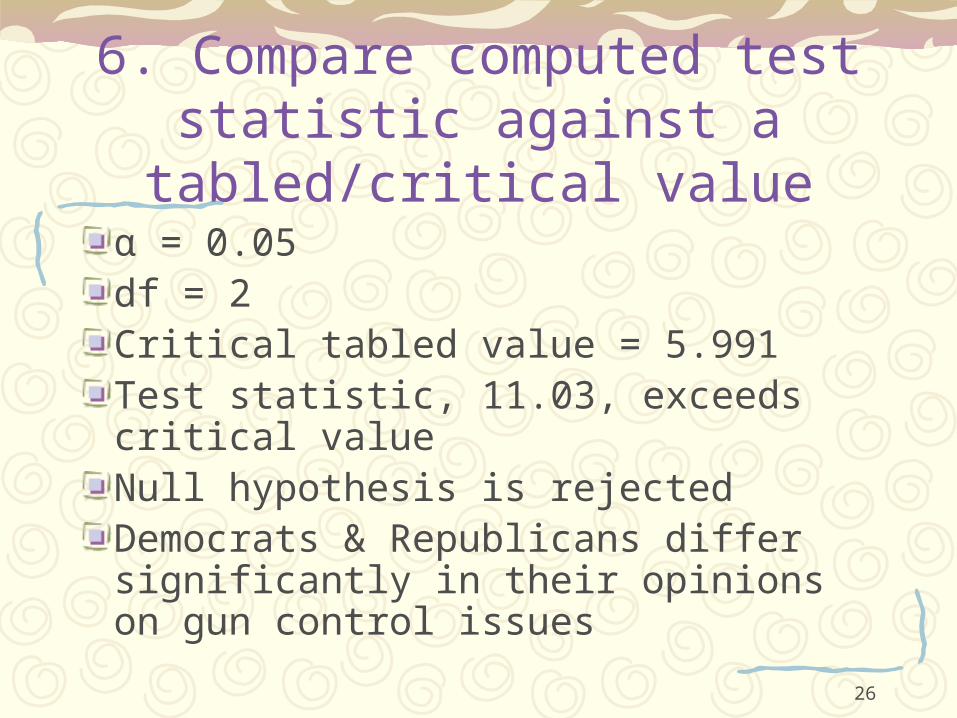
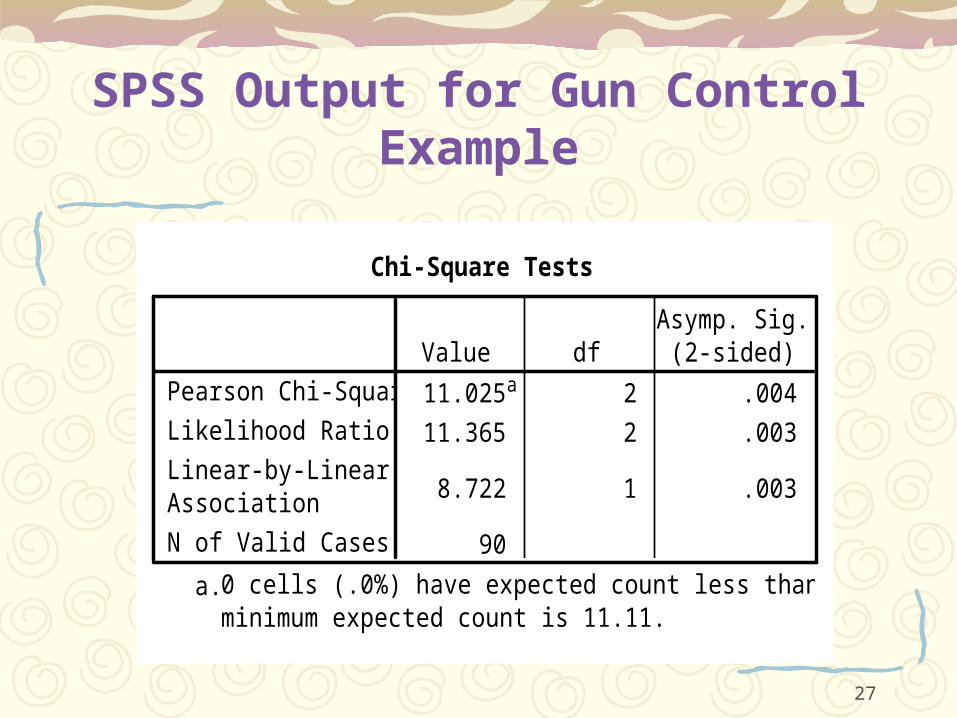
6. Compare computed test statistic against a tabled/critical value
α = 0.05df = 2Critical tabled value = 5.991Test statistic, 11.03, exceeds critical valueNull hypothesis is rejectedDemocrats & Republicans differ significantly in their opinions on gun control issues
27
SPSS Output for Gun Control Example
Chi-Square Tests
11.025a 2 .004
11.365 2 .003
8.722 1 .003
90
Pearson Chi-Square
Likelihood Ratio
Linear-by-LinearAssociation
N of Valid Cases
Value dfAsymp. Sig.
(2-sided)
0 cells (.0%) have expected count less than 5. Theminimum expected count is 11.11.
a.
28
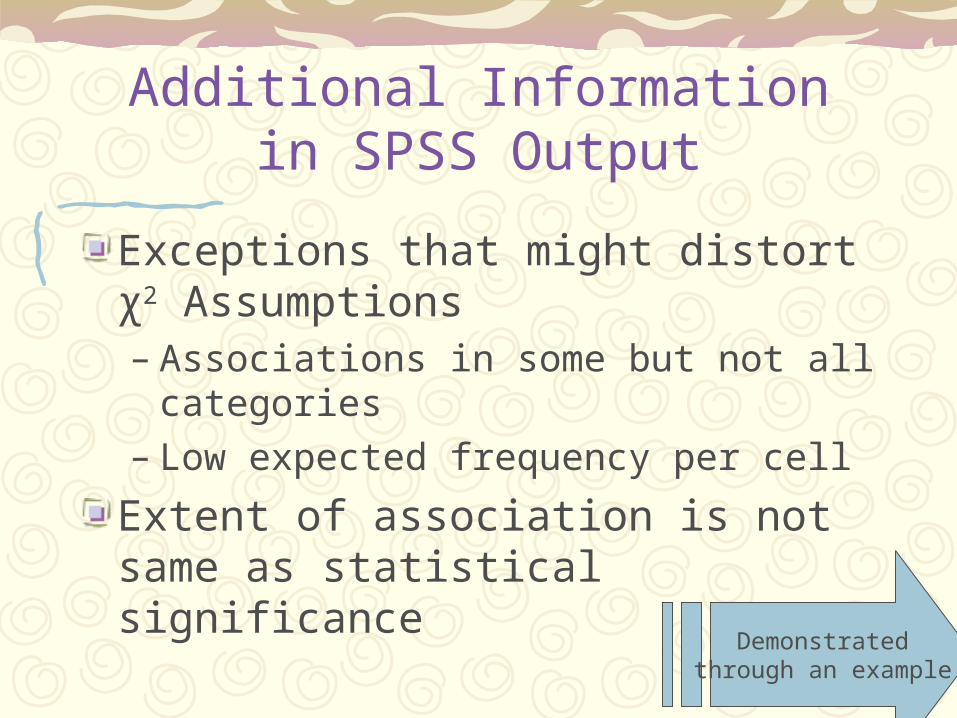
Additional Information in SPSS Output
Exceptions that might distort χ2 Assumptions– Associations in some but not all categories– Low expected frequency per cell
Extent of association is not same as statistical significance
Demonstratedthrough an example
29
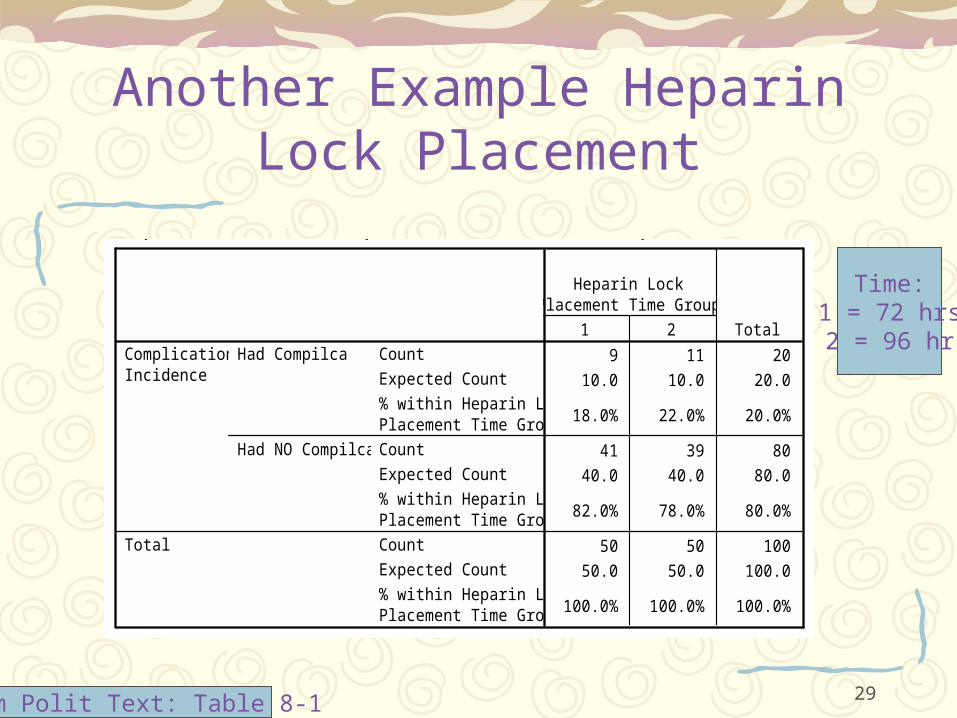
Another Example Heparin Lock Placement
Complication Incidence * Heparin Lock Placement Time Group Crosstabulation
9 11 20
10.0 10.0 20.0
18.0% 22.0% 20.0%
41 39 80
40.0 40.0 80.0
82.0% 78.0% 80.0%
50 50 100
50.0 50.0 100.0
100.0% 100.0% 100.0%
Count
Expected Count
% within Heparin LockPlacement Time Group
Count
Expected Count
% within Heparin LockPlacement Time Group
Count
Expected Count
% within Heparin LockPlacement Time Group
Had Compilca
Had NO Compilca
ComplicationIncidence
Total
1 2
Heparin LockPlacement Time Group
Total
from Polit Text: Table 8-1
Time:1 = 72 hrs 2 = 96 hrs
30
Hypotheses in Heparin Lock Placement
Ho: There is no association between complication incidence and length of heparin lock placement. (The variables are independent).
Ha: There is an association between complication incidence and length of heparin lock placement. (The variables are related).
31
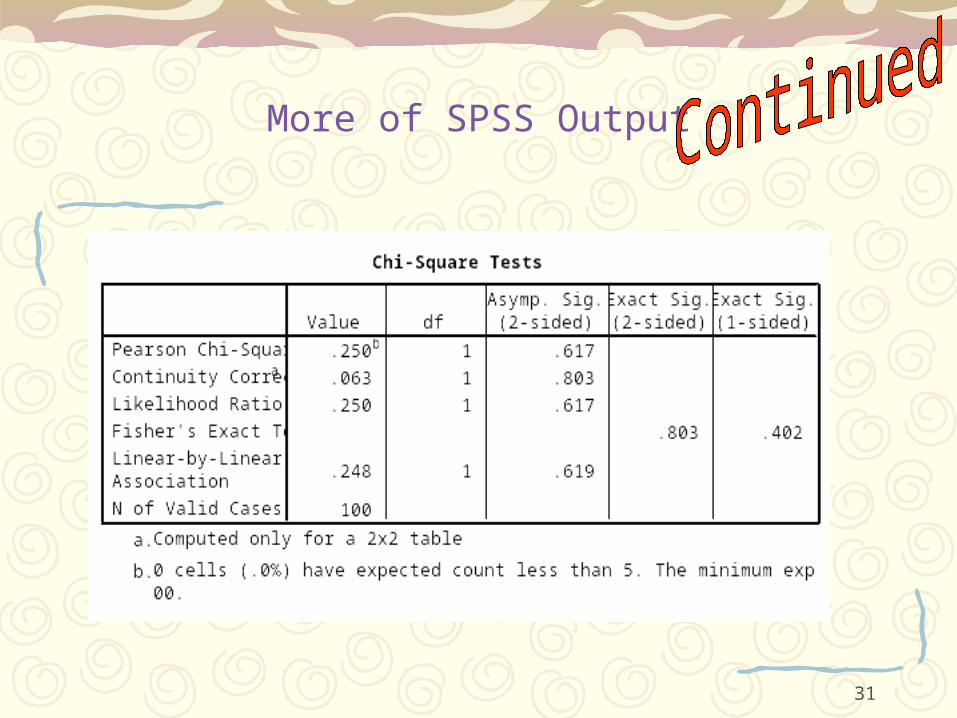
More of SPSS Output
32
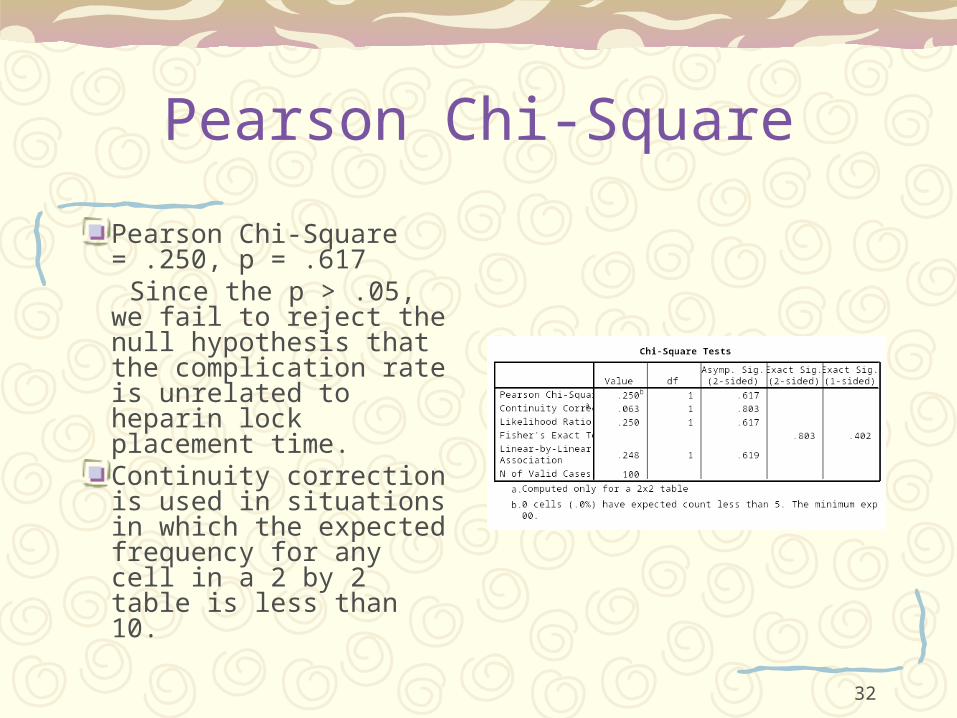
Pearson Chi-Square
Pearson Chi-Square = .250, p = .617
Since the p > .05, we fail to reject the null hypothesis that the complication rate is unrelated to heparin lock placement time.Continuity correction is used in situations in which the expected frequency for any cell in a 2 by 2 table is less than 10.
33
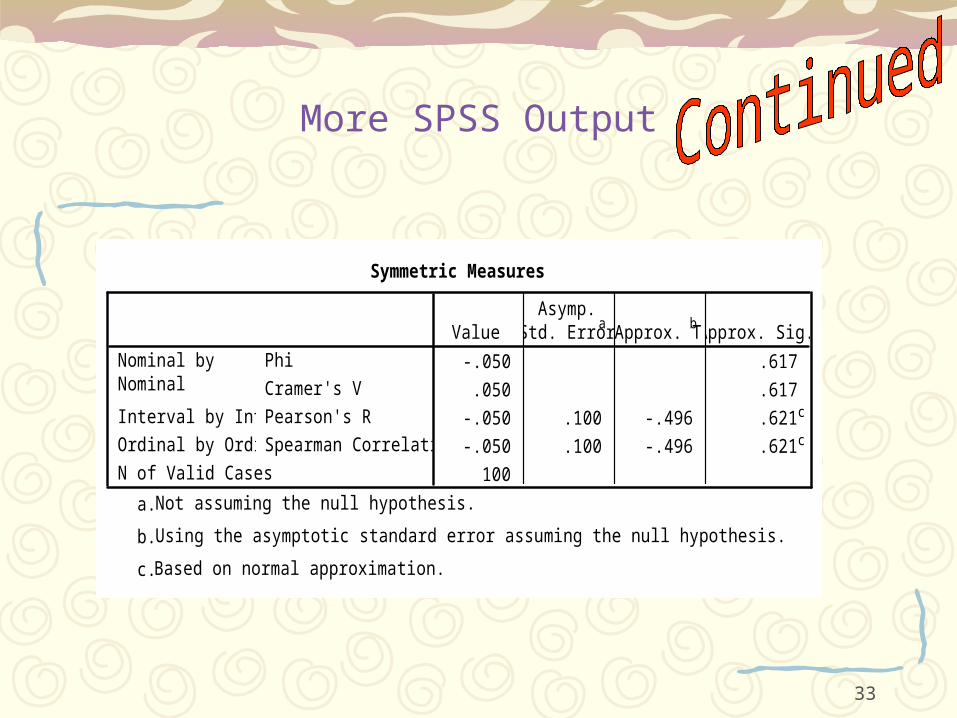
More SPSS Output
Symmetric Measures
-.050 .617
.050 .617
-.050 .100 -.496 .621c
-.050 .100 -.496 .621c
100
Phi
Cramer's V
Nominal byNominal
Pearson's RInterval by Interval
Spearman CorrelationOrdinal by Ordinal
N of Valid Cases
ValueAsymp.
Std. Errora
Approx. Tb
Approx. Sig.
Not assuming the null hypothesis.a.
Using the asymptotic standard error assuming the null hypothesis.b.
Based on normal approximation.c.

34
Phi Coefficient
Pearson Chi-Square provides information about the existence of relationship between 2 nominal variables, but not about the magnitude of the relationship
Phi coefficient is the measure of the strength of the association
Symmetric Measures
-.050
.050
-.050
-.050
100
Phi
Cramer's V
Nominal byNominal
Pearson's RInterval by Interval
Spearman CorrelationOrdinal by Ordinal
N of Valid Cases
Value
Not assuming the null hypothesis.a.
Using the asymptotic standard error assuming the null hypothesis.b.
Based on normal approximation.c.
N
2
35
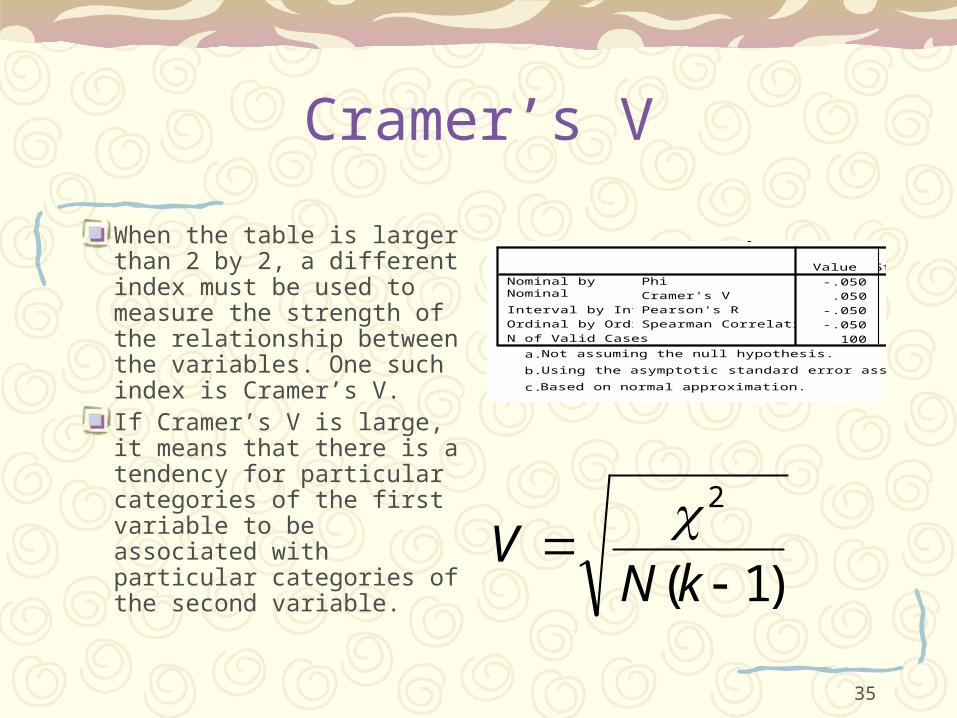
Cramer’s V
When the table is larger than 2 by 2, a different index must be used to measure the strength of the relationship between the variables. One such index is Cramer’s V.If Cramer’s V is large, it means that there is a tendency for particular categories of the first variable to be associated with particular categories of the second variable.
Symmetric Measures
-.050
.050
-.050 .100
-.050 .100
100
Phi
Cramer's V
Nominal byNominal
Pearson's RInterval by Interval
Spearman CorrelationOrdinal by Ordinal
N of Valid Cases
ValueAsymp.
Std. Error
Not assuming the null hypothesis.a.
Using the asymptotic standard error assuming the null hypothesis.b.
Based on normal approximation.c.
)1(
2
kNV
36
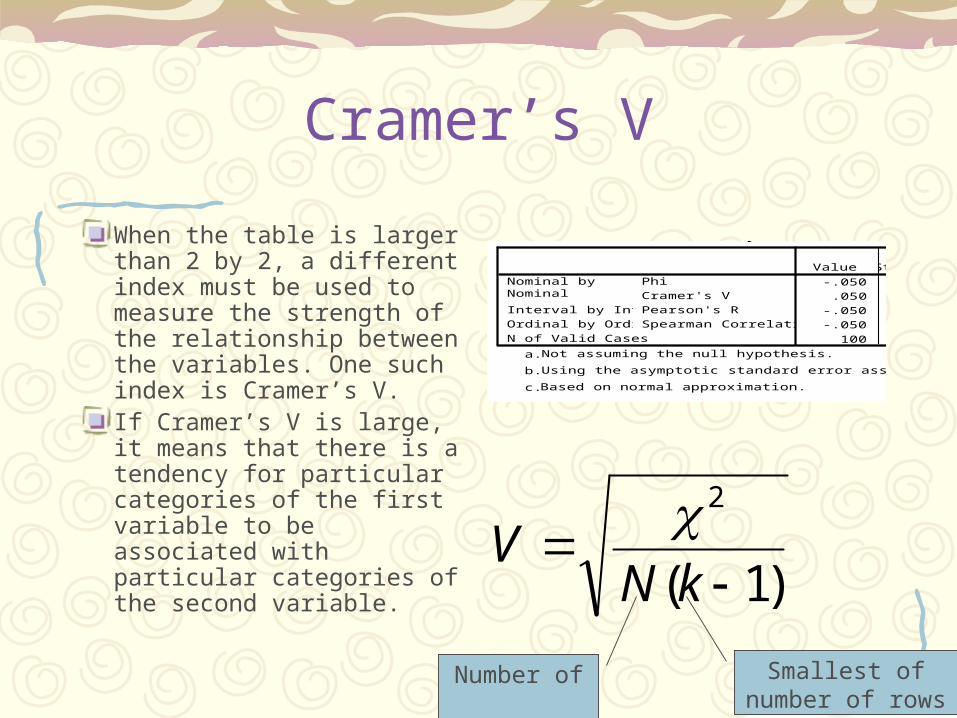
Cramer’s V
When the table is larger than 2 by 2, a different index must be used to measure the strength of the relationship between the variables. One such index is Cramer’s V.If Cramer’s V is large, it means that there is a tendency for particular categories of the first variable to be associated with particular categories of the second variable.
Symmetric Measures
-.050
.050
-.050 .100
-.050 .100
100
Phi
Cramer's V
Nominal byNominal
Pearson's RInterval by Interval
Spearman CorrelationOrdinal by Ordinal
N of Valid Cases
ValueAsymp.
Std. Error
Not assuming the null hypothesis.a.
Using the asymptotic standard error assuming the null hypothesis.b.
Based on normal approximation.c.
)1(
2
kNV
Number of cases
Smallest of number of rows or columns
37
Take Home Lesson
How to Test Association between Frequency of Two Nominal Variables