α-Induced Glycolysis Metabolism Is Essential to the...
11
Research Article HIF1α-Induced Glycolysis Metabolism Is Essential to the Activation of Inflammatory Macrophages Ting Wang, Huiying Liu, Guan Lian, Song-Yang Zhang, Xian Wang, and Changtao Jiang Department of Physiology and Pathophysiology, Key Laboratory of Molecular Cardiovascular Sciences, Ministry of Education, School of Basic Medical Sciences, Peking University, Beijing 100191, China Correspondence should be addressed to Changtao Jiang; [email protected] Received 11 May 2017; Accepted 20 August 2017; Published 13 December 2017 Academic Editor: Hua Wang Copyright © 2017 Ting Wang et al. This is an open access article distributed under the Creative Commons Attribution License, which permits unrestricted use, distribution, and reproduction in any medium, provided the original work is properly cited. Hypoxia-inducible factor (HIF) 1α is a metabolic regulator that plays an important role in immunologic responses. Previous studies have demonstrated that HIF1α participates in the M1 polarization of macrophages. To clarify the mechanism of HIF1α-induced polarization of M1 macrophage, myeloid-specific HIF1α overexpression (Lysm HIF1α lsl) mice were employed and the bone marrow-derived and peritoneal macrophages were isolated. RT-PCR results revealed that HIF1α overexpression macrophage had a hyperinflammatory state characterized by the upregulation of M1 markers. Cellular bioenergetics analysis showed lower cellular oxygen consumption rates in the Lysm HIF1α lsl mice. Metabolomics studies showed that HIF1α overexpression led to increased glycolysis and pentose phosphate pathway intermediates. Further results revealed that macrophage M1 polarization, induced by HIF1α overexpression, was via upregulating the mRNA expression of the genes related to the glycolysis metabolism. Our results indicate that HIF1α promoted macrophage glycolysis metabolism, which induced M1 polarization in mice. 1. Introduction Macrophages are the main component of innate immu- nity and play important roles in various inflammatory diseases, including hepatitis, vascular diseases, inflamma- tory bowel diseases, rheumatoid arthritis, and airway inflammation [1–5]. Activated macrophages are com- monly divided into two polarized phenotypes, classically activated M1 and alternatively activated M2. Macro- phages activated by interferon γ or toll-like receptor agonists polarize to the M1 phenotype [6], which are proinflammatory macrophages and play a central role in the host’s defense against infection and inflammatory diseases [7, 8]. Macrophages activated by Th2 cytokines, IL-4, and IL-13 are polarized to M2 phenotype, which are associated with inflammation relief and tissue remodel- ing [9, 10]. Macrophage activation can be altered by disrupting cellular energy metabolism [11, 12]. Recent studies have demonstrated that M1 macrophages demand glycolysis, while M2 macrophages require fatty acid oxi- dation [13, 14]. However, the metabolomics profiling and the metabolic mechanism of macrophages polarization remained undefined. Hypoxia-inducible factor 1 (HIF1) has emerged as one of the central regulators of inflammation mediated by myeloid cells [15, 16]. HIF1 is an α and β heterodimer [15, 17]. Whereas HIF1β is constitutively expressed in cells regard- less of O 2 tension [18], HIF1α protein increases exponen- tially in response to reduced O 2 concentration [19]. HIF1 has displayed a significant role in regulating cellular ATP concentration and myeloid cell function including cell aggregation, motility, invasiveness, and bacterial killing [20–22]. Importantly, it has been reported that HIF1 partici- pates in the regulation of macrophage polarization [20]. As glucose metabolism determines polarization of macro- phages [23, 24], whether glucose metabolism is involved in HIF1α-induced macrophage polarization process has remained unclear. Hindawi Mediators of Inflammation Volume 2017, Article ID 9029327, 10 pages https://doi.org/10.1155/2017/9029327
Transcript of α-Induced Glycolysis Metabolism Is Essential to the...
Research ArticleHIF1α-Induced Glycolysis Metabolism Is Essential to theActivation of Inflammatory Macrophages
Ting Wang, Huiying Liu, Guan Lian, Song-Yang Zhang, Xian Wang, and Changtao Jiang
Department of Physiology and Pathophysiology, Key Laboratory of Molecular Cardiovascular Sciences, Ministry of Education,School of Basic Medical Sciences, Peking University, Beijing 100191, China
Correspondence should be addressed to Changtao Jiang; [email protected]
Received 11 May 2017; Accepted 20 August 2017; Published 13 December 2017
Academic Editor: Hua Wang
Copyright © 2017 Ting Wang et al. This is an open access article distributed under the Creative Commons AttributionLicense, which permits unrestricted use, distribution, and reproduction in any medium, provided the original work isproperly cited.
Hypoxia-inducible factor (HIF) 1α is a metabolic regulator that plays an important role in immunologic responses. Previousstudies have demonstrated that HIF1α participates in the M1 polarization of macrophages. To clarify the mechanism ofHIF1α-induced polarization of M1 macrophage, myeloid-specific HIF1α overexpression (Lysm HIF1α lsl) mice were employedand the bone marrow-derived and peritoneal macrophages were isolated. RT-PCR results revealed that HIF1α overexpressionmacrophage had a hyperinflammatory state characterized by the upregulation of M1 markers. Cellular bioenergetics analysisshowed lower cellular oxygen consumption rates in the Lysm HIF1α lsl mice. Metabolomics studies showed that HIF1αoverexpression led to increased glycolysis and pentose phosphate pathway intermediates. Further results revealed thatmacrophage M1 polarization, induced by HIF1α overexpression, was via upregulating the mRNA expression of the genesrelated to the glycolysis metabolism. Our results indicate that HIF1α promoted macrophage glycolysis metabolism, whichinduced M1 polarization in mice.
1. Introduction
Macrophages are the main component of innate immu-nity and play important roles in various inflammatorydiseases, including hepatitis, vascular diseases, inflamma-tory bowel diseases, rheumatoid arthritis, and airwayinflammation [1–5]. Activated macrophages are com-monly divided into two polarized phenotypes, classicallyactivated M1 and alternatively activated M2. Macro-phages activated by interferon γ or toll-like receptoragonists polarize to the M1 phenotype [6], which areproinflammatory macrophages and play a central rolein the host’s defense against infection and inflammatorydiseases [7, 8]. Macrophages activated by Th2 cytokines,IL-4, and IL-13 are polarized to M2 phenotype, whichare associated with inflammation relief and tissue remodel-ing [9, 10]. Macrophage activation can be altered bydisrupting cellular energy metabolism [11, 12]. Recentstudies have demonstrated that M1 macrophages demand
glycolysis, while M2 macrophages require fatty acid oxi-dation [13, 14]. However, the metabolomics profilingand the metabolic mechanism of macrophages polarizationremained undefined.
Hypoxia-inducible factor 1 (HIF1) has emerged as one ofthe central regulators of inflammation mediated by myeloidcells [15, 16]. HIF1 is an α and β heterodimer [15, 17].Whereas HIF1β is constitutively expressed in cells regard-less of O2 tension [18], HIF1α protein increases exponen-tially in response to reduced O2 concentration [19]. HIF1has displayed a significant role in regulating cellular ATPconcentration and myeloid cell function including cellaggregation, motility, invasiveness, and bacterial killing[20–22]. Importantly, it has been reported that HIF1 partici-pates in the regulation of macrophage polarization [20]. Asglucose metabolism determines polarization of macro-phages [23, 24], whether glucose metabolism is involvedin HIF1α-induced macrophage polarization process hasremained unclear.
HindawiMediators of InflammationVolume 2017, Article ID 9029327, 10 pageshttps://doi.org/10.1155/2017/9029327
2. Materials and Methods
2.1. Chemicals and Reagents. RPMI 1640 medium was pur-chased from Gibco. Fetal Bovine Serum (FBS), penicillin, andstreptomycin were purchased from HyClone. GM-CSF waspurchased from PeproTech. Ammonium acetate, LPS, oligo-mycin, carbonyl cyanide p-trifluoromethoxyphenylhydrazone(FCCP), rotenone, and antimycin A were purchased fromSigma. BBL™ Thioglycollate Medium was purchased from BDBiosciences, US. [5-13C]glutamine was obtained fromCambridge Isotope Laboratories. HPLC grade ammoniumhydroxide, acetonitrile, and methanol were purchased fromFisher Scientific. Deionized water was produced by aMilli-Q system.
2.2. Animals. Lsl-HIF1 dPA mice were obtained as describedpreviously [25]. For myeloid-specific HIF1α overexpression,Lsl-HIF1 dPA mice were crossed with mice harboring theCre recombinase under control of the lysozyme M (Lysm)promoter, which is found only in myeloid lineage cells, toobtain the Lysm HIF1α lsl mice. The wild-type (WT) andLysm HIF1α lsl mice were littermate and on a C57BL/6 Jbackground, after backcrossing with C57BL/6J mice for overten generations. All the animal protocols were approved bythe Animal Care and Use Committee of Peking University.
2.3. Peritoneal Macrophage. WT and Lysm HIF1α lsl mice(6- to 8-weeks old) were injected intraperitoneally with4% thioglycollate solution (2ml). Three days later, perito-neal cells were harvested by injecting the peritoneal cavitywith PBS containing 10% FBS. Primary peritoneal macro-phages were cultured with RPMI-1640 medium supple-mented with 10% FBS. Medium was changed 2–4h later.Thioglycollate-elicited peritoneal macrophages were attachedon plates and continued culturing for 6 to 24 h.
2.4. Bone Marrow-Derived Macrophages (BMDMs). Bonemarrow cells were collected from WT and Lysm HIF1α lslmice (4- to 6-weeks old). Adherent macrophages werecultured for 3 days in RPMI-1640 supplemented with 10%FBS and GM-CSF (10ng/mL). Then, the medium waschanged and the attached macrophages were obtained afteranother 3 days. To obtain the M1 polarization, macrophageswere continued culturing for 2 days in RPMI-1640 supple-mented with 10% FBS and LPS (10ng/mL).
2.5. Quantitative RT-PCR. Total RNA was isolated fromperitoneal macrophages or BMDMs using TRIzol reagent.cDNA was obtained using the M-MLV reverse transcriptasekit according to the manufacturer’s instructions. RT-PCRamplification was performed using an Mx3000 MultiplexQuantitative PCR System and SYBR Green I reagent. Geneexpression levels were normalized to the internal control18S rRNA.
2.6. Extracellular Flux Analysis. An XF24 Extracellular FluxAnalyzer was used to measure the respiratory conditions ofmurine peritoneal macrophages. Cells were plated at 5× 10⁴cells/well in 24-well XF microplates and cultured for 6 h.RPMI-1640 medium was replaced with XF base medium
supplemented with 25mM glucose and 2mM pyruvate.After 1 h of incubation in a CO2-free incubator at 37°C,the oxygen consumption rate (OCR) and extracellularacidification rates (ECAR) were measured following themanufacturer’s instruction. Mitochondrial stress tests wereperformed under basal conditions or with the treatmentof metabolic reagents, including 1mM oligomycin, 1mMFCCP, 1mM rotenone, and 1mM antimycin A. ECARwas calculated by Wave software.
2.7. Metabolomics Analysis. Analysis of metabolites wasperformed with a liquid chromatography-tandem massspectrometry. For metabolite extraction, cultured cells werewashed with saline twice, lysed in 80% aqueous methanol(v/v), and equilibrated at −80°C for 20min. [5-13C]gluta-mine was added as an internal standard. Cells were oscillatedfor 10min and centrifuged with the speed of 14,000g for10min at 4°C. Cell supernatants of metabolite extracts werecollected, dried, and stored at −80°C before injection.
For liquid chromatography-tandem mass spectrometry(LC-MS/MS) analysis, samples were reconstituted in waterand analyzed using a QTRAP 5500 LC-MS/MS system (ABSCIEX) coupled with an ACQUITY UHPLC System (WatersCorporation). An Xbridge Amide column (100× 4.6mm i.d.,3.5 Lm; Waters Corporation) was employed for compoundseparation at 30°C. The mobile phase A was 5mM ammo-nium acetate in water with 5% acetonitrile, and mobile phaseB was acetonitrile. The linear gradient used was as follows:0min, 90% B; 1.5min, 85% B; 5.5min, 35% B; 10min, 35%B; 10.5min, 35% B; 14.5min, 35% B; 15min, 85% B; and20min, 85% B. The flow rate was 0.5ml/min. MultiQuantv3.0 software (AB SCIEX) was used to process all raw liquidchromatography-mass spectrometry data and integratechromatographic peaks. Integrated peak areas correspondingto metabolite concentrations were further analyzed usingthe MetaboAnalyst website (http://www.metaboanalyst.ca).Metabolite abundance was expressed relative to theinternal standard.
2.8. Statistical Analysis. All data are presented as themean± SEM. Comparisons of data sets were performedusing unpaired Student’s t-tests for comparing twogroups. Statistical analyses were performed using Graph-Pad Prism (GraphPad Software). A P value at ∗P < 0 05and ∗∗P < 0 01 was considered statistically significant forall experiments.
3. Results
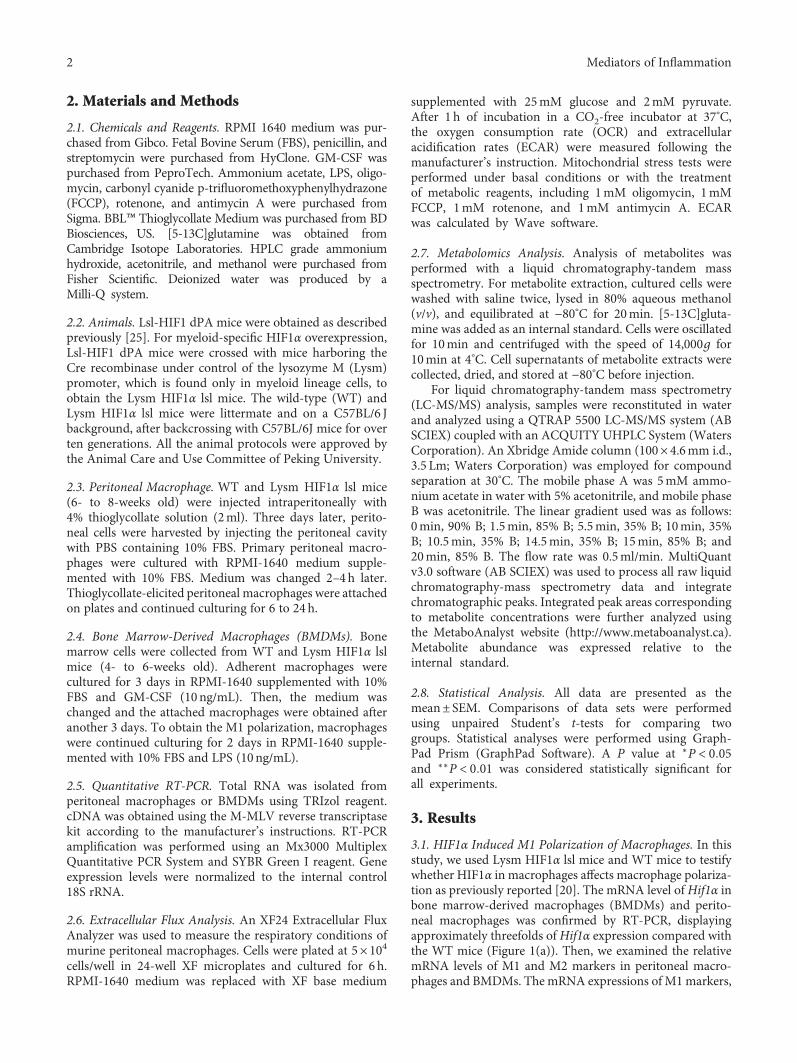
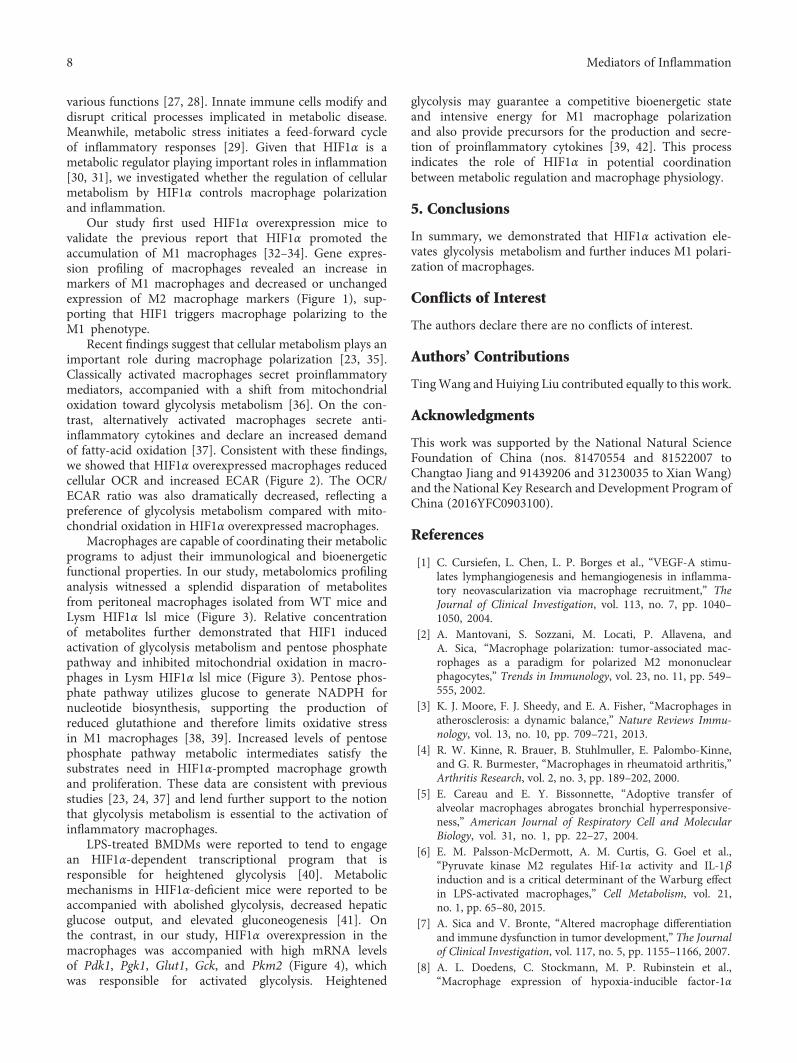
3.1. HIF1α Induced M1 Polarization of Macrophages. In thisstudy, we used Lysm HIF1α lsl mice and WT mice to testifywhether HIF1α in macrophages affects macrophage polariza-tion as previously reported [20]. The mRNA level ofHif1α inbone marrow-derived macrophages (BMDMs) and perito-neal macrophages was confirmed by RT-PCR, displayingapproximately threefolds of Hif1α expression compared withthe WT mice (Figure 1(a)). Then, we examined the relativemRNA levels of M1 and M2 markers in peritoneal macro-phages and BMDMs. The mRNA expressions of M1markers,
2 Mediators of Inflammation
including Il6, Il1b, Inos, Tnfα, and Cd11c, were markedlyhigher in peritoneal macrophages isolated from Lysm HIF1αlsl mice, while the expressions of M2 markers, Arg1, Cd206,and Chi313, showed little difference or even lower comparedwith WT mice at 6 h (Figure 1(b)) and 24 h (Figure 1(c)). InBMDMs, M1 markers were highly expressed in Lysm HIF1αlsl mice, and the M2 markers were markedly less at the samelevel by comparison (Figure 1(d)). These results indicate thatmacrophage HIF1α overexpression induces M1 polarizationof macrophages.
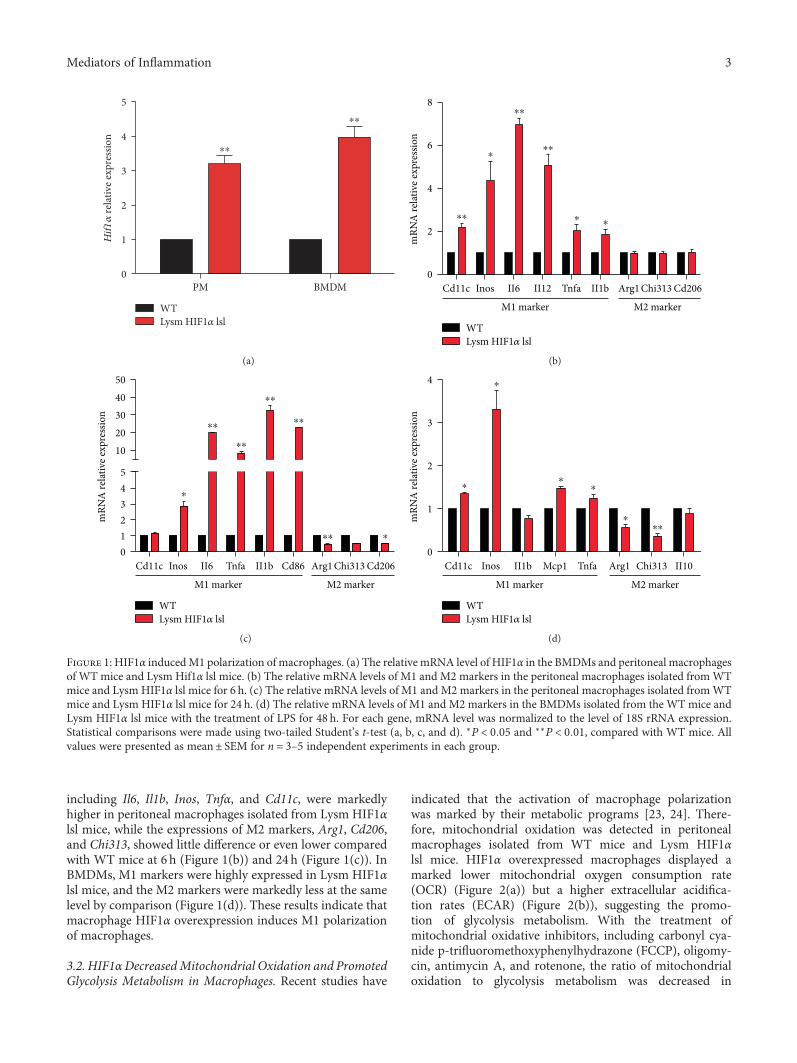
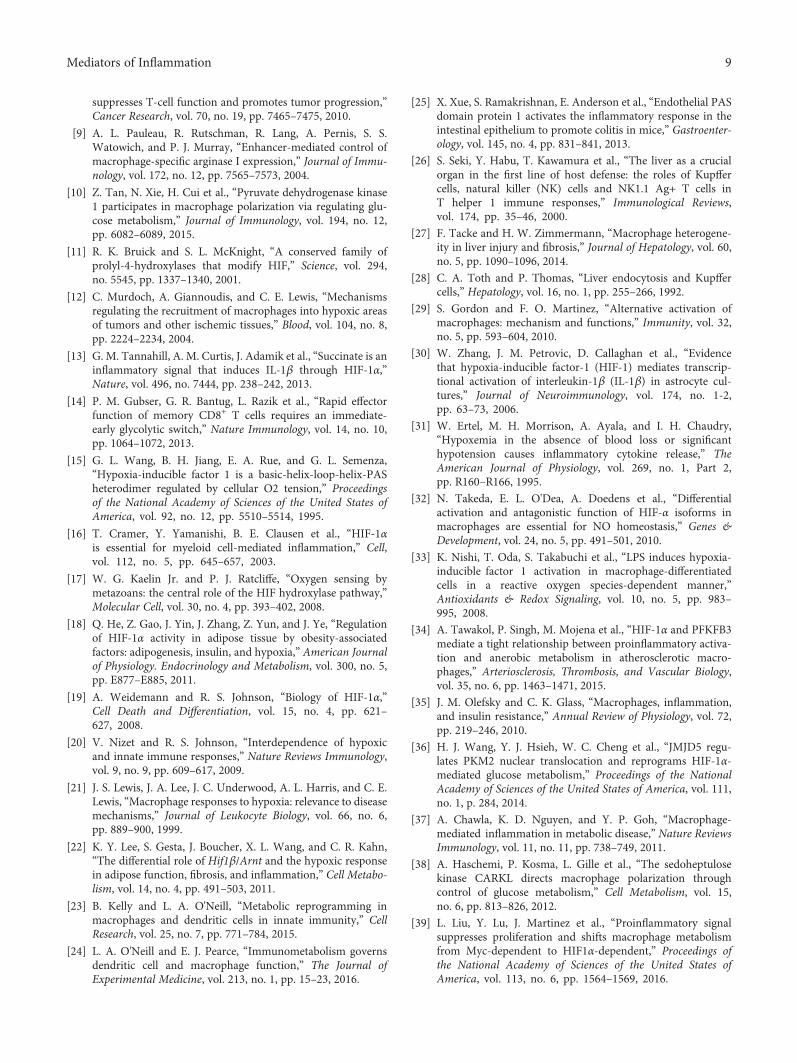
3.2. HIF1αDecreasedMitochondrial Oxidation and PromotedGlycolysis Metabolism in Macrophages. Recent studies have
indicated that the activation of macrophage polarizationwas marked by their metabolic programs [23, 24]. There-fore, mitochondrial oxidation was detected in peritonealmacrophages isolated from WT mice and Lysm HIF1αlsl mice. HIF1α overexpressed macrophages displayed amarked lower mitochondrial oxygen consumption rate(OCR) (Figure 2(a)) but a higher extracellular acidifica-tion rates (ECAR) (Figure 2(b)), suggesting the promo-tion of glycolysis metabolism. With the treatment ofmitochondrial oxidative inhibitors, including carbonyl cya-nide p-trifluoromethoxyphenylhydrazone (FCCP), oligomy-cin, antimycin A, and rotenone, the ratio of mitochondrialoxidation to glycolysis metabolism was decreased in
PM BMDM0
1
2
3
4
5
WTLysm HIF1�훼 lsl
⁎⁎
⁎⁎H
if1�훼
rela
tive e
xpre
ssio
n
(a)
Cd11c Inos II6 II12 Tnfa II1b Arg1 Chi313 Cd2060
2
4
6
8
WTLysm HIF1�훼 lsl
⁎⁎
M1 marker M2 marker
mRN
A re
lativ
e exp
ress
ion
⁎
⁎⁎
⁎⁎
⁎ ⁎
(b)
Cd11c Inos II6 Tnfa II1b Cd86 Arg1 Chi313 Cd2060
21
345
203040
10
50
WTLysm HIF1�훼 lsl
M1 marker M2 marker
mRN
A re
lativ
e exp
ress
ion
⁎⁎
⁎⁎
⁎⁎
⁎⁎
⁎⁎ ⁎
⁎
(c)
Cd11c Inos II1b Mcp1 Tnfa Arg1 Chi313 II100
1
2
3
4
WTLysm HIF1�훼 lsl
M1 marker M2 marker
mRN
A re
lativ
e exp
ress
ion
⁎
⁎
⁎⁎
⁎⁎⁎
(d)
Figure 1: HIF1α inducedM1 polarization of macrophages. (a) The relative mRNA level of HIF1α in the BMDMs and peritoneal macrophagesof WT mice and Lysm Hif1α lsl mice. (b) The relative mRNA levels of M1 and M2 markers in the peritoneal macrophages isolated fromWTmice and Lysm HIF1α lsl mice for 6 h. (c) The relative mRNA levels of M1 and M2 markers in the peritoneal macrophages isolated fromWTmice and Lysm HIF1α lsl mice for 24 h. (d) The relative mRNA levels of M1 and M2 markers in the BMDMs isolated from the WT mice andLysm HIF1α lsl mice with the treatment of LPS for 48 h. For each gene, mRNA level was normalized to the level of 18S rRNA expression.Statistical comparisons were made using two-tailed Student’s t-test (a, b, c, and d). ∗P < 0 05 and ∗∗P < 0 01, compared with WT mice. Allvalues were presented as mean± SEM for n = 3–5 independent experiments in each group.
3Mediators of Inflammation
HIF1α overexpression macrophages (Figure 2(c)). Thesedata indicate that decreased mitochondrial oxidation andincreased glycolysis metabolism are induced by HIF1αin macrophages.
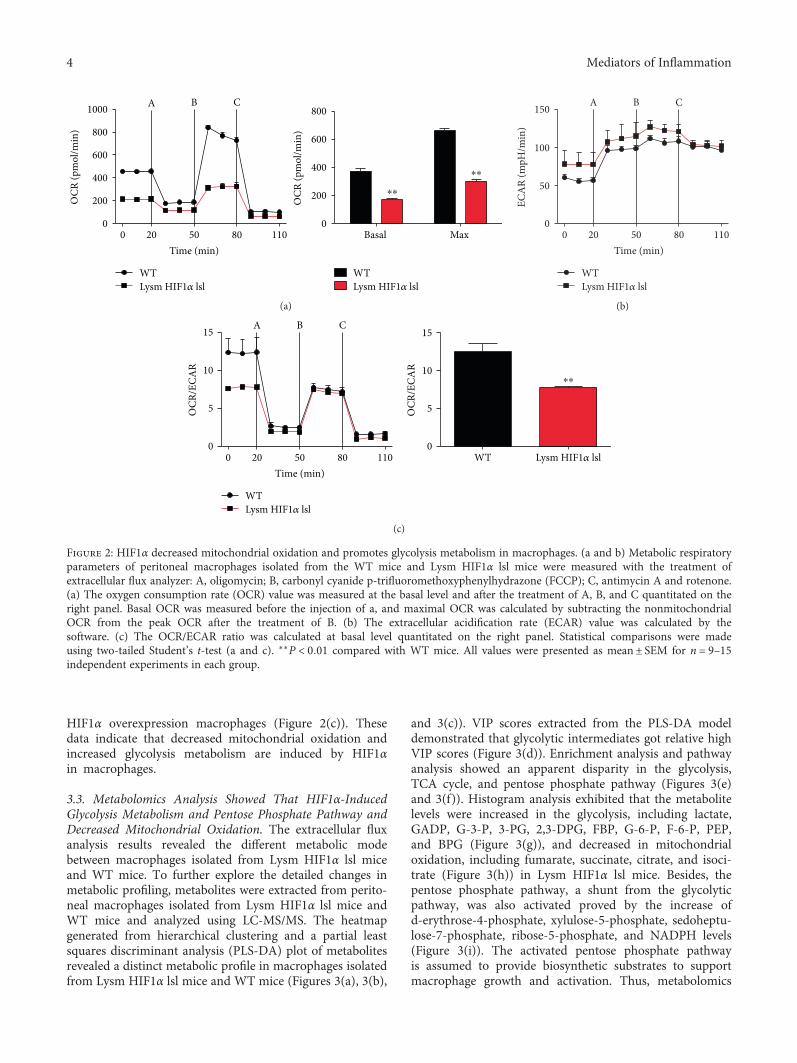
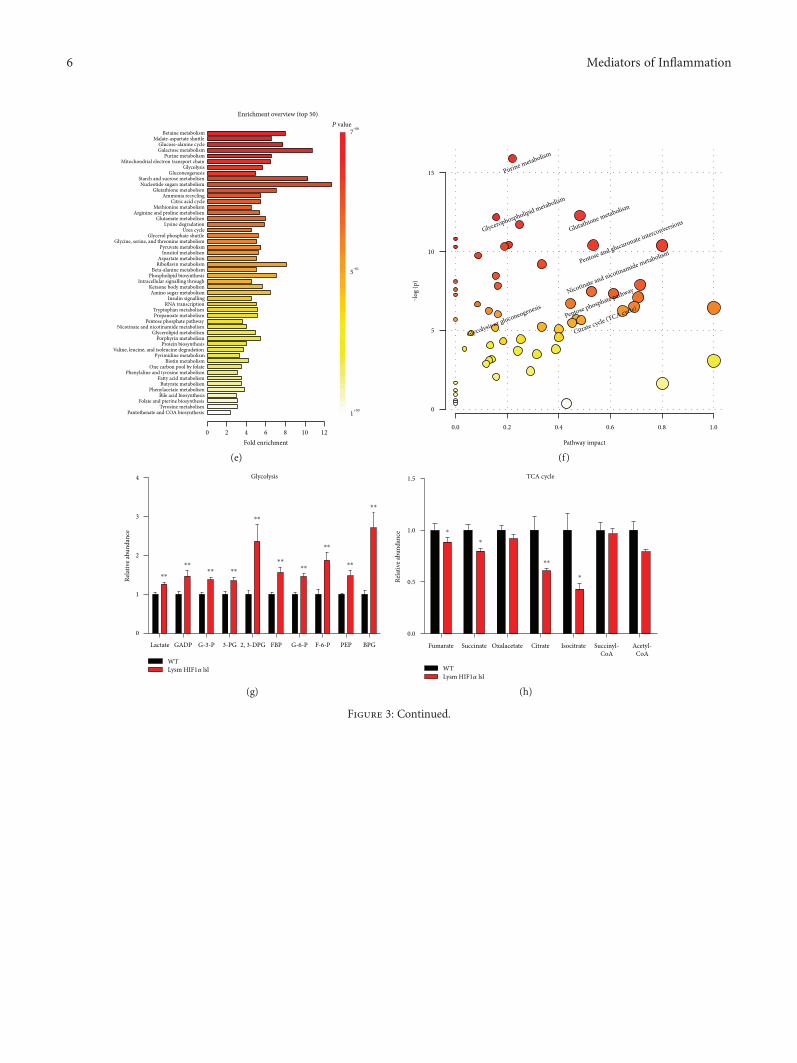
3.3. Metabolomics Analysis Showed That HIF1α-InducedGlycolysis Metabolism and Pentose Phosphate Pathway andDecreased Mitochondrial Oxidation. The extracellular fluxanalysis results revealed the different metabolic modebetween macrophages isolated from Lysm HIF1α lsl miceand WT mice. To further explore the detailed changes inmetabolic profiling, metabolites were extracted from perito-neal macrophages isolated from Lysm HIF1α lsl mice andWT mice and analyzed using LC-MS/MS. The heatmapgenerated from hierarchical clustering and a partial leastsquares discriminant analysis (PLS-DA) plot of metabolitesrevealed a distinct metabolic profile in macrophages isolatedfrom Lysm HIF1α lsl mice and WT mice (Figures 3(a), 3(b),
and 3(c)). VIP scores extracted from the PLS-DA modeldemonstrated that glycolytic intermediates got relative highVIP scores (Figure 3(d)). Enrichment analysis and pathwayanalysis showed an apparent disparity in the glycolysis,TCA cycle, and pentose phosphate pathway (Figures 3(e)and 3(f)). Histogram analysis exhibited that the metabolitelevels were increased in the glycolysis, including lactate,GADP, G-3-P, 3-PG, 2,3-DPG, FBP, G-6-P, F-6-P, PEP,and BPG (Figure 3(g)), and decreased in mitochondrialoxidation, including fumarate, succinate, citrate, and isoci-trate (Figure 3(h)) in Lysm HIF1α lsl mice. Besides, thepentose phosphate pathway, a shunt from the glycolyticpathway, was also activated proved by the increase ofd-erythrose-4-phosphate, xylulose-5-phosphate, sedoheptu-lose-7-phosphate, ribose-5-phosphate, and NADPH levels(Figure 3(i)). The activated pentose phosphate pathwayis assumed to provide biosynthetic substrates to supportmacrophage growth and activation. Thus, metabolomics
0 20 50 80 1100
200
400
600
800
1000
WTLysm HIF1�훼 lsl
A B C
Time (min)
OCR
(pm
ol/m
in)
Basal Max 0
200
400
600
800
WTLysm HIF1�훼 lsl
⁎⁎
⁎⁎
OCR
(pm
ol/m
in)
(a)
0 20 50 80 1100
50
100
150 A B C
ECA
R (m
pH/m
in)
WTLysm HIF1�훼 lsl
Time (min)
(b)
Lysm HIF1�훼 lsl
⁎⁎
0
5
10
15 A B C
OCR
/ECA
R
WT0
5
10
15
OCR
/ECA
R
0 20 50 80 110
WTLysm HIF1�훼 lsl
Time (min)
(c)
Figure 2: HIF1α decreased mitochondrial oxidation and promotes glycolysis metabolism in macrophages. (a and b) Metabolic respiratoryparameters of peritoneal macrophages isolated from the WT mice and Lysm HIF1α lsl mice were measured with the treatment ofextracellular flux analyzer: A, oligomycin; B, carbonyl cyanide p-trifluoromethoxyphenylhydrazone (FCCP); C, antimycin A and rotenone.(a) The oxygen consumption rate (OCR) value was measured at the basal level and after the treatment of A, B, and C quantitated on theright panel. Basal OCR was measured before the injection of a, and maximal OCR was calculated by subtracting the nonmitochondrialOCR from the peak OCR after the treatment of B. (b) The extracellular acidification rate (ECAR) value was calculated by thesoftware. (c) The OCR/ECAR ratio was calculated at basal level quantitated on the right panel. Statistical comparisons were madeusing two-tailed Student’s t-test (a and c). ∗∗P < 0 01 compared with WT mice. All values were presented as mean± SEM for n = 9–15independent experiments in each group.
4 Mediators of Inflammation
Class
Con
trol-7
Con
trol-6
Con
trol-4
Con
trol-8
Con
trol-5
Con
trol-1
0
Con
trol-1
2C
ontro
l-9
Con
trol-1
1C
ontro
l-2C
ontro
l-1C
ontro
l-3LS
L-7
LSL-
6LS
L-5
LSL-
10LS
L-9
LSL-
11LS
L-8
LSL-
14LS
L-13
LSL-
15LS
L-12
LSL-
3LS
L-2
LSL-
1LS
L-4
ClassControlLSL
3
2
1
0
‒1
‒2
‒3
DeoxyadenosineGlycerophosphocholGlucosamine 6-phosN-AcetylgalactosamCreatineD-Glucose 6-phosphD-Fructose 1-phospFolateShikimateOxidized glutathio5′-Methylthioadeno2-Aminooctanoic acCarbamoylphosphateDeoxyadenosine monLactose 6-phosphatRibonolactoneCytosine3′-AMPNADPHCytidine monophospGuanosine monophosADPDeoxyinosineADP-glucoseUDP-glucoseNADHFADCitrullineValineHomocysteineAspartateGuanosineL-methionineGluconolactoneNg,NG-dimethyl-L-aAllantoinDimethylglycineGlycinePhenyllactic acidXanthurenic acidAcetylphosphatePhosphorylcholinep-Aminobenzoic aciAdenineHypoxanthineN6-Acetyl-L-lysineHydroxyphenylacetiBetaineXanthine13C-Glutamine
(a)
+
+
+
++
++
++++
+++
+
+LSL-8
ControlLSL
Score plot
10
15
5
0
‒5
‒10
‒15
‒20 ‒15 ‒10 ‒5 0 5 10
Component 1 (26.9%)C
ompo
nent
2 (1
7%)
LSL-5LSL-9LSL-12
LSL-6LSL-15LSL-11LSL-13LSL-10LSL-7LSL-14
LSL-4LSL-2
LSL-1LSL-3
Control-5Control-8
Control-6
Control-11Control-9Control-12
Control-10
Control-7Control-1
Control-4Control-2
Control-3
(b)
ControlLSL
Component 3 (11.6%)Component 1 (26.9%)
Com
pone
nt 2
(17%
)
30
25
20
15
10
5
0
‒5
‒10
‒15‒15 ‒10 ‒5 0 5 10 15 20 25 30
‒5 0 5 10 15 20 25 30 35 40
(c)
ControlLSL
Gluconolactone
NADPH
Valine
Deoxyadenosine
NADH
UDP-glucose
Lactose 6-phos
2-Aminooctanoi
Deoxyinosine
Xanthurenic ac
Cytidine monop
Homocysteine
Phenyllactic a
ADP
D-Glucose 6-ph
1.75 1.80 1.85 1.90 1.95 2.00
VIP scores
High
Low
(d)
Figure 3: Continued.
5Mediators of Inflammation
Enrichment overview (top 50)
Betaine metabolism
Pantothenate and COA biosynthesisTyrosine metabolism
Folate and pterine biosynthesisBile acid biosynthesis
Phenylacetate metabolismButyrate metabolism
Fatty acid metabolismPhenylaline and tyrosine metabolism
One carbon pool by folateBiotin metabolism
Pyrimidine metabolismValine, leucine, and isoleucine degradation
Protein biosynthesisPorphyrin metabolism
Glycerolipid metabolismNicotinate and nicotinamide metabolism
Pentose phosphate pathwayPropanoate metabolismTryptophan metabolism
RNA transcriptionInsulin signalling
Amino sugar metabolismKetaone body metabolism
Intracellular signalling throughPhospholipid biosynthesis
Beta-alanine metabolismRiboflavin metabolismAspartate metabolism
Inositol metabolismPyruvate metabolism
Glycine, serine, and threonine metabolismGlycerol phosphate shuttle
Urea cycleLysine degradation
Glutamate metabolismArginine and proline metabolism
Methionine metabolismCitric acid cycle
Ammonia recyclingGlutathione metabolism
Nucleotide sugars metabolismStarch and sucrose metabolism
GluconeogenesisGlycolysis
Mitochondrial electron transport chainPurine metabolism
Galactose metabolismGlucose-alanine cycle
Malate-aspartate shuttle
40 2 6 8 10 12Fold enrichment
P value7‒08
5‒01
1+00
(e)
15
10
5
0
0.0 0.2 0.4 0.6 0.8 1.0
Pathway impact
‒log
(p)
Purine metabolism
Glycerophospholipid metabolism
Glutathione metabolism
Pentose and glucuronate interconversions
Nicotinate and nicotinamide metabolism
Glycolysis or gluconeogenesisPentose phosphate pathway
Citrate cycle (TCA cycle)
(f)
Lactate GADP G-3-P 3-PG 2, 3-DPG FBP G-6-P F-6-P PEP BPG
0
1
2
3
4
WTLysm HIF1�훼 lsl
⁎⁎
⁎⁎⁎⁎ ⁎⁎
⁎⁎
⁎⁎⁎⁎
⁎⁎
⁎⁎
⁎⁎
Glycolysis
Rela
tive a
bund
ance
(g)
Fumarate Succinate Oxalacetate Citrate Isocitrate Succinyl-CoA
Acetyl-CoA
0.0
0.5
1.0
1.5
WTLysm HIF1�훼 lsl
TCA cycle
⁎
⁎
⁎⁎
⁎
Rela
tive a
bund
ance
(h)
Figure 3: Continued.
6 Mediators of Inflammation
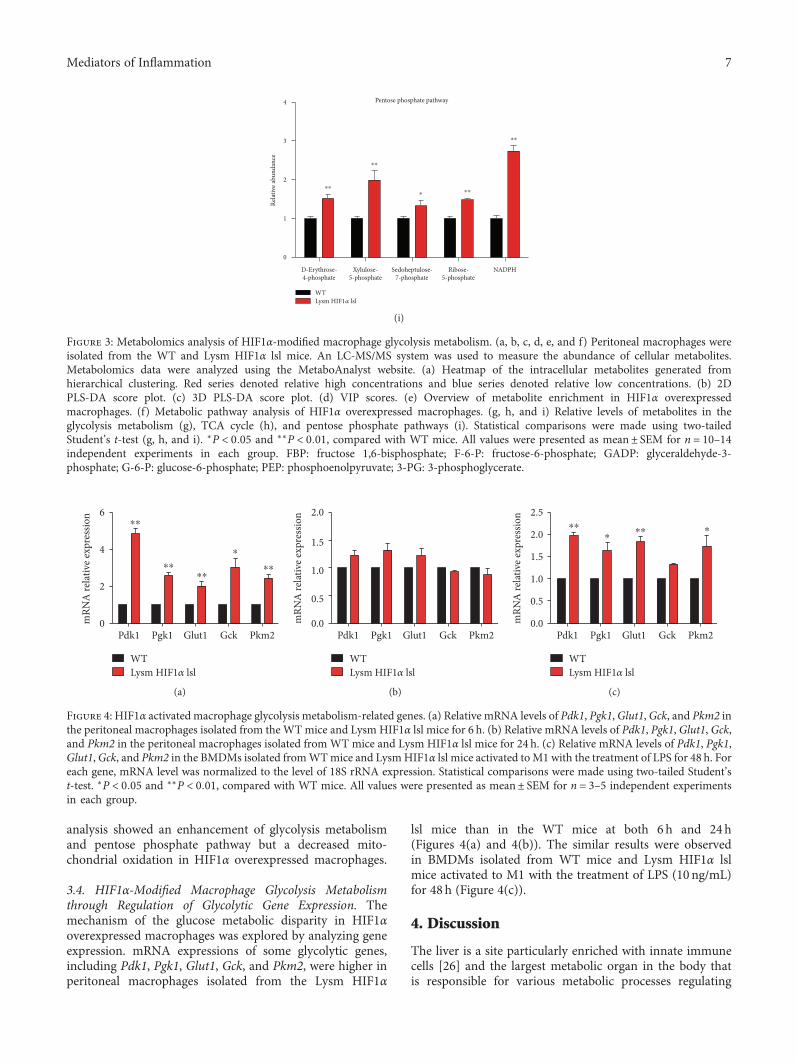
analysis showed an enhancement of glycolysis metabolismand pentose phosphate pathway but a decreased mito-chondrial oxidation in HIF1α overexpressed macrophages.
3.4. HIF1α-Modified Macrophage Glycolysis Metabolismthrough Regulation of Glycolytic Gene Expression. Themechanism of the glucose metabolic disparity in HIF1αoverexpressed macrophages was explored by analyzing geneexpression. mRNA expressions of some glycolytic genes,including Pdk1, Pgk1, Glut1, Gck, and Pkm2, were higher inperitoneal macrophages isolated from the Lysm HIF1α
lsl mice than in the WT mice at both 6 h and 24h(Figures 4(a) and 4(b)). The similar results were observedin BMDMs isolated from WT mice and Lysm HIF1α lslmice activated to M1 with the treatment of LPS (10 ng/mL)for 48 h (Figure 4(c)).
4. Discussion
The liver is a site particularly enriched with innate immunecells [26] and the largest metabolic organ in the body thatis responsible for various metabolic processes regulating
D-Erythrose-4-phosphate
Xylulose-5-phosphate
Sedoheptulose-7-phosphate
Ribose-5-phosphate
NADPH
0
1
2
3
4
WTLysm HIF1�훼 lsl
⁎⁎
⁎⁎
⁎⁎
⁎⁎
⁎
Pentose phosphate pathway
Rela
tive a
bund
ance
(i)
Figure 3: Metabolomics analysis of HIF1α-modified macrophage glycolysis metabolism. (a, b, c, d, e, and f) Peritoneal macrophages wereisolated from the WT and Lysm HIF1α lsl mice. An LC-MS/MS system was used to measure the abundance of cellular metabolites.Metabolomics data were analyzed using the MetaboAnalyst website. (a) Heatmap of the intracellular metabolites generated fromhierarchical clustering. Red series denoted relative high concentrations and blue series denoted relative low concentrations. (b) 2DPLS-DA score plot. (c) 3D PLS-DA score plot. (d) VIP scores. (e) Overview of metabolite enrichment in HIF1α overexpressedmacrophages. (f) Metabolic pathway analysis of HIF1α overexpressed macrophages. (g, h, and i) Relative levels of metabolites in theglycolysis metabolism (g), TCA cycle (h), and pentose phosphate pathways (i). Statistical comparisons were made using two-tailedStudent’s t-test (g, h, and i). ∗P < 0 05 and ∗∗P < 0 01, compared with WT mice. All values were presented as mean± SEM for n = 10–14independent experiments in each group. FBP: fructose 1,6-bisphosphate; F-6-P: fructose-6-phosphate; GADP: glyceraldehyde-3-phosphate; G-6-P: glucose-6-phosphate; PEP: phosphoenolpyruvate; 3-PG: 3-phosphoglycerate.
Pdk1 Pgk1 Glut1 Gck Pkm20
2
4
6
WTLysm HIF1�훼 lsl
⁎⁎
⁎⁎⁎⁎
⁎
⁎⁎
mRN
A re
lativ
e exp
ress
ion
(a)
WTLysm HIF1�훼 lsl
Pdk1 Pgk1 Glut1 Gck Pkm20.0
0.5
1.0
1.5
2.0
mRN
A re
lativ
e exp
ress
ion
(b)
WTLysm HIF1�훼 lsl
⁎⁎⁎
⁎⁎ ⁎
Pdk1 Pgk1 Glut1 Gck Pkm20.0
0.5
1.0
1.5
2.0
2.5m
RNA
relat
ive e
xpre
ssio
n
(c)
Figure 4: HIF1α activated macrophage glycolysis metabolism-related genes. (a) Relative mRNA levels of Pdk1, Pgk1, Glut1, Gck, and Pkm2 inthe peritoneal macrophages isolated from the WTmice and Lysm HIF1α lsl mice for 6 h. (b) Relative mRNA levels of Pdk1, Pgk1, Glut1, Gck,and Pkm2 in the peritoneal macrophages isolated fromWT mice and Lysm HIF1α lsl mice for 24 h. (c) Relative mRNA levels of Pdk1, Pgk1,Glut1,Gck, and Pkm2 in the BMDMs isolated fromWTmice and LysmHIF1α lsl mice activated toM1 with the treatment of LPS for 48 h. Foreach gene, mRNA level was normalized to the level of 18S rRNA expression. Statistical comparisons were made using two-tailed Student’st-test. ∗P < 0 05 and ∗∗P < 0 01, compared with WT mice. All values were presented as mean± SEM for n = 3–5 independent experimentsin each group.
7Mediators of Inflammation
various functions [27, 28]. Innate immune cells modify anddisrupt critical processes implicated in metabolic disease.Meanwhile, metabolic stress initiates a feed-forward cycleof inflammatory responses [29]. Given that HIF1α is ametabolic regulator playing important roles in inflammation[30, 31], we investigated whether the regulation of cellularmetabolism by HIF1α controls macrophage polarizationand inflammation.
Our study first used HIF1α overexpression mice tovalidate the previous report that HIF1α promoted theaccumulation of M1 macrophages [32–34]. Gene expres-sion profiling of macrophages revealed an increase inmarkers of M1 macrophages and decreased or unchangedexpression of M2 macrophage markers (Figure 1), sup-porting that HIF1 triggers macrophage polarizing to theM1 phenotype.
Recent findings suggest that cellular metabolism plays animportant role during macrophage polarization [23, 35].Classically activated macrophages secret proinflammatorymediators, accompanied with a shift from mitochondrialoxidation toward glycolysis metabolism [36]. On the con-trast, alternatively activated macrophages secrete anti-inflammatory cytokines and declare an increased demandof fatty-acid oxidation [37]. Consistent with these findings,we showed that HIF1α overexpressed macrophages reducedcellular OCR and increased ECAR (Figure 2). The OCR/ECAR ratio was also dramatically decreased, reflecting apreference of glycolysis metabolism compared with mito-chondrial oxidation in HIF1α overexpressed macrophages.
Macrophages are capable of coordinating their metabolicprograms to adjust their immunological and bioenergeticfunctional properties. In our study, metabolomics profilinganalysis witnessed a splendid disparation of metabolitesfrom peritoneal macrophages isolated from WT mice andLysm HIF1α lsl mice (Figure 3). Relative concentrationof metabolites further demonstrated that HIF1 inducedactivation of glycolysis metabolism and pentose phosphatepathway and inhibited mitochondrial oxidation in macro-phages in Lysm HIF1α lsl mice (Figure 3). Pentose phos-phate pathway utilizes glucose to generate NADPH fornucleotide biosynthesis, supporting the production ofreduced glutathione and therefore limits oxidative stressin M1 macrophages [38, 39]. Increased levels of pentosephosphate pathway metabolic intermediates satisfy thesubstrates need in HIF1α-prompted macrophage growthand proliferation. These data are consistent with previousstudies [23, 24, 37] and lend further support to the notionthat glycolysis metabolism is essential to the activation ofinflammatory macrophages.
LPS-treated BMDMs were reported to tend to engagean HIF1α-dependent transcriptional program that isresponsible for heightened glycolysis [40]. Metabolicmechanisms in HIF1α-deficient mice were reported to beaccompanied with abolished glycolysis, decreased hepaticglucose output, and elevated gluconeogenesis [41]. Onthe contrast, in our study, HIF1α overexpression in themacrophages was accompanied with high mRNA levelsof Pdk1, Pgk1, Glut1, Gck, and Pkm2 (Figure 4), whichwas responsible for activated glycolysis. Heightened
glycolysis may guarantee a competitive bioenergetic stateand intensive energy for M1 macrophage polarizationand also provide precursors for the production and secre-tion of proinflammatory cytokines [39, 42]. This processindicates the role of HIF1α in potential coordinationbetween metabolic regulation and macrophage physiology.
5. Conclusions
In summary, we demonstrated that HIF1α activation ele-vates glycolysis metabolism and further induces M1 polari-zation of macrophages.
Conflicts of Interest
The authors declare there are no conflicts of interest.
Authors’ Contributions
TingWang and Huiying Liu contributed equally to this work.
Acknowledgments
This work was supported by the National Natural ScienceFoundation of China (nos. 81470554 and 81522007 toChangtao Jiang and 91439206 and 31230035 to Xian Wang)and the National Key Research and Development Program ofChina (2016YFC0903100).
References
[1] C. Cursiefen, L. Chen, L. P. Borges et al., “VEGF-A stimu-lates lymphangiogenesis and hemangiogenesis in inflamma-tory neovascularization via macrophage recruitment,” TheJournal of Clinical Investigation, vol. 113, no. 7, pp. 1040–1050, 2004.
[2] A. Mantovani, S. Sozzani, M. Locati, P. Allavena, andA. Sica, “Macrophage polarization: tumor-associated mac-rophages as a paradigm for polarized M2 mononuclearphagocytes,” Trends in Immunology, vol. 23, no. 11, pp. 549–555, 2002.
[3] K. J. Moore, F. J. Sheedy, and E. A. Fisher, “Macrophages inatherosclerosis: a dynamic balance,” Nature Reviews Immu-nology, vol. 13, no. 10, pp. 709–721, 2013.
[4] R. W. Kinne, R. Brauer, B. Stuhlmuller, E. Palombo-Kinne,and G. R. Burmester, “Macrophages in rheumatoid arthritis,”Arthritis Research, vol. 2, no. 3, pp. 189–202, 2000.
[5] E. Careau and E. Y. Bissonnette, “Adoptive transfer ofalveolar macrophages abrogates bronchial hyperresponsive-ness,” American Journal of Respiratory Cell and MolecularBiology, vol. 31, no. 1, pp. 22–27, 2004.
[6] E. M. Palsson-McDermott, A. M. Curtis, G. Goel et al.,“Pyruvate kinase M2 regulates Hif-1α activity and IL-1βinduction and is a critical determinant of the Warburg effectin LPS-activated macrophages,” Cell Metabolism, vol. 21,no. 1, pp. 65–80, 2015.
[7] A. Sica and V. Bronte, “Altered macrophage differentiationand immune dysfunction in tumor development,” The Journalof Clinical Investigation, vol. 117, no. 5, pp. 1155–1166, 2007.
[8] A. L. Doedens, C. Stockmann, M. P. Rubinstein et al.,“Macrophage expression of hypoxia-inducible factor-1α
8 Mediators of Inflammation
suppresses T-cell function and promotes tumor progression,”Cancer Research, vol. 70, no. 19, pp. 7465–7475, 2010.
[9] A. L. Pauleau, R. Rutschman, R. Lang, A. Pernis, S. S.Watowich, and P. J. Murray, “Enhancer-mediated control ofmacrophage-specific arginase I expression,” Journal of Immu-nology, vol. 172, no. 12, pp. 7565–7573, 2004.
[10] Z. Tan, N. Xie, H. Cui et al., “Pyruvate dehydrogenase kinase1 participates in macrophage polarization via regulating glu-cose metabolism,” Journal of Immunology, vol. 194, no. 12,pp. 6082–6089, 2015.
[11] R. K. Bruick and S. L. McKnight, “A conserved family ofprolyl-4-hydroxylases that modify HIF,” Science, vol. 294,no. 5545, pp. 1337–1340, 2001.
[12] C. Murdoch, A. Giannoudis, and C. E. Lewis, “Mechanismsregulating the recruitment of macrophages into hypoxic areasof tumors and other ischemic tissues,” Blood, vol. 104, no. 8,pp. 2224–2234, 2004.
[13] G. M. Tannahill, A. M. Curtis, J. Adamik et al., “Succinate is aninflammatory signal that induces IL-1β through HIF-1α,”Nature, vol. 496, no. 7444, pp. 238–242, 2013.
[14] P. M. Gubser, G. R. Bantug, L. Razik et al., “Rapid effectorfunction of memory CD8+ T cells requires an immediate-early glycolytic switch,” Nature Immunology, vol. 14, no. 10,pp. 1064–1072, 2013.
[15] G. L. Wang, B. H. Jiang, E. A. Rue, and G. L. Semenza,“Hypoxia-inducible factor 1 is a basic-helix-loop-helix-PASheterodimer regulated by cellular O2 tension,” Proceedingsof the National Academy of Sciences of the United States ofAmerica, vol. 92, no. 12, pp. 5510–5514, 1995.
[16] T. Cramer, Y. Yamanishi, B. E. Clausen et al., “HIF-1αis essential for myeloid cell-mediated inflammation,” Cell,vol. 112, no. 5, pp. 645–657, 2003.
[17] W. G. Kaelin Jr. and P. J. Ratcliffe, “Oxygen sensing bymetazoans: the central role of the HIF hydroxylase pathway,”Molecular Cell, vol. 30, no. 4, pp. 393–402, 2008.
[18] Q. He, Z. Gao, J. Yin, J. Zhang, Z. Yun, and J. Ye, “Regulationof HIF-1α activity in adipose tissue by obesity-associatedfactors: adipogenesis, insulin, and hypoxia,” American Journalof Physiology. Endocrinology and Metabolism, vol. 300, no. 5,pp. E877–E885, 2011.
[19] A. Weidemann and R. S. Johnson, “Biology of HIF-1α,”Cell Death and Differentiation, vol. 15, no. 4, pp. 621–627, 2008.
[20] V. Nizet and R. S. Johnson, “Interdependence of hypoxicand innate immune responses,” Nature Reviews Immunology,vol. 9, no. 9, pp. 609–617, 2009.
[21] J. S. Lewis, J. A. Lee, J. C. Underwood, A. L. Harris, and C. E.Lewis, “Macrophage responses to hypoxia: relevance to diseasemechanisms,” Journal of Leukocyte Biology, vol. 66, no. 6,pp. 889–900, 1999.
[22] K. Y. Lee, S. Gesta, J. Boucher, X. L. Wang, and C. R. Kahn,“The differential role of Hif1β/Arnt and the hypoxic responsein adipose function, fibrosis, and inflammation,” Cell Metabo-lism, vol. 14, no. 4, pp. 491–503, 2011.
[23] B. Kelly and L. A. O'Neill, “Metabolic reprogramming inmacrophages and dendritic cells in innate immunity,” CellResearch, vol. 25, no. 7, pp. 771–784, 2015.
[24] L. A. O'Neill and E. J. Pearce, “Immunometabolism governsdendritic cell and macrophage function,” The Journal ofExperimental Medicine, vol. 213, no. 1, pp. 15–23, 2016.
[25] X. Xue, S. Ramakrishnan, E. Anderson et al., “Endothelial PASdomain protein 1 activates the inflammatory response in theintestinal epithelium to promote colitis in mice,” Gastroenter-ology, vol. 145, no. 4, pp. 831–841, 2013.
[26] S. Seki, Y. Habu, T. Kawamura et al., “The liver as a crucialorgan in the first line of host defense: the roles of Kupffercells, natural killer (NK) cells and NK1.1 Ag+ T cells inT helper 1 immune responses,” Immunological Reviews,vol. 174, pp. 35–46, 2000.
[27] F. Tacke and H. W. Zimmermann, “Macrophage heterogene-ity in liver injury and fibrosis,” Journal of Hepatology, vol. 60,no. 5, pp. 1090–1096, 2014.
[28] C. A. Toth and P. Thomas, “Liver endocytosis and Kupffercells,” Hepatology, vol. 16, no. 1, pp. 255–266, 1992.
[29] S. Gordon and F. O. Martinez, “Alternative activation ofmacrophages: mechanism and functions,” Immunity, vol. 32,no. 5, pp. 593–604, 2010.
[30] W. Zhang, J. M. Petrovic, D. Callaghan et al., “Evidencethat hypoxia-inducible factor-1 (HIF-1) mediates transcrip-tional activation of interleukin-1β (IL-1β) in astrocyte cul-tures,” Journal of Neuroimmunology, vol. 174, no. 1-2,pp. 63–73, 2006.
[31] W. Ertel, M. H. Morrison, A. Ayala, and I. H. Chaudry,“Hypoxemia in the absence of blood loss or significanthypotension causes inflammatory cytokine release,” TheAmerican Journal of Physiology, vol. 269, no. 1, Part 2,pp. R160–R166, 1995.
[32] N. Takeda, E. L. O'Dea, A. Doedens et al., “Differentialactivation and antagonistic function of HIF-α isoforms inmacrophages are essential for NO homeostasis,” Genes &Development, vol. 24, no. 5, pp. 491–501, 2010.
[33] K. Nishi, T. Oda, S. Takabuchi et al., “LPS induces hypoxia-inducible factor 1 activation in macrophage-differentiatedcells in a reactive oxygen species-dependent manner,”Antioxidants & Redox Signaling, vol. 10, no. 5, pp. 983–995, 2008.
[34] A. Tawakol, P. Singh, M. Mojena et al., “HIF-1α and PFKFB3mediate a tight relationship between proinflammatory activa-tion and anerobic metabolism in atherosclerotic macro-phages,” Arteriosclerosis, Thrombosis, and Vascular Biology,vol. 35, no. 6, pp. 1463–1471, 2015.
[35] J. M. Olefsky and C. K. Glass, “Macrophages, inflammation,and insulin resistance,” Annual Review of Physiology, vol. 72,pp. 219–246, 2010.
[36] H. J. Wang, Y. J. Hsieh, W. C. Cheng et al., “JMJD5 regu-lates PKM2 nuclear translocation and reprograms HIF-1α-mediated glucose metabolism,” Proceedings of the NationalAcademy of Sciences of the United States of America, vol. 111,no. 1, p. 284, 2014.
[37] A. Chawla, K. D. Nguyen, and Y. P. Goh, “Macrophage-mediated inflammation in metabolic disease,” Nature ReviewsImmunology, vol. 11, no. 11, pp. 738–749, 2011.
[38] A. Haschemi, P. Kosma, L. Gille et al., “The sedoheptulosekinase CARKL directs macrophage polarization throughcontrol of glucose metabolism,” Cell Metabolism, vol. 15,no. 6, pp. 813–826, 2012.
[39] L. Liu, Y. Lu, J. Martinez et al., “Proinflammatory signalsuppresses proliferation and shifts macrophage metabolismfrom Myc-dependent to HIF1α-dependent,” Proceedings ofthe National Academy of Sciences of the United States ofAmerica, vol. 113, no. 6, pp. 1564–1569, 2016.
9Mediators of Inflammation

[40] M. K. Shin, L. F. Drager, Q. Yao et al., “Metabolic conse-quences of high-fat diet are attenuated by suppression ofHIF-1α,” PLoS One, vol. 7, no. 10, article e46562, 2012.
[41] S. Galvan-Pena and L. A. O'Neill, “Metabolic reprogramingin macrophage polarization,” Frontiers in Immunology, vol. 5,p. 420, 2014.
[42] A. J. Freemerman, A. R. Johnson, G. N. Sacks et al., “Metabolicreprogramming of macrophages: glucose transporter 1(GLUT1)-mediated glucose metabolism drives a proinflam-matory phenotype,” The Journal of Biological Chemistry,vol. 289, no. 11, pp. 7884–7896, 2014.
10 Mediators of Inflammation

Submit your manuscripts athttps://www.hindawi.com
Stem CellsInternational
Hindawi Publishing Corporationhttp://www.hindawi.com Volume 2014
Hindawi Publishing Corporationhttp://www.hindawi.com Volume 2014
MEDIATORSINFLAMMATION
of
Hindawi Publishing Corporationhttp://www.hindawi.com Volume 2014
Behavioural Neurology
EndocrinologyInternational Journal of
Hindawi Publishing Corporationhttp://www.hindawi.com Volume 2014
Hindawi Publishing Corporationhttp://www.hindawi.com Volume 2014
Disease Markers
Hindawi Publishing Corporationhttp://www.hindawi.com Volume 2014
BioMed Research International
OncologyJournal of
Hindawi Publishing Corporationhttp://www.hindawi.com Volume 2014
Hindawi Publishing Corporationhttp://www.hindawi.com Volume 2014
Oxidative Medicine and Cellular Longevity
Hindawi Publishing Corporationhttp://www.hindawi.com Volume 2014
PPAR Research
The Scientific World JournalHindawi Publishing Corporation http://www.hindawi.com Volume 2014
Immunology ResearchHindawi Publishing Corporationhttp://www.hindawi.com Volume 2014
Journal of
ObesityJournal of
Hindawi Publishing Corporationhttp://www.hindawi.com Volume 2014
Hindawi Publishing Corporationhttp://www.hindawi.com Volume 2014
Computational and Mathematical Methods in Medicine
OphthalmologyJournal of
Hindawi Publishing Corporationhttp://www.hindawi.com Volume 2014
Diabetes ResearchJournal of
Hindawi Publishing Corporationhttp://www.hindawi.com Volume 2014
Hindawi Publishing Corporationhttp://www.hindawi.com Volume 2014
Research and TreatmentAIDS
Hindawi Publishing Corporationhttp://www.hindawi.com Volume 2014
Gastroenterology Research and Practice
Hindawi Publishing Corporationhttp://www.hindawi.com Volume 2014
Parkinson’s Disease
Evidence-Based Complementary and Alternative Medicine
Volume 2014Hindawi Publishing Corporationhttp://www.hindawi.com