Reactive Reatime Big Data with Open Source Lambda Architecture - TechCampVN 2014
Upload
della-loganCategory
view
226download
1
i4M Lab1
ΕΛ/ΛΑΚ Μονάδες Αριστείας (ΜΑ. ΕΛΛΑΚ)eServices - Open Source Software in Transport & Shipping I
UAegean Center of Excellence (CoE) – Open Source Software in Transport and Shipping
University of the Aegean Dpt of Financial and Management Engineering & Dpt of Shipping and Transportation Services
Lecture: Intermodal transport: organization and fundamentals
Seraphim Kapros, Associate Professor
@ i-nformation M-anagement Lab
i4M Lab
i4M Lab
Seraphim Kapros
Intermodal transport: organization and fundamentals
Chios, 2014, May, 20th
i4M Lab
Definitions
Intermodality allows at least two different modes to be used in an integrated manner, in a door-to-door transport chain
Various legal/institutional references (Dir. 106/92, COM 243/97 etc)
Intermodal transport is based on the use of loading units (containers, swap bodies, semi-trailers)
Intermodality is a policy tool enabling a systems approach to transport
i4M Lab
Driving forces
Road transport dramatic increase, external cost, societal needs
Need to shift traffic from road to other modes
New policy approach: towards a –different- modal split/ modal shift policy ?
i4M Lab
Market segments
Several Intermodal market segments
Two large segments, with respect to loading unit type: Transport of swap bodies and semi-trailers Transport of maritime containers
i4M Lab
Market actors involved
Actors involved in the intermodal transport market:
The road transport companiesThe “Rail Family”: railway companies and their subsidiariesThe rail-road companies, members of UIRRThe “maritime family”: the emerging actors from maritime and harbour businessThe freight forwardersThe transport actors emerging from integrated industrial logistics supplyThe “inland waterways” familyThe “short sea shipping” family The "new" door-to-door intermodal transport services providers
i4M Lab
Policy discussions
Fair/unfair competition ?
Internalisation of external cost: political and methodological constraints
Factors of success, factors of failure of the European Transport Policy on Intermodality
Does intermodal transport match the users’ logistics requirements ?
i4M Lab
Overview of the existing situation in Europe
Incomplete knowledge of the field
Lack of appropriate statistics
Heterogeneity of units used (tones, TEUs, ITUs)
Structural-methodological problems of traditional data collection systems
i4M Lab
Overview of the existing situation in Europe
Intermodal transport share estimated at approximately 5% of the total continental freight traffic
However, global estimations might lead to biased conclusions, because:
i4M Lab
Overview of the existing situation in Europe
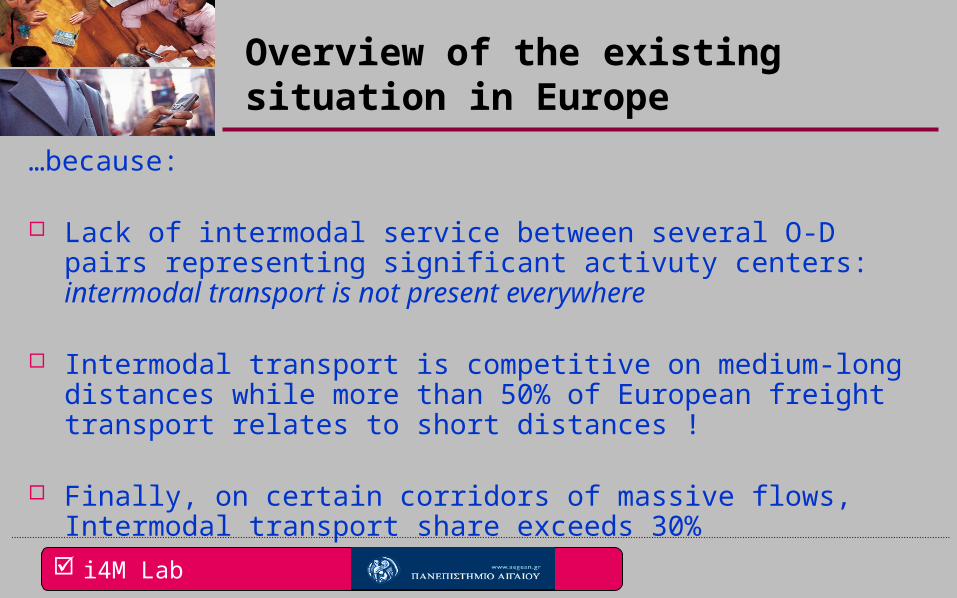
…because:
Lack of intermodal service between several O-D pairs representing significant activuty centers: intermodal transport is not present everywhere
Intermodal transport is competitive on medium-long distances while more than 50% of European freight transport relates to short distances !
Finally, on certain corridors of massive flows, Intermodal transport share exceeds 30%
i4M Lab
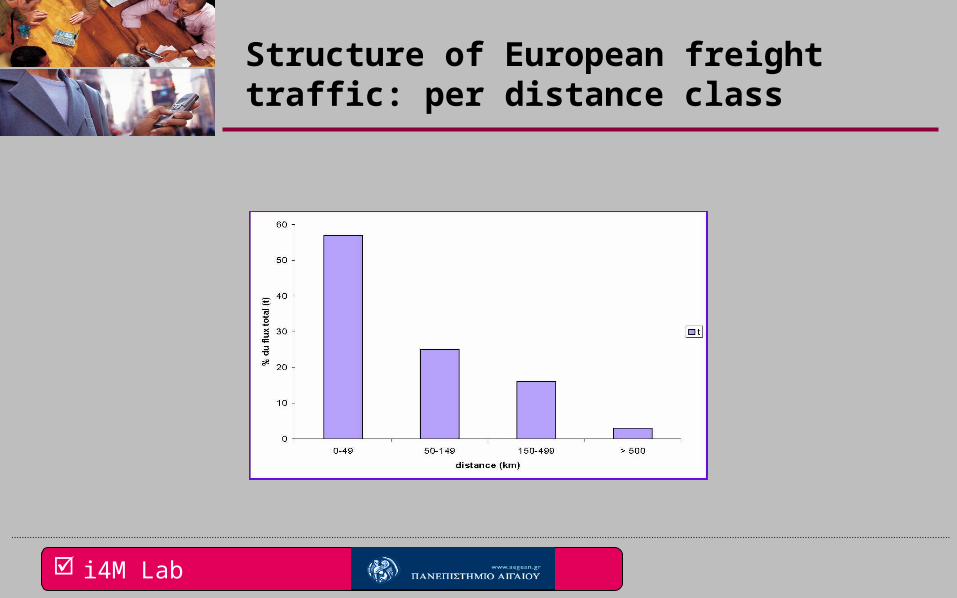
Structure of European freight traffic: per distance class
i4M Lab
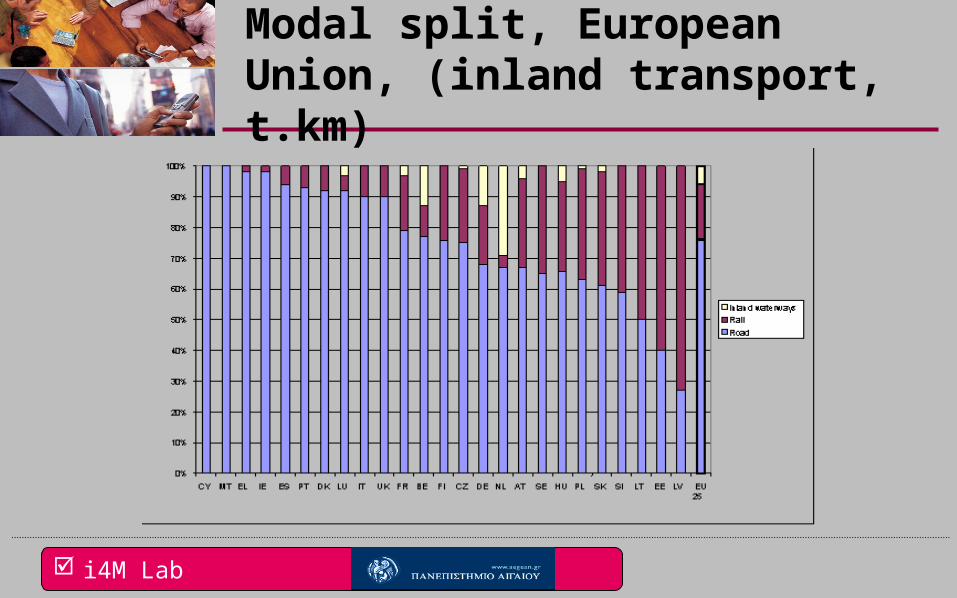
Modal split and modal shares
great variety at an international level (considering national statistics, which can cover even stronger differences between regions inside the same State)
Intercontinental comparisons show greater discrepancies
i4M Lab
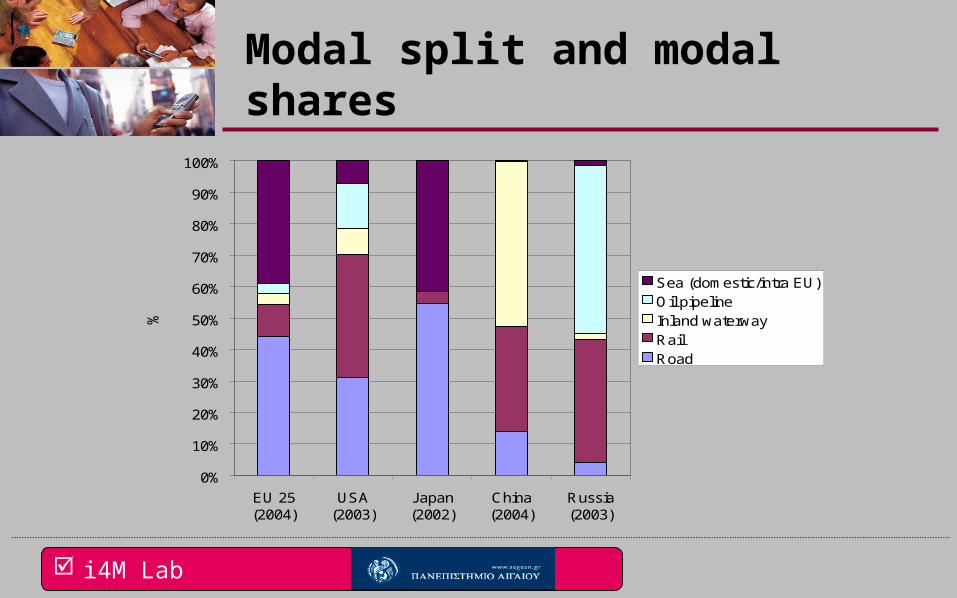
Modal split and modal shares
0%
10%
20%
30%
40%
50%
60%
70%
80%
90%
100%
EU 25(2004)
USA(2003)
Japan(2002)
China(2004)
Russia(2003)
%
Sea (domestic/intra EU)Oil pipelineInland waterwayRailRoad
i4M Lab
Modal split, European Union, (inland transport, t.km)
i4M Lab
Intermodal transport through the existing modal structure
This 5 % of total freight in Europe represents:
25 % of railway transport (t.km),
5 % of waterway transport,
10 % of maritime transport on the inland leg,
deriving from a large variety of regional situations:
i4M Lab
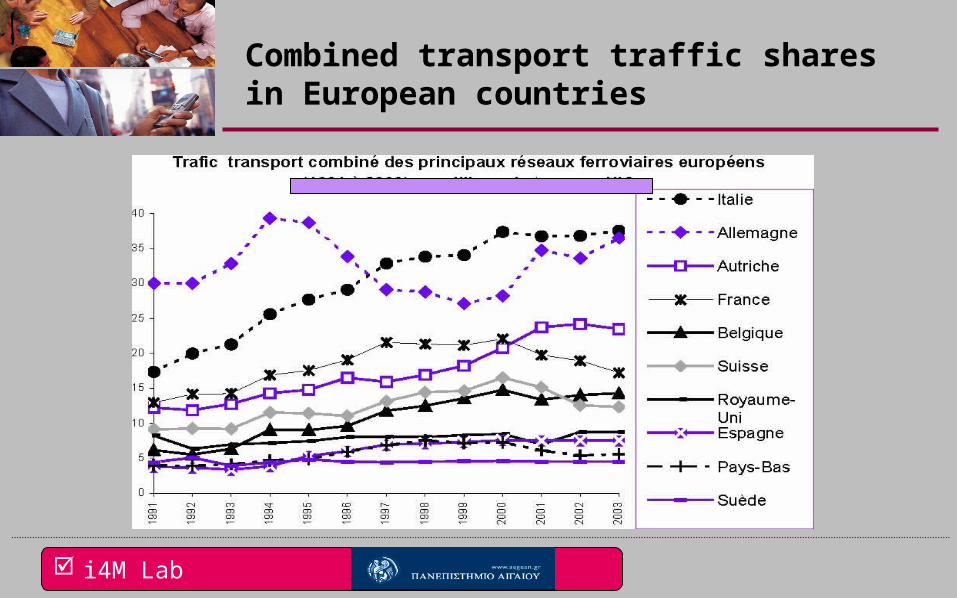
Combined transport traffic shares in European countries
i4M Lab
“Relevance” of intermodal transport
Therefore, freight organisation strongly depends on the context where it takes place and not on an universal, uniform mechanism
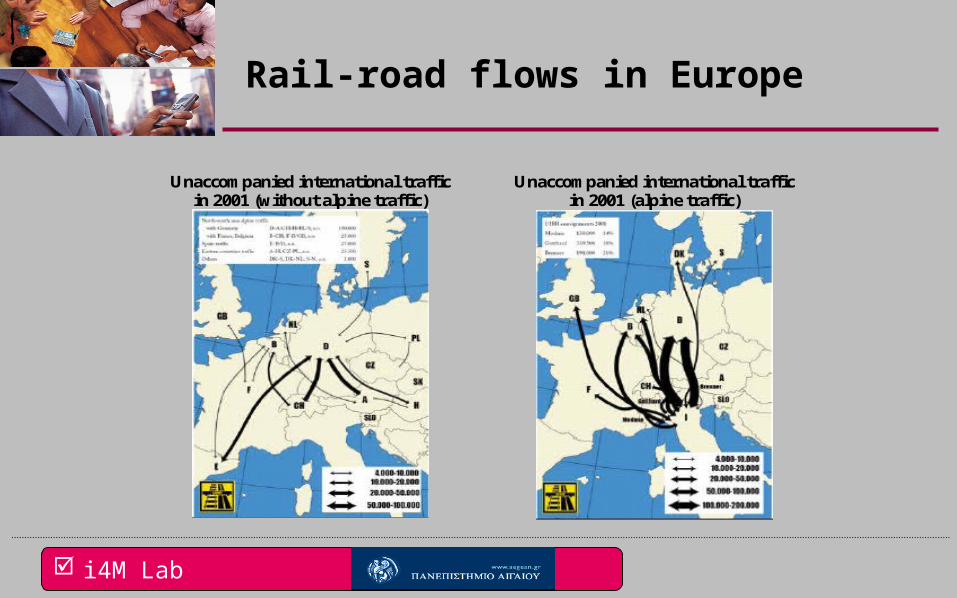
In this framework, Intermodal transport remains a market for "niches", mainly in Western Europe, concentrated on a few corridors, particularly across the Alps
i4M Lab
Rail-road flows in Europe
Unaccompanied international traffic in 2001 (without alpine traffic)
Unaccompanied international traffic in 2001 (alpine traffic)
i4M Lab
General trends
The visible growth during the 1990’s follows a period of stagnation, even of crisis
Why ?
i4M Lab
Decision-making process of users
A methodological approach: identify criteria and variables affecting decisions
Basic criteria:
Cost
and Quality
i4M Lab
Cost
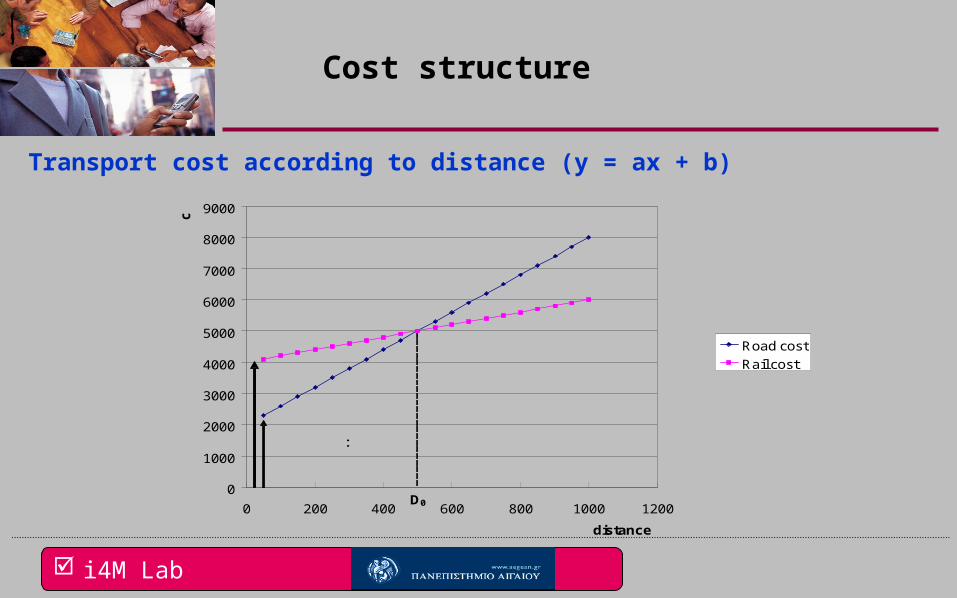
minimisation of costs a basic concern for modal choice
transport cost varies according to the length of haulage, but is not proportional to it: it also comprises a fixed cost, independent of distance, covering such operations as packaging, loading and unloading, preparation of the vehicle, invoicing, organisation and transaction costs, etc
i4M Lab
Cost structure
Transport cost according to distance (y = ax + b)
0
1000
2000
3000
4000
5000
6000
7000
8000
9000
0 200 400 600 800 1000 1200
distance
c
Road costRail cost
Fixed cost
D0
i4M Lab
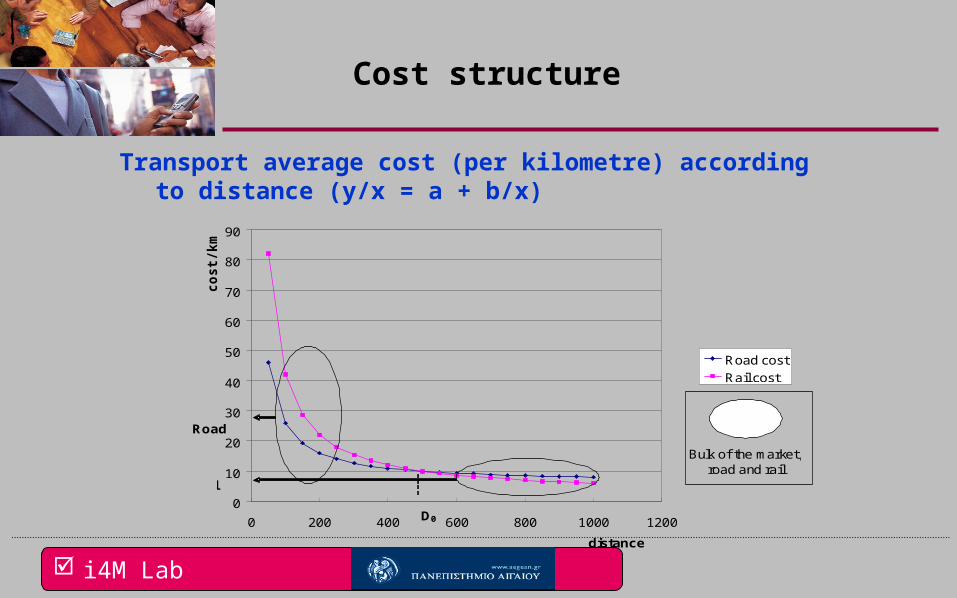
Cost structure
Transport average cost (per kilometre) according to distance (y/x = a + b/x)
0
10
20
30
40
50
60
70
80
90
0 200 400 600 800 1000 1200
distance
cost / km
Road costRail cost
Road
Rail
D0
Bulk of the market,road and rail
i4M Lab
Cost and Quality
Therefore, the divide between road and rail solutions takes place according to a threshold distance based on the cost factor
Beside the cost, quality criteria affect the decision-making process, to various extends
i4M Lab
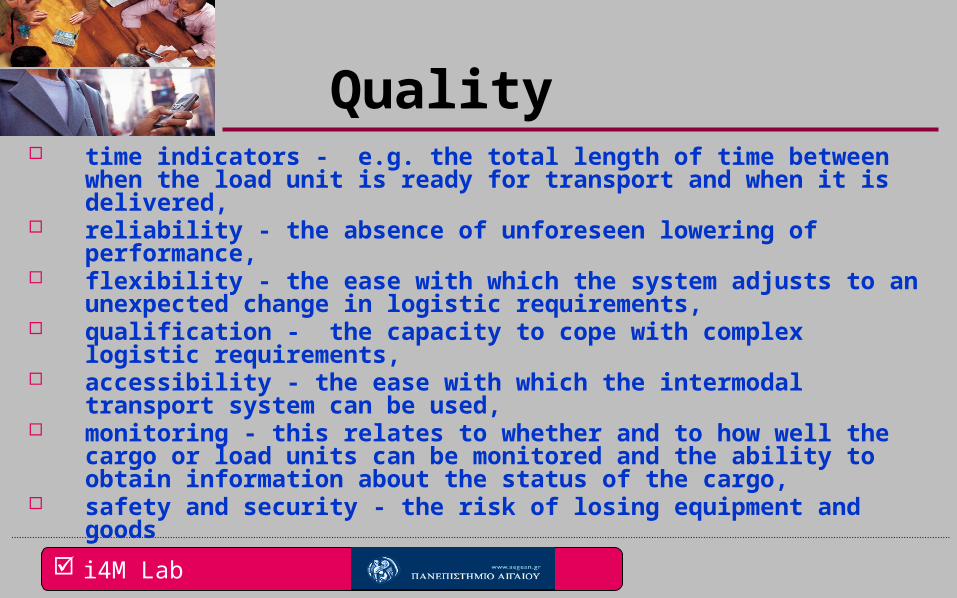
Quality time indicators - e.g. the total length of time between when the load unit
is ready for transport and when it is delivered, reliability - the absence of unforeseen lowering of performance, flexibility - the ease with which the system adjusts to an unexpected
change in logistic requirements, qualification - the capacity to cope with complex logistic requirements, accessibility - the ease with which the intermodal transport system can be
used, monitoring - this relates to whether and to how well the cargo or load
units can be monitored and the ability to obtain information about the status of the cargo,
safety and security - the risk of losing equipment and goods
i4M Lab
Decision-making process: other variables
Variables affecting decisions by affecting the relative weight of cost and quality can be divided into four groups:
shipper characteristics (size, volumes, regularity of shipments etc)-demand side
transport actors’ characteristics-supply side cargo characteristics- demand side characteristics of economic environment-supply side
i4M Lab
Quality and decision-making
The relative weight of quality criteria varies according to these variables: Intercontinental maritime transport presents less time pressure than continental
transport. Time and commercial accessibility are less important on long distances, while the
importance of control is growing. The need for additional services such as pre- or end-haul arrangements is needed.
As for hazardous goods and perishable goods, control and reliability are of relatively high importance.
As for hazardous goods, security, qualification and safety are important. As for low-value cargo, it is mainly price, which determines the modal choice. No
quality features are expected to be of more than average importance
i4M Lab
Who is the decision-maker ?
By its nature, a multiplicity of actors are involved in an intermodal chain:
i4M Lab
Who is the decision-maker ?
Case 1 Decision-maker: Large shipper owning assets and operating own account transport and logistics activities.It is interesting to investigate how “own assets” affect the usage of intermodal transport. Investments in intermodal equipment
can result from a decision process to use intermodal transport. Therefore, the decision process is influenced by the necessity to optimise the own assets use. Finally, to further evaluate the influence of own assets on decision, the different types of own assets and the respective types of actors must be taken into consideration.
Case 2Decision-maker: Large shipper directly contracting out transport activities and ensuring own account forwarding and logistics
activities.Case 3Decision-maker: Large forwarder having the freedom to chose transport modes, routes and transport operators to carry out
transport functions. In case 3, shippers, however, impose the quality parameters of transport (frequency, dispatch size, delivery time etc).
Case 4Decision-maker: Large forwarder or large road transport company operating for the account of a large number of shippers of
various size.Case 5 Decision-maker: Deep sea shipping line or feeder operator also organizing the transport and logistics activities on the inland
leg. The so-called “carrier haulage” is mainly concerned.
i4M Lab
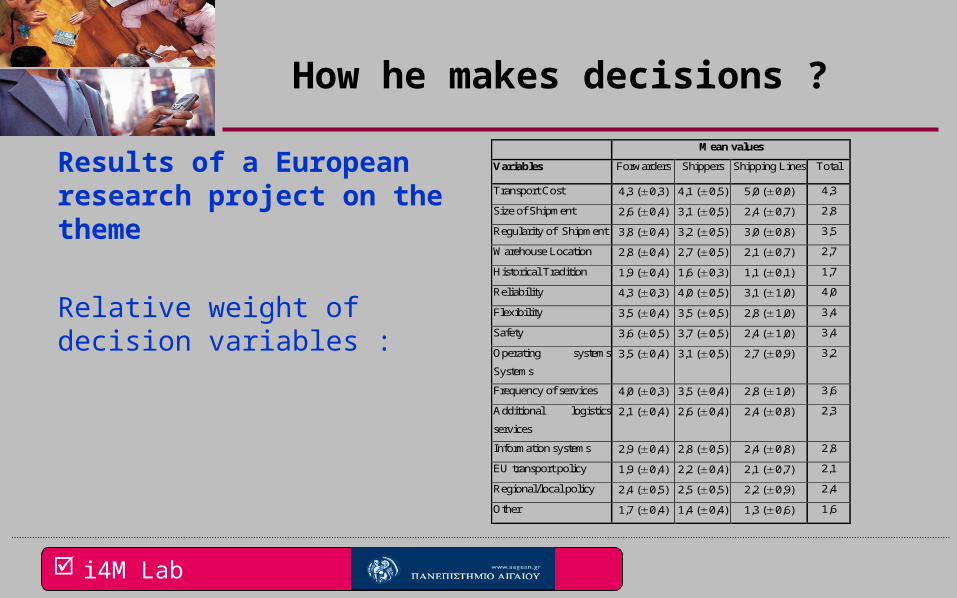
How he makes decisions ?
Results of a European research project on the theme
Relative weight of decision variables :
Mean values
Variables Forwarders Shippers Shipping Lines Total
Transport Cost 4,3 ( 0,3) 4,1 ( 0,5) 5,0 ( 0,0) 4,3
Size of Shipment 2,6 ( 0,4) 3,1 ( 0,5) 2,4 ( 0,7) 2,8
Regularity of Shipment 3,8 ( 0,4) 3,2 ( 0,5) 3,0 ( 0,8) 3,5
Warehouse Location 2,8 ( 0,4) 2,7 ( 0,5) 2,1 ( 0,7) 2,7
Historical Tradition 1,9 ( 0,4) 1,6 ( 0,3) 1,1 ( 0,1) 1,7
Reliability 4,3 ( 0,3) 4,0 ( 0,5) 3,1 ( 1,0) 4,0
Flexibility 3,5 ( 0,4) 3,5 ( 0,5) 2,8 ( 1,0) 3,4
Safety 3,6 ( 0,5) 3,7 ( 0,5) 2,4 ( 1,0) 3,4
Operating systems
Systems
3,5 ( 0,4) 3,1 ( 0,5) 2,7 ( 0,9) 3,2
Frequency of services 4,0 ( 0,3) 3,5 ( 0,4) 2,8 ( 1,0) 3,6
Additional logistics
services
2,1 ( 0,4) 2,6 ( 0,4) 2,4 ( 0,8) 2,3
Information systems 2,9 ( 0,4) 2,8 ( 0,5) 2,4 ( 0,8) 2,8
EU transport policy 1,9 ( 0,4) 2,2 ( 0,4) 2,1 ( 0,7) 2,1
Regional/local policy 2,4 ( 0,5) 2,5 ( 0,5) 2,2 ( 0,9) 2,4
Other 1,7 ( 0,4) 1,4 ( 0,4) 1,3 ( 0,6) 1,6
i4M Lab
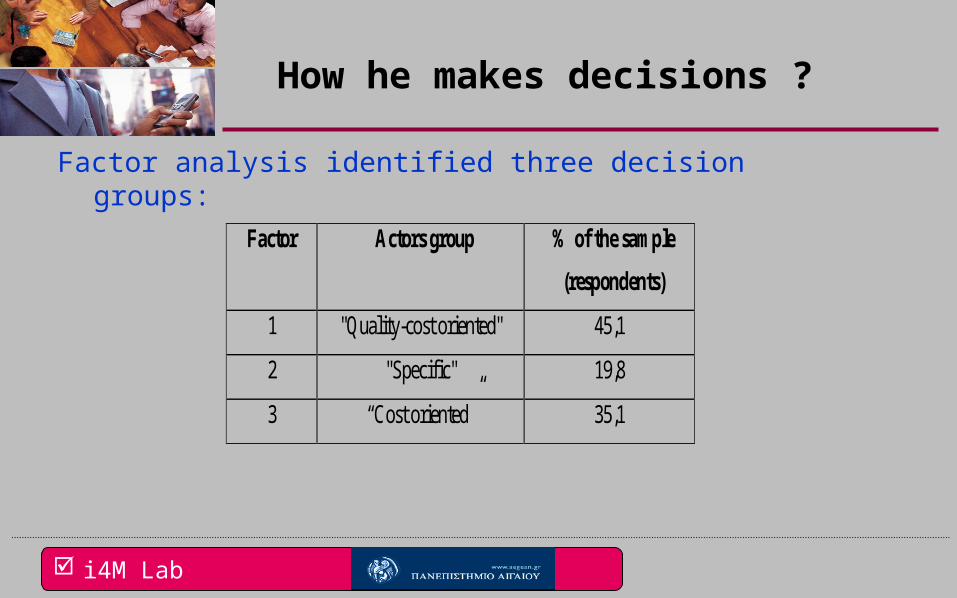
How he makes decisions ?
Factor analysis identified three decision groups:
Factor Actors group % of the sample
(respondents)
1 "Quality-cost oriented" 45,1
2 "Specific" 19,8
3 “Cost oriented” 35,1
i4M Lab
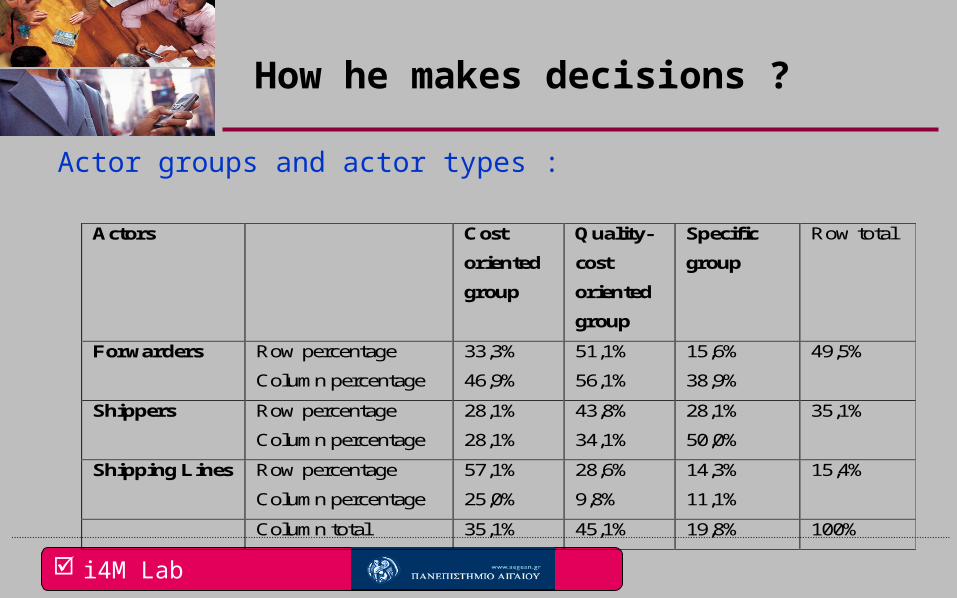
How he makes decisions ?
Actor groups and actor types :
Actors Cost
oriented
group
Quality-
cost
oriented
group
Specific
group
Row total
Forwarders Row percentage
Column percentage
33,3%
46,9%
51,1%
56,1%
15,6%
38,9%
49,5%
Shippers Row percentage
Column percentage
28,1%
28,1%
43,8%
34,1%
28,1%
50,0%
35,1%
Shipping Lines Row percentage
Column percentage
57,1%
25,0%
28,6%
9,8%
14,3%
11,1%
15,4%
Column total 35,1% 45,1% 19,8% 100%
i4M Lab
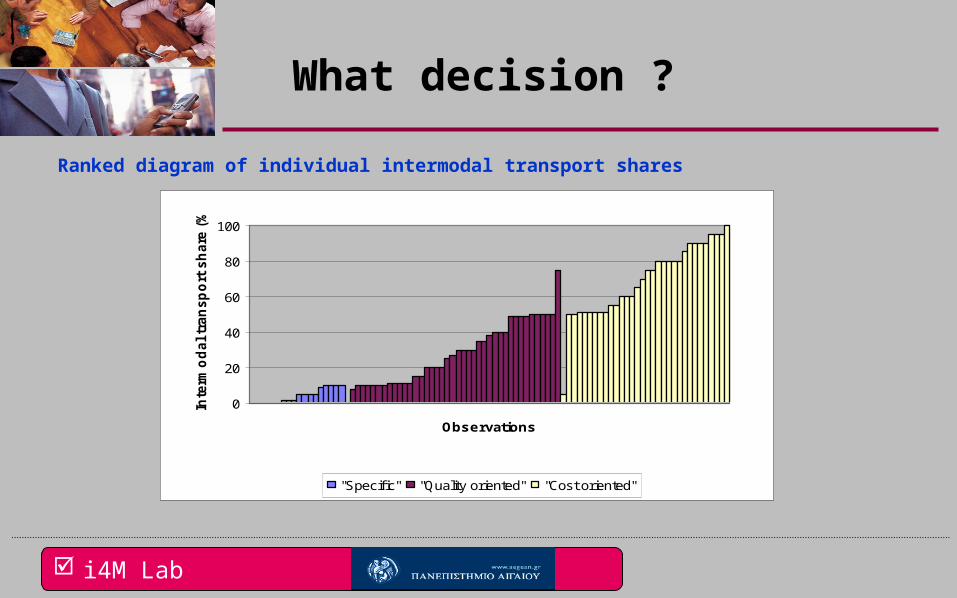
What decision ?
Ranked diagram of individual intermodal transport shares
0
20
40
60
80
100
Observations
Inte
rmo
dal tr
an
sp
ort
sh
are
(%
)
"Specif ic" "Quality oriented" "Cost oriented"
i4M Lab
Why stagnation ?
From the supply side: Investments to extend quality and coverage are heavy and of high
risk while the return on capital is limited Business opportunities at the national level are restricted; the
international market is much more competitive The (few) new entrants in the market did not bring the expected
impetus Traditional actors (e.g. UIRR members) kept their position in the
market
i4M Lab
Why stagnation ?
In a more detailed level, the intermodal market knew several organizational changes, induced by the liberalisation process in the railway sector:
New partnerships, alliances and agreements Break of monopoly in traction practicesCreation of new companies and entrance of actors operating in other sectors of transport business etcVarious extend of these changes from country to country (e.g. in France is limited, in Italy quite important)
However, the overall picture did not change a lot.
i4M Lab
Why stagnation ?
At the political level:
Significant decrease of public aids -under various forms- in the recent years revealed the problem of economic viability of intermodal business
i4M Lab
Why stagnation ?
From the demand side:
The improvement of quality in several intermodal services seems not to be appreciated as such…
The logic behind the promotion of intermodality is still socio-economic (reduction of external cost) rather than financial…
i4M Lab
Για περισσότερες πληροφορίες:
38
ΕΥΧΑΡΙΣΤΟΥΜΕ ΓΙΑ ΤΗΝ ΠΡΟΣΟΧΗ ΣΑΣ!