-H2AX foci as in vivo effect biomarker in children ... 31 March 2014/Revised: 16 September...
12
PEDIATRIC γ-H2AX foci as in vivo effect biomarker in children emphasize the importance to minimize x-ray doses in paediatric CT imaging C. Vandevoorde & C. Franck & K. Bacher & L. Breysem & M. H. Smet & C. Ernst & A. De Backer & K. Van De Moortele & P. Smeets & H. Thierens Received: 31 March 2014 /Revised: 16 September 2014 /Accepted: 1 October 2014 /Published online: 30 October 2014 # The Author(s) 2014. This article is published with open access at Springerlink.com Abstract Objectives Investigation of DNA damage induced by CT x- rays in paediatric patients versus patient dose in a multicentre setting. Methods From 51 paediatric patients (median age, 3.8 years) who underwent an abdomen or chest CT examination in one of the five participating radiology departments, blood samples were taken before and shortly after the examination. DNA damage was estimated by scoring γ-H2AX foci in peripheral blood T lymphocytes. Patient-specific organ and tissue doses were calculated with a validated Monte Carlo program. Indi- vidual lifetime attributable risks (LAR) for cancer incidence and mortality were estimated according to the BEIR VII risk models. Results Despite the low CT doses, a median increase of 0.13 γ-H2AX foci/cell was observed. Plotting the induced γ- H2AX foci versus blood dose indicated a low-dose hypersen- sitivity, supported also by an in vitro dose–response study. Differences in dose levels between radiology centres were reflected in differences in DNA damage. LAR of cancer mortality for the paediatric chest CT and abdomen CT cohort was 0.08 and 0.13 ‰ respectively. Conclusion CT x-rays induce DNA damage in paediatric patients even at low doses and the level of DNA damage is reduced by application of more effective CT dose reduction techniques and paediatric protocols. Key Points • CT induces a small, significant number of double-strand DNA breaks in children. • More effective CT dose reduction results in less DNA damage. • Risk estimates based on the LNT hypothesis may represent underestimates. Keywords X-ray computed tomography . Double-strand DNA breaks . Radiobiology . gammaH2AX protein . Paediatrics Abbreviations and acronyms ATM automatic tube current modulation BEIR biological effects of ionizing radiation CTDI vol computed tomography dose index (volume) DAPI 4′,6-diamidino-2-phenylindole DNA deoxyribonucleoside acid DLP dose–length product DRL dose reference level DSB double-strand break γH2AX phosphorylated histone subtype H2A isoform X C. Vandevoorde (*) : C. Franck : K. Bacher : H. Thierens Department of Basic Medical Sciences, Ghent University, Proeftuinstraat 86, 9000 Gent, Belgium e-mail: [email protected] L. Breysem : M. H. Smet Radiology Department, University Hospital Louvain, Leuven, Belgium C. Ernst Radiology Department, University Hospital Brussels, Brussels, Belgium A. De Backer Radiology Department, General Hospital Sint-Lucas Ghent, Ghent, Belgium K. Van De Moortele 5Radiology Department, General Hospital Sint-Jan Bruges, Bruges, Belgium P. Smeets Radiology Department, Ghent University Hospital, Ghent, Belgium Eur Radiol (2015) 25:800–811 DOI 10.1007/s00330-014-3463-8
Transcript of -H2AX foci as in vivo effect biomarker in children ... 31 March 2014/Revised: 16 September...

PEDIATRIC
γ-H2AX foci as in vivo effect biomarker in children emphasizethe importance to minimize x-ray doses in paediatric CT imaging
C. Vandevoorde & C. Franck & K. Bacher & L. Breysem &
M. H. Smet & C. Ernst & A. De Backer & K. Van De Moortele &
P. Smeets & H. Thierens
Received: 31 March 2014 /Revised: 16 September 2014 /Accepted: 1 October 2014 /Published online: 30 October 2014# The Author(s) 2014. This article is published with open access at Springerlink.com
AbstractObjectives Investigation of DNA damage induced by CT x-rays in paediatric patients versus patient dose in a multicentresetting.Methods From 51 paediatric patients (median age, 3.8 years)who underwent an abdomen or chest CT examination in oneof the five participating radiology departments, blood sampleswere taken before and shortly after the examination. DNAdamage was estimated by scoring γ-H2AX foci in peripheralblood T lymphocytes. Patient-specific organ and tissue doseswere calculated with a validated Monte Carlo program. Indi-vidual lifetime attributable risks (LAR) for cancer incidenceand mortality were estimated according to the BEIR VII riskmodels.Results Despite the low CT doses, a median increase of 0.13γ-H2AX foci/cell was observed. Plotting the induced γ-
H2AX foci versus blood dose indicated a low-dose hypersen-sitivity, supported also by an in vitro dose–response study.Differences in dose levels between radiology centres werereflected in differences in DNA damage. LAR of cancermortality for the paediatric chest CT and abdomen CT cohortwas 0.08 and 0.13‰ respectively.Conclusion CT x-rays induce DNA damage in paediatricpatients even at low doses and the level of DNA damage isreduced by application of more effective CT dose reductiontechniques and paediatric protocols.Key Points• CT induces a small, significant number of double-strandDNA breaks in children.
• More effective CT dose reduction results in less DNAdamage.
• Risk estimates based on the LNT hypothesis may representunderestimates.
Keywords X-ray computed tomography . Double-strandDNA breaks . Radiobiology . gammaH2AX protein .
Paediatrics
Abbreviations and acronymsATM automatic tube current modulationBEIR biological effects of ionizing radiationCTDIvol computed tomography dose index
(volume)DAPI 4′,6-diamidino-2-phenylindoleDNA deoxyribonucleoside acidDLP dose–length productDRL dose reference levelDSB double-strand breakγH2AX phosphorylated histone subtype H2A
isoform X
C. Vandevoorde (*) :C. Franck :K. Bacher :H. ThierensDepartment of Basic Medical Sciences, Ghent University,Proeftuinstraat 86, 9000 Gent, Belgiume-mail: [email protected]
L. Breysem :M. H. SmetRadiology Department, University Hospital Louvain, Leuven,Belgium
C. ErnstRadiology Department, University Hospital Brussels, Brussels,Belgium
A. De BackerRadiology Department, General Hospital Sint-Lucas Ghent, Ghent,Belgium
K. Van De Moortele5Radiology Department, General Hospital Sint-Jan Bruges, Bruges,Belgium
P. SmeetsRadiology Department, Ghent University Hospital, Ghent, Belgium
Eur Radiol (2015) 25:800–811DOI 10.1007/s00330-014-3463-8
ICRP International Commission onRadiological Protection
LAR lifetime attributable riskLNT linear-no-thresholdLSS lifespan study53 PB1 p53 binding protein 1PFA paraformaldehydeRAM-TRITC rabbit-anti-mouse tetramethyl
rhodamine isothiocyanateRPMI Roswell Park Memorial Institute
Introduction
The introduction of computed tomography (CT) has tremen-dously improved diagnostic imaging. However, the high x-raydoses associated with CT procedures have raised health con-cerns [1]. This is of particular importance for the paediatricpatient population, recognized as one of the most importanttarget groups in medical radiation protection. Technologicaldevelopments in CT have substantially increased diagnosticapplications and accuracy in paediatric patients. Children havea higher radiosensitivity compared to adults regarding x-ray-induced malignancies and the associated risk for exposure-induced death [2]. Therefore, optimisation and justification ofCT protocols for children is a topic of high importance in dailyclinical practice [3]. An initiative worth mentioning in thiscontext is the Image Gently campaign of the Alliance forRadiation Safety in Paediatric Imaging, which tries to changepractice by increasing awareness of the opportunities to re-duce radiation dose in the imaging of children [4]. Severalstudies have shown that the use of CT dose reduction tech-niques in paediatric CT imaging lowers the physical radiationdose [5, 6]. However it remains unexplored if they also havean impact on the DNA damage induced by CT x-rays inchildren.
A recent study in the UK linked the exposure from x-raysin CT imaging during childhood to the development of braintumours and leukaemia [7]. However, the risk assessments atlow doses remain subject of active debate. The lifespan study(LSS) of atomic bomb survivors showed a roughly linearrelationship between cancer mortality and high doses of highdose rate radiation for an adult population [8]. This resulted inthe linear-no-threshold (LNT) hypothesis, implying a linearrelationship between dose and biological effect without a dosethreshold. Despite the considerable uncertainties and diver-gent views regarding the health effects and applicability of theLNT theory at low doses, the model is used for risk estimationby the international radiation protection community and re-ferred to as the main paradigm of radiation protection [9].
The use of sensitive biomarkers for the assessment of earlyx-ray effects in patients gives valuable information on dose–
effect relationships for diagnostic x-rays. Earlier work dem-onstrated that the γ-H2AX foci assay can be used to determinethe effects of CT exposure at the molecular level, namely theinduction of DNA double-strand breaks (DSBs) [10–13].DSBs are considered to be the most deleterious cellular effectsof x-rays, because they can result in loss or rearrangement ofgenetic information, leading to cell death or carcinogenesis[14]. The phosphorylation of the histone variant H2AX is oneof the earliest stages in the cellular response to DSBs and oneγ-H2AX focus represents one DNA DSB, which can bequantified by immunofluorescence microscopy [15].
A prospective multicentre study was set up in order todetermine the number of x-ray-induced DNA DSBs in chil-dren undergoing a chest or abdomen CTexamination. Herein,the γ-H2AX foci assay was used as an effect biomarker forradiation-induced DSBs. Blood doses were determined by apatient-specific full Monte Carlo dose simulation in order tocorrelate the induced DNA damage with the individual blooddose. BEIR VII age- and gender-specific risk models wereused to assess the lifetime attributable risk (LAR) of cancerincidence and mortality associated with the CTexamination ofevery individual patient.
Materials and methods
Assessment of DNADSBs in pre- and post-CT blood samplesof paediatric patients
Study population
The study population consisted of 51 children undergoing aCT examination of the chest (41) or abdomen (10) in one ofthe five participating radiology centres (March 2012 throughJuly 2013) (Table 1). The small number of abdomen CTpatients was because magnetic resonance imaging (MRI)was the preferred imaging modality of the majority of partic-ipating radiologists for abdomen investigations, to avoid ion-izing radiation exposure. Exclusion criteria were present orpast leukaemia or lymphoma and radiochemotherapy withinthe last year. Themedian age of the patient groupwas 3.8 years
Table 1 Demographic data of the paediatric patients included in thestudy
Chest CT Abdomen CT
Age (years) 3.00 (0.10–12.20) 7.1 (1.80–12.10)
Weight (kg) 13.50 (2.40–40.00) 24.00 (8.80–68.50)
Length (cm) 93.50 (45.50–160.00) 123.50 (76.50–167.00)
Men 30 7
Women 11 3
Eur Radiol (2015) 25:800–811 801
(range 0.1–12.5 years). Before blood sampling, an informedconsent was signed by one of the parents of the children. Theprospective multicentre study was approved by the local re-view boards of the participating hospitals, and the institutionalreview board of Ghent University Hospital acted as centralethical committee.
CT equipment and acquisition protocols
All the participating radiology departments used contempo-rary state-of-the-art low dose CT systems. The following CTsystems were used in this study: Siemens SomatomDefinitionFlash and Sensation 64 (Siemens Medical Solutions, Germa-ny), Toshiba Aquilion (Toshiba Medical Systems, Japan) andthree centres used the GE Discovery CT750 HD (GEHealthcare, USA). Every radiology department used its own,optimized paediatric CT protocol with low kVp settings (me-dian values: chest CT 80 kV, range 80–120 kV; abdomen CT100 kV, range 100–120 kV), low fixed tube currents or auto-matic tube current modulation (ATM), adapted pitch valuesand imaging lengths restricted to the region of interest. Itera-tive reconstruction technology was applied in two of theinstitutions, resulting in ultra-low doses (VEO reconstructionfrom GE Healthcare). Individual CT parameters for the pa-tients of the study are presented in Tables 2 and 3 for chest CTand abdomen CT respectively. The combination of state-of-the-art CT systems with dose reduction techniques andadapted paediatric protocols resulted in low- or evenultra-low CT doses.
Sample collection
Blood samples (2 mL) were collected through the catheter forcontrast agent administration. One blood sample was takenbefore CT, to determine the baseline level of DSBs, and oneapproximately 5 min after the examination (the catheter wasalways flushed before sampling). As a result of occlusion,blood sampling through the catheter was not possible for morethan half of the patients, especially very young children. Forthese patients an additional venepuncture after the CT examwas necessary. The blood samples were kept at 37 °C for30 min to allow DNA damage signalling. Afterwards, DNArepair was arrested by cooling the samples at 0 °C for 15 min.Blood was transported at 4 °C, with an elapsed time no longerthan 3 h from collection to processing. Before processing,samples were coded allowing blind scoring later on.
Detection of DNA DSBs
The method is based on the phosphorylation of the histonevariant H2AX after DSB formation and follows previouslypublished protocols [11, 16, 17]. In order to be able to workwith a homogeneous cell population, T lymphocytes were
isolated from the blood with the RosetteSep human T cellenrichment cocktail (StemCell Technologies, France) and re-suspended in complete RPMI cell culture medium (84 %RPMI-1640, 15 % foetal calf serum, 1 %L-glutamine, 50U/mL penicillin and 50 μg/mL streptomycin; Life Technolo-gies, Belgium). For immunofluorescence staining, 250 μL ofthe resuspended T lymphocytes was centrifuged onto poly-L-lysine-coated slides (VWR International, Belgium). The slideswere fixed in 3 % paraformaldehyde (PFA) (Sigma-Aldrich,Belgium) for 20 min and stored overnight in 0.5 % PFA.Fixation should immobilize antigens while retaining the lym-phocytes as close to their natural state as possible. Thenext day, slides were permeabilised by dropping 100 μLof 0.2 % Triton-X-100 (Sigma-Aldrich, Belgium). Thispermeabilisation step is required because the anti-γ-H2AXantibody binding requires intracellular access to detect the γ-H2AX protein. The immunofluorescence staining was per-formed with an unlabelled primary mouse monoclonalanti-γ-H2AX antibody (1:500; Biolegend, Belgium) whichspecifically binds to the target γ-H2AX protein, followed bya secondary rabbit anti-mouse (RAM)–TRITC antibody(1:1,000; DakoCytomation, Denmark). This secondary anti-body carries the (TRITC) fluorophore, recognizes the primaryanti-γ-H2AX antibody and binds to it. Subsequently, thelymphocyte nucleus was counterstained with 2 % 4′,6-diamidino-2-phenylindole (DAPI) in Slowfade mounting me-dium (Sigma-Aldrich, Belgium). DAPI is a blue fluorescentstain specific for DNA. Microscopic scoring was performedmanually with an Olympus BX60 fluorescence microscopewith an Olympus×100/1.30 oil lens. The images were viewedusing Cytovision software and captured with a digital camera(Applied Imaging, USA). Ten optical sections were obtainedfor each field of vision (Z-stack sections of 1.03 μm). Differ-ent images of one blinded slide were stored and on average250 cells were scored manually for γ-H2AX foci. More than250 cells were scored for every condition and the number ofγ-H2AX foci induced by CT x-rays was obtained bysubtracting the pre-scan foci yield from the post-scan fociyield after decoding. The scoring procedure was validatedby double immunostaining for both γ-H2AX and p53 bindingprotein 1 (53BP1), to discriminate between background arte-facts and small γ-H2AX foci. The experiments demonstratedthat the γ-H2AX-TRITC foci coincide with 53BP1-FITCfoci, resulting in a statistical significant agreement betweenthe number of double stained foci (merge) and the number ofindividual γ-H2AX-TRITC foci (results not shown).
In vitro dose–response study on umbilical cord blood samples
For the validation of the in vivo results, a set of in vitroexperiments was performed. Unfortunately, it was not possi-ble to have access to blood samples with a larger volume than2 mL from young children, because of ethical constraints.
802 Eur Radiol (2015) 25:800–811

Since umbilical cord blood is physiologically and geneticallypart of the foetus, we can consider this as blood of a newborn
[18]. Therefore, umbilical cord blood samples were irradiatedin vitro in order to compare the γ-H2AX foci dose response
Table 2 Individual CT parameters for all paediatric patients of the present study undergoing a chest CT examination
Patient number Tube current(mA)
Exposuretime (s)
Tube voltage(kV)
Pitch Collimation(mm)
Type of CT scanner
1A 80 0.4 100 1.375 40 GE Discovery CT750 HD
1B* 60 0.4 100 1.375 40 GE Discovery CT750 HD
2 80 0.4 80 1.375 40 GE Discovery CT750 HD
3 35 0.6 100 1.375 40 GE Discovery CT750 HD (VEO)
4 30 0.4 100 0.984 40 GE Discovery CT750 HD
5 25 0.6 100 0.984 40 GE Discovery CT750 HD
6 38.3 (ATM) 0.5 80 1.375 40 GE Discovery CT750 HD
7 75 0.4 100 0.984 40 GE Discovery CT750 HD (VEO)
8 111.82 (ATM) 0.6 80 1.370 40 GE Discovery CT750 HD
9 86.86 (ATM) 0.6 80 1.375 40 GE Discovery CT750 HD
10 79 0.6 100 1.375 40 GE Discovery CT750 HD
11 94.98 (ATM) 0.6 120 1.375 40 GE Discovery CT750 HD
12 119.25 (ATM) 0.6 120 1.375 40 GE Discovery CT750 HD
13 22.47 (ATM) 0.4 80 0.516 40 GE Discovery CT750 HD (VEO)
14 22.58 (ATM) 0.4 80 0.516 40 GE Discovery CT750 HD (VEO)
15 18.90 (ATM) 0.4 80 0.516 40 GE Discovery CT750 HD (VEO)
16 31.54 (ATM) 0.4 80 0.516 40 GE Discovery CT750 HD (VEO)
17 10 0.4 80 0.984 40 GE Discovery CT750 HD (VEO)
18 41.42 (ATM) 0.4 80 0.984 40 GE Discovery CT750 HD (VEO)
19 19.66 0.4 80 0.516 40 GE Discovery CT750 HD (VEO)
20 61.69 (ATM) 0.4 80 0.516 40 GE Discovery CT750 HD (VEO)
21 24 0.4 80 0.516 40 GE Discovery CT750 HD (VEO)
22 37.67 0.4 80 0.516 40 GE Discovery CT750 HD (VEO)
23 39.15 (ATM) 0.4 80 0.516 40 GE Discovery CT750 HD (VEO)
24 31.13 0.4 80 0.516 40 GE Discovery CT750 HD (VEO)
25 10 0.4 80 0.984 40 GE Discovery CT750 HD (VEO)
26 35.84 (ATM) 0.4 80 0.516 40 GE Discovery CT750 HD (VEO)
27 21.58 0.4 80 0.516 40 GE Discovery CT750 HD (VEO)
28 29.81 (ATM) 0.4 80 0.516 40 GE Discovery CT750 HD (VEO)
29 33.30 (ATM) 0.4 80 0.516 40 GE Discovery CT750 HD (VEO)
30 122.32 (ATM) 0.285 120 0.900 38.4 Siemens Somatom Definition Flash
31 73.28 (ATM) 0.5 100 1.400 38.4 Siemens Somatom Definition Flash
32 163.19 (ATM) 0.5 100 1.200 38.4 Siemens Somatom Sensation 64
33 63.42 (ATM) 0.5 100 1.400 38.4 Siemens Somatom Definition Flash
34 124.31 (ATM) 0.5 100 1.400 38.4 Siemens Somatom Definition Flash
35 48.31 (ATM) 0.5 100 1.200 38.4 Siemens Somatom Definition Flash
36 160.54 (ATM) 0.5 100 1.200 38.4 Siemens Somatom Definition Flash
37 127.81 (ATM) 0.5 100 1.200 38.4 Siemens Somatom Definition Flash
38 89.89 (ATM) 0.5 100 1.200 38.4 Siemens Somatom Definition Flash
39 77.12 (ATM) 0.5 100 1.200 38.4 Siemens Somatom Definition Flash
40 157.67 (ATM) 0.5 80 1.200 38.4 Siemens Somatom Definition Flash
41 138.39 (ATM) 0.5 80 1.200 38.4 Siemens Somatom Definition Flash
ATM automatic tube current modulation, VEO iterative reconstruction
* Problems with contrast agent administration
Eur Radiol (2015) 25:800–811 803
after in vivo and in vitro exposure. Cord blood samples fromthree healthy donors were exposed to 1, 2, 4, 6, 8, 10, 15, 20and 500 mGy and one blood sample was sham-irradiated. Aradiation quality of 100-kVp x-rays and 2-mm Al filtrationwas used, with a PhilipsMG420 x-ray generator coupled to anMCN420 tube. The irradiation was carried out in a 37 °Cwater bath. Calibration was performed with an NE2571 Farm-er ionization chamber (Thermo Electron, Altrincham, UK).The irradiated blood samples were kept for 30 min at 37 °C,followed by 15 min on ice water to simulate the situation ofpatient blood samples after in vivo exposure. The same γ-H2AX foci protocol and scoring method as described for thein vivo study was applied. The use of cord blood for in vitroexperiments was approved by the institutional review board.
Patient dosimetry
Calculation of blood and organ doses induced by CT x-raysby full Monte Carlo simulation
The blood dose was calculated as a weighted sum of doses tothe largest blood-containing organs with the percentage ofblood pool as weighting factor, namely lungs (12.5 %), heart(10 %), liver (10 %) and remainder (67.5 %) [19]. In order toobtain individual organ dose estimates, an individualized fullMonte Carlo patient dose simulation was set up usingImpactMC simulation software 1.3.1 (CT Imaging GmbH,Germany). In this software, patient-specific 3D voxel modelsare created on the basis of the CT images acquired during CTexamination [20]. For the simulation of the CT scan, actualscan parameters, such as tube voltage (kV), tube current–exposure time product (mAs) and pitch, are retrieved fromthe DICOM header of the CT images. The individual mA
values of all the reconstructed CT slices were used in order totake into account of the tube current modulation of the CTscanner. More than 1010 photons were simulated in order tominimize the uncertainty in the Monte Carlo results. Thepatient-specific dose distribution was determined by multiply-ing the air kerma normalized dose distribution from the sim-ulations with the actual air kerma value (mGy) measured free-in-air in the isocentre of the scanner by using a pencil ioniza-tion chamber (RaySafe Xi CT detector, Unfors RaySafe,Sweden). In addition to the organ doses needed for the blooddose evaluation, doses to other organs and tissues of interestaccording to the BEIR VII risk models were also calculatedwith thisMonte Carlo patient dose simulation. Organ volumeswere segmented in the original CT images and organ dosedeposition was calculated on the basis of the Monte Carlodose distribution. For the bone marrow, all bony structures inthe field of view were segmented and the bone marrow dosewas calculated as the weighted sum of the doses to thesestructures with the percentage of bone marrow in these com-partments as weighting factor [21]. To account for differencesin photon absorption in bone and bone marrow, the obtainedvalue was corrected for the ratio of mass absorptioncoefficients in soft tissue and bone [22].
Calculation of effective dose
To compare the dose levels of the CT procedures in the currentstudy with similar procedures in different hospitals and coun-tries, the effective dose was calculated for the total group ofchest CT and abdomen CT patients. Effective dose is a quan-tity reflecting the stochastic risk associated with an exposureto ionizing radiation at a population level. The effective dosesof the paediatric populations under study were derived from
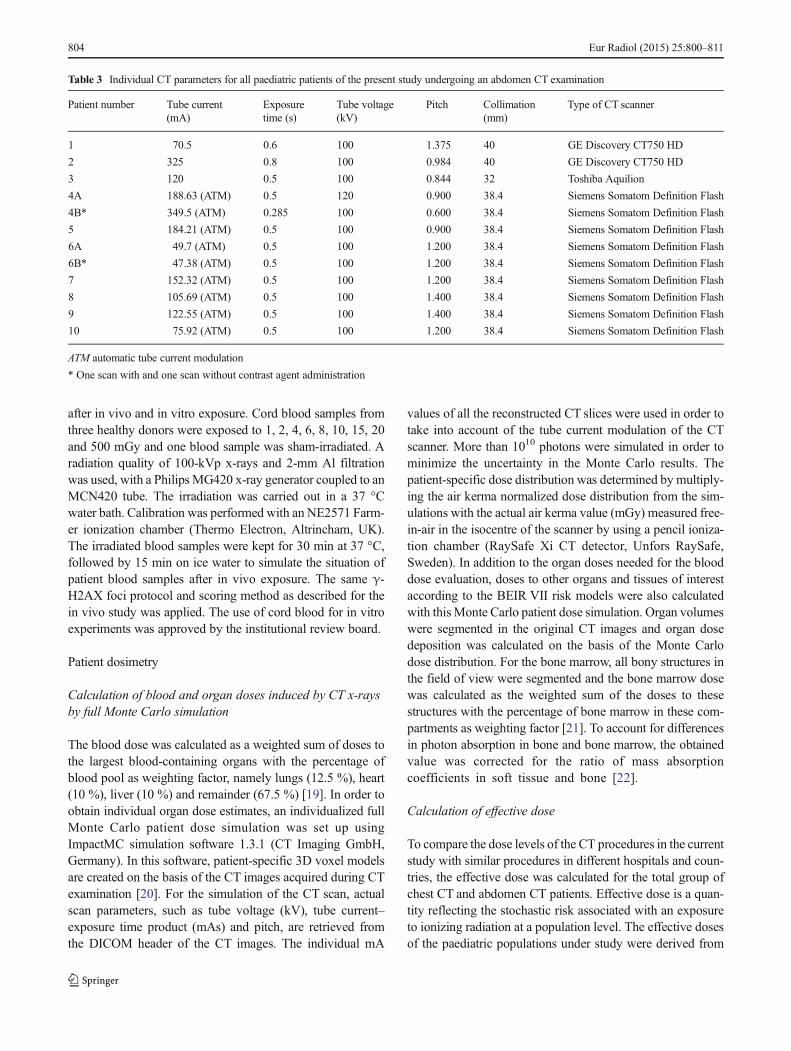
Table 3 Individual CT parameters for all paediatric patients of the present study undergoing an abdomen CT examination
Patient number Tube current(mA)
Exposuretime (s)
Tube voltage(kV)
Pitch Collimation(mm)
Type of CT scanner
1 70.5 0.6 100 1.375 40 GE Discovery CT750 HD
2 325 0.8 100 0.984 40 GE Discovery CT750 HD
3 120 0.5 100 0.844 32 Toshiba Aquilion
4A 188.63 (ATM) 0.5 120 0.900 38.4 Siemens Somatom Definition Flash
4B* 349.5 (ATM) 0.285 100 0.600 38.4 Siemens Somatom Definition Flash
5 184.21 (ATM) 0.5 100 0.900 38.4 Siemens Somatom Definition Flash
6A 49.7 (ATM) 0.5 100 1.200 38.4 Siemens Somatom Definition Flash
6B* 47.38 (ATM) 0.5 100 1.200 38.4 Siemens Somatom Definition Flash
7 152.32 (ATM) 0.5 100 1.200 38.4 Siemens Somatom Definition Flash
8 105.69 (ATM) 0.5 100 1.400 38.4 Siemens Somatom Definition Flash
9 122.55 (ATM) 0.5 100 1.400 38.4 Siemens Somatom Definition Flash
10 75.92 (ATM) 0.5 100 1.200 38.4 Siemens Somatom Definition Flash
ATM automatic tube current modulation
* One scan with and one scan without contrast agent administration
804 Eur Radiol (2015) 25:800–811
the individual DLP values by using the conversion factorspublished by Deak et al. as function of kVp, imaging regionand age for ICRP publication 103 recommendations [23].
Risk estimation
Individual LAR of cancer incidence and mortality relat-ed to a chest or abdomen CT scan were calculatedaccording to the BEIR VII risk models for differentcancer types, taking into account age-dependent inci-dence and mortality rates within the Euro-Americanpopulation [24]. Input for these risk assessments wasthe simulated organ doses and the age of the individualpatients. The LAR data from BEIR VII were adaptedfor a dose and dose-rate effectiveness factor of 2 asproposed by the ICRP [25].
Statistical analysis
Statistical analysis was performed with Microsoft OfficeExcel 2010 (Microsoft Corporation, USA) and StatisticalPackage for Social Sciences software version 22 (SPSSInc., USA). Poisson statistics were applied to calculatethe statistical accuracy of the number of x-ray inducedγ-H2AX foci. The differences between the pre- andpost-CT data sets were evaluated for significance withthe paired sample Wilcoxon signed-rank test (95 %confidence level). Linear regression analysis was appliedto evaluate age dependence. A p value less than 0.05was considered as statistically significant.
Results
Assessment of DNADSBs in pre- and post-CT blood samplesof paediatric patients
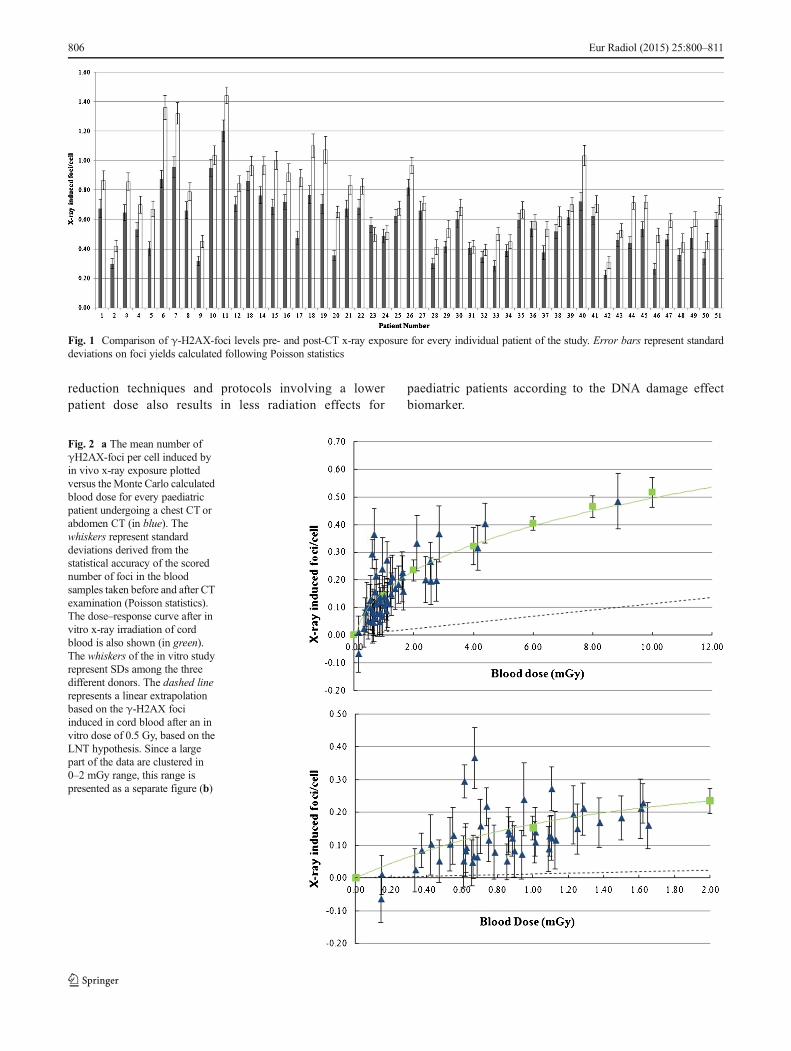
An increase in DNA DSBs was observed for every patient,except for one chest CT patient with a very low blood dose of0.14 mGy. The median pre-exposure level was 0.56 foci/cell(range 0.23–1.20 foci/cell) and the post-exposure level was0.72 foci/cell (range 0.31–1.44 foci/cell). The pre- and post-CT exposure foci levels are presented in Fig. 1 for everyindividual patient. The median number of induced focirepresenting DNA DSBs induced by CT was 0.13 foci/cell(range −0.07 to 0.49 foci/cell) and the median blood dose0.94 mGy (range 0.14–8.85 mGy). The present study showsthat nearly every CT procedure induces DNA DSBs in Tlymphocytes of paediatric patients. A Wilcoxon signed-ranktest showed a statistically significant difference in the meanlevel of DNA DSBs pre-CT and the mean level post-CT per
patient (p<0.001). Moreover, the number of induced DSBs isstrongly blood dose dependent as illustrated in Fig. 2.
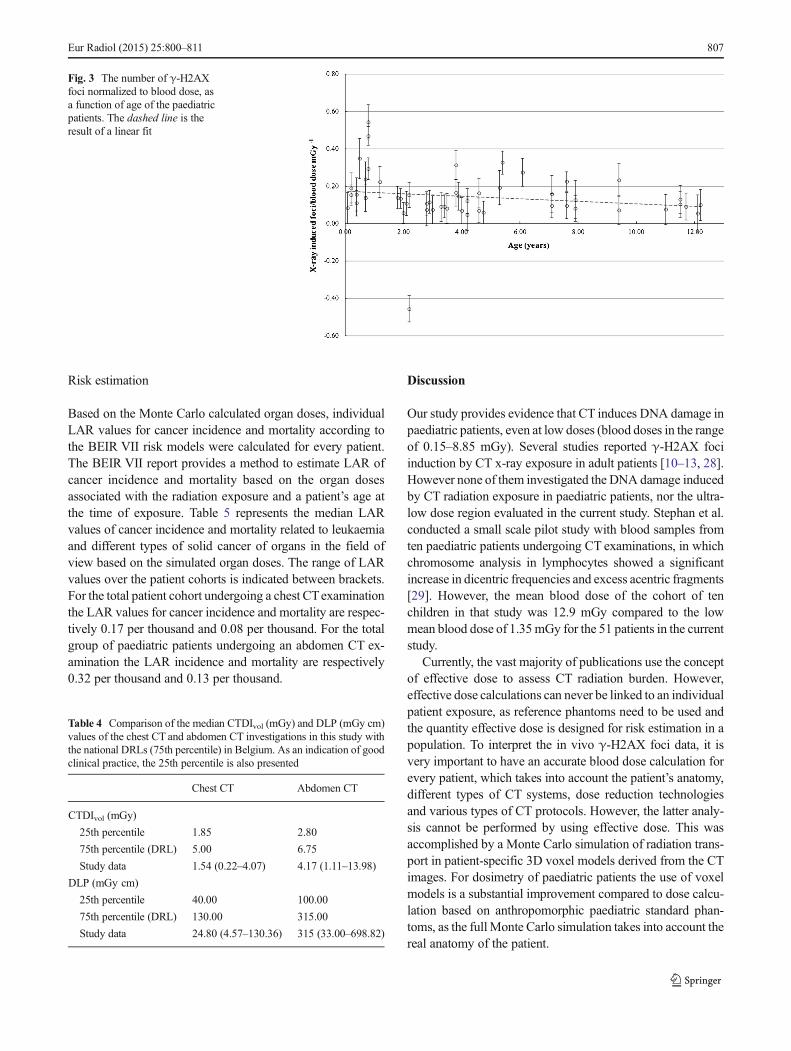
To investigate the intrinsic higher radiosensitivity of chil-dren decreasing with age, the number of induced γ-H2AXfoci was divided by the calculated blood dose and plottedversus age of the paediatric patient. The linear fit in Fig. 3indicates a diminishing trend of the foci-to-dose ratioversus age; however, regression analysis showed thatthe decrease of the foci-to-dose ratio versus age wasnot statistically significant (p=0.204).
In vitro dose–response study on umbilical cord blood samples
The results of the in vitro irradiation of umbilical cordblood, repeated for three different donors, are also pre-sented in Fig. 2. The in vivo and in vitro dose–responsecurves show both an initial sharp increase with doseand appear not linear at all. The dashed line in Fig. 2represents an extrapolation according to the LNT hy-pothesis of the in vitro dose response of γ-H2AX fociin cord blood at doses (5.68 γ-H2AX foci/cell for0.5 Gy) higher than zero. This shows clearly that the focinumbers in the low dose range are much higher than expectedfrom the LNT extrapolation of high dose behaviour.
Patient dosimetry
Monte Carlo calculations resulted in a median blooddose for chest CT patients of 0.86 mGy (0.14–2.84 mGy) and for abdomen CT patients of 1.62 mGy(0.66–8.85 mGy). The median effective dose value forthe chest CT patient cohort was 1.14 mSv (range 0.17–3.10 mSv). For the abdomen CT patient cohort, themedian effective dose value was higher, namely2.82 mSv (range 1.18–10.55 mSv). A comparison ofthese values with literature data confirms that in thepresent study patient doses were low [26, 27]. Allparticipating centres used state-of-the-art low doseequipment and specific paediatric protocols, resultingin very low CTDIvol and DLP values of the patientscompared with the national dose reference levels(DRLs) (Table 4). Reference levels are typically set atthe 75th percentile of the dose distribution from aconducted survey. The median CTDIvol and DLP valuesin the current study are below the 75th percentile valuesand close to the 25th percentile, which represents goodclinical practice. However, substantial differences indose-sparing equipment and imaging protocols for chil-dren resulted in differences in patient doses and corre-sponding DNA damage. Figure 4 shows a clear corre-lation between both parameters when comparing thedata for the different participating hospitals. This figureemphasizes that the use of more powerful dose
Eur Radiol (2015) 25:800–811 805
reduction techniques and protocols involving a lowerpatient dose also results in less radiation effects for
paediatric patients according to the DNA damage effectbiomarker.
Fig. 1 Comparison of γ-H2AX-foci levels pre- and post-CT x-ray exposure for every individual patient of the study. Error bars represent standarddeviations on foci yields calculated following Poisson statistics
Fig. 2 a The mean number ofγH2AX-foci per cell induced byin vivo x-ray exposure plottedversus the Monte Carlo calculatedblood dose for every paediatricpatient undergoing a chest CT orabdomen CT (in blue). Thewhiskers represent standarddeviations derived from thestatistical accuracy of the scorednumber of foci in the bloodsamples taken before and after CTexamination (Poisson statistics).The dose–response curve after invitro x-ray irradiation of cordblood is also shown (in green).The whiskers of the in vitro studyrepresent SDs among the threedifferent donors. The dashed linerepresents a linear extrapolationbased on the γ-H2AX fociinduced in cord blood after an invitro dose of 0.5 Gy, based on theLNT hypothesis. Since a largepart of the data are clustered in0–2 mGy range, this range ispresented as a separate figure (b)
806 Eur Radiol (2015) 25:800–811
Risk estimation
Based on the Monte Carlo calculated organ doses, individualLAR values for cancer incidence and mortality according tothe BEIR VII risk models were calculated for every patient.The BEIR VII report provides a method to estimate LAR ofcancer incidence and mortality based on the organ dosesassociated with the radiation exposure and a patient’s age atthe time of exposure. Table 5 represents the median LARvalues of cancer incidence and mortality related to leukaemiaand different types of solid cancer of organs in the field ofview based on the simulated organ doses. The range of LARvalues over the patient cohorts is indicated between brackets.For the total patient cohort undergoing a chest CTexaminationthe LAR values for cancer incidence and mortality are respec-tively 0.17 per thousand and 0.08 per thousand. For the totalgroup of paediatric patients undergoing an abdomen CT ex-amination the LAR incidence and mortality are respectively0.32 per thousand and 0.13 per thousand.
Discussion
Our study provides evidence that CT induces DNA damage inpaediatric patients, even at low doses (blood doses in the rangeof 0.15–8.85 mGy). Several studies reported γ-H2AX fociinduction by CT x-ray exposure in adult patients [10–13, 28].However none of them investigated the DNA damage inducedby CT radiation exposure in paediatric patients, nor the ultra-low dose region evaluated in the current study. Stephan et al.conducted a small scale pilot study with blood samples fromten paediatric patients undergoing CT examinations, in whichchromosome analysis in lymphocytes showed a significantincrease in dicentric frequencies and excess acentric fragments[29]. However, the mean blood dose of the cohort of tenchildren in that study was 12.9 mGy compared to the lowmean blood dose of 1.35mGy for the 51 patients in the currentstudy.
Currently, the vast majority of publications use the conceptof effective dose to assess CT radiation burden. However,effective dose calculations can never be linked to an individualpatient exposure, as reference phantoms need to be used andthe quantity effective dose is designed for risk estimation in apopulation. To interpret the in vivo γ-H2AX foci data, it isvery important to have an accurate blood dose calculation forevery patient, which takes into account the patient’s anatomy,different types of CT systems, dose reduction technologiesand various types of CT protocols. However, the latter analy-sis cannot be performed by using effective dose. This wasaccomplished by a Monte Carlo simulation of radiation trans-port in patient-specific 3D voxel models derived from the CTimages. For dosimetry of paediatric patients the use of voxelmodels is a substantial improvement compared to dose calcu-lation based on anthropomorphic paediatric standard phan-toms, as the fullMonte Carlo simulation takes into account thereal anatomy of the patient.
Fig. 3 The number of γ-H2AXfoci normalized to blood dose, asa function of age of the paediatricpatients. The dashed line is theresult of a linear fit
Table 4 Comparison of the median CTDIvol (mGy) and DLP (mGy cm)values of the chest CT and abdomen CT investigations in this study withthe national DRLs (75th percentile) in Belgium. As an indication of goodclinical practice, the 25th percentile is also presented
Chest CT Abdomen CT
CTDIvol (mGy)
25th percentile 1.85 2.80
75th percentile (DRL) 5.00 6.75
Study data 1.54 (0.22–4.07) 4.17 (1.11–13.98)
DLP (mGy cm)
25th percentile 40.00 100.00
75th percentile (DRL) 130.00 315.00
Study data 24.80 (4.57–130.36) 315 (33.00–698.82)
Eur Radiol (2015) 25:800–811 807

Fig. 4 The mean γ-H2AX fociper cell induced by CT x-raysplotted against the mean patientblood dose for participatingcentres. The CT equipment usedby the participating centres was asfollows: hospital A, GEDiscovery CT750 HD; hospitalB, GE Discovery CT750 HD(VEO); hospital C, SiemensSomatom Definition Flash andToshiba Aquilion; hospital D, GEDiscovery CT750 HD (VEO);hospital E, Siemens SomatomDefinition Flash and Sensation64. Whiskers represent thestandard deviation on the mean offoci numbers and blood doses
Table 5 LAR of cancer incidence and mortality, according to the BEIR VII model, associated with x-ray exposure from chest CT and abdomen CTexaminations for the cohort of paediatric patients included in the study
LARincidence (‰) LAR mortality (‰) LARincidence (‰) LAR mortality (‰)
Chest CT
Men (30) Women (11)
Age (year) 3.20 (0.20–11.50) 2.00 (0.10–12.20)
Blood dose (mGy) 0.81 (0.14–2.84) 0.86 (0.55–2.56)
Stomach 0.007 (0.001–0.017) 0.004 (0.001–0.009) 0.011 (0.005–0.033) 0.006 (0.003–0.019)
Liver 0.005 (0.001–0.011) 0.003 (0.001–0.008) 0.002 (0.001–0.005) 0.002 (0.001–0.005)
Lung 0.034 (0.006–0.130) 0.035 (0.006–0.131) 0.088 (0.049–0.275) 0.077 (0.043–0.241)
Breast – – 0.159 (0.048–0.415) 0.037 (0.011–0.097)
Thyroid 0.011 (0.002–0.032) – 0.078 (0.043–0.141) –
Remainder 0.037 (0.005–0.094) 0.014 (0.002–0.034) 0.038 (0.020–0.146) 0.014 (0.008–0.055)
Leukaemia 0.002 (0.000–0.007) 0.001 (0.000–0.004) 0.002 (0.001–0.003) 0.001 (0.000–0.002)
All cancers 0.099 (0.015–0.287) 0.055 (0.009–0.184) 0.378 (0.171–1.016) 0.137 (0.067–0.417)
Abdomen CT
Men (7) Women (3)
Age (years) 7.10 (1.80–12.10) 7.90 (6.10–11.00)
Blood dose (mGy) 1.61 (0.66–8.85) 1.38 (1.09–4.15)
Stomach 0.018 (0.007–0.058) 0.009 (0.004–0.030) 0.010 (0.008–0.035) 0.006 (0.005–0.020)
Colon 0.089 (0.035–0.337) 0.043 (0.017–0.158) 0.045 (0.028–0.110) 0.021 (0.013–0.051)
Liver 0.014 (0.006–0.047) 0.010 (0.004–0.033) 0.005 (0.002–0.013) 0.004 (0.002–0.011)
Lung 0.018 (0.011–0.065) 0.018 (0.011–0.063) 0.067 (0.031–0.068) 0.059 (0.027–0.059)
Prostate 0.024 (0.004–0.075) 0.005 (0.001–0.032) – –
Uterus – – 0.008 (0.005–0.021) 0.002 (0.001–0.005)
Ovary – – 0.021 (0.009–0.042) 0.011 (0.005–0.023)
Bladder 0.054 (0.010–0.176) 0.012 (0.002–0.037) 0.039 (0.002–0.099) 0.011 (0.006–0.028)
Remainder 0.077 (0.015–0.274) 0.027 (0.005–0.096) 0.100 (0.029–0.273) 0.025 (0.012–0.071)
Leukaemia 0.008 (0.002–0.029) 0.003 (0.001–0.018) 0.005 (0.004–0.015) 0.002 (0.002–0.009)
All cancers 0.318 (0.091–1.047) 0.131 (0.046–0.445) 0.329 (0.263–0.677) 0.130 (0.108–0.277)
Values are median (range), based on the individual simulated organ doses and the age of the individual patients
808 Eur Radiol (2015) 25:800–811

In addition the results of the present study show that lowerpatient doses related to more effective CT dose reductionstrategies for paediatric patients also result in a similar de-crease in DNA DSBs as effect biomarker. It is internationallyrecognized that CT dose optimization is essential, especiallyfor children taking into account not only dose reduction butalso diagnostic image quality. A number of CT dose surveysshowed substantial differences between practices for the sametype of examination, suggesting that not all institutions havesuitably optimized their CT protocols [30, 31]. Dose-savingstrategies are continuously evolving in terms of imaging tech-niques as well as dose management, and the results of thepresent study stress the importance of dose reduction in pae-diatric CT imaging. As already shown by the values of thecalculated blood doses and the comparison of DLP andCTDIvol values with national DRLs, paediatric CT radiationdoses were substantially low in all participating radiologydepartments. One of the institutions (hospital D in Fig. 4)achieved very low doses (mean blood dose, 0.71 mGy) byusing iterative reconstruction for all CT examinations; how-ever, only chest CT patients were recruited in this institution.For the patient cohort of institution D, a very low mean levelof induced γ-H2AX foci per cell (0.10 foci/cell) was recorded.Hospital E achieved a mean blood dose of 0.95 mGy corre-sponding to 0.13 induced foci/cell, and the data for thishospital are a mixture of chest CT and abdomen CT investi-gations. For both types of examination DLP values in thishospital were very low compared to the DRL (reported inTable 4). The median DLP value for abdomen CT patients inhospital E was 60.00 mGy cm (range 33.00–87.20 mGy cm),which is lower than the 25th percentile of 100 mGy cm.
When the number of induced γ-H2AX foci is plottedversus blood dose, the data point to a low-dose hypersensitiv-ity. The observed low-dose hypersensitive response in paedi-atric CT is consistent with the data of a previous study onpaediatric patients undergoing a cardiac catheterization [17].The in vitro dose–response curve for umbilical cord bloodshows the same behaviour in the low dose range and supportsthe in vivo results.
The observed low-dose hypersensitivity challenges theLNT hypothesis, assuming less DNA damage, and can beexplained by the “bystander effect” [32]. Genetic/epigeneticchanges occur not only in cells hit by the ionizing particles butalso in non-irradiated cells that are neighbouring directly hitcells. The bystander effect amplifies the effects of radiation byincreasing the number of affected cells, owing to cell–cellcommunication or soluble factors released by irradiated cells.Bystander effects are observed after co-cultivation of irradiat-ed and non-irradiated cells and transfer of medium fromirradiated to non-irradiated cells [33, 34]. For cells in directcontact, bystander signalling can occur through gap junctionintercellular communication [35, 36]. A second route bywhich bystander responses are mediated is through the release
of soluble factors from cells that have been irradiated. Thesefactors have been extensively studied and several of these keymolecules are central players involved in stress responses andcell–cell signalling, which are not generally specific to radia-tion exposure [35]. Moreover, many aspects of bystander-mediated response have close parallels to inflammatory re-sponses. This was recently shown in a gene set enrichmentanalysis that highlighted different gene expression profiles inwhole blood samples irradiated with low and high doses of x-rays. Functional analysis of genes differentially expressed at0.05 Gy showed the enrichment of chemokine and cytokinesignalling [37]. In a study by Mancuso et al., DNA damage,apoptosis and tumour induction were observed in the shieldedcerebellum of mice heterozygous for Patched after partial-body irradiations [38]. This indicates that bystander effectsin vivo have carcinogenic potential.
A possible confounder in the present study could be theincrease in DSB levels due to the administration of contrastagent and the corresponding emission of secondary radiationin CT imaging. However, previous studies showed that therewas no biological dose-enhancing effect if radiation and con-trast agent are within the diagnostic range [11, 39].
Epidemiological data indicate a higher relative risk ofcancer per unit of radiation dose for children compared toadults, and children have also a longer lifetime for radiation-related cancer to occur [2]. We observed a non-significant agedependency in our present study of x-ray-induced DNADSBs. To study age dependence, the study population shouldbe broadened and a more uniform distribution of the ages isrequired.
Using the calculated organ doses, the LAR for cancermortality in the paediatric patient population undergoing alow dose chest or abdomen CT was of the order of 0.1‰according to the BEIRVII data assuming the LNT hypothesis.The thyroid gland, breast tissue and gonads are structures thathave an increased sensitivity to radiation in growing children.Some of these regions, such as thyroid and breast tissue, areroutinely involved in chest CT imaging. Miglioretti et al.[27] calculated radiation exposure and LAR for cancerincidence from a random sample of paediatric CTs. Theircalculated LARs are an order of magnitude higher thanthose reported in the current study: abdomen CT 1–4‰versus 0.3‰ (median), chest CT 2–3‰ versus 0.1–0.4‰(median boys–girls). The main reason for the lower riskestimates in the current study are lower patient dosescompared to the work of Miglioretti et al. [27]. Theyreported a mean ED of 12.5 mSv for abdomen CT and6.3 mSv for chest CT, whereas in the present work themedian ED values were 2.8 mSv and 1.1 mSv respec-tively. The lower doses and corresponding risk estimatesin the current work reflect the use of contemporary state-of-the-art low dose CT equipment and the successfulimplementation of dose reduction strategies for paediatric
Eur Radiol (2015) 25:800–811 809
CT imaging by the participating radiology departments(as illustrated in Table 4).
Large uncertainties are associated with the risk estimatessummarized in Table 5. The BEIR VII committee estimatesthat the excess cancer mortality due to radiation can be esti-mated within a factor of 2 (at 95 % confidence level). Forleukaemia the corresponding factor is 4. The LNT modelapplied by the BEIR VII committee is based mainly on epi-demiological data for radiation-induced cancers in the atomicbomb survivors in the dose range of about 100 mSv to 2.5 Sv[8]. For lower doses involved in diagnostic radiology, epide-miological data are not available to support the LNT modelmainly owing to the necessary sample size [40]. Applicationof the LNT hypothesis in the low dose range may lead to anoverestimation of the risk in case of the existence of a dosethreshold or an underestimate in case of cooperative multicel-lular radiation effects such as bystander effects. It is anticipat-ed that significant insights into dose response and cancer risksin the low dose range will emerge from molecular epidemiol-ogy studies incorporating biomarkers and bioassays [41]. Thelow-dose hypersensitivity observed in the γ-H2AX foci doseresponse of the present study indicates that LAR estimatesbased on the LNT model may potentially underestimate therisks of paediatric CT imaging.
For conclusions with respect to the risk of stochastic effectsof x-rays, the present study has limitations. Biological damagein T lymphocytes reflects only the damage in one tissue,namely the blood. However, we may assume that DNA dam-age and repair in peripheral blood lymphocytes are represen-tative for other normal tissues [42]. Using the γ-H2AX fociassay, only DNADSBs induced by CT x-rays are detected butnot the outcome of the DNA repair process. DNA DSBs areconsidered to be particularly biologically important becausetheir repair is more difficult than other types of DNA damage.Cells have evolved mechanisms to monitor genome integrityand they respond to DNA damage by activating a complexDNA damage response pathway. Erroneous repair of DNADSBs can result in chromosomal rearrangements, includingtranslocations, which are associated with tumorigenesis [43].An increase in chromosomal aberrations due to a defect inDNA repair, as observed in ataxia-telangiectasia (AT) patients,leads to genetic instability, which in turn enhances the rate ofcancer development [44]. In the framework of cancer risk, adirect assessment of mutations in DNA or chromosomal ab-errations induced by CT x-rays in paediatric patients’ lym-phocytes would provide added value taking into account themutagen–carcinogen link. However, this kind of study is notobvious in view of the low sensitivity of contemporary muta-genicity assays.
The present study emphasizes the need to optimize andminimize radiation exposure in paediatric CT imaging: lowerpatient doses entail less DNA damage in children. This im-plies the need for justification of the indications for which
medical imaging involving ionizing radiation is used. From apatient’s perspective, the benefits of a medically necessary CTscan far exceed the small radiation-induced cancer risk. How-ever, some studies suggest that a third of paediatric CT scansare unnecessary [1]. This indicates that the referring physicianand radiologist should consider whether the exam is trulyclinically indicated and was not recently performed in anotherhospital. Furthermore, they should check if no alternativediagnostic procedure might be available, one not involvingionizing radiation such as ultrasound and MRI. When CT isindicated, great care should be taken to optimize radiationexposures in order to minimize the risk for carcinogeniceffects later in life. Strategies to optimize radiation doses inpaediatric CT imaging are adjustment of the CT parameters tothe child’s size (guidelines on individual size/weight parame-ters [45]), the scan length should be restricted to the region ofinterest and dose reduction techniques should be implementedtaking into account the required image quality (ATM, iterativereconstruction and/or adaptive collimation). The observationsof the present work should encourage medical practitioners tomaximize the benefit-to-risk ratio of CT imaging in paediatricradiology.
Acknowledgments Wewish to thank all patients and their parents whoconsented to participate in this study. We also express our gratitude toHilde Vandenhout, Ilse Roebben and the nurses of the participatinghospitals for their help with the collection of blood samples. A specialthank you to Dr. Wim Decaluwe from the neonatology department at AZSint-Jan, Bruges, for his support and dedication to this study. Further-more, we acknowledge the master thesis students for their help withprocessing of the blood samples. Above all, we would like to thank IrisRossaert, Virginie De Gelder and Sofie De Langhe for their practicalsupport. The study was financially supported by the Federal Agency ofNuclear Control, Belgium (CO-90-09-2329-00).
The scientific guarantor of this publication is Prof. Hubert Thierens.The authors of this manuscript declare no relationships with any compa-nies whose products or services may be related to the subject matter of thearticle. No complex statistical methods were necessary for this paper.Institutional review board approval was obtained. Written informed con-sent was obtained from all subjects (patients) in this study. Methodology:prospective, experimental, multicenter study.
Open AccessThis article is distributed under the terms of the CreativeCommons Attribution Noncommercial License which permits any non-commercial use, distribution, and reproduction in any medium, providedthe original author(s) and the source are credited.
References
1. Brenner DJ, Hall EJ (2007) Current concepts - computed tomography -an increasing source of radiation exposure. N Engl J Med357:2277–2284
2. UNSCEAR (2013) Sources, effects and risks of ionizing radiation.Report to the General Assembly of the United. Nations, New York
3. Nievelstein RAJ, van Dam IM, van der Molen AJ (2010)Multidetector CT in children: current concepts and dose reductionstrategies. Pediatr Radiol 40:1324–1344
810 Eur Radiol (2015) 25:800–811

4. Strauss KJ, Goske MJ, Kaste SC et al (2010) Image gently: ten stepsyou can take to optimize image quality and lower CT dose forpediatric patients. Am J Roentgenol 194:868–873
5. Gay F, Pavia Y, Pierrat N, Lasalle S, Neuenschwander S, Brisse HJ(2014) Dose reduction with adaptive statistical iterative reconstruc-tion for paediatric CT: phantom study and clinical experience onchest and abdomen CT. Eur Radiol 24:102–111
6. Brady SL, Moore BM, Yee BS, Kaufman RA (2014) Pediatric CT:implementation of ASIR for substantial radiation dose reductionwhile maintaining pre-ASIR image noise. Radiology 270:223–231
7. Pearce MS, Salotti JA, Little MP et al (2012) Radiation exposurefrom CT scans in childhood and subsequent risk of leukaemia andbrain tumours: a retrospective cohort study. Lancet 380:499–505
8. Preston DL, Shimizu Y, Pierce DA, Suyama A, Mabuchi K (2012)Studies of mortality of atomic bomb survivors. Report 13: solidcancer and noncancer disease mortality: 1950-1997. Radiat Res178:AV146–AV172
9. MorganWF, BairWJ (2013) Issues in low dose radiation biology: thecontroversy continues. A perspective. Radiat Res 179:501–510
10. Rothkamm K, Balroop S, Shekhdar J, Fernie P, Goh V (2007)Leukocyte DNA damage after multi-detector row CT: A quantitativebiomarker of low-level radiation exposure. Radiology 242:244–251
11. Beels L, Bacher K, Smeets P, Verstraete K, Vral A, Thierens H (2012)Dose-length product of scanners correlates with DNA damage inpatients undergoing contrast CT. Eur J Radiol 81:1495–1499
12. Lobrich M, Rief N, Kuhne M et al (2005) In vivo formation andrepair of DNA double-strand breaks after computed tomographyexaminations. Proc Natl Acad Sci U S A 102:8984–8989
13. Kuefner MA, Grudzenski S, Hamann J et al (2010) Effect of CTscanprotocols on x-ray-induced DNA double-strand breaks in bloodlymphocytes of patients undergoing coronary CT angiography. EurRadiol 20:2917–2924
14. RothkammK,Horn S (2009) gamma-H2AX as protein biomarker forradiation exposure. Ann Ist Super Sanita 45:265–271
15. RothkammK, LobrichM (2003) Evidence for a lack of DNA double-strand break repair in human cells exposed to very low x-ray doses.Proc Natl Acad Sci U S A 100:5057–5062
16. Beels L, Werbrouck J, Thierens H (2010) Dose response and repairkinetics of gamma-H2AX foci induced by in vitro irradiation ofwhole blood and T-lymphocytes with x- and gamma-radiation. Int JRadiat Biol 86:760–768
17. Beels L, Bacher K, De Wolf D, Werbrouck J, Thierens H (2009)gamma-H2AX foci as a biomarker for patient x-ray exposure inpediatric cardiac catheterization are we underestimating radiationrisks? Circulation 120:1903–1909
18. Carroll PD, Nankervis CA, Iams J, Kelleher K (2012) Umbilical cordblood as a replacement source for admission complete blood count inpremature infants. J Perinatol 32:97–102
19. Valentin J (2002) Basic anatomical and physiological data for use inradiological protection: reference values: ICRP Publication 89. AnnICRP 32:1–277
20. Deak P, van Straten M, Shrimpton PC, Zankl M, Kalender WA(2008) Validation of a Monte Carlo tool for patient-specific dosesimulations in multi-slide computed tomography. Eur Radiol 18:759–772
21. CristyM (1981) Active bone-marrow distribution as a function of agein humans. Phys Med Biol 26:389–400
22. Seuntjens J, Thierens H, Vanderplaetsen A, Segaert O (1987)Conversion factor F for x-ray beam qualities, specified by peak tubepotential and HVL value. Phys Med Biol 32:595–603
23. Deak PD, Smal Y, Kalender WA (2010) Multisection CT protocols:sex- and age-specific conversion factors used to determine effectivedose from dose-length product. Radiology 257:158–166
24. Council NR (2006) Health risks from exposure to low levels ofionizing radiation: BEIR VII phase 2. The National AcademiesPress, Washington DC
25. International Commission on Radiological Protection (2007) The2007 recommendations of the International Commission onRadiological Protection. ICRP publication 103. Ann ICRP 37(2–4)
26. Thomas KE, Wang B (2008) Age-specific effective doses for pediat-ric MSCT examinations at a large children’s hospital using DLPconversion coefficients: a simple estimation method. Pediatr Radiol38:645–656
27. Miglioretti DL, Johnson E, Williams A et al (2013) The use ofcomputed tomography in pediatrics and the associated radiationexposure and estimated cancer risk. JAMA Pediatr 167:700–707
28. Geisel D, Zimmermann E, Rief M et al (2012) DNA double-strandbreaks as potential indicators for the biological effects of ionisingradiation exposure from cardiac CT and conventional coronary angi-ography: a randomised, controlled study. Eur Radiol 22:1641–1650
29. Stephan G, Schneider K, Panzer W, Walsh L, Oestreicher U (2007)Enhanced yield of chromosome aberrations after CT examinations inpaediatric patients. Int J Radiat Biol 83:281–287
30. Shrimpton PC, Hillier MC, Lewis MA, Dunn M (2006) Nationalsurvey of doses from CT in the UK: 2003. Br J Radiol 79:968–980
31. Pages J, Buls N, Osteaux M (2003) CT doses in children: amulticentre study. Br J Radiol 76:803–811
32. Morgan WF (2012) Non-targeted and delayed effects of exposure toionizing radiation: I. Radiation-induced genomic instability and by-stander effects in vitro. Radiat Res 178:AV223–AV236
33. Little JB, Azzam EI, de Toledo SM, Nagasawa H (2005)Characteristics and mechanisms of the bystander response in mono-layer cell cultures exposed to very low fluences of alpha particles.Radiat Phys Chem 72:307–313
34. Sokolov MV, Smilenov LB, Hall EJ, Panyutin IG, Bonner WM,Sedelnikova OA (2005) Ionizing radiation induces DNA double-strand breaks in bystander primary human fibroblasts. Oncogene24:7257–7265
35. Prise KM, O’Sullivan JM (2009) Radiation-induced bystander sig-nalling in cancer therapy. Nat Rev Cancer 9:351–360
36. Azzam EI, de Toledo SM, Little JB (2001) Direct evidence for theparticipation of gap junction-mediated intercellular communicationin the transmission of damage signals from alpha-particle irradiated tononirradiated cells. Proc Natl Acad Sci U S A 98:473–478
37. El-Saghire H, Thierens H, Monsieurs P, Michaux A, Vandevoorde C,Baatout S (2013) Gene set enrichment analysis highlights differentgene expression profiles in whole blood samples X-irradiated withlow and high doses. Int J Radiat Biol 89:628–638
38. Mancuso M, Pasquali E, Leonardi S et al (2008) Oncogenic bystand-er radiation effects in Patched heterozygous mouse cerebellum. ProcNatl Acad Sci U S A 105:12445–12450
39. Jost G, Golfier S, Pietsch H et al (2009) The influence of x-raycontrast agents in computed tomography on the induction of dicen-trics and gamma-H2AX foci in lymphocytes of human blood sam-ples. Phys Med Biol 54:6029–6039
40. Brenner D, Doll R, Goodhead D et al (2003) Cancer risks attributableto low doses of ionizing radiation: Assessing what we really know.Proc Natl Acad Sci U S A 100:13761–13766
41. Pernot E, Hall J, Baatout S et al (2012) Ionizing radiation biomarkersfor potential use in epidemiological studies. Mutat Res 751:258–286
42. Rübe CE, Grudzenski S, Kühne M et al (2008) DNA double-strandbreak repair of blood lymphocytes and normal tissues analysed in apreclinical mouse model: implication for radiosensitivity testing. ClinCancer Res 14:6546–6555
43. Richardson C, Jasin M (2000) Frequent chromosomal translocationsinduced by DNA double-strand breaks. Nature 405:697–700
44. Khanna KK, Jackson SP (2001) DNA double-strand breaks: signal-ling, repair and the cancer connection. Nat Genetics 27:247–253
45. Singh S, Kalra MK, Moore MA et al (2009) Dose reductionand compliance with pediatric CT protocols adapted to patientsize, clinical indication, and number of prior studies. Radiology252:200–208
Eur Radiol (2015) 25:800–811 811

![BRCA1FormsaFunctionalComplexwith γ-H2AXas ...downloads.hindawi.com/journals/jna/2010/801594.pdf · DNA synthesis [4]. S phosphorylation of H2AX is greatly ... Cantharidin and Microcystin-LR]](https://static.fdocument.org/doc/165x107/608d1637b9c78d235d1657d5/brca1formsafunctionalcomplexwith-h2axas-dna-synthesis-4-s-phosphorylation.jpg)