β family signaling GOALS
122
Effects of obesity on the transcriptional regulation of protein degradation in skeletal muscle by Lance M. Bollinger November, 2013 Director of Thesis/Dissertation: Jeffrey J. Brault Major Department: Kinesiology Protein degradation is a major cause of skeletal muscle atrophy and is, at least in part, regulated at the level of gene transcription. While obesity is characterized by impaired skeletal muscle carbohydrate and lipid metabolism, the effects of obesity on skeletal muscle protein metabolism, specifically protein degradation, have not been thoroughly examined. Despite increased skeletal muscle mass, skeletal muscle of the severely obese overexpresses protein degradation genes, most notably, myostatin, which increases protein degradation by activating the transcription factor SMAD3, a mediator of transforming growth factor-β family signaling. GOALS: The aims of the present project were: 1) to determine how obesity affects skeletal muscle protein degradation mediated by the ubiquitin-proteasome system and the autophagic/lysosomal pathway, particularly at the level of gene expression and 2) to determine the role of SMAD3 in regulating gene transcription of MuRF-1, a gene involved in degradation of contractile proteins. METHODS: In order to accomplish these goals, primary human skeletal muscle (HSkMC) myotubes from lean and severely obese women were subjected to various atrophic stimuli (100nM dexamethasone or starved of serum and amino acids) and analyzed for gene expression and flux through
Transcript of β family signaling GOALS
Effects of obesity on the transcriptional regulation of protein degradation in skeletal
muscle
by
Lance M. Bollinger
November, 2013
Director of Thesis/Dissertation: Jeffrey J. Brault
Major Department: Kinesiology
Protein degradation is a major cause of skeletal muscle atrophy and is, at least in
part, regulated at the level of gene transcription. While obesity is characterized by
impaired skeletal muscle carbohydrate and lipid metabolism, the effects of obesity on
skeletal muscle protein metabolism, specifically protein degradation, have not been
thoroughly examined. Despite increased skeletal muscle mass, skeletal muscle of the
severely obese overexpresses protein degradation genes, most notably, myostatin,
which increases protein degradation by activating the transcription factor SMAD3, a
mediator of transforming growth factor-β family signaling. GOALS: The aims of the
present project were: 1) to determine how obesity affects skeletal muscle protein
degradation mediated by the ubiquitin-proteasome system and the
autophagic/lysosomal pathway, particularly at the level of gene expression and 2) to
determine the role of SMAD3 in regulating gene transcription of MuRF-1, a gene
involved in degradation of contractile proteins. METHODS: In order to accomplish
these goals, primary human skeletal muscle (HSkMC) myotubes from lean and severely
obese women were subjected to various atrophic stimuli (100nM dexamethasone or
starved of serum and amino acids) and analyzed for gene expression and flux through
the major protein degradation pathways. Additionally, MuRF-1 promoter activity and
RNA content were measured following co-expression of SMAD3 and FoxO3, a
transcription factor known to induce MuRF-1 gene expression and cause muscle
atrophy. RESULTS: Myotubes from the obese significantly overexpressed FoxO3, had
a decreased rate of flux through the autophagic/lysosomal pathway, and increased
proteasome capacity compared to lean. Despite these differences, myotubes from lean
and obese women atrophied at similar rates and displayed similar total protein
degradation rates under basal and starved conditions. Additionally, SMAD3
overexpression was insufficient to induce MuRF-1 promoter activity or gene expression,
but synergistically augmented FoxO3-induced MuRF-1 gene expression by increasing
FoxO3 protein content and enhancing FoxO3 binding to the proximal MuRF-1 promoter
region. Furthermore, knockdown of SMAD3, via overexpression of a dominant-negative
SMAD3, significantly attenuated FoxO3-induced MuRF-1 promoter activity. Mutation of
the SMAD Binding Element (SBE) within the MuRF-1 promoter region attenuated FoxO3
binding to the FoxO Response Element (FRE), indicating SMAD3 is required for optimal
FoxO3-induced MuRF-1 gene transcription. CONCLUSIONS: Skeletal muscle of the
severely obese displays altered flux through the major protein degradation pathways,
which may contribute to some of the metabolic impairments associated with obesity.
However, severe obesity does not affect the total protein degradation rate or rate of
muscle atrophy. Furthermore, SMAD3 regulates MuRF-1 gene transcription through
dual mechanisms: 1) increasing FoxO3 protein content and 2) increasing FoxO3
binding within the proximal MuRF-1 promoter region. Atrophic conditions that increase
SMAD3 transcriptional activity may augment FoxO3-induced transcription of protein
degradation genes and accelerate muscle atrophy. Due to the observed overexpression

of FoxO3, skeletal muscle of the severely obese may be more susceptible than that of
lean persons to atrophy under conditions that increase expression and/or activity of
SMAD3.
Effects of obesity on the transcriptional regulation of protein degradation in skeletal
muscle
A Dissertation
Presented To the Faculty of the Department of Kinesiology
East Carolina University
In Partial Fulfillment of the Requirements for the Degree
Doctor of Philosophy
by
Lance M. Bollinger
November, 2013


© Lance M. Bollinger, 2013
Effects of obesity on the transcriptional regulation of protein degradation in skeletal
muscle
by
Lance M. Bollinger
APPROVED BY:
DIRECTOR OF
DISSERTATION/THESIS: _______________________________________________________
(Jeffrey J. Brault, Ph.D.)
COMMITTEE MEMBER: ________________________________________________________
(Joseph A. Houmard, Ph.D.)
COMMITTEE MEMBER: _______________________________________________________
(Robert C. Hickner, Ph.D.)
COMMITTEE MEMBER: _______________________________________________________
(David A. Tulis, Ph.D.)
CHAIR OF THE DEPARTMENT
OF Kinesiology: ________________________________________________________________
(Stacey Altman, J.D.)
DEAN OF THE
GRADUATE SCHOOL: _________________________________________________________
Paul J. Gemperline, PhD

ACKNOWLEDGEMENTS
I would like to thank my mentor, Dr. Jeffrey J. Brault for his support throughout
my doctoral career. Additionally, I would like to thank Dr. Carol A. Witczak for her
intellectual input, technical assistance, and generosity with her laboratory equipment
and materials. I would also like to thank Dr. Joseph A. Houmard for providing me with
the primary cell cultures used throughout this project and Dr. Jill Maples for her
tremendous assistance with the technical aspects of these cultures. I would like to
thank the American College of Sports Medicine for their financial support. I would also
like to thank my fellow students for their contributions, both intellectual and technical.
Special thanks are due to J. Matthew Hinkley, Jonathon J. Powell, Patrick Davis, and
Sanghee Park. On a personal level, I would like to thank my family. Thank you to my
son, Henry for always brightening my day when I return from work. Finally, I would like
to thank my beautiful wife, Emily, for her support, encouragement, and motivation.
LIST OF TABLES
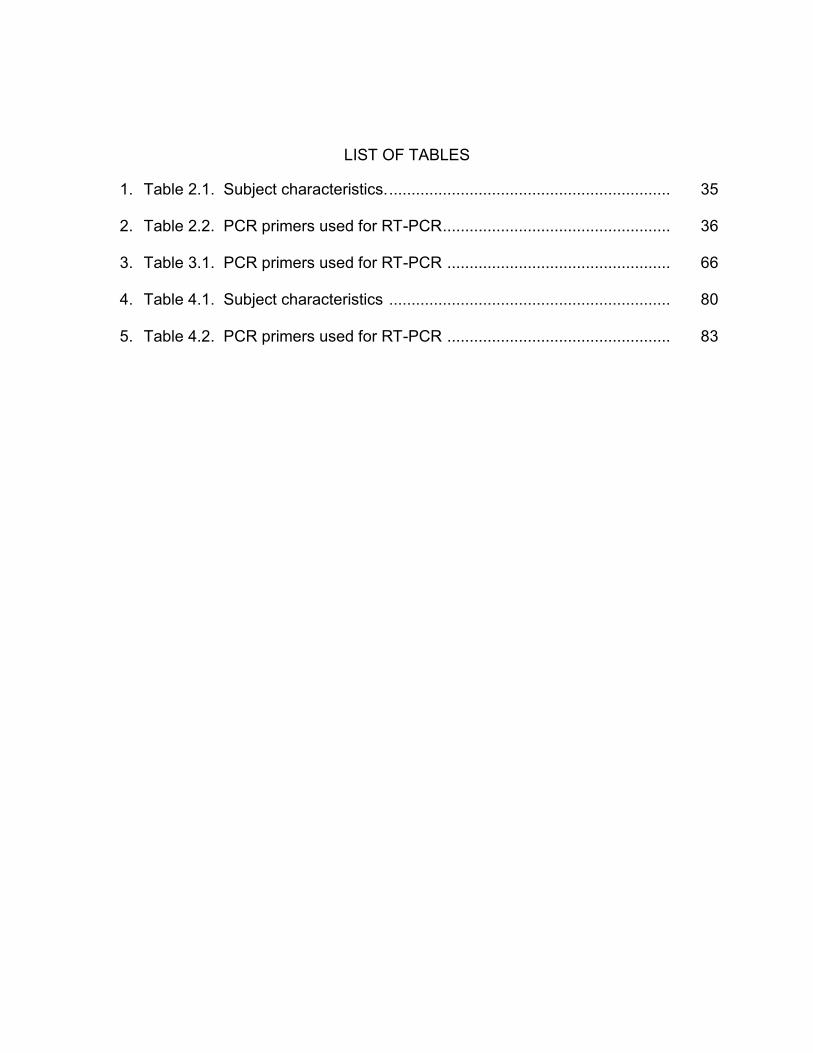
1. Table 2.1. Subject characteristics. ............................................................... 35
2. Table 2.2. PCR primers used for RT-PCR ................................................... 36
3. Table 3.1. PCR primers used for RT-PCR .................................................. 66
4. Table 4.1. Subject characteristics ............................................................... 80
5. Table 4.2. PCR primers used for RT-PCR .................................................. 83
LIST OF FIGURES
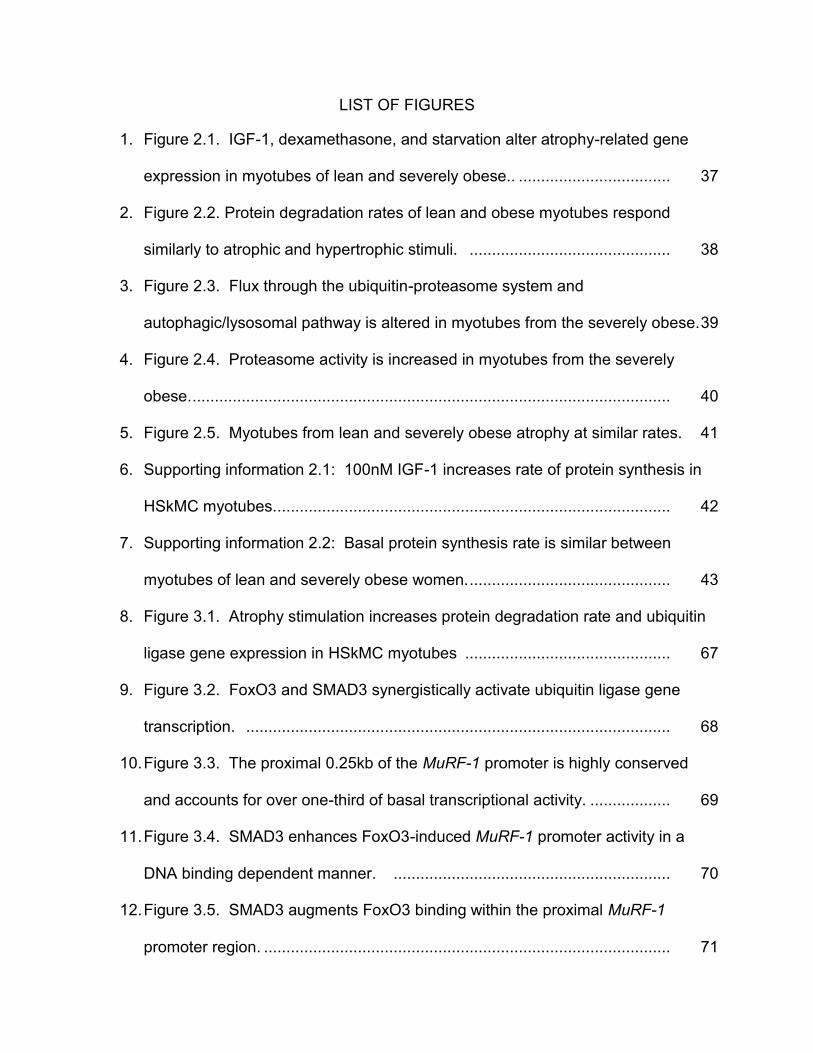
1. Figure 2.1. IGF-1, dexamethasone, and starvation alter atrophy-related gene
expression in myotubes of lean and severely obese.. .................................. 37
2. Figure 2.2. Protein degradation rates of lean and obese myotubes respond
similarly to atrophic and hypertrophic stimuli. ............................................. 38
3. Figure 2.3. Flux through the ubiquitin-proteasome system and
autophagic/lysosomal pathway is altered in myotubes from the severely obese. 39
4. Figure 2.4. Proteasome activity is increased in myotubes from the severely
obese. ........................................................................................................... 40
5. Figure 2.5. Myotubes from lean and severely obese atrophy at similar rates. 41
6. Supporting information 2.1: 100nM IGF-1 increases rate of protein synthesis in
HSkMC myotubes. ........................................................................................ 42
7. Supporting information 2.2: Basal protein synthesis rate is similar between
myotubes of lean and severely obese women. ............................................. 43
8. Figure 3.1. Atrophy stimulation increases protein degradation rate and ubiquitin
ligase gene expression in HSkMC myotubes .............................................. 67
9. Figure 3.2. FoxO3 and SMAD3 synergistically activate ubiquitin ligase gene
transcription. ............................................................................................... 68
10. Figure 3.3. The proximal 0.25kb of the MuRF-1 promoter is highly conserved
and accounts for over one-third of basal transcriptional activity. .................. 69
11. Figure 3.4. SMAD3 enhances FoxO3-induced MuRF-1 promoter activity in a
DNA binding dependent manner. .............................................................. 70
12. Figure 3.5. SMAD3 augments FoxO3 binding within the proximal MuRF-1
promoter region. ........................................................................................... 71
LIST OF FIGURES (cont.)
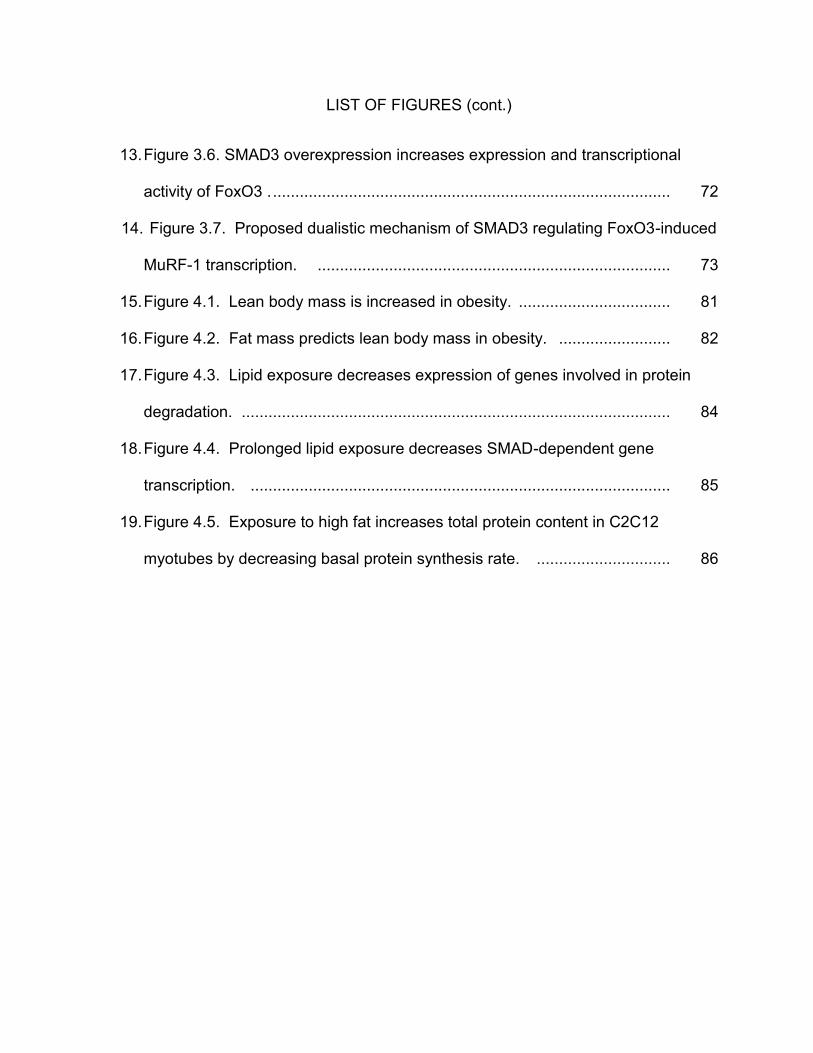
13. Figure 3.6. SMAD3 overexpression increases expression and transcriptional
activity of FoxO3 . ......................................................................................... 72
14. Figure 3.7. Proposed dualistic mechanism of SMAD3 regulating FoxO3-induced
MuRF-1 transcription. ............................................................................... 73
15. Figure 4.1. Lean body mass is increased in obesity. .................................. 81
16. Figure 4.2. Fat mass predicts lean body mass in obesity. ......................... 82
17. Figure 4.3. Lipid exposure decreases expression of genes involved in protein
degradation. ................................................................................................ 84
18. Figure 4.4. Prolonged lipid exposure decreases SMAD-dependent gene
transcription. .............................................................................................. 85
19. Figure 4.5. Exposure to high fat increases total protein content in C2C12
myotubes by decreasing basal protein synthesis rate. .............................. 86
TABLE OF CONTENTS
Abstract ................................................................................................……. i
List of Tables ................................................................................................…….ix
List of Figures ................................................................................................ …….x
Chapter 1: Global introduction and literature review ...............................................……. 1
CHAPTER 2: Myotubes from lean and severely obese women degrade proteins at
similar rates despite altered ubiquitin-proteasome system and autophagic/lysosomal
pathway flux
Abstract ………………………………………………………………………………….…….…..9
Introduction …………………………………………………………………………………………..11
Methods …………………………………………………………………………………………..14
Results………………………………………………………………………………….21
Discussion …………………………………………………………………………………………..28
Tables and Figures ………………………………..……………………..……………………...….34
CHAPTER 3: SMAD3 regulates FoxO-induced MuRF-1 gene transcription via dual
mechanismsClick here to enter text.
Abstract …………………………………………………………………………………………..44
Introduction …………………………………………………………………………………………..46
Methods …………………………………………………………………………………………..49
Results ………………………………………………………………………………………………….55
Discussion …………………………………………………………………………………………..61
Tables and Figures ……………………………………....…………………………………………65
CHAPTER 4: Supplemental data
Rationale …………………………………………………………………………………………..74
Methods ……………………………………....…………………………………………………75
Tables and Figures…………………………………………………………………….79

TABLE OF CONTENTS (cont.)
CHAPTER 5: Global discussion…………………………………………………………….87
REFERENCES …. ...........................................................................................….100
APPENDIX A: Institutional review board approval..................................................…. 109
Chapter 1: Global introduction and literature review
Importance of Protein Degradation in Obesity:
Severely decreased skeletal muscle mass, or muscle atrophy, affects over five
million American adults, frequently presents secondary to other physiological (aging,
fasting, or physical inactivity) or pathological (diabetes, heart failure, renal failure,
respiratory disease, or cancer) conditions (68), and is a major cause of disability (47)
and death (64, 71, 80, 95). Despite a plethora of negative consequences, obesity is
accompanied by increased skeletal muscle mass (27, 69), fiber diameter (28), and
strength (53). The molecular mechanism(s) underlying the observed hypertrophic
phenotype in obesity is not well understood. Furthermore, obesity exacerbates the
negative effects of muscle atrophy; the combination of obesity and muscle atrophy
increases risk of death to a greater extent than either condition independently (80).
However, it is not known whether obesity per se increases the risk of developing muscle
atrophy.
Myocellular size, and therefore, skeletal muscle mass is dictated by the balance
between the rates of protein synthesis and degradation (34). Interestingly, the protein
synthesis response to muscle atrophy is highly variable. While many cachectic
conditions are associated with decreased protein synthesis rates, it has previously been
demonstrated that immobilization-induced atrophy occurs despite no change in protein
synthesis rates (51). However, protein degradation rate increases in all known models
of muscle atrophy (13, 54, 82). Obese mice (92), rats (74), and humans (23, 75) have a
blunted hypertrophic response to muscle overload and feeding (27). Therefore, it is
2
unlikely that the increased skeletal muscle mass observed in obesity is due to an
increased rate of protein synthesis.
The effects of obesity on protein degradation are poorly understood and remain
controversial (48). During fasting, the typical increase in proteolysis is blunted in obese
humans (27, 73). In contrast to these findings, Felig et al. (24) noted increased
proteolysis in obesity as indicated by elevated plasma amino acids following an
overnight fast. Protein degradation at the whole-body level has been shown to be
increased in obesity (39, 103). Furthermore, diet-induced obesity increases expression
of genes involved in protein degradation such as myostatin (42, 72). Due to these
discrepant findings, the effects of obesity on skeletal muscle protein degradation remain
controversial.
Protein degradation is mediated primarily by two pathways, the ubiquitin-
proteasome system (UPS) and the autophagic/lysosomal pathway (11, 107), and is
essential for proper cellular function due to its role in eliminating damaged, misfolded or
non-functional proteins and protein aggregates (66). Accelerated protein degradation is
a major cause of muscle atrophy (65).
While the mechanisms controlling protein degradation are complex, it appears
that numerous cachectic conditions share a common transcriptional response to
increase protein degradation (13, 54, 82). Using RNA microarray analysis, Lecker et al.
(54) identified over 700 genes that were coordinately up- or down-regulated in at least
two cachectic conditions and 133 that were coordinately regulated in four. Interestingly,
the transcriptional response to increase protein degradation appears to be largely driven
3
by only a few transcription factors, most notably FoxO (83, 93, 107) and SMAD3 (13,
35, 56, 85). Unfortunately, the cellular mechanisms that transcriptionally regulate flux
through the major protein degradation pathways are incompletely understood,
especially in obesity.
Protein Degradation Pathways
Protein degradation is mediated primarily by two pathways with functionally
distinct roles: the ubiquitin-proteasome system (UPS) and the autophagic/lysosomal
pathway (84). Together, these systems account for greater than 90% of protein
degradation in mammalian cells and flux through both pathways is increased during
muscle atrophy (11, 107).
The ubiquitin-proteasome system (UPS) selectively degrades proteins in an ATP-
dependent manner (22, 70) and accounts for approximately 70% of total protein
degradation in mammals (46). The UPS consists of a multitude of highly regulated
proteins that selectively tag and degrade damaged, misfolded, or unnecessary proteins
(40, 104). Ubiquitin ligases selectively attach polyubiquitin chains to target proteins
which are recognized by the 19S cap of the proteasome. Proteins are then unfolded
and degraded by the 20S proteasome and constitutive amino acids and ubiquitin are
recycled. Flux through the UPS is dependent on protein ubiquitination as well as
proteasome subunit composition and binding partners that alter catalytic activity of the
proteasome (21, 76).
4
UPS-mediated protein degradation is regulated, at least in part, by gene
transcription. Gene expression of two muscle-specific ubiquitin ligases, Muscle-Specific
RING Finger-1 (MuRF-1) and Atrogin-1, increases dramatically during muscle atrophy
(54, 82). These ubiquitin ligases have functionally distinct roles, but both are essential
for muscle atrophy (8). MuRF-1 functions primarily to target proteins of the thick
filament for proteasome-mediated protein degradation (17, 18). Atrogin-1 promotes
degradation of eukaryotic translation initiation factor 3F (eIF3-F) (20), desmin and
vimentin (58). Additionally, Atrogin-1 putatively interacts with sarcomeric proteins (58).
Transcription of Atrogin-1 and MuRF-1 is largely dependent on the transcription factor
Forkhead box “O” (FoxO) (83, 93, 100). During muscle atrophy, activating the PI3K/Akt
pathway with IGF-1 results in a marked phosphorylation and cytosolic sequestration of
FoxO1 and FoxO3, prevents upregulation of ubiquitin ligases, and preserves
myocellular size (93). Interestingly, MuRF-1 protein is higher in skeletal muscle of the
obese (91), suggesting flux through this pathway may be disrupted in obesity.
Like the UPS, the autophagic/lysosomal pathway is a major contributor to protein
degradation (84). It has recently been reported that, compared to the UPS, the
autophagic/lysosomal pathway is upregulated to a greater extent during muscle atrophy
(11, 107). While the autophagic/lysosomal pathway can selectively degrade specific
individual proteins, one major role of this pathway is degradation of organelles such as
mitochondria (32). Autophagosomes, double membraned vesicles form within the cell,
recognize and engulf cellular material labeled for degradation. Autophagosomes fuse
with lysosomes to form autophagolysosomes and hydrolases contained within the
lysosome non-selectively degrade proteins and organelles contained within the vesicle.
5
Impaired flux through the autophagic/lysosomal pathway has been shown to result in
accumulation of damaged mitochondria and cause insulin resistance (106). Therefore,
it is possible that impaired autophagic/lysosomal flux may contribute to some of the
metabolic perturbations associated with obesity.
Importantly, the autophagic/lysosomal pathway, like the UPS, appears to be
transcriptionally regulated. Microtubule-associated protein 1 light chain 3β (LC3)
associates with the inner membrane of autophagosomes and proteins labeled for
degradation, thus committing these proteins to the autophagosome. Due to its location
within the autophagosome, LC3 is degraded by lysosome hydrolases within the
autophagolysosome. Therefore, transcription of LC3 must increase in order to replenish
that consumed during protein degradation (98). Therefore, in order to sustain
autophagic/lysosomal-mediated protein degradation, transcription of LC3 must be
increased. Recently, Zhao et al. (107) demonstrated that FoxO3 overexpression
increases gene expression of LC3, Gabarapl-1, and Atg12 in muscle cells.
Transcription factors regulating protein degradation
Forkhead box type “O” (FoxO) coordinately regulates both UPS and
autophagic/lysosomal-mediated protein degradation by increasing transcription of genes
essential to these pathways. Knockdown of FoxO (81, 87) is sufficient to preserve
muscle mass during atrophic conditions indicating that FoxO-induced gene transcription
is essential for increased protein degradation. FoxO transcription factors recognize the
consensus FoxO Response Element (FRE) (A/G)TAAA(T/C)A within the promoter
6
region to induce gene transcription (31, 83, 107). Transcriptional activity of FoxO is
inhibited by Akt-mediated phosphorylation and subsequent cytosolic sequestration (93).
Insulin resistance, a common side-effect of severe obesity (77), decreases Akt activity
and may thus increase FoxO-induced gene transcription and protein degradation.
Despite its ability to induce muscle atrophy, FoxO alone may be insufficient to
fully activate gene transcription. Waddel et al. (100) recently demonstrated that the
glucocorticoid receptor synergistically increases FoxO-induced transcription of MuRF-1.
Furthermore, the close proximity of the glucocorticoid response element and the FRE
within the MuRF-1 promoter region suggests that FoxO may form transcriptional
complexes with complementary DNA-binding factors to augment FoxO-induced gene
transcription. In support of this, Ramaswamy et al. (79) demonstrated that a FoxO
mutant lacking the DNA binding domain maintained the ability to induce gene
transcription.
SMAD3, a transcription factor that mediates Transforming Growth Factor-β (TGF-
β) family signaling, is a major determinant of protein degradation and plays a central
role in the development of muscle atrophy (13). SMAD3 is phosphorylated (activated)
by ligand-receptor binding and associates with SMAD4 to gain nuclear access (61).
SMAD3 directly interacts with DNA at the SMAD binding element (SBE, AGAC) to
induce gene transcription (90). While SMAD3 regulates gene expression of numerous
genes, SMAD3-induced gene transcription is often relatively weak and non-specific
unless accompanied by a complementary transcription factor (61). Myostatin, a TGF-β
family member, is elevated in numerous atrophic conditions such as heart failure,
7
glucocorticoid treatment, disuse, and cancer cachexia (14, 19, 29, 38, 55, 60, 102) and
increases protein degradation in a SMAD3-dependent manner (56). Overexpression of
SMAD3 alone is sufficient to induce Atrogin-1 gene expression, increase protein
degradation rate, and cause muscle atrophy (35, 85). Interestingly, myostatin
expression (1, 42, 59, 72) and SMAD3 activity (101) are increased in skeletal muscle of
the severely obese, suggesting skeletal muscle of the obese may be more susceptible
to muscle atrophy
To date, the combined effects of FoxO and SMAD3 on protein degradation and
muscle atrophy have not been explored. These transcription factors are known to
directly interact (88) and coordinately regulate gene expression (2, 33, 88). Therefore, it
is possible that FoxO3 and SMAD3 coordinately increase transcription of protein
degradation genes during muscle atrophy.
Conclusions
Obesity is accompanied by both increased skeletal muscle mass and
overexpression of genes involved in protein degradation. Increased expression of
protein degradation genes may put obese persons at increased risk of muscle atrophy
during cachectic conditions such as heart failure, cancer, and type 2 diabetes. To date,
the effects of obesity on muscle mass and protein degradation have largely been
ignored and the studies that have been performed have yielded conflicting results. A
common transcriptional response to muscle atrophy increases both UPS and
autophagic/lysosomal-mediated protein degradation which is driven, in large part, by the
transcription factor FoxO. Decreased Akt activity in obesity-induced insulin resistance
8
may increase FoxO-induced gene transcription. Additionally, increased TGF-β
signaling, which is commonly observed in skeletal muscle of the obese, may augment
FoxO-induced gene transcription and exacerbate muscle atrophy. Therefore, the
present project aimed to define the effects of obesity on the transcriptional regulation of
skeletal muscle protein degradation. Specifically, we hypothesized that:
1) Skeletal muscle of the obese overexpresses genes involved in the major
protein degradation pathways.
2) Protein degradation rate and flux through the major degradation pathways is
higher in skeletal muscle of the obese.
3) Skeletal muscle of the obese is more susceptible to muscle atrophy.
4) SMAD3 augments FoxO-induced transcription of ubiquitin ligases.
5) SMAD3 increases FoxO binding to the FRE within the promoter region of
FoxO-inducible gene MuRF-1.
Chapter 2: Myotubes from lean and severely obese women degrade proteins at
similar rates despite altered ubiquitin-proteasome system and
autophagic/lysosomal pathway flux
Abstract:
Obesity is commonly accompanied by increased skeletal muscle mass, yet this tissue
overexpresses many genes involved in protein degradation. Despite evidence of
increased whole-body protein turnover, the effects of obesity on skeletal muscle protein
degradation have not been systematically explored. The purpose of the present project
was to determine how obesity affects protein degradation and transcription of atrophy-
related genes. Methods: Primary Human Skeletal Muscle (HSkMC) myotubes, a cell
culture model that retains many characteristics of obesity, from 10 lean and 8 severely
obese women were subjected to both hypertrophic (IGF-1) and atrophic
(dexamethasone or serum and amino acid starvation) stimuli. Gene expression
patterns (RT-PCR), protein degradation rate, proteasome activity, and myotube area
were measured at 24 h. Results: Gene expression patterns were similar between
myotubes of lean and severely obese individuals with the exception of the transcription
factor FoxO3, which was significantly higher in the severely obese. Total protein
degradation rate was similar between myotubes of the lean and severely obese.
However, the rate of flux through the autophagic/lysosomal pathway was slower in
myotubes from the obese. Additionally, during starvation, the rate of flux through the
ubiquitin-proteasome system (UPS) decreased in myotubes of the lean, but increased in
myotubes of the obese, indicating a shift toward UPS-mediated protein degradation.
10
Furthermore, myotubes from the obese displayed elevated proteasome activity.
Despite altered flux through the major protein degradation pathways, myotube area was
similar between lean and obese under basal and starved conditions. Conclusions:
Despite increased gene expression of FoxO3, obesity does not affect the overall rate of
muscle protein degradation but does alter flux through the major protein degradation
pathways. Since the UPS and autophagic/lysosomal pathway preferentially degrade
different cellular proteins and protein complexes, these findings suggest that the
turnover rate of specific proteins may differ between lean and obese.
11
Introduction
Obesity affects over one-third of American adults (25) and is a major risk factor
for other chronic diseases and premature mortality (26). Deficiencies in skeletal muscle
carbohydrate and lipid metabolism underlie many of the metabolic abnormalities
associated with obesity, such as type 2 diabetes (36). Furthermore, even though
skeletal muscle mass is commonly increased in obese individuals (27, 69), skeletal
muscle protein metabolism may also be impaired (48). However, this has not been
thoroughly examined and remains controversial (48). Protein degradation is essential to
proper cellular function. Impaired protein degradation results in accumulation of
misfolded, damaged, or otherwise non-functional proteins (66). Alternatively,
accelerated protein degradation is a major cause of muscle atrophy (65), which
increases risk of disability and death (80).
Protein degradation is mediated primarily by two pathways, the ubiquitin-
proteasome system (UPS) and the autophagic/lysosomal pathway. The UPS accounts
for the majority of basal cellular protein degradation (46). Ubiquitin ligases target
specific proteins for UPS-mediated degradation via polyubiquitination. Flux through the
UPS is dictated by proteasome assembly and activity as well as protein
polyubiquitination and deubiquitination (76). The autophagic/lysosomal pathway
mediates degradation of the bulk of the remainder of cellular proteins, especially
macromolecules and organelles such as mitochondria through macroautophagy (84).
During this process, autophagosomes engulf cellular components, fuse with lysosomes,
12
and proteins are degraded by lysosomal hydrolases. It is important to note that both
pathways are upregulated during muscle atrophy (107).
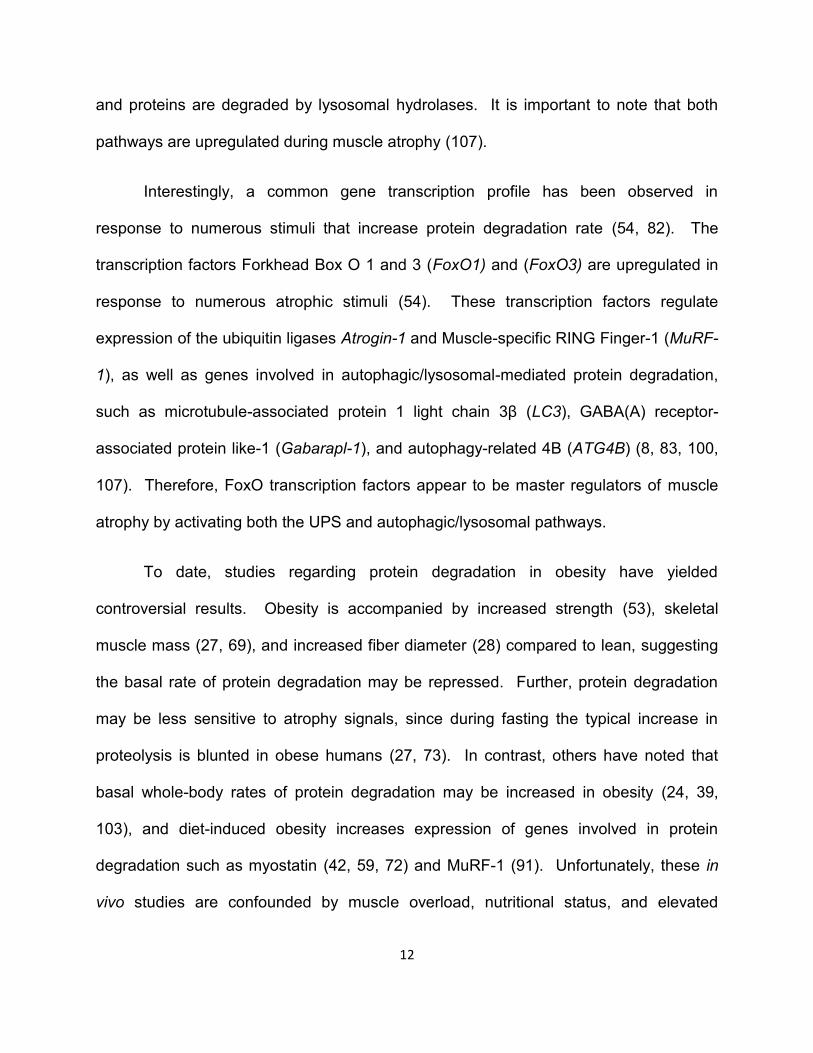
Interestingly, a common gene transcription profile has been observed in
response to numerous stimuli that increase protein degradation rate (54, 82). The
transcription factors Forkhead Box O 1 and 3 (FoxO1) and (FoxO3) are upregulated in
response to numerous atrophic stimuli (54). These transcription factors regulate
expression of the ubiquitin ligases Atrogin-1 and Muscle-specific RING Finger-1 (MuRF-
1), as well as genes involved in autophagic/lysosomal-mediated protein degradation,
such as microtubule-associated protein 1 light chain 3β (LC3), GABA(A) receptor-
associated protein like-1 (Gabarapl-1), and autophagy-related 4B (ATG4B) (8, 83, 100,
107). Therefore, FoxO transcription factors appear to be master regulators of muscle
atrophy by activating both the UPS and autophagic/lysosomal pathways.
To date, studies regarding protein degradation in obesity have yielded
controversial results. Obesity is accompanied by increased strength (53), skeletal
muscle mass (27, 69), and increased fiber diameter (28) compared to lean, suggesting
the basal rate of protein degradation may be repressed. Further, protein degradation
may be less sensitive to atrophy signals, since during fasting the typical increase in
proteolysis is blunted in obese humans (27, 73). In contrast, others have noted that
basal whole-body rates of protein degradation may be increased in obesity (24, 39,
103), and diet-induced obesity increases expression of genes involved in protein
degradation such as myostatin (42, 59, 72) and MuRF-1 (91). Unfortunately, these in
vivo studies are confounded by muscle overload, nutritional status, and elevated
13
circulating amino acids, factors that can alter protein metabolism and are inherently
different between lean and obese subjects. Therefore, given the prevalence of obesity,
the roles of protein degradation in muscle mass regulation and cellular function, and the
conflicting body of data regarding protein degradation in obesity, it is important to
directly measure muscle protein degradation rates in obesity.
Due to the well-described insulin resistance in vivo and in vitro (43) and elevated
myostatin expression seen in skeletal muscle of the severely obese (1, 42, 72), we
hypothesized that expression of protein degradation-related genes and rates of protein
degradation would be higher basally in myotubes from the severely obese and that the
myotubes from the obese would be more sensitive to signals known to alter protein
degradation. To this end, we measured protein degradation and gene expression
profiles of cultured primary human skeletal muscle myotubes (HSkMC), a model that
retains many characteristics of obesity in vitro (6, 10), in response to both hypertrophic
and atrophic stimuli.
14
Methods
Human subjects and muscle biopsies.
Lean (BMI 18.5-26.0 kg/m2, n=10) and severely obese (BMI 39.0-57.3 kg/m2,
n=8) subjects were recruited through ongoing studies on obesity at East Carolina
University. Muscle biopsy procedures were approved by East Carolina University
Institutional Review Board and no personal identifiers were retained. Blood samples
were collected following an overnight fast and plasma glucose and insulin were
measured. Homeostatic model assessment (HOMA-IR), a marker of insulin resistance
(62), was calculated (fasting plasma glucose x fasting plasma insulin/22.5). Subject
characteristics are presented in Table 2.1.
Cell culture.
Primary Human Skeletal Muscle (HSkMC) myoblasts were generated as
previously described (5) by isolating satellite cells from muscle biopsies of the vastus
lateralis of lean and severely obese female subjects. Myoblasts were cultured in
Dulbecco’s modified Eagle’s medium (DMEM, 1g glucose/L) supplemented with 10%
fetal bovine serum, recombinant hEGF, dexamethasone, gentamycin, BSA, and fetuin
(SkGM Singlequots, Lonza). Upon reaching confluence, growth media was switched to
low serum media (2% horse serum) supplemented with 3% BSA and 0.1% fetuin to
induce differentiation into myotubes. All experiments were performed on myotubes of
15
similar passage number (4-5) and days post-differentiation (6-8) to ensure these
variables did not affect results.
For experiments using pooled myotubes (UPS flux, autophagic/lysosomal flux,
and proteasome capacity), myotubes were cultured individually until 50% confluent then
seeded together in multiwell plates, allowed to adhere to the plate overnight, then
switched to low serum media to induce differentiation. Myoblasts were cultured
independently prior to differentiation to eliminate effects of differing growth rates
between myoblast cultures. Pooled data was collected on two independent pools to
confirm the accuracy of results.
Myotubes were starved of serum and amino acids (cultured in HBSS) or treated
with 100nM dexamethasone to induce protein degradation. Additionally, myotubes
were treated with 100nM IGF-1 to inhibit protein degradation. 100nM dexamethasone
maximally induces protein degradation of C2C12 and L6 myotubes (63) and 100nM
IGF-1 is sufficient to increase protein synthesis in HSkMC (Supporting information 2.1).
Real-time PCR.
Total RNA was extracted from myotubes using TRIzol following 24 h of
starvation, IGF-1 or dexamethasone treatment. RNA concentration and purity was
assessed spectrophometrically (Ab260/280) using a NanoDrop UV-Vis spectrophometer
(ThermoScientific, ND-1000). Integrity of RNA was confirmed by agarose gel
electrophoresis on a subset of individuals to ensure RNA was not degraded prior to
16
reverse transcription. RNA was then reverse transcribed (Quanta Biosciences) and RT-
PCR performed (SYBR green chemistry, Applied Biosystems 7900HT) using standard
methods as previously described (107). The expression of Large Ribosomal Protein
(RPLPO), which was not different between lean and obese groups, was used as an
endogenous control, and the fold expression of genes of interest was calculated using
the relative standard curve method. Standard curves were tested over eight orders of
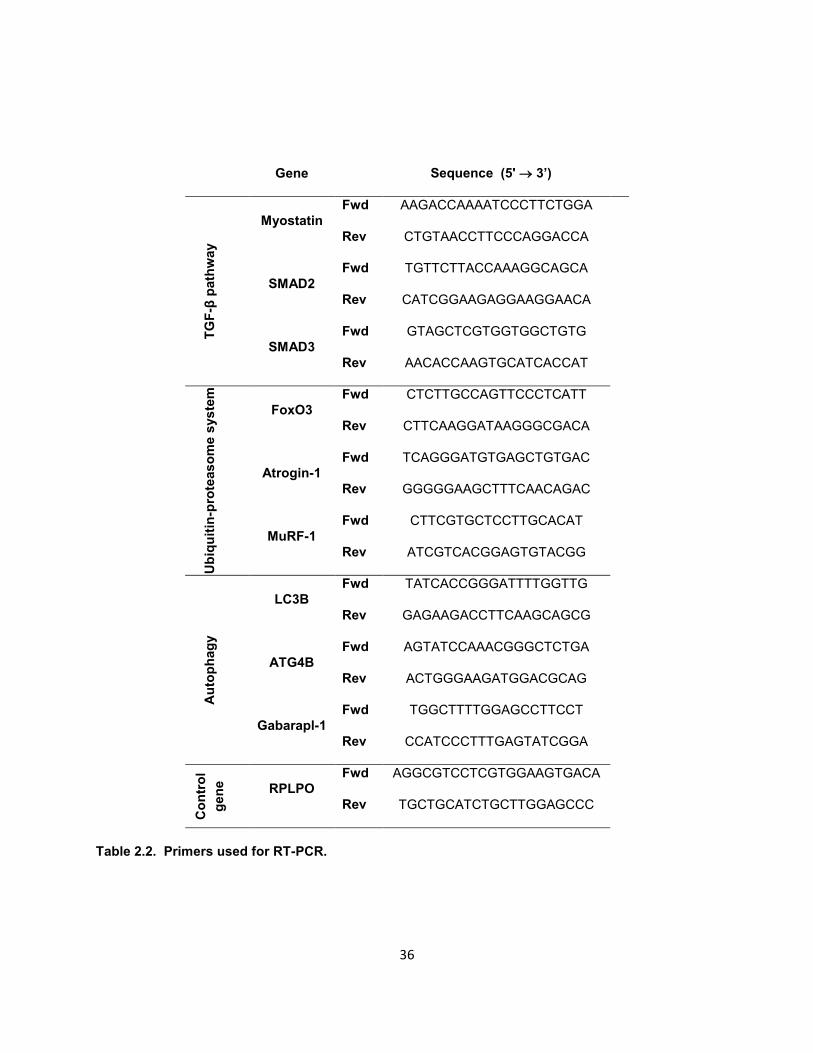
magnitude and amplification efficiency was near 100%. Custom RT-PCR primers
(Table 2.2) were generated using NCBI BLAST algorithms
(http://blast.ncbi.nlm.nih.gov/Blast.cgi) and specificity confirmed by conventional PCR
followed by agarose gel electrophoresis.
Protein degradation rate.
Degradation rate of long-lived proteins was determined as previously described
(11). Myotubes were radiolabeled with L-[3,5-3H] tyrosine (5-10µCi/ml, PerkinElmer Life
Sciences) for 24 h. Cells were washed and radioactivity chased for 2 h using
differentiation media supplemented with 2mM L-tyrosine to allow degradation of short-
lived proteins and to limit re-incorporation of the radiolabel. Fresh media was added,
and media samples (3 or 4) were collected over time. As we have previously reported,
protein degradation rate (radioactivity release) is curvilinear over the course of 30 h
(107). Therefore, we assessed protein degradation over two time periods, either 0-5 h
or 20-30 h. The rates over these time periods were highly linear (R2>0.97) for all
individuals. At the end of the experiments, culture media was removed completely and
myotubes were solubilized in 0.2N NaOH. Radioactivity of cells and TCA-precipitated
17
media samples was measured using scintillation counting. Total radioactivity was
calculated as the sum of the residual radioactivity in the myotubes plus radioactivity of
all time points. Protein degradation rate was calculated from the regression line of
serial samples for each individual and is given as a percentage of total [3H] tyrosine
incorporation.
Protein content.
In a parallel experiment, myotubes were treated with IGF-1, dexamethasone, or
starved for 24 h and cellular protein was collected. Myotubes were washed twice with
PBS and proteins collected with 300μl freshly made Radio-Immunoprecipitation Assay
(RIPA) buffer containing 1% NP-40, 0.5% sodium deoxycholate, 0.1% SDS, and
protease inhibitor cocktail (Roche Complete Mini). Samples were vortexed continuously
for 1min, rotated end-over-end for 30 min, then centrifuged at 12,000 x g for 10min and
the pellet discarded. Samples were stored at -80°C until processing and protein
concentration (μg/ml) determined by bicinchoninic acid (BCA) assay (ThermoScientific).
Relative flux through the UPS and autophagy pathways.
In order to calculate relative flux through the UPS and autophagic/lysosomal
pathways, we repeated the protein degradation assay described above in the presence
of the highly specific proteasome inhibitor PS-341 (Bortezomib/Velcade) or the highly
specific lysosome acidification inhibitor Concanamycin A as previously described (11,
107) using pooled myotubes (3 individuals per pool). During the two hour chase,
18
myotubes were pre-incubated with 1.0µM PS-341 and/or 0.1µM Concanamycin A for 1
h and these inhibitors remained in the culture media for the duration of the experiment.
Relative flux through the UPS and autophagy pathways was determined by subtracting
the inhibitor-sensitive degradation rate from the basal degradation rate (Basal
degradation rate – degradation rate with inhibitor = degradation rate attributable to
inhibited pathway). Differences between lean and obese myotubes were determined by
subtracting the lean protein degradation rate from the corresponding value for the obese
(Δ Degradation rate = degradation rateobese – degradation ratelean)
Proteasome activity.
Pooled myotubes (3 individuals per pool) were cultured in serum and amino acid
free media for 24 h. Purified proteasomes were collected as described by Kisselev and
Goldberg (49). Briefly, cell lysates were collected in buffer containing: 50mM Tris-HCl,
pH 7.5, 250mM sucrose, 5mM MgCl2, 2mM ATP, 1mM DTT, 0.5mM EDTA and 0.025%
digitonin to permeabilize the cell membrane. Lysates were centrifuged at 20,000 x g for
15 min to isolate the cytosolic fraction (supernatant) and chymotrypsin-like activity of the
proteasome analyzed immediately. The cytosolic fractions were plated in black 96 well
microplates (30μl per well). The fluorogenic amino acid substrate Suc-LLVY-amc
(100µM final concentration, Bachem) was diluted in proteasome activity buffer and
added to the microplate wells. This substrate fluoresces upon chymotrypsin-like
cleavage by the proteasome. Fluorescence (excitation 380, emission 460) was
measured using a microplate reader (Spectromax M4) over the course of 15 min.
19
Proteasome specificity for Suc-LLVY-amc was confirmed by treating cytosolic extracts
with 100μM PS-341 (Bortezomib/Velcade). Results were standardized to total protein
content of the cytosolic fraction (DC protein assay, BioRad) to control for differences in
proteasome content.
Myotube area.
Myotube area was quantified by analyzing the amount of myosin heavy chain
covering the culture area (immunofluorescence) and total number of nuclei counted
after staining with 4',6-diamidino-2-phenylindole (DAPI). Myoblasts (~40% confluency)
were plated in six well plates, grown to confluence, differentiated for 6-7d, and cultured
in starvation media (HBSS) for 24 h. Briefly, myotubes were washed with a
cytoskeleton stabilizing buffer containing 80mM PIPES, 5mM EGTA, 1mM MgCl2, and
40g/L PEG 35,000 as described by Trendelenurg et al (99). Cross-linking was
performed with 4% paraformaldehyde, and myotubes were permeabilized with 0.1%
Triton X-100. Non-specific binding was blocked with 10% rat serum. Myotubes were
then incubated with an antibody that detects all isoforms of myosin heavy chain
(A4.1025, 1:100 dilution, Developmental Studies Hybridoma Bank) overnight at 4ºC.
Immunofluorescence was achieved using a fluorogenic secondary antibody (AlexaFluor
546, Invitrogen) and DAPI. Myotubes were then imaged at 10x magnification using a
fluorescent microscope (Leica DMI 4000B). Antibody specificity was confirmed by the
striated appearance of myotubes. Wells (n=2 per condition) were divided into 10
regions and a single image collected from each region (20 images/condition/individual).
20
Images were then processed using open-access software from NCBI (Image J,
rsbweb.nih.gov/ij/) with a self-designed macro. Images were split from RGB format to
individual components (TRITC and DAPI), converted to threshold images, and analyzed
for positive pixels (myosin heavy chain) or individual particles (nuclei count). The total
myosin heavy chain area was standardized to the number of nuclei to control for
differences in seeding density.
Statistical analysis.
Statistical analysis for gene expression, protein degradation rate, protein content,
and myotubes area data were determined by two-way repeated measures ANOVA with
Sidak post-test comparisons. Given our data mean and standard deviations for the
protein degradation assay, a power analysis revealed that we would need 6-7
observations to have an 80% chance of achieving a statistically significant difference
with α=0.05. Data from pooled myotubes (UPS flux, autophagic/lsysomal flux, and
proteasome activity) were determined by two-way ANOVA with Sidak post-test
comparisons. Statistical analysis was performed using SPSS 19 and significance was
set at α=0.05.
21
Results
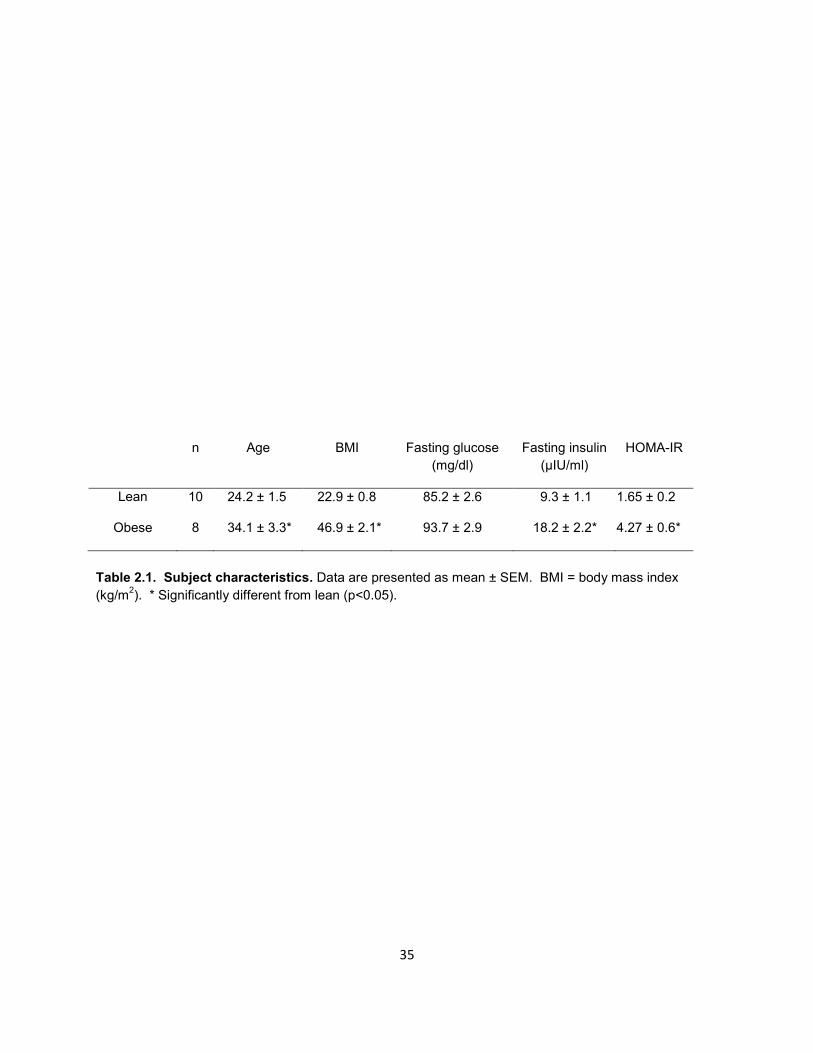
Subject Characteristics
Subjects were classified as lean or severely obese on the basis of body mass
index (BMI, kg/m2). By definition, severely obese (≥ 39.0 kg/m2) subjects displayed a
higher BMI than their lean counterparts (≤ 26.0 kg/m2). Additionally, the severely obese
were significantly older than lean and displayed marked insulin resistance as assessed
by homeostatic model assessment (HOMA-IR).
Differential atrophy-related gene expression between lean and obese myotubes
In order to determine how severe obesity affects the transcriptional response to
muscle atrophy, we performed RT-PCR after 24 h of exposure to IGF-1,
dexamethasone, or starvation. Due to their roles in protein degradation, we analyzed
genes involved in the UPS (FoxO3, Atrogin-1, and MuRF-1) and the
autophagic/lysosomal pathway (LC3B, Gabarapl-1, and ATG4B). These genes are
known to be, at least in part, transcriptionally regulated (54, 107). Furthermore, due to
the well-documented increased myostatin expression (1, 42, 72) and TGF-β signaling in
obesity (101), we analyzed genes involved in the myostatin/TGF-β signaling pathway.
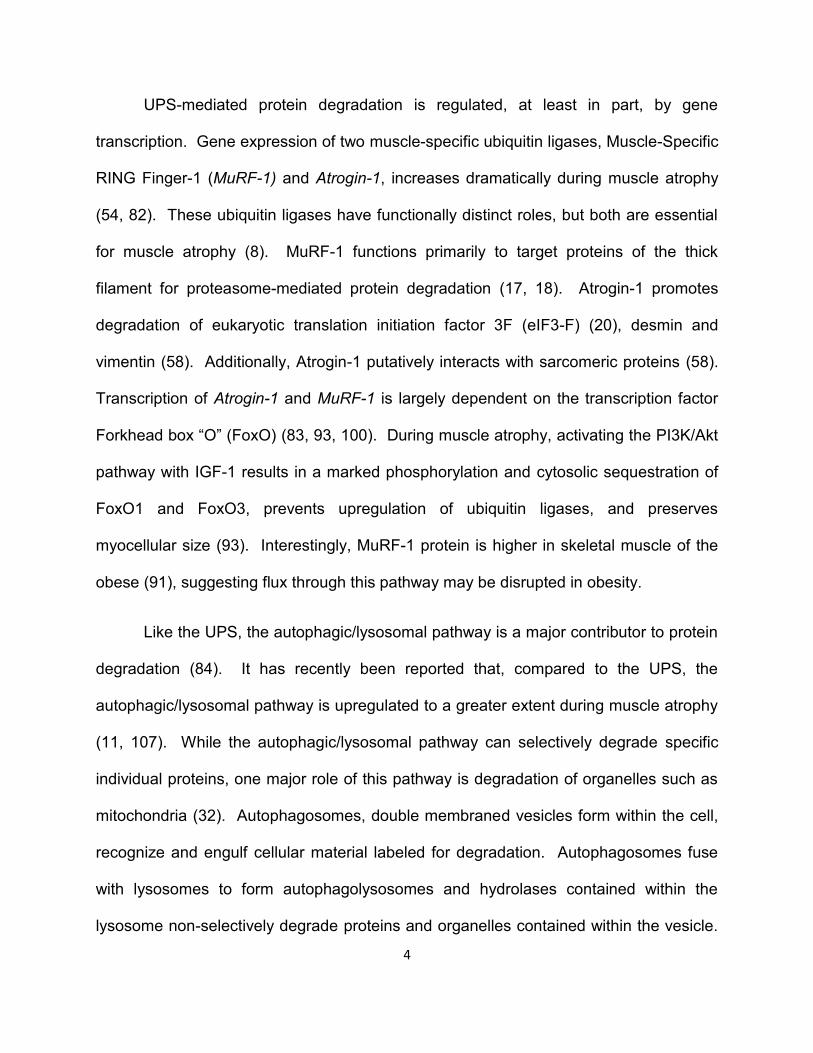
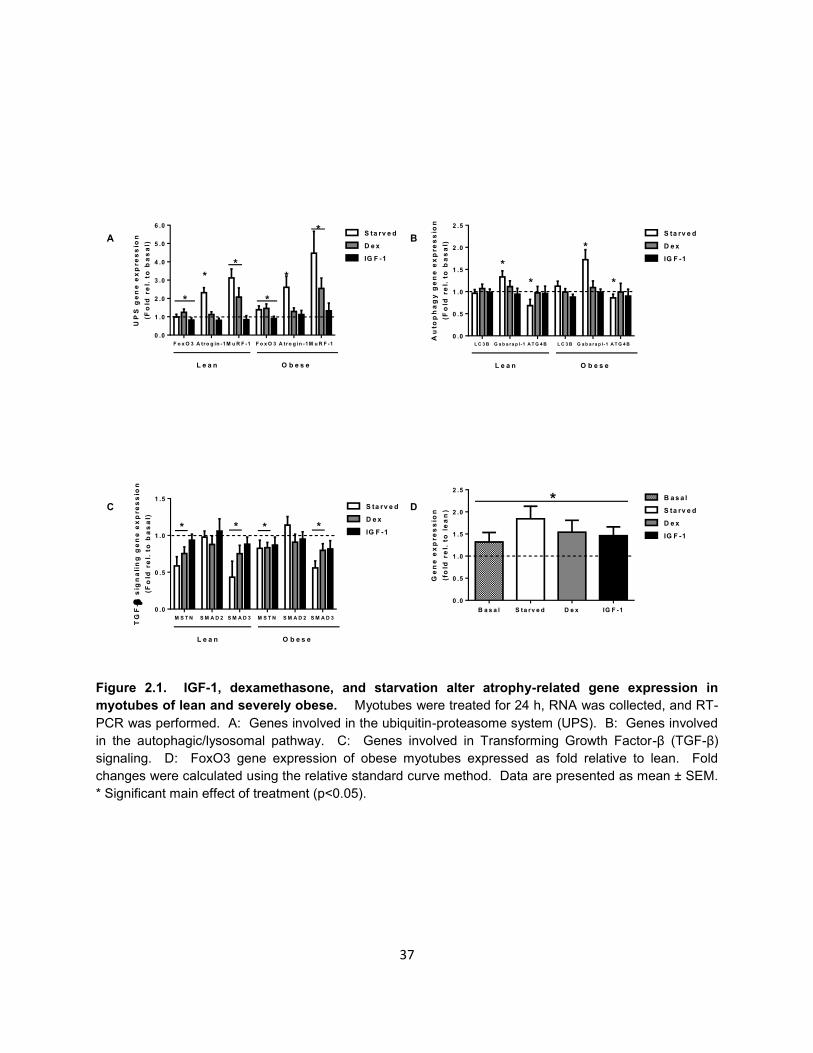
As shown in Figure 2.1A, starvation increased gene expression of MuRF-1 (lean:
3.1 and obese: 4.5 fold) and Atrogin-1 (lean: 2.3, obese: 2.6 fold). Interestingly,
starvation increased FoxO3 gene expression in myotubes from the severely obese (1.4
fold), but had no effect on myotubes from lean subjects. Dexamethasone treatment
22
significantly increased gene expression of MuRF-1 (lean: 2.1 and obese: 2.5 fold) and
FoxO3 (lean: 1.2 and obese: 1.5 fold), but had no effect on Atrogin-1. IGF-1 treatment
significantly reduced gene expression of FoxO3 (lean: 0.8 and obese: 0.9 fold), but did
not affect MuRF-1 or Atrogin-1 gene expression.
Starvation significantly altered expression of genes involved in the
autophagic/lysosomal pathway (Figure 2.1B). Specifically, gene expression of
Gabarapl-1, a gene essential for autophagosome formation, was significantly increased
(lean: 1.3 and obese: 1.7 fold) in response to 24 h of starvation. Gene expression of
ATG4B, another regulator of autophagosome formation, was significantly reduced in
response to 24 h of starvation (lean: 0.7 and obese: 0.9 fold). LC3B is essential in
committing proteins to the autophagosome membrane for degradation and, due to its
location within the autophagosome, is degraded during autophagy (98). Therefore,
LC3B transcription must increase in order to sustain flux through the autophagy
pathway. Surprisingly, LC3B gene expression was unchanged after 24 h of starvation.
In contrast to starvation, neither dexamethasone, nor IGF-1 had any effect on Gabarapl-
1, ATG4B, or LC3B gene expression.
The TGF-β signaling pathway is known to negatively regulate muscle mass and
signaling through this pathway is increased in severe obesity (101). This is especially
true for the muscle-specific cytokine, myostatin, and the transcription factors SMAD2
and SMAD3 which mediate many of the effects of the TGF-β pathway. As shown in
Figure 2.1C, starvation significantly reduced gene expression of myostatin (lean: 0.6
and obese: 0.8 fold) and SMAD3 (lean: 0.4 and obese: 0.6 fold), but had no effect on
23
SMAD2. Similarly, dexamethasone significantly reduced myostatin (lean: 0.75 and
obese: 0.83 fold) and SMAD3 (lean: 0.75 and obese: 0.80 fold), but not SMAD2, gene
expression. IGF-1 treatment did not significantly alter expression myostatin, SMAD2,
nor SMAD3.
As shown in Figure 2.1D, there was a significant group effect (p=0.039) for
FoxO3 gene expression to be higher in the obese myotubes. Under basal conditions,
FoxO3 gene expression was 1.32 fold higher in obese myotubes. While the direction of
change in FoxO3 expression was similar between lean and obese in response to all
experimental conditions, FoxO3 gene expression was higher in the obese in response
to IGF-1 (1.46 fold), dexamethasone (1.54 fold) and starvation (1.84 fold). However, the
interaction between treatments and obesity failed to reach statistical significance
(p=0.06). No other genes tested were differentially expressed between myotubes of the
lean and severely obese.
Protein degradation rates are similar between myotubes of the lean and severely
obese
In order to determine whether protein degradation rates differ between skeletal
muscle of the lean and severely obese, we directly measured protein degradation rates
in primary HSkMC myotubes in response to 24 h of IGF-1, dexamethasone, or
starvation.
24
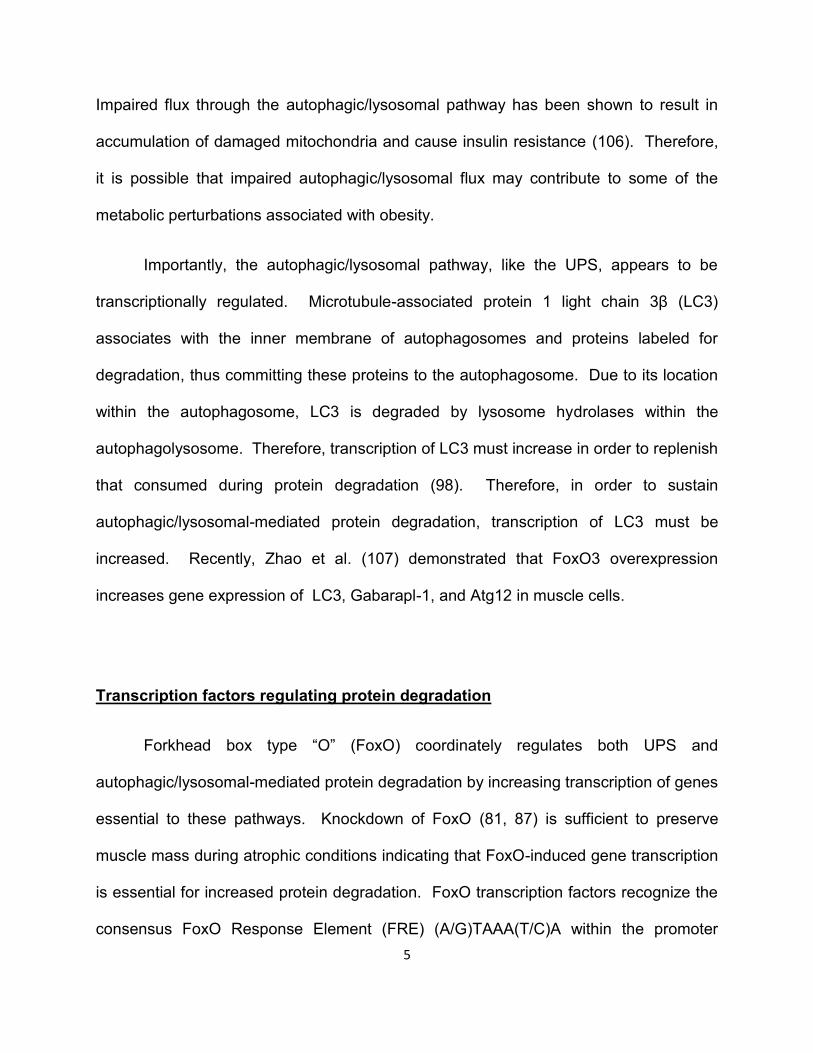
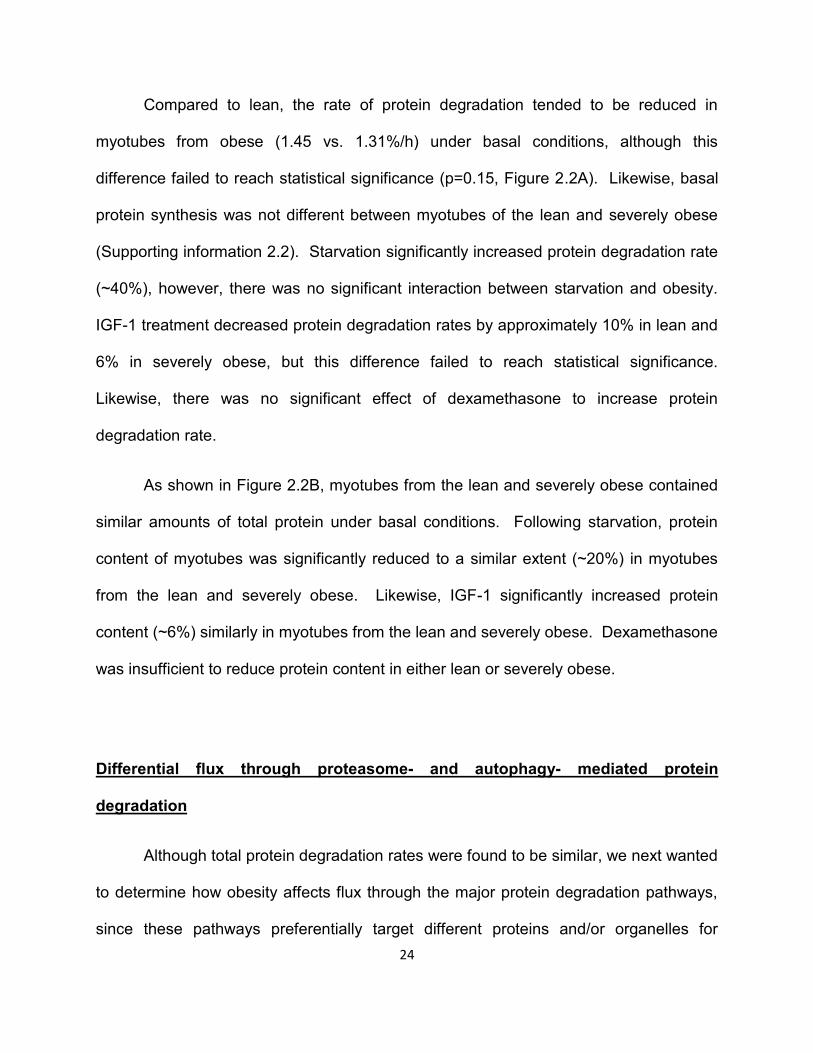
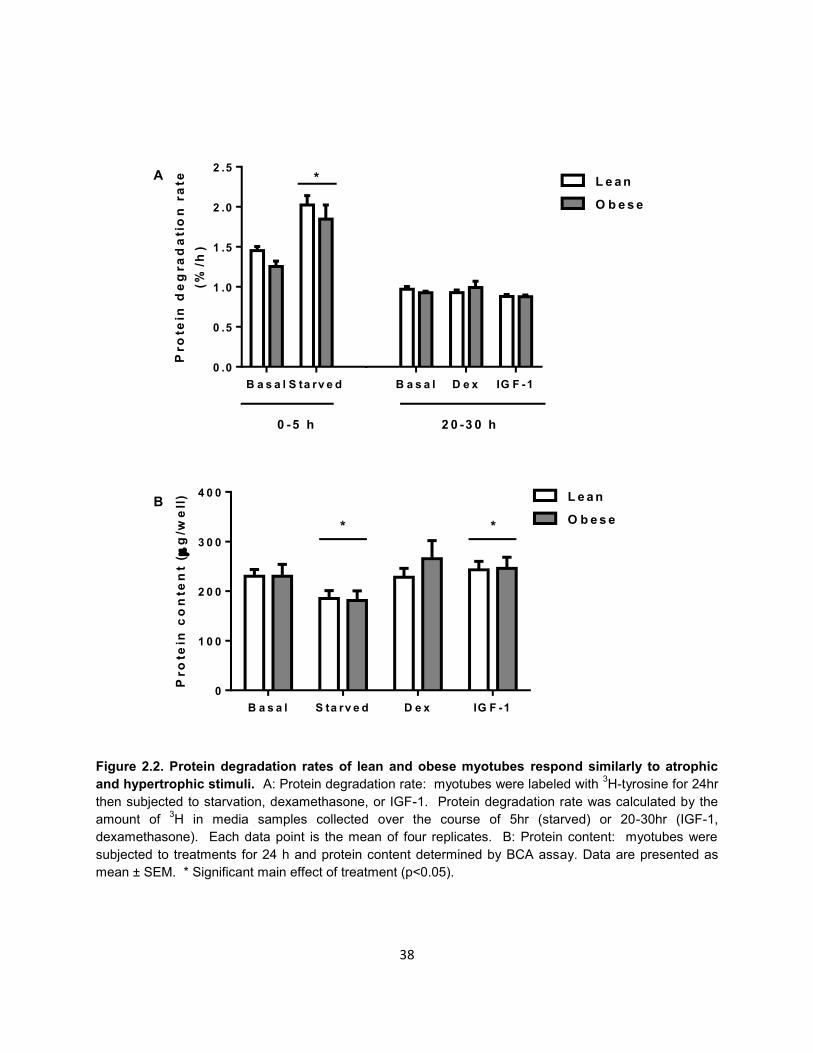
Compared to lean, the rate of protein degradation tended to be reduced in
myotubes from obese (1.45 vs. 1.31%/h) under basal conditions, although this
difference failed to reach statistical significance (p=0.15, Figure 2.2A). Likewise, basal
protein synthesis was not different between myotubes of the lean and severely obese
(Supporting information 2.2). Starvation significantly increased protein degradation rate
(~40%), however, there was no significant interaction between starvation and obesity.
IGF-1 treatment decreased protein degradation rates by approximately 10% in lean and
6% in severely obese, but this difference failed to reach statistical significance.
Likewise, there was no significant effect of dexamethasone to increase protein
degradation rate.
As shown in Figure 2.2B, myotubes from the lean and severely obese contained
similar amounts of total protein under basal conditions. Following starvation, protein
content of myotubes was significantly reduced to a similar extent (~20%) in myotubes
from the lean and severely obese. Likewise, IGF-1 significantly increased protein
content (~6%) similarly in myotubes from the lean and severely obese. Dexamethasone
was insufficient to reduce protein content in either lean or severely obese.
Differential flux through proteasome- and autophagy- mediated protein
degradation
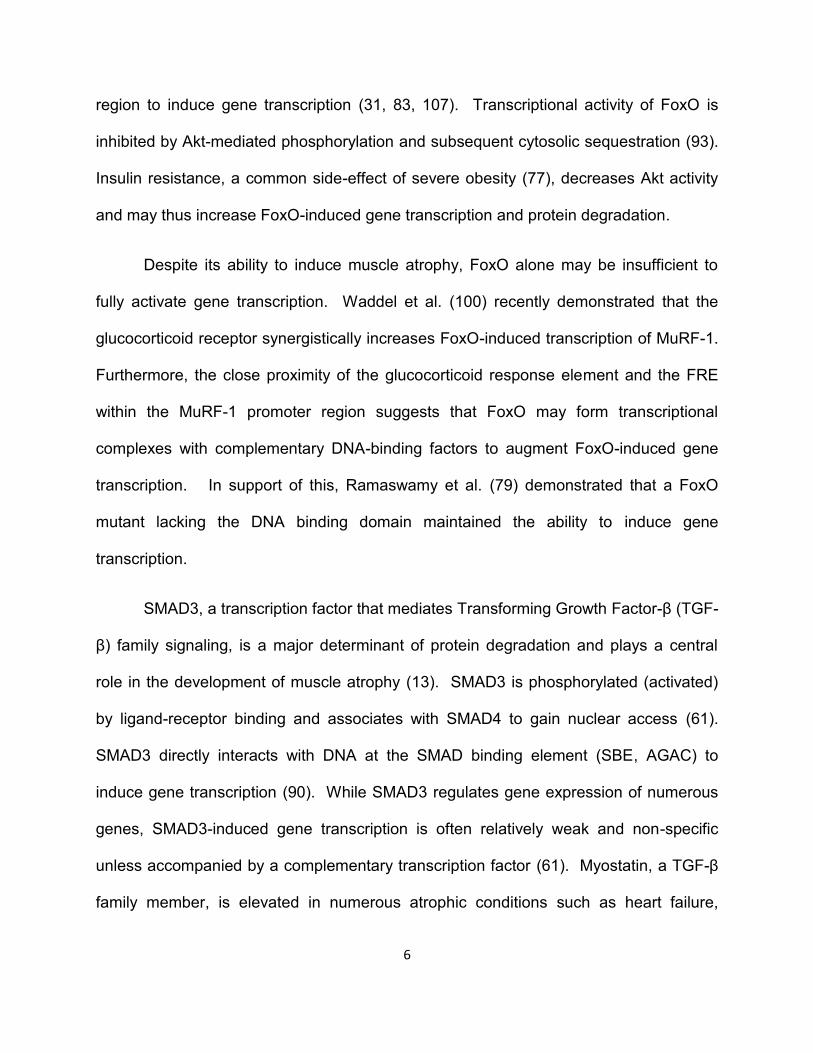
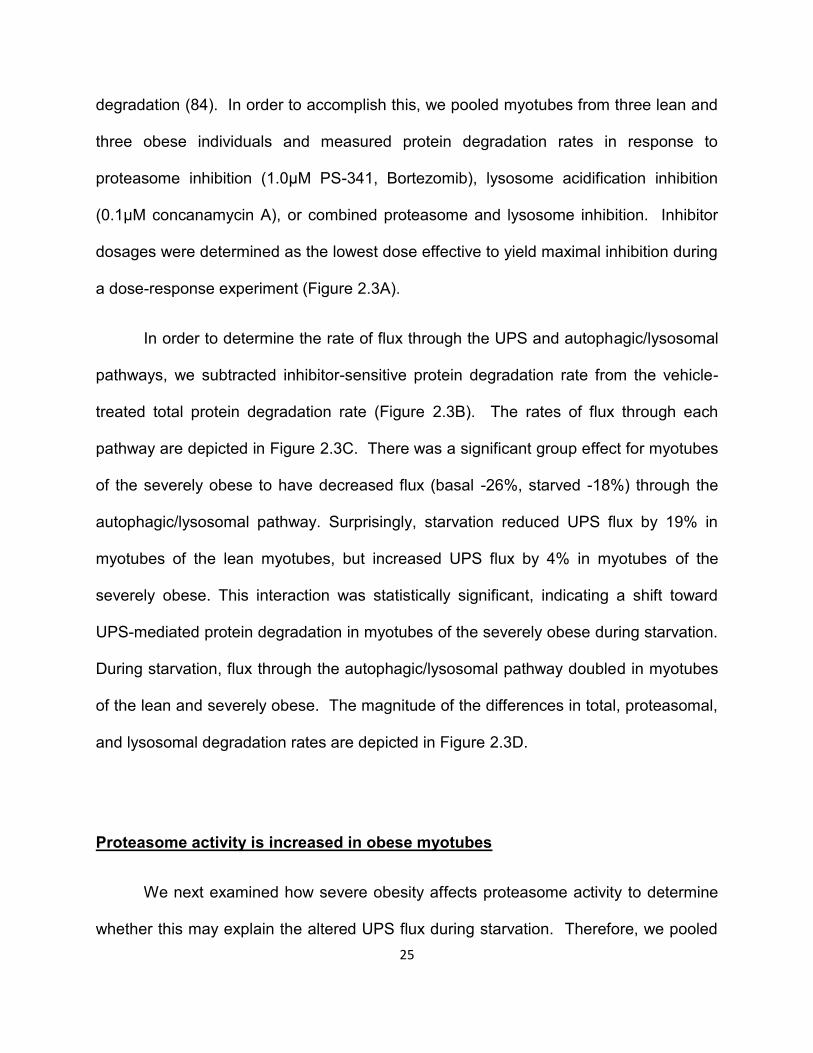
Although total protein degradation rates were found to be similar, we next wanted
to determine how obesity affects flux through the major protein degradation pathways,
since these pathways preferentially target different proteins and/or organelles for
25
degradation (84). In order to accomplish this, we pooled myotubes from three lean and
three obese individuals and measured protein degradation rates in response to
proteasome inhibition (1.0μM PS-341, Bortezomib), lysosome acidification inhibition
(0.1μM concanamycin A), or combined proteasome and lysosome inhibition. Inhibitor
dosages were determined as the lowest dose effective to yield maximal inhibition during
a dose-response experiment (Figure 2.3A).
In order to determine the rate of flux through the UPS and autophagic/lysosomal
pathways, we subtracted inhibitor-sensitive protein degradation rate from the vehicle-
treated total protein degradation rate (Figure 2.3B). The rates of flux through each
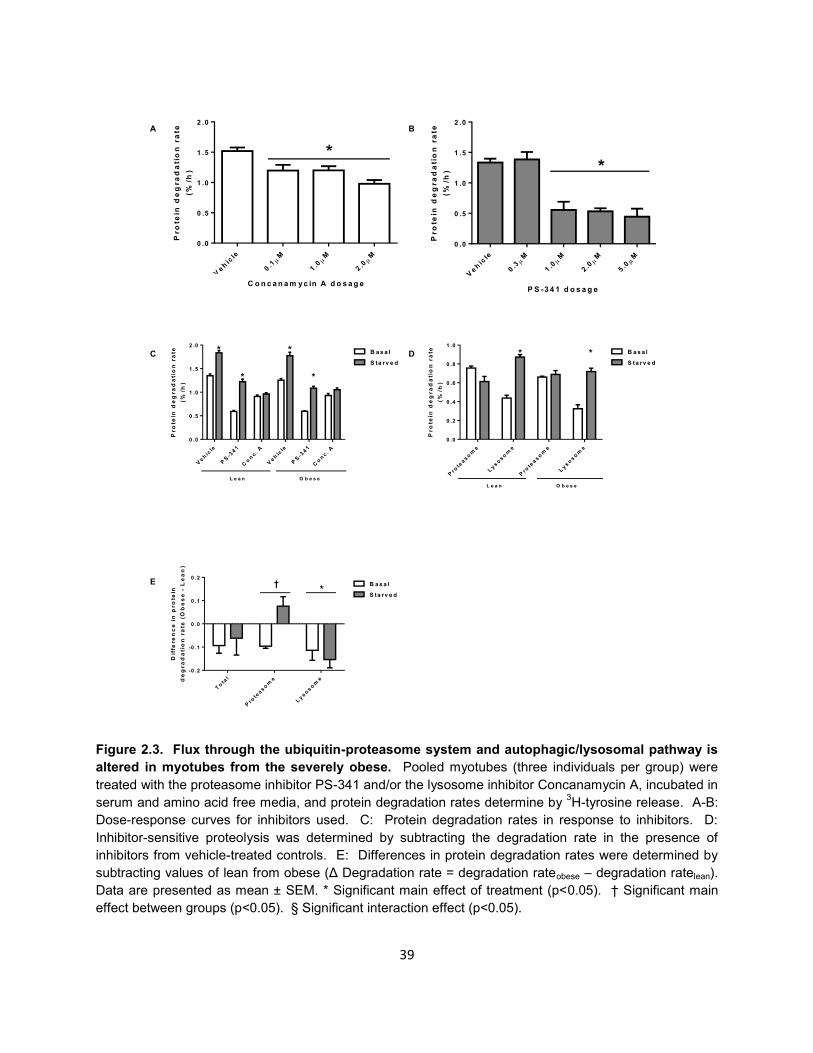
pathway are depicted in Figure 2.3C. There was a significant group effect for myotubes
of the severely obese to have decreased flux (basal -26%, starved -18%) through the
autophagic/lysosomal pathway. Surprisingly, starvation reduced UPS flux by 19% in
myotubes of the lean myotubes, but increased UPS flux by 4% in myotubes of the
severely obese. This interaction was statistically significant, indicating a shift toward
UPS-mediated protein degradation in myotubes of the severely obese during starvation.
During starvation, flux through the autophagic/lysosomal pathway doubled in myotubes
of the lean and severely obese. The magnitude of the differences in total, proteasomal,
and lysosomal degradation rates are depicted in Figure 2.3D.
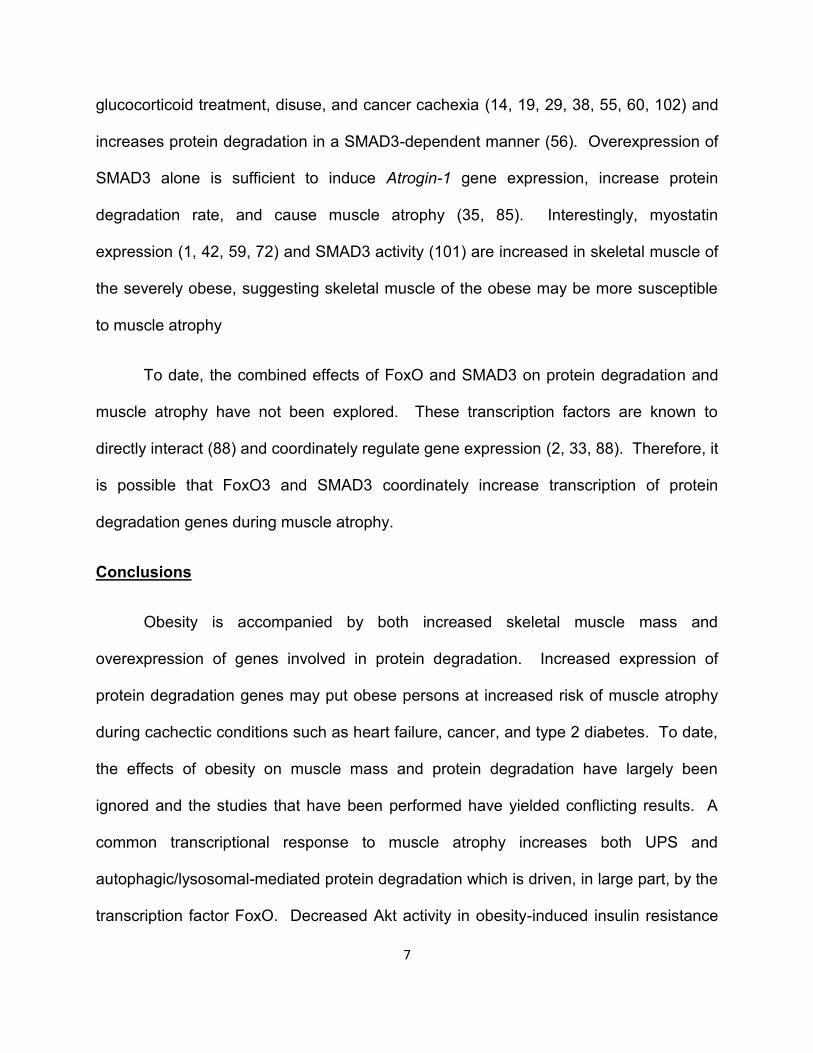
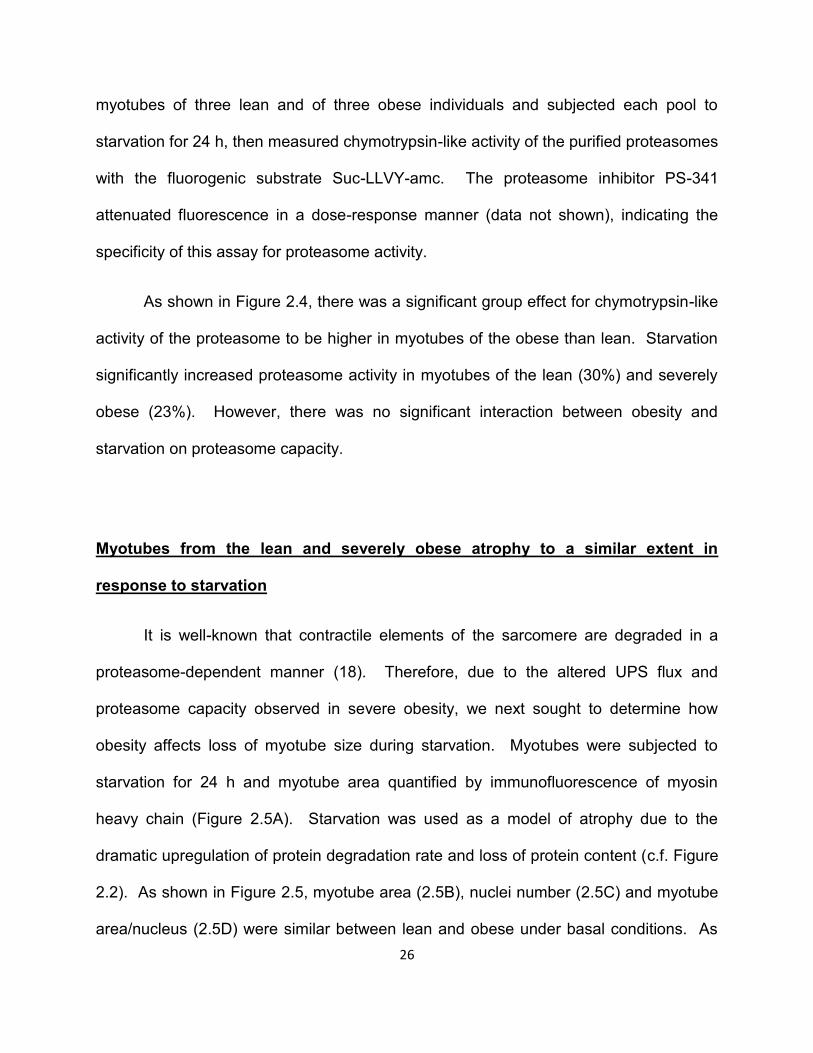
Proteasome activity is increased in obese myotubes
We next examined how severe obesity affects proteasome activity to determine
whether this may explain the altered UPS flux during starvation. Therefore, we pooled
26
myotubes of three lean and of three obese individuals and subjected each pool to
starvation for 24 h, then measured chymotrypsin-like activity of the purified proteasomes
with the fluorogenic substrate Suc-LLVY-amc. The proteasome inhibitor PS-341
attenuated fluorescence in a dose-response manner (data not shown), indicating the
specificity of this assay for proteasome activity.
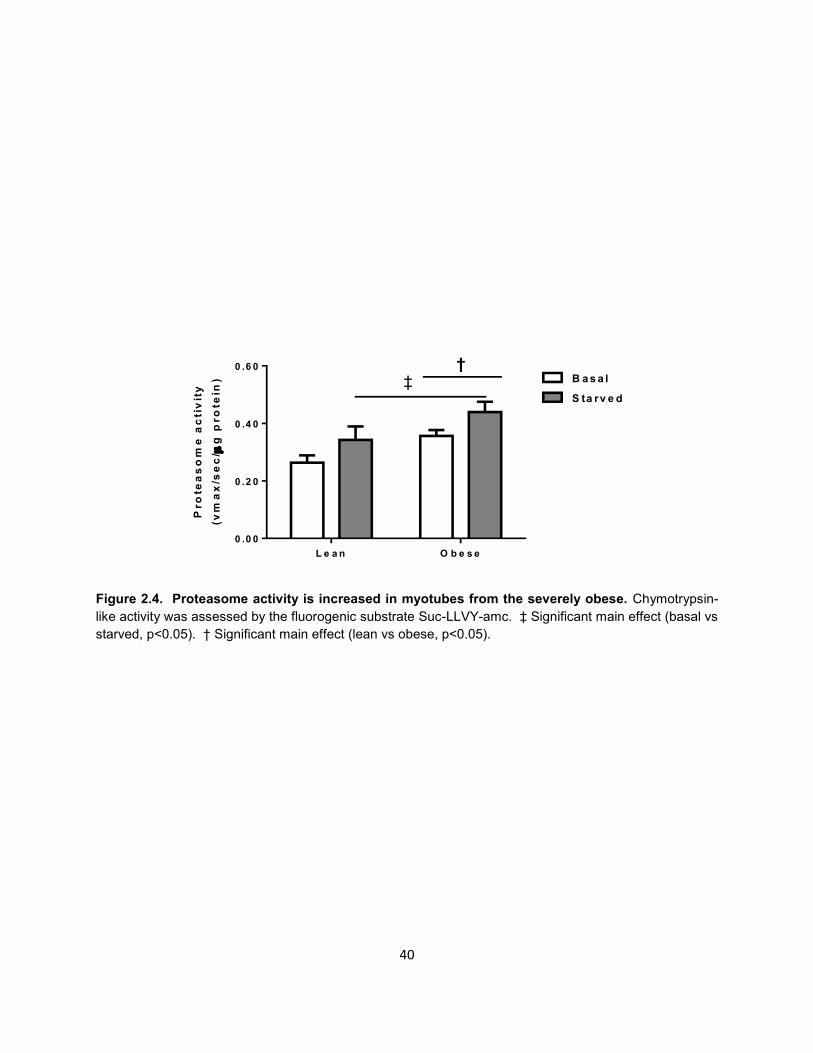
As shown in Figure 2.4, there was a significant group effect for chymotrypsin-like
activity of the proteasome to be higher in myotubes of the obese than lean. Starvation
significantly increased proteasome activity in myotubes of the lean (30%) and severely
obese (23%). However, there was no significant interaction between obesity and
starvation on proteasome capacity.
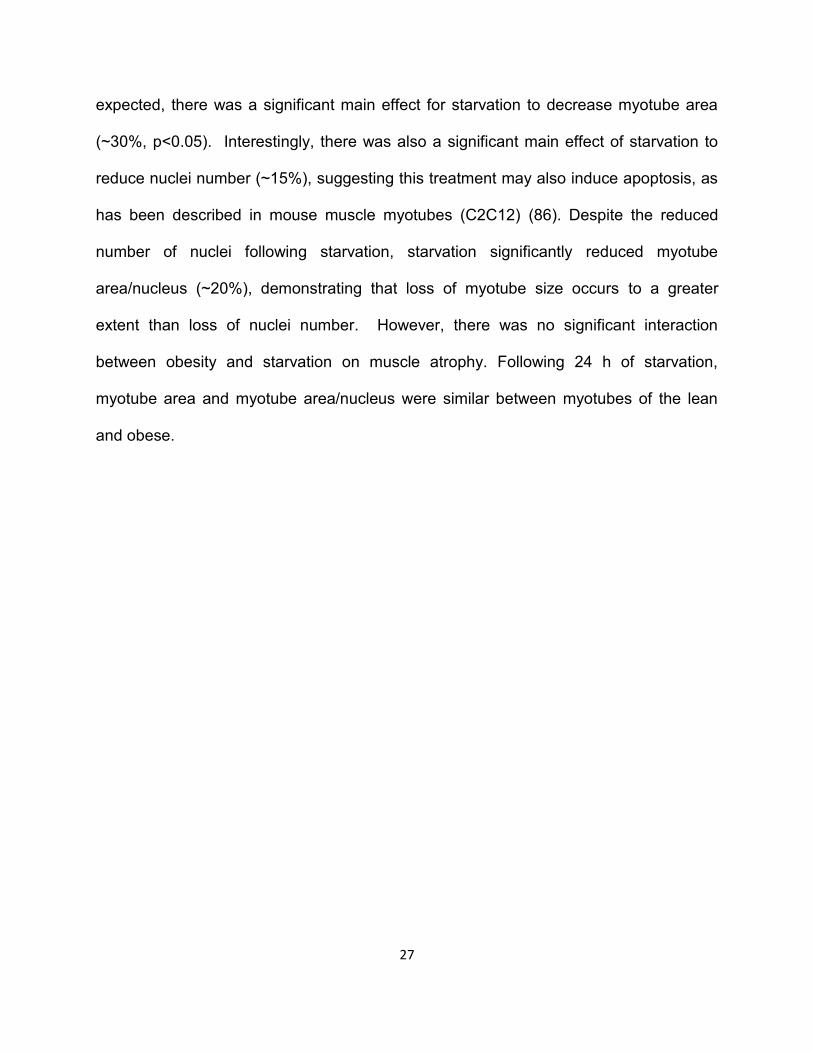
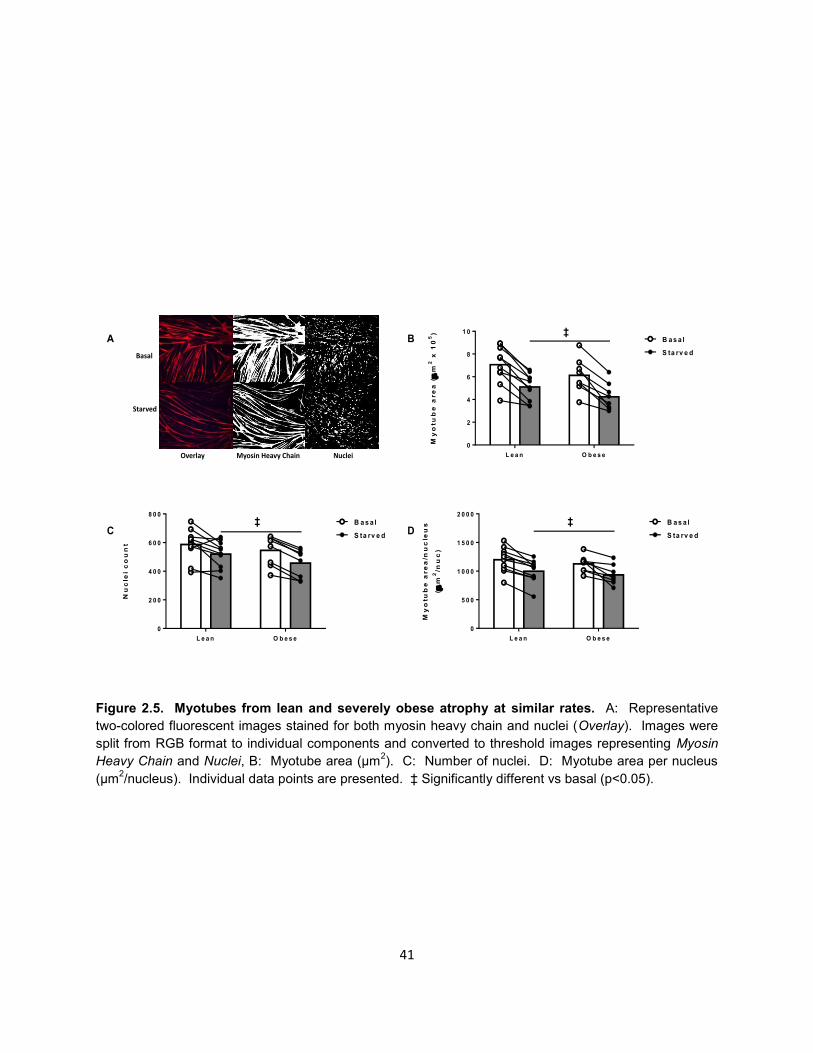
Myotubes from the lean and severely obese atrophy to a similar extent in
response to starvation
It is well-known that contractile elements of the sarcomere are degraded in a
proteasome-dependent manner (18). Therefore, due to the altered UPS flux and
proteasome capacity observed in severe obesity, we next sought to determine how
obesity affects loss of myotube size during starvation. Myotubes were subjected to
starvation for 24 h and myotube area quantified by immunofluorescence of myosin
heavy chain (Figure 2.5A). Starvation was used as a model of atrophy due to the
dramatic upregulation of protein degradation rate and loss of protein content (c.f. Figure
2.2). As shown in Figure 2.5, myotube area (2.5B), nuclei number (2.5C) and myotube
area/nucleus (2.5D) were similar between lean and obese under basal conditions. As
27
expected, there was a significant main effect for starvation to decrease myotube area
(~30%, p<0.05). Interestingly, there was also a significant main effect of starvation to
reduce nuclei number (~15%), suggesting this treatment may also induce apoptosis, as
has been described in mouse muscle myotubes (C2C12) (86). Despite the reduced
number of nuclei following starvation, starvation significantly reduced myotube
area/nucleus (~20%), demonstrating that loss of myotube size occurs to a greater
extent than loss of nuclei number. However, there was no significant interaction
between obesity and starvation on muscle atrophy. Following 24 h of starvation,
myotube area and myotube area/nucleus were similar between myotubes of the lean
and obese.
28
Discussion
Contrary to our original hypothesis, we found no differences in absolute protein
degradation rate between myotubes of the lean and severely obese, despite increased
FoxO3 gene expression. Importantly, flux through the major protein degradation
pathways, is altered in myotubes from the severely obese. To our knowledge, this is
the first study to directly measure flux through the UPS and autophagic/lysosomal
pathways of skeletal muscle from lean and severely obese humans. Given the distinct
roles of the UPS and autophagic/lysosomal pathways (84), the specific proteins
degraded during muscle atrophy may be substantially different between lean and
severely obese skeletal muscle.
HSkMC myotubes are an excellent model with which to study protein metabolism
in obesity. First, since the myoblasts are purified and passaged in culture for many
weeks (5), cells from lean and obese individuals are subject to the same extracellular
conditions. Therefore, the differences we observe are specific to skeletal muscle of lean
and severely obese and not due to different cell types, circulating factors, or physical
activity. Second, HSkMC myotubes, purified and passaged exactly as we have done
here, retain many metabolic characteristics observed in vivo (43). For instance, HSkMC
derived from severely obese individuals are insulin resistant (6) and have impaired fatty
acid oxidation (10). Therefore, phenotypic differences in myotubes are likely to be
present in vivo.
Compared to lean, both the absolute rate of flux through the
autophagic/lysosomal pathway and its relative contribution to total protein degradation
are decreased in myotubes from the extremely obese. The autophagic/lysosomal
29
pathway, but not the UPS, is responsible for the degradation of entire organelles, such
as mitochondria. It has previously been observed that obesity is accompanied by
impaired mitochondrial function (9). It is possible that decreased flux through the
autophagic/lysosomal pathway may slow degradation of damaged or non-functional
mitochondria within obese skeletal muscle. In support of this, Wu et al. (106) recently
described impaired mitochondrial respiration and insulin resistance in mice with skeletal
muscle deletion of Autoghapy-related gene 7 (Atg-7). Therefore, decreased
autophagic/lysosomal pathway flux may represent not only impaired protein metabolism
in obese skeletal muscle, but may also contribute to impaired carbohydrate and lipid
metabolism. Future research should aim to discover the mechanistic causes and clinical
significance of differential flux through the protein degradation pathways in obesity.
Additionally, we found that UPS flux is differentially regulated between lean and
obese myotubes in response to starvation. Compared to lean, UPS flux was 13% lower
in myotubes of the severely obese under basal conditions and 12% higher in response
to starvation. The increased UPS flux in response to starvation indicates a shift toward
UPS-mediated protein degradation in myotubes of the severely obese. It is well-known
that the UPS mediates degradation of specific proteins, including contractile proteins
(18). Despite elevated UPS flux, starved myotubes of the severely obese degrade
proteins and lose myotube area at similar rates as those of lean individuals (c,f. Figure
2.2 and 2.5). However, it is possible that this shift may result in increased degradation
of specific contractile proteins (18) and therefore contribute to lower specific force
generation in muscles of the obese (44). Future research should examine whether
30
there is a preferential loss of specific contractile proteins in skeletal muscle of the
severely obese during muscle atrophy.
UPS flux is determined by catabolic activity of the proteasome and protein
polyubiquitination and deubiquitination (3, 104, 105). We determined that maximal
proteasome activity is significantly greater in myotubes from obese individuals (c.f.
Figure 2.4). Recently, several proteins have been identified that bind to, and modify,
catabolic activity of the proteasome (21, 76). Therefore, it is possible that proteasome
binding partners are differentially expressed in obese skeletal muscle. However, we
noted that starvation increased proteasome activity to a similar extent in both lean and
obese myotubes. Therefore, it is unlikely that proteasome activity alone can explain the
elevated UPS flux seen in myotubes of the obese in response to starvation. Gene
expression of two major E3 ubiquitin ligases essential for muscle protein degradation,
Atrogin-1 and MuRF-1, were similarly expressed in myotubes from the lean and
severely obese under basal and starved conditions. However, it is possible that
increased expression of other E3 ligases or increased ubiquitin ligase activity may
explain the increased UPS flux in myotubes of the obese in response to starvation.
Alternatively, decreased expression of deubiquitinating enzymes during starvation may
increase UPS flux in myotubes of the obese. To date, few studies have examined the
role of deubiquitinating enzymes during muscle atrophy, although several
deubiquitinating enzymes are upregulated during muscle atrophy (3, 105).
Protein degradation responses are, at least in part, regulated at the level of gene
transcription (25, 33). We noted a similar pattern of gene expression between lean and
31
obese myotubes under basal, IGF-1, dexamethasone, or starved conditions; all genes
analyzed displayed a similar expression level between lean and obese myotubes with
the exception of FoxO3, which was higher in the obese. FoxO3 is known to activate
muscle atrophy through upregulation of genes involved in both the UPS and the
autophagic/lysosomal pathway (107). Interestingly, despite elevated FoxO3 gene
expression, we found similar expression patterns of the FoxO3-inducible genes Atrogin-
1, MuRF-1, LC3B, and Gabarapl-1 between lean and obese myotubes. This suggests
obese skeletal muscle may be resistant to the atrophic effects of FoxO3. Transcriptional
activity of FoxO3 is, in large part, dictated by Akt-mediated phosphorylation and
cytosolic sequestration (93). Sishi et al. (91) determined FoxO phosphorylation is
decreased in skeletal muscle of obese, pre-diabetic rats. Due to whole-body insulin
resistance observed in our severely obese subjects (Table 2.1), it is reasonable to
expect that FoxO3 phosphorylation may be reduced in these myotubes and therefore
inhibit FoxO3-induced gene expression.
Taken together, our data indicate that skeletal muscle of the lean and severely
obese atrophy at similar rates, but through different mechanisms. Specifically, skeletal
muscle of the severely obese has decreased flux through the autophagic/lysosomal
pathway under basal and starved conditions. Additionally, during starvation, skeletal
muscle of the severely obese experiences a relative shift toward UPS-mediated protein
degradation. Despite differential flux through the UPS and autophagic/lysosomal
pathways, total loss of myocellular size and total protein degradation rates are similar
between skeletal muscle of the lean and severely obese in response to starvation.
Myotubes of the severely obese overexpress FoxO3, a transcription factor largely
32
responsible for increasing transcription of genes involved in both the UPS and the
autophagic/lysosomal pathway, however, gene expression patterns of FoxO3-inducible
genes are similar between myotubes of the lean and severely obese.
33
Acknowledgements
Funding for this project was provided by Start-up funds from East Carolina
University to JJB, Start-up funds from East Carolina University to CAW, NIH RO1-
DK56112 to JAH, and a pre-doctoral award from the American College of Sports
Medicine Foundation to LMB. The authors would like to thank Jonathan Powell and Dr.
Jill Maples for their excellent technical contributions to this work

34
Tables and Figures
35
n Age BMI Fasting glucose
(mg/dl)
Fasting insulin
(µIU/ml)
HOMA-IR
Lean 10 24.2 ± 1.5 22.9 ± 0.8 85.2 ± 2.6 9.3 ± 1.1 1.65 ± 0.2
Obese 8 34.1 ± 3.3* 46.9 ± 2.1* 93.7 ± 2.9 18.2 ± 2.2* 4.27 ± 0.6*
Table 2.1. Subject characteristics. Data are presented as mean ± SEM. BMI = body mass index
(kg/m2). * Significantly different from lean (p<0.05).
36
Gene
Sequence (5' 3’)
TG
F-β
path
way
Myostatin
Fwd AAGACCAAAATCCCTTCTGGA
Rev CTGTAACCTTCCCAGGACCA
SMAD2
Fwd TGTTCTTACCAAAGGCAGCA
Rev CATCGGAAGAGGAAGGAACA
SMAD3
Fwd GTAGCTCGTGGTGGCTGTG
Rev AACACCAAGTGCATCACCAT
Ub
iqu
itin
-pro
teaso
me s
ys
tem
FoxO3
Fwd CTCTTGCCAGTTCCCTCATT
Rev CTTCAAGGATAAGGGCGACA
Atrogin-1
Fwd TCAGGGATGTGAGCTGTGAC
Rev GGGGGAAGCTTTCAACAGAC
MuRF-1
Fwd CTTCGTGCTCCTTGCACAT
Rev ATCGTCACGGAGTGTACGG
Au
top
hag
y
LC3B
Fwd TATCACCGGGATTTTGGTTG
Rev GAGAAGACCTTCAAGCAGCG
ATG4B
Fwd AGTATCCAAACGGGCTCTGA
Rev ACTGGGAAGATGGACGCAG
Gabarapl-1
Fwd TGGCTTTTGGAGCCTTCCT
Rev CCATCCCTTTGAGTATCGGA
Co
ntr
ol
gen
e
RPLPO
Fwd AGGCGTCCTCGTGGAAGTGACA
Rev TGCTGCATCTGCTTGGAGCCC
Table 2.2. Primers used for RT-PCR.
37
UP
S g
en
e e
xp
re
ss
ion
(Fo
ld r
el.
to
ba
sa
l)
F o x O 3 A tro g in -1M u R F -1 F o x O 3 A tro g in -1M u R F -1
0 .0
1 .0
2 .0
3 .0
4 .0
5 .0
6 .0
IG F -1
S ta rv e d
D e x
L e a n O b e s e
* *
* **
*
Au
top
ha
gy
ge
ne
ex
pre
ss
ion
(Fo
ld r
el.
to
ba
sa
l)
L C 3 B G a b a ra p l-1 A T G 4 B L C 3 B G a b a ra p l-1 A T G 4 B
0 .0
0 .5
1 .0
1 .5
2 .0
2 .5
IG F -1
S ta rv e d
D e x
L e a n O b e s e
* *
*
*
TG
F-
sig
na
lin
g g
en
e e
xp
re
ss
ion
(Fo
ld r
el.
to
ba
sa
l)
M S T N S M A D 2 S M A D 3 M S T N S M A D 2 S M A D 3
0 .0
0 .5
1 .0
1 .5
IG F -1
S ta rv e d
D e x
L e a n O b e s e
** * *
Ge
ne
ex
pre
ss
ion
(fo
ld r
el.
to
le
an
)
B a s a l S ta rv e d D e x IG F -1
0 .0
0 .5
1 .0
1 .5
2 .0
2 .5
B a s a l
IG F -1
S ta rv e d
D e x
*
A B
C D
Figure 2.1. IGF-1, dexamethasone, and starvation alter atrophy-related gene expression in
myotubes of lean and severely obese. Myotubes were treated for 24 h, RNA was collected, and RT-
PCR was performed. A: Genes involved in the ubiquitin-proteasome system (UPS). B: Genes involved
in the autophagic/lysosomal pathway. C: Genes involved in Transforming Growth Factor-β (TGF-β)
signaling. D: FoxO3 gene expression of obese myotubes expressed as fold relative to lean. Fold
changes were calculated using the relative standard curve method. Data are presented as mean ± SEM.
* Significant main effect of treatment (p<0.05).
38
Figure 2.2. Protein degradation rates of lean and obese myotubes respond similarly to atrophic
and hypertrophic stimuli. A: Protein degradation rate: myotubes were labeled with 3H-tyrosine for 24hr
then subjected to starvation, dexamethasone, or IGF-1. Protein degradation rate was calculated by the
amount of 3H in media samples collected over the course of 5hr (starved) or 20-30hr (IGF-1,
dexamethasone). Each data point is the mean of four replicates. B: Protein content: myotubes were
subjected to treatments for 24 h and protein content determined by BCA assay. Data are presented as
mean ± SEM. * Significant main effect of treatment (p<0.05).
Pro
tein
de
gra
da
tio
n r
ate
(%/h
)
B a s a l S ta rv e d B a s a l D e x IG F -1
0 .0
0 .5
1 .0
1 .5
2 .0
2 .5
L e a n
O b e s e
0 -5 h 2 0 -3 0 h
*P
ro
tein
co
nte
nt
( g
/we
ll)
B a s a l S ta rv e d D e x IG F -1
0
1 0 0
2 0 0
3 0 0
4 0 0 L e a n
O b e s e* *
A
B
39
Pro
tein
de
gra
da
tio
n r
ate
(%/h
)
Veh
icle
0.1M
1.0M
2.0M
0 .0
0 .5
1 .0
1 .5
2 .0
C o n c a n a m y c in A d o s a g e
*
P S -3 4 1 d o s a g e
Pro
tein
de
gra
da
tio
n r
ate
(%/h
)
Veh
icle
0.3M
1.0M
2.0M
5.0M
0 .0
0 .5
1 .0
1 .5
2 .0
*P
ro
tein
de
gra
da
tio
n r
ate
(%/h
)
Veh
icle
PS
-341
Co
nc. A
Veh
icle
PS
-341
Co
nc. A
0 .0
0 .5
1 .0
1 .5
2 .0
B a s a l
S ta rv e d
L e a n O b e s e
*
*
*
*
Pro
tein
de
gra
da
tio
n r
ate
(%/h
)
Pro
teaso
me
Lyso
so
me
Pro
teaso
me
Lyso
so
me
0 .0
0 .2
0 .4
0 .6
0 .8
1 .0
B a s a l
S ta rv e d
L e a n O b e s e
* *
Dif
fere
nc
e i
n p
ro
tein
de
gra
da
tio
n r
ate
(O
be
se
- L
ea
n)
To
tal
Pro
teaso
me
Lyso
so
me
-0 .2
-0 .1
0 .0
0 .1
0 .2
B a s a l
S ta rv e d*
†
A B
C D
E
Figure 2.3. Flux through the ubiquitin-proteasome system and autophagic/lysosomal pathway is
altered in myotubes from the severely obese. Pooled myotubes (three individuals per group) were
treated with the proteasome inhibitor PS-341 and/or the lysosome inhibitor Concanamycin A, incubated in
serum and amino acid free media, and protein degradation rates determine by 3H-tyrosine release. A-B:
Dose-response curves for inhibitors used. C: Protein degradation rates in response to inhibitors. D:
Inhibitor-sensitive proteolysis was determined by subtracting the degradation rate in the presence of
inhibitors from vehicle-treated controls. E: Differences in protein degradation rates were determined by
subtracting values of lean from obese (Δ Degradation rate = degradation rateobese – degradation ratelean).
Data are presented as mean ± SEM. * Significant main effect of treatment (p<0.05). † Significant main
effect between groups (p<0.05). § Significant interaction effect (p<0.05).
40
Pro
tea
so
me
ac
tiv
ity
(vm
ax
/se
c/
g p
ro
tein
)
L e a n O b e s e
0 .0 0
0 .2 0
0 .4 0
0 .6 0
B a s a l
S ta rv e d
†‡
Figure 2.4. Proteasome activity is increased in myotubes from the severely obese. Chymotrypsin-
like activity was assessed by the fluorogenic substrate Suc-LLVY-amc. ‡ Significant main effect (basal vs
starved, p<0.05). † Significant main effect (lean vs obese, p<0.05).
41
My
otu
be
are
a (
m2
x 1
05
)
L e a n O b e s e
0
2
4
6
8
1 0
B a s a l
S ta rv e d
‡
Nu
cle
i c
ou
nt
L e a n O b e s e
0
2 0 0
4 0 0
6 0 0
8 0 0
B a s a l
S ta rv e d
‡
My
otu
be
are
a/n
uc
leu
s
(
m2
/nu
c)
L e a n O b e s e
0
5 0 0
1 0 0 0
1 5 0 0
2 0 0 0
B a s a l
S ta rv e d
‡
Overlay Myosin Heavy Chain Nuclei
Basal
Starved
A B
C D
Figure 2.5. Myotubes from lean and severely obese atrophy at similar rates. A: Representative
two-colored fluorescent images stained for both myosin heavy chain and nuclei (Overlay). Images were
split from RGB format to individual components and converted to threshold images representing Myosin
Heavy Chain and Nuclei, B: Myotube area (μm2). C: Number of nuclei. D: Myotube area per nucleus
(μm2/nucleus). Individual data points are presented. ‡ Significantly different vs basal (p<0.05).
42
IG F -1 d o s a g e
Pro
tein
sy
nth
eis
(DP
M/
g t
ota
l p
ro
tein
)
Ve h ic le 1 0 n M 1 0 0 n M
0 .0
5 0 .0
1 0 0 .0
1 5 0 .0
2 0 0 .0
*
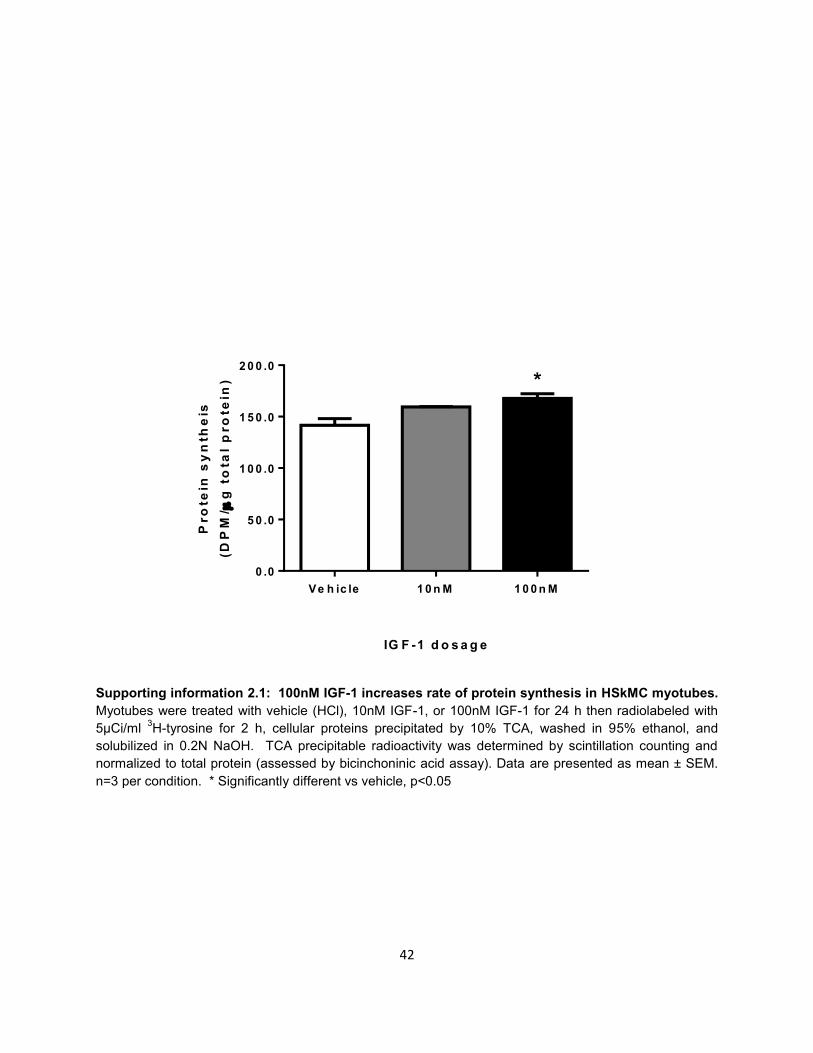
Supporting information 2.1: 100nM IGF-1 increases rate of protein synthesis in HSkMC myotubes.
Myotubes were treated with vehicle (HCl), 10nM IGF-1, or 100nM IGF-1 for 24 h then radiolabeled with
5μCi/ml 3H-tyrosine for 2 h, cellular proteins precipitated by 10% TCA, washed in 95% ethanol, and
solubilized in 0.2N NaOH. TCA precipitable radioactivity was determined by scintillation counting and
normalized to total protein (assessed by bicinchoninic acid assay). Data are presented as mean ± SEM.
n=3 per condition. * Significantly different vs vehicle, p<0.05
43
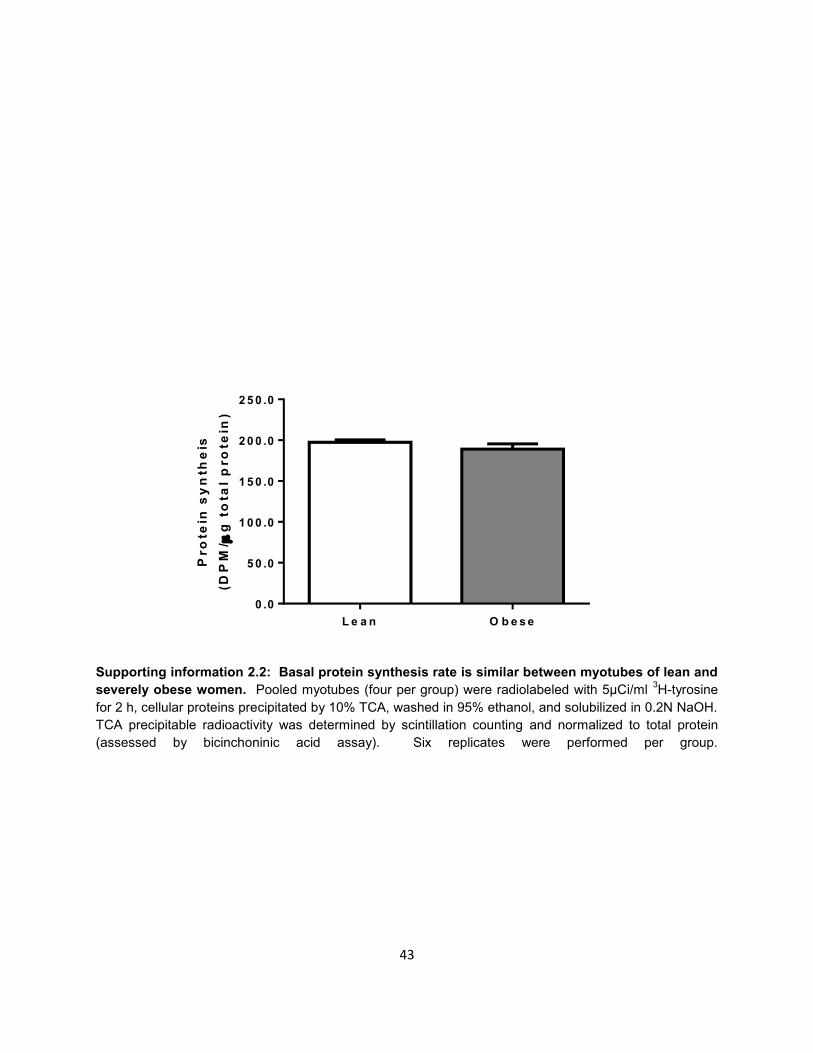
Supporting information 2.2: Basal protein synthesis rate is similar between myotubes of lean and
severely obese women. Pooled myotubes (four per group) were radiolabeled with 5μCi/ml 3H-tyrosine
for 2 h, cellular proteins precipitated by 10% TCA, washed in 95% ethanol, and solubilized in 0.2N NaOH.
TCA precipitable radioactivity was determined by scintillation counting and normalized to total protein
(assessed by bicinchoninic acid assay). Six replicates were performed per group.
Pro
tein
sy
nth
eis
(DP
M/
g t
ota
l p
ro
tein
)
L e a n O b e s e
0 .0
5 0 .0
1 0 0 .0
1 5 0 .0
2 0 0 .0
2 5 0 .0
Chapter 3: SMAD3 regulates FoxO-induced MuRF-1 gene transcription via dual
mechanisms
Abstract
During muscle atrophy, Muscle-specific RING Finger-1 (MuRF-1) targets muscle
contractile proteins for rapid degradation. The transcription factors SMAD3 and FoxO
independently increase transcription of protein degradation genes and cause muscle
atrophy. However, it is not known whether these transcription factors coordinately
regulate transcription of ubiquitin ligases. It is possible that these transcription factors
synergistically increase transcription of ubiquitin ligases during muscle atrophy. The
purpose of the current project was to determine the additive effects of these
transcription factors on ubiquitin ligase gene transcription. Methods: C2C12 myotubes
were infected with adenoviruses encoding for SMAD3 and/or FoxO3 and gene
expression of Atrogin-1 and MuRF-1 measured by RT-PCR. Human embryonic kidney
(HEK293a) cells were co-transfected with plasmid DNA encoding MuRF-1 luciferase
reporters (wt or SBE-mutant), FoxO1, FoxO3, and/or SMAD3. Results:
Overexpression of FoxO3 increased gene expression of Atrogin-1 and MuRF-1 and this
effect was synergistically increased by co-expression of SMAD3. Co-expression of
FoxO3 and SMAD3 synergistically increased FoxO3 and SMAD3 DNA interactions and
MuRF-1 promoter activity. Mutagenesis of the SMAD binding elements eliminated
SMAD3-DNA interactions and significantly attenuated FoxO3-DNA interactions and
FoxO-induced MuRF-1 promoter activity, suggesting SMAD3 is essential for optimal
FoxO-induced transcription of MuRF-1. SMAD3 overexpression increased FoxO3
protein content in a dose-dependent manner, but had no effect on FoxO1 or FoxO3
45
mRNA. Co-expression of FoxO3 and SMAD3 synergistically increased FoxO-
dependent gene transcription as indicated by FRE-driven luciferase activity.
Conclusions: SMAD3 synergistically increases FoxO-induced transcription of the
ubiquitin ligases Atrogin-1 and MuRF-1. SMAD3 appears to be essential for optimal
FoxO-induced MuRF-1 gene transcription by increasing FoxO binding to the proximal
promoter region. Additionally, SMAD3 overexpression increases protein content and
transcriptional activity of FoxO, possibly by inhibiting degradation of FoxO protein. We
conclude that SMAD3 regulates gene transcription of ubiquitin ligases through a dual
effect on FoxO: 1) increasing FoxO protein content and transcriptional activity and 2)
increasing FoxO binding at conserved FRE-SBE motifs within the proximal promoter
region.
46
Introduction
Skeletal muscle mass is dictated by the balance between protein synthesis and
degradation rates (34). Severe loss of muscle mass, or muscle atrophy, is
characterized by an increased protein degradation rate. This is especially true for
ubiquitin proteasome system (UPS)-mediated protein degradation (46). Numerous
forms of muscle atrophy activate a common transcriptional program to induce
expression of genes involved in protein degradation, including the ubiquitin ligases
Atrogin-1 and Muscle-specific RING Finger-1 (MuRF-1) (54, 78, 82). Atrogin-1
promotes degradation of eukaryotic translation initiation factor 3F (eIF3-F) (20) as well
as desmin and vemintin (58). During muscle atrophy, MuRF-1 targets contractile
proteins of the thick filament for degradation (18), thereby contributing to both
decreased skeletal muscle mass and decreased muscle force development.
Furthermore, these ubiquitin ligases are essential for muscle atrophy (8) and are known
to be, at least in part, transcriptionally regulated (54). Unfortunately, the cellular
mechanisms regulating transcription of Atrogin-1 and MuRF-1 are incompletely
understood.
Atrogin-1 and MuRF-1 gene expression is clearly regulated, at least in part, by
the transcription factor Forkhead box type O (FoxO) (81, 87, 100). FoxO1 and 3 are
sufficient to induce protein degradation (83, 107), Atrogin-1 (83) and MuRF-1 gene
expression (87, 100), and ultimately, muscle atrophy. FoxO recognizes the FoxO
Response Element (FRE, (A/G)TAAA(T/C)A) within the promoter region to induce
transcription of Atrogin-1 and MuRF-1 (83, 100). Interestingly, the synthetic
glucocorticoid dexamethasone synergistically increases FoxO-induced MuRF-1
47
promoter activity (100), suggesting that FoxO may require DNA binding partners to fully
activate the MuRF-1 promoter region.
One potential FoxO DNA binding partner is SMAD3, a transcription factor
activated by the Transforming Growth Factor-β (TGF-β) pathway. A recent meta-
analysis of human and rodent microarray studies implicated the TGF-β pathway as the
core pathway and SMAD3 as a major signaling node for general muscle atrophy (13).
Gene expression of Atrogin-1 and MuRF-1 is increased following administration of the
TGF-β family member myostatin in vitro (56, 57). Overexpression of SMAD3 induces
muscle atrophy and Atrogin-1 gene expression, but is insufficient to induce MuRF-1
gene transcription in vitro (35) or in vivo (85). Therefore the direct role of SMAD3
transcriptional regulation of ubiquitin ligases is somewhat controversial. SMAD3
regulates FoxO activity by inhibiting Akt-mediated phosphorylation (and cytosolic
sequestration) of FoxO (4, 67, 99). FoxO and SMAD transcription factors have
previously been shown to physically associate and synergistically regulate the cyclin-
dependent kinase inhibitor p21Cip1 gene expression (88). Furthermore, of 115 genes
regulated by TGF-β in keratinocytes, 11 require FoxO as a DNA binding partner (33).
Therefore, it is possible that SMAD3 may modulate FoxO-induced transcription of
muscle-specific ubiquitin ligases.
Both SMAD3 and FoxO transcription factors are known to be major regulators of
the transcriptional program that induces muscle atrophy (37). The effects of these
transcription factors on atrophy have largely been studied independently; the effects of
the interaction between these transcription factors have not been well characterized.
The purpose of the present study was to determine how FoxO- and SMAD3- DNA

48
interactions coordinately regulate gene expression of muscle-specific ubiquitin ligases.
Since it has previously been reported that SMAD3 and FoxO coordinately regulate
several genes, we hypothesized that SMAD3 functions to augment FoxO-dependent
gene transcription of ubiquitin ligases.
49
Methods:
Cell culture:
Primary human skeletal muscle myoblasts (HSkMC) were generated as
previously described (5) by isolating satellite cells from muscle biopsies of the vastus
lateralis from four female subjects. Myoblasts were pooled and cultured together in
Dulbecco’s modified Eagle’s medium (DMEM) supplemented with 10 % fetal bovine
serum, rhEGF, dexamethasone, gentamycin, BSA, and fetuin (SkGM Singlequots,
Lonza). Upon reaching confluence, growth media was switched to low serum media (2
% horse serum) supplemented with 3 % BSA and 0.1 % fetuin to induce differentiation
into myotubes. Experiments were performed on day 6 of differentiation using two
independent pools.
Human Embryonic Kidney (HEK, 293a) cells were cultured in DMEM
supplemented with 10 % fetal bovine serum and 1 % penicillin/streptomycin. For all
experiments, cells were seeded into six well plates at a density of 2.5 x 10⁵ cells per
well and allowed to adhere to the plate overnight.
Mouse skeletal muscle myoblasts (C2C12) were cultured in DMEM
supplemented with 10 % fetal bovine serum and 1 % penicillin/streptomycin and
maintained at sub-confluent density prior to differentiation. For all experiments,
myoblasts were seeded into six well plates at a density of 2.5x10⁵ cells per well and
allowed to adhere to the plate overnight. Growth media was switched to low serum
media (2 % horse serum) to induce differentiation into myotubes. Experiments were
50
performed on day 5 of differentiation. All cell cultures were maintained at 37°C and 5 %
CO2 and media was changed every 48 h.
Protein Degradation Rate:
Protein degradation rates were determined by release of a radiolabeled amino
acid as previously described (11). Terminally differentiated myotubes were radiolabeled
with L-[3,5-3H] tyrosine (5 µCi/ml, PerkinElmer Life Sciences) for 24 h. Cells were
thoroughly washed and radioactivity chased for 2 h using differentiation media
supplemented with 2 mM L-tyrosine to allow degradation of short-lived proteins and to
limit re-incorporation of the radiolabel. Myotubes were then subjected to atrophic
stimuli. For HSkMC experiments, myotubes were incubated in media lacking serum
(DMEM only), lacking amino acids (HBSS+2 %HS), or lacking both serum and amino
acids (HBSS only). Four serial media samples were collected over the course of 5 h.
At the end of the experiments, culture media was removed completely and myotubes
were solubilized in 0.2N NaOH. Radioactivity of cells and TCA precipitated media
samples was measured using scintillation counting. Total radioactivity was calculated
as the sum of the residual radioactivity in the myotubes plus radioactivity of all time
points. Protein degradation rate was directly calculated as a percentage of total [3H]
tyrosine incorporation from the regression line of serial samples for each individual.
RT-PCR:
HSkMC myotubes were subjected to atrophic conditions as described above for
24 h. C2C12 myotubes (d4 differentiation) were infected with adenovirus expressing
51
human wtSMAD3 (ad-wtSMAD3, Vector biosystems) for 24 h, then co-infected with
adenovirus encoding human wtFoxO3 (ad-wtFoxO3, gift of Dr. Alfred Goldberg,
University of Harvard Medical School) for an additional 24 h. Myotubes were washed
twice with PBS and RNA collected using TRIzol (Ambion). RNA was stored at -80°C
until processing. RNA integrity was determined by agarose gel electrophoresis. RNA
concentration and purity (Ab260/280) was assessed spectrophometrically using a
NanoDrop UV-Vis spectrophometer (ThermoScientific, ND-1000). RNA was reversed
transcribed to cDNA (Quanta Biosciences) at a final concentration of 0.10 µg/µl. For
both HSkMC and C2C12 experiments, Large Ribosomal Protein (RPLPO) was used as
an endogenous control gene and fold expression was calculated using the ΔΔCt
method. Custom RT-PCR primers (Table 3.1) were generated using NCBI BLAST
algorithms (http://blast.ncbi.nlm.nih.gov/Blast.cgi) and specificity confirmed by agarose
gel electrophoresis following conventional PCR. All RT-PCR experiments were run with
a standard curve of eight orders of magnitude and amplification efficiency was
determined to be near 100%.
Luciferase Reporter Assay
Plasmid vectors
Plasmids encoding wild type human FoxO1 (97), FoxO3 (79), SMAD3 (52), and
dominant-negative SMAD3 (dnSMAD3) (16), were purchased from addgene (addgene
plasmids13507, 10710, 11742, and 12638 respectively). The FoxO Response Element
reporter (FRE-luc) was a kind gift of Dr. Marco Sandri (Dulbecco Telethon Institute)
(83). The 5kb pGL3 wtMuRF-1 reporter (mouse) was a kind gift of Dr. Monte S. Willis
52
(University of North Carolina School of Medicine). This reporter has previously been
used to examine MuRF-1 promoter activity both in vivo (85) and in vitro (100). The
promoter region of this plasmid was confirmed by DNA sequencing and aligned against
the human MuRF-1 promoter region using NCBI algorithms
(http://blast.ncbi.nlm.nih.gov) to identify conserved sequences. Site-directed
mutagenesis (Stratagene) of two putative SMAD-binding elements (SBE, AGAC) within
the proximal promoter region (5 and 11 bp upstream of the transcriptional start site) was
performed to generate a 5kb mutant MuRF-1 reporter (SBE-mut). These AGAC
sequences were mutated to AGgg and AtcC as described by Seoane et al (88). Both
the 5kb wild type and 5kb SBE-mut reporters were truncated to approximately 2kb
(digested with NheI and NdeI) and 0.25kb (digested with NheI and PstI) followed by
blunt-end ligation (New England Biolabs). The promoter regions of these reporters
were sequenced and aligned against the wild type reporter to confirm effective
mutagenesis.
Luciferase assay
HEK cells were transfected with 2.0μg (including 0.25µg reporter DNA) of total
plasmid DNA per well using FuGene 6 per manufacturer’s recommendations
(Promega). An eGFP plasmid was used as a transfection control and to balance total
DNA transfection between conditions. Experiments were performed 48 h post-
transfection. Cells were washed twice with PBS and collected in 1x passive lysis buffer
per manufacturer’s recommendation (Promega). Samples were spun at 20,000 x g for
53
5 min and 20 µl of the supernatant pipetted into a white 96-well plate with 100 µl of
substrate. Luminescence was measured using a microplate reader (Spectramax M4).
Luciferase values were normalized to total protein content as measured by bicinchoninic
acid (BCA) assay (ThermoScientific) and expressed as fold relative to eGFP transfected
cells.
Chromatin Immunoprecipitation
HEK cells were plated in 10cm dishes (n=6 per group) at a density of 2.0x10⁶
cells per dish allowed to adhere overnight, then transfected with plasmid DNA encoding
either wt or SBE-mut 0.25kb MuRF-1 reporter and 1) eGFP, 2) wtFoxO3, 3) SMAD3, or
4) wtFoxO3 + wtSMAD3. Forty-eight hours after transfection, proteins were cross-
linked with chromatin using 1% formaldehyde and DNA was collected. DNA was
sheared by sonication to approximately 1kb fragments and antibodies against FoxO3
(Cell Signaling #2497), SMAD3 (Cell Signaling #9523), or IgG (negative control) were
used to immunoprecipitate DNA. After cross-linking was reversed, RT-PCR was
performed for the proximal region of the 0.25kb MuRF-1 reporter using primers flanking
the FRE-SBE motif. Using primers specific for the reporter accomplished our three-fold
goal: 1) confirming mutagenesis eliminated SMAD3 binding within the MuRF-1 promoter
region, 2) bypassing epigenetic modifications, such as CpG methylation that may
prevent MuRF-1 expression in HEK cells, and 3) eliminating effects of secondary and
tertiary DNA structure on DNA binding.
54
Western blotting:
C2C12 myotubes were infected with adenoviruses encoding GFP or SMAD3
(Vector Biosystems) for 24 h. Cells were washed twice with PBS and protein collected
using freshly made Radio-Immunoprecipitation Assay (RIPA) buffer containing 1% NP-
40, 0.5% sodium deoxycholate, 0.1% SDS, and protease inhibitor cocktail (Roche
Complete Mini). Samples were vortexed continuously for 1min, rotated end-over-end
for 30 min, then centrifuged at 12,000 x g for 10min and the pellet discarded. Proteins
were separated by SDS-PAGE, transferred to a polyvinylidene difluoride membrane and
incubated with primary antibodies against FoxO3 (Cell Signaling #2497, 1:1000) or
SMAD3 (Cell Signaling #9523, 1:5000) overnight. Secondary antibodies were
conjugated to horseradish peroxidase and detected using an ECL substrate (Millipore).
Band imaging and analysis was performed using a Bio-Rad Chemi Doc XRS and Image
Lab software.
Statistics:
Data are presented as mean ± SEM. Statistical significance (p<0.05) was
assessed using analysis of variance (ANOVA) followed by Tukey’s honestly significant
difference post-hoc test when appropriate. All analyses were performed using SPSS
version 19.0.
55
Results:
Starvation increases protein degradation rate and ubiquitin ligase gene
expression in vitro
In order to determine the response of ubiquitin ligases to muscle atrophy, we
measured protein degradation rate and gene expression of Atrogin-1 and MuRF-1 in
primary HSkMC myotubes in response to three atrophic stimuli. As expected, serum
starvation, amino acid starvation, or combined serum and amino acid starvation
increased protein degradation rates relative to basal in a step-wise manner (Figure
3.1A). Likewise, atrophy stimulation increased gene expression of both Atrogin-1
(Figure 3.1B) and MuRF-1 (Figure 3.1C) in a step-wise manner. Gene expression of
both Atrogin-1 and MuRF-1 was increased following 5 h of atrophy stimulation.
Although the magnitude of the effect was decreased, gene expression of Atrogin-1 and
MuRF-1 remained elevated following 30 h of atrophy stimulation. Thus increased gene
expression of Atrogin-1 and MuRF-1 is a robust and early response to atrophy
stimulation in human skeletal muscle.
SMAD3 and FoxO3 synergistically regulate transcription of Atrogin-1 and MuRF-1
In order to determine the additive effects of SMAD3 and FoxO3 co-expression on
transcription of ubiquitin ligases, we measured Atrogin-1 and MuRF-1 gene expression
in C2C12 myotubes infected with ad-wtSMAD3 and/or ad-wtFoxO3. As shown in Figure
3.2A, wtFoxO3, but not wtSMAD3, significantly increased gene expression of Atrogin-1.
Co-expression of wtFoxO3 and wtSMAD3 increased Atrogin-1 gene expression to a
56
greater extent than wtFoxO3 alone. Similarly, overexpression of wtFoxO3, but not
SMAD3, increased MuRF-1 gene expression and co-expression of wtFoxO3 and
wtSMAD3 increased MuRF-1 gene expression to a greater extent than wtFoxO3 alone
(Figue 3.2B). Together, this data indicates that FoxO3 and SMAD3 synergistically
increase gene expression of Atrogin-1 and MuRF-1.
Examining the promoter regions of Atrogin-1 and MuRF-1 in the mouse genome
revealed that putative SBEs occur within close proximity (9-31 bp) of consensus FREs
within the proximal promoter regions of both genes (FRE-SBE motif). The spacing
between these binding sites is similar to that found for other genes coordinately
regulated by SMAD and FoxO transcription factors (2, 33). In the mouse Atrogin-1
promoter region, we found three such FRE-SBE motifs within 1.5 kb upstream of the
transcriptional start site including one located 2 bp upstream of the transcriptional start
site. In the human Atrogin-1 promoter region, we found one FRE-SBE motif located 22
bp upstream of the transcriptional start site. Using open-access software, we were
unable to determine any highly conserved sequences between mouse and human
genomes in the Atrogin-1 promoter region. In the mouse MuRF-1 promoter region, we
identified two FRE-SBE motifs within 1.5 kb of the transcriptional start site. Aligning the
promoter regions of the MuRF-1 gene (TRIM62) revealed the proximal 0.25kb of the
MuRF-1 gene is highly conserved (83% homology) between mouse and human
genomes. Furthermore, one FRE-SBE motif, located 2 bp from the transcriptional start
site is entirely conserved between species (Figure 3.3A). Therefore, we focused on the
MuRF-1 gene in order to determine the mechanistic action mediating the synergistic
effects of SMAD3 and FoxO3.
57
In order to determine whether the synergistic effect of SMAD3 and FoxO is
mediated by increased MuRF-1 promoter activity, we co-transfected HEK cells with a
5kb wtMuRF-1 reporter, wtFoxO1, wtFoxO3, and/or wtSMAD3 plasmid DNA (Figure
3.3B). Overexpression of wtFoxO3, but not wtFoxO1, significantly increased MuRF-1
promoter activity. As previously reported (35, 85), overexpression of wtSMAD3 had no
effect on MuRF-1 promoter activity. Co-expression of wtFoxO1 + wtSMAD3 or
wtFoxO3 + wtSMAD3 increased MuRF-1 promoter activity to a greater extent than
wtFoxO1 or wtFoxO3 alone, indicating a synergistic effect of these transcription factors
on MuRF-1 promoter activity.
The proximal 0.25kb MuRF-1 promoter region is a major regulator of
transcriptional activity
In order to determine the contribution of the proximal 0.25kb promoter region and
the FRE-SBE motif to MuRF-1 promoter activity, we created a series of reporters
through site-directed mutagenesis (SBE-mut, AGACCAAGAC→AGggCAAtcC) and
restriction digestion (5kb, 2kb, and 0.25kb) of the 5kb MuRF-1 luciferase reporter
(Figure 3.3C). These reporters were co-transfected into HEK cells and basal promoter
activity measured (Figure 3.3D). The wt2kb reporter retained 100% of basal
transcriptional activity, while the wt0.25kb reporter retained 37% of basal transcriptional
activity indicating the highly conserved proximal 0.25kb promoter region is a major
determinant of basal MuRF-1 promoter activity. Interestingly, the SBE-mut reporters
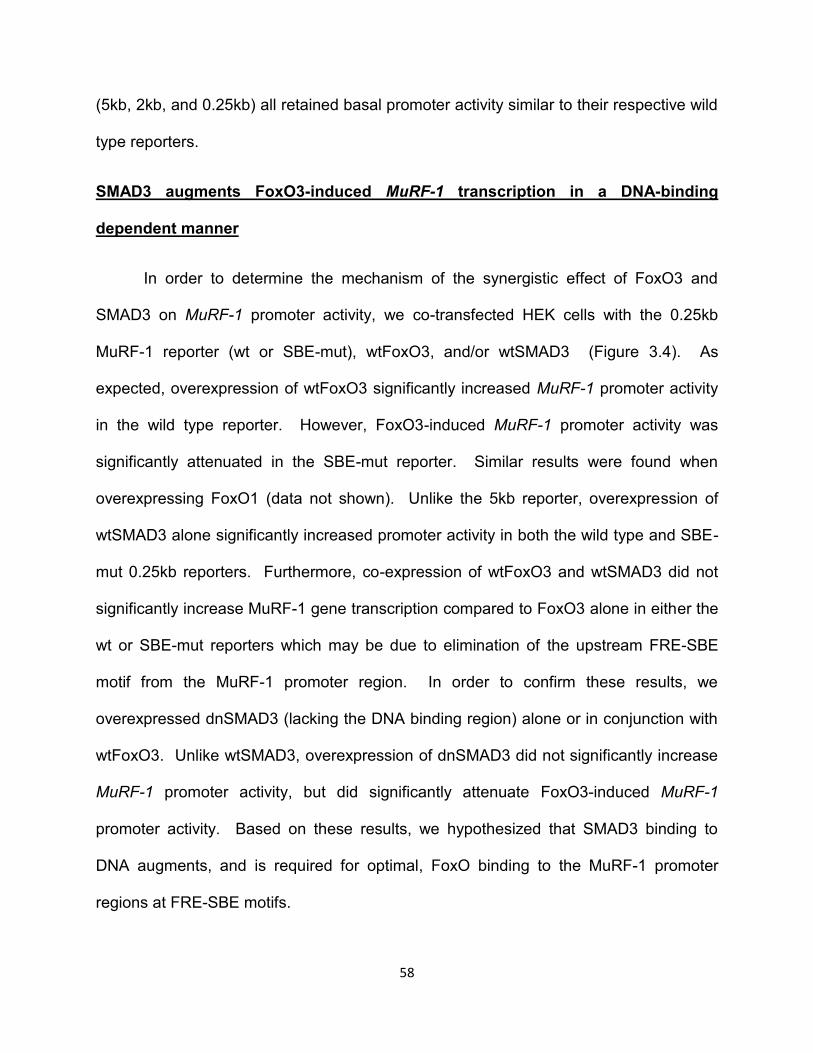
58
(5kb, 2kb, and 0.25kb) all retained basal promoter activity similar to their respective wild
type reporters.
SMAD3 augments FoxO3-induced MuRF-1 transcription in a DNA-binding
dependent manner
In order to determine the mechanism of the synergistic effect of FoxO3 and
SMAD3 on MuRF-1 promoter activity, we co-transfected HEK cells with the 0.25kb
MuRF-1 reporter (wt or SBE-mut), wtFoxO3, and/or wtSMAD3 (Figure 3.4). As
expected, overexpression of wtFoxO3 significantly increased MuRF-1 promoter activity
in the wild type reporter. However, FoxO3-induced MuRF-1 promoter activity was
significantly attenuated in the SBE-mut reporter. Similar results were found when
overexpressing FoxO1 (data not shown). Unlike the 5kb reporter, overexpression of
wtSMAD3 alone significantly increased promoter activity in both the wild type and SBE-
mut 0.25kb reporters. Furthermore, co-expression of wtFoxO3 and wtSMAD3 did not
significantly increase MuRF-1 gene transcription compared to FoxO3 alone in either the
wt or SBE-mut reporters which may be due to elimination of the upstream FRE-SBE
motif from the MuRF-1 promoter region. In order to confirm these results, we
overexpressed dnSMAD3 (lacking the DNA binding region) alone or in conjunction with
wtFoxO3. Unlike wtSMAD3, overexpression of dnSMAD3 did not significantly increase
MuRF-1 promoter activity, but did significantly attenuate FoxO3-induced MuRF-1
promoter activity. Based on these results, we hypothesized that SMAD3 binding to
DNA augments, and is required for optimal, FoxO binding to the MuRF-1 promoter
regions at FRE-SBE motifs.
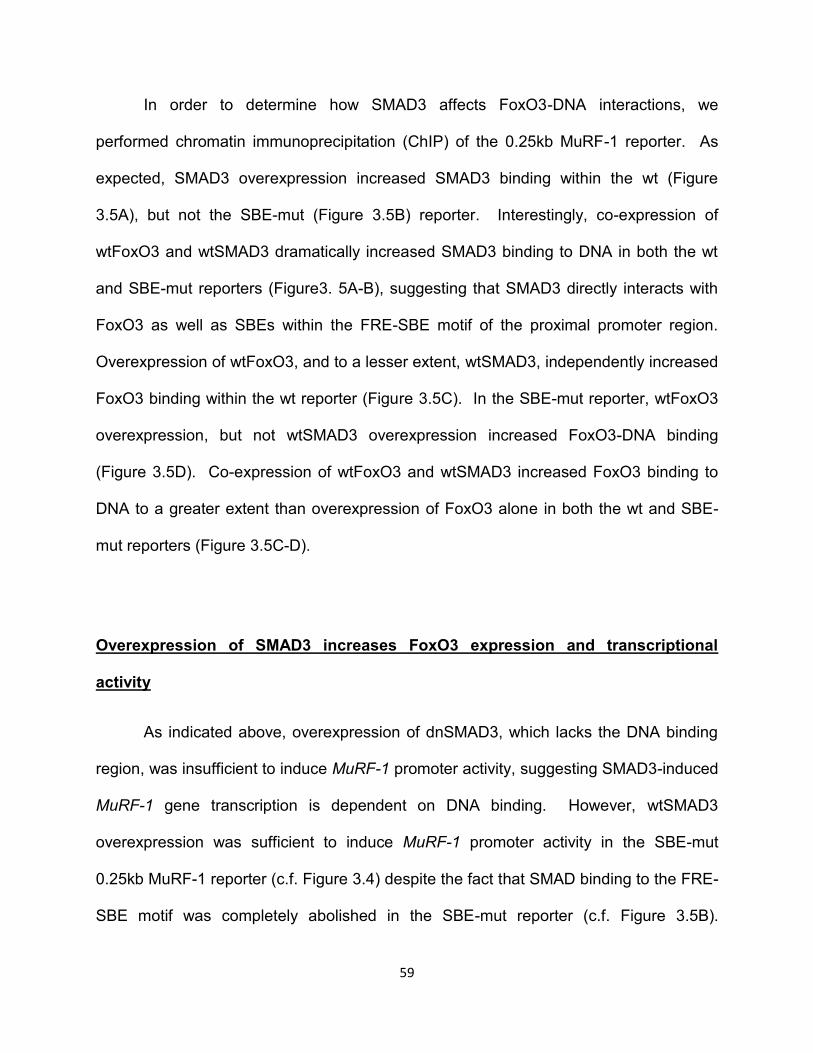
59
In order to determine how SMAD3 affects FoxO3-DNA interactions, we
performed chromatin immunoprecipitation (ChIP) of the 0.25kb MuRF-1 reporter. As
expected, SMAD3 overexpression increased SMAD3 binding within the wt (Figure
3.5A), but not the SBE-mut (Figure 3.5B) reporter. Interestingly, co-expression of
wtFoxO3 and wtSMAD3 dramatically increased SMAD3 binding to DNA in both the wt
and SBE-mut reporters (Figure3. 5A-B), suggesting that SMAD3 directly interacts with
FoxO3 as well as SBEs within the FRE-SBE motif of the proximal promoter region.
Overexpression of wtFoxO3, and to a lesser extent, wtSMAD3, independently increased
FoxO3 binding within the wt reporter (Figure 3.5C). In the SBE-mut reporter, wtFoxO3
overexpression, but not wtSMAD3 overexpression increased FoxO3-DNA binding
(Figure 3.5D). Co-expression of wtFoxO3 and wtSMAD3 increased FoxO3 binding to
DNA to a greater extent than overexpression of FoxO3 alone in both the wt and SBE-
mut reporters (Figure 3.5C-D).
Overexpression of SMAD3 increases FoxO3 expression and transcriptional
activity
As indicated above, overexpression of dnSMAD3, which lacks the DNA binding
region, was insufficient to induce MuRF-1 promoter activity, suggesting SMAD3-induced
MuRF-1 gene transcription is dependent on DNA binding. However, wtSMAD3
overexpression was sufficient to induce MuRF-1 promoter activity in the SBE-mut
0.25kb MuRF-1 reporter (c.f. Figure 3.4) despite the fact that SMAD binding to the FRE-
SBE motif was completely abolished in the SBE-mut reporter (c.f. Figure 3.5B).
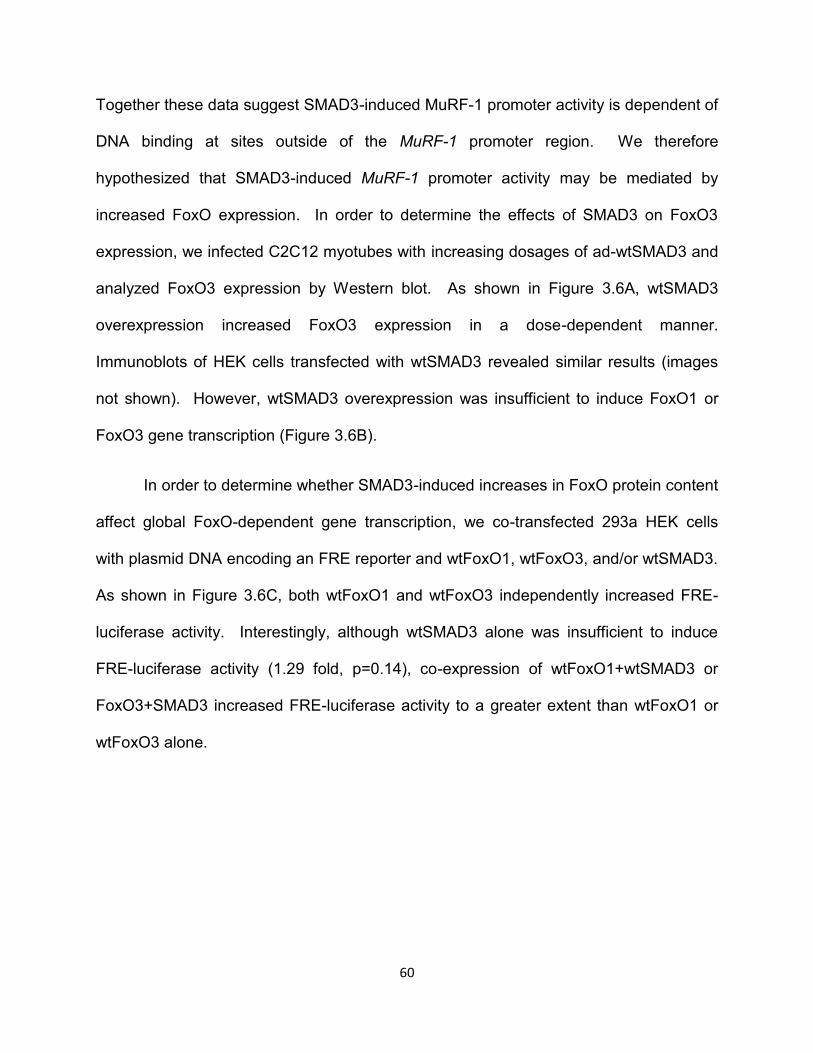
60
Together these data suggest SMAD3-induced MuRF-1 promoter activity is dependent of
DNA binding at sites outside of the MuRF-1 promoter region. We therefore
hypothesized that SMAD3-induced MuRF-1 promoter activity may be mediated by
increased FoxO expression. In order to determine the effects of SMAD3 on FoxO3
expression, we infected C2C12 myotubes with increasing dosages of ad-wtSMAD3 and
analyzed FoxO3 expression by Western blot. As shown in Figure 3.6A, wtSMAD3
overexpression increased FoxO3 expression in a dose-dependent manner.
Immunoblots of HEK cells transfected with wtSMAD3 revealed similar results (images
not shown). However, wtSMAD3 overexpression was insufficient to induce FoxO1 or
FoxO3 gene transcription (Figure 3.6B).
In order to determine whether SMAD3-induced increases in FoxO protein content
affect global FoxO-dependent gene transcription, we co-transfected 293a HEK cells
with plasmid DNA encoding an FRE reporter and wtFoxO1, wtFoxO3, and/or wtSMAD3.
As shown in Figure 3.6C, both wtFoxO1 and wtFoxO3 independently increased FRE-
luciferase activity. Interestingly, although wtSMAD3 alone was insufficient to induce
FRE-luciferase activity (1.29 fold, p=0.14), co-expression of wtFoxO1+wtSMAD3 or
FoxO3+SMAD3 increased FRE-luciferase activity to a greater extent than wtFoxO1 or
wtFoxO3 alone.
61
Discussion:
The major finding of this study is that SMAD3 synergistically augments FoxO-
induced transcription of muscle-specific ubiquitin ligases Atrogin-1 and MuRF-1 by
increasing FoxO binding to DNA at FRE-SBE motifs within the promoter region of these
genes. While a few studies have found these transcription factors coordinately regulate
gene expression (2, 33, 89), to our knowledge this is the first study to demonstrate a
synergistic effect of these transcription factors on transcription of E3 ubiquitin ligases.
Our data indicate that two major pathways (IGF-1-Akt-FoxO pathway and TGF-β
signaling) regulating skeletal muscle mass converge to synergistically upregulate genes
involved in UPS-mediated protein degradation.
Both FoxO and SMAD transcription factors are known to increase protein
degradation (56, 83, 85, 107). FoxO transcription factors are known to upregulate
transcription of both Atrogin-1 (83) and MuRF-1 (100) by binding the FRE within the
promoter regions of these genes, but the role of SMAD3 is less clear. Sartori (85) and
Goodman (35) showed that SMAD3 was sufficient to induce expression of Atrogin-1 and
induce muscle atrophy, but was insufficient to induce MuRF-1 gene transcription. Our
data confirm that SMAD3 overexpression is insufficient to induce 5kb MuRF-1 promoter
activity or MuRF-1 gene expression, but demonstrate that SMAD3 augments FoxO-
induced gene expression of Atrogin-1 and MuRF-1. Genetic knockdown of FoxO (81,
87, 93) or SMAD (30, 38) prevents muscle atrophy in numerous chronic conditions.
Since both Atrogin-1 and MuRF-1 are required for muscle atrophy (8), it is possible that
disrupting the synergistic effects of FoxO and SMAD3 may preserve muscle mass
during cachectic conditions by preventing upregulation of these ubiquitin ligases.
62
Furthermore, we have demonstrated that SMAD3 binding to the FRE-SBE motif
is essential for optimal FoxO-induced MuRF-1 gene transcription. Overexpression of a
dnSMAD3 or a SBE-mut MuRF-1 reporter significantly attenuated FoxO-induced MuRF-
1 promoter activity (cf Figure 3.4). Additionally, we demonstrated that FoxO3-DNA
binding was dramatically reduced in the SBE-mut reporter (cf Figure 3.5C-D).
Interestingly, SMAD3-DNA binding increases with co-expression of FoxO3 and SMAD3,
even in the SBE-mut reporter (see Figure 5A-B), indicating that SMAD3 directly
interacts with FoxO3. These data suggest that FoxO and SMAD3 colocalize at FRE-
SBE motifs thus increasing stability of both transcription factors at these sites and
augmenting each other’s transcriptional activity. This presents a model where SMAD3
directly interacts with both FoxO3 and DNA at the FRE-SBE motif to stabilize FoxO3
DNA interaction thereby augmenting FoxO3-induced gene transcription. It has
previously been shown that FoxO and SMAD transcription factors physically associate
(89) and FREs and SBEs lie within close proximity within promoter regions of genes
coordinately regulated by FoxO and SMAD3 (33). Therefore, it is possible that
disrupting SMAD3-DNA interactions may attenuate FoxO-dependent gene transcription
by decreasing FoxO3 affinity for FREs. Future studies should systematically test
whether SMAD3 inhibition is sufficient to inhibit FoxO-induced transcription of ubiquitin
ligases and prevent muscle atrophy.
In contrast to our data, Lokireddy et al. (56) demonstrated that myostatin
administration increased UPS-mediated protein degradation in a SMAD3-dependent
manner, but SMAD3 knockdown had no effect on myostatin-induced MuRF-1 gene
expression. It is well known that myostatin activates SMAD2 and SMAD3 (99).
63
Therefore, it is possible that SMAD2 and 3 have redundant roles in regulating MuRF-1
gene expression. Perhaps with knockdown of both of these transcription factors, these
researchers may have seen a decrease in myostatin-induced MuRF-1 gene expression.
In addition to augmenting FoxO-induced MuRF-1 gene transcription, we demonstrated
that SMAD3 increases FoxO protein content and global FoxO-induced transcriptional
activity. Protein content of FoxO1 and FoxO3 has been shown to increase following
myostatin administration in HSkMC myotubes (57), and SMAD3 inhibition may prevent
this effect. However, the exact mechanism of this effect is not known. It has previously
been suggested that SMAD3 directly induces gene transcription of FoxO1 (57).
However, in the present study, we found no differences in FoxO1 or FoxO3 gene
expression following SMAD3 overexpression in C2C12 myotubes, suggesting SMAD3
increases FoxO protein content by inhibiting degradation of FoxO proteins. In addition
to increased protein content, SMAD3 decreases Akt-mediated phosphorylation
(inhibition) of FoxO (4, 67, 99). Increased protein content and decreased
phosphorylation of FoxO would be expected to increase global FoxO-dependent
transcriptional activity. Using a FRE-reporter, we found that SMAD3 augmented FoxO1
and FoxO3-dependent gene transcription, although SMAD3 overexpression alone was
insufficient to induce FRE-luciferase activity.
In our analysis of the Atrogin-1 and MuRF-1 promoter regions, we noted the
FRE-SBE motif occurs frequently in the proximal promoter region of both genes. In the
mouse genome we noted three such motifs within the proximal 1.5kb of the Atrogin-1
promoter region and two motifs within the proximal 1.5kb of the MuRF-1 promoter
region. The additional FRE-SBE motif in the Atrogin-1 gene may explain why we saw a
64
greater effect of SMAD3-FoxO3 co-expression on Atrogin-1 gene expression. In
addition to Atrogin-1 and MuRF-1, FoxO3 is known to regulate expression of several
genes involved in the autophagic/lysosomal pathway (107). It is possible that similar
motifs are located within the promoter regions of these genes and that SMAD3 may
directly regulate FoxO-dependent transcription of these genes. Future studies should
aim to determine other protein degradation genes that are coordinately regulated by
FoxO and SMAD3 within skeletal muscle. Additionally, SMAD3 may augment the
transcriptional activity of other DNA binding factors that regulate muscle mass such as
the glucocorticoid receptor and nuclear factor-Κβ (NF-Κβ). It should be noted that our
work primarily focused on the proximal 0.25kb of the MuRF-1 promoter region. This
region, as well and the FRE-SBE motif, are highly conserved between the mouse and
human genomes, indicating the physiological significance of this work in humans.
In summary, our data indicate that SMAD3 synergistically increases, and is
essential for, FoxO-induced transcription of ubiquitin ligases through dual mechanisms
(Figure 3.7). SMAD3 increases FoxO protein content and directly interacts with DNA at
the FRE-SBE motif within the proximal promoter region and stabilizes FoxO binding to
enhance its transcriptional activity. These data indicate that two major transcription
factors regulating protein degradation converge at the proximal promoter region to
induce gene transcription of MuRF-1.

65
Tables and Figures
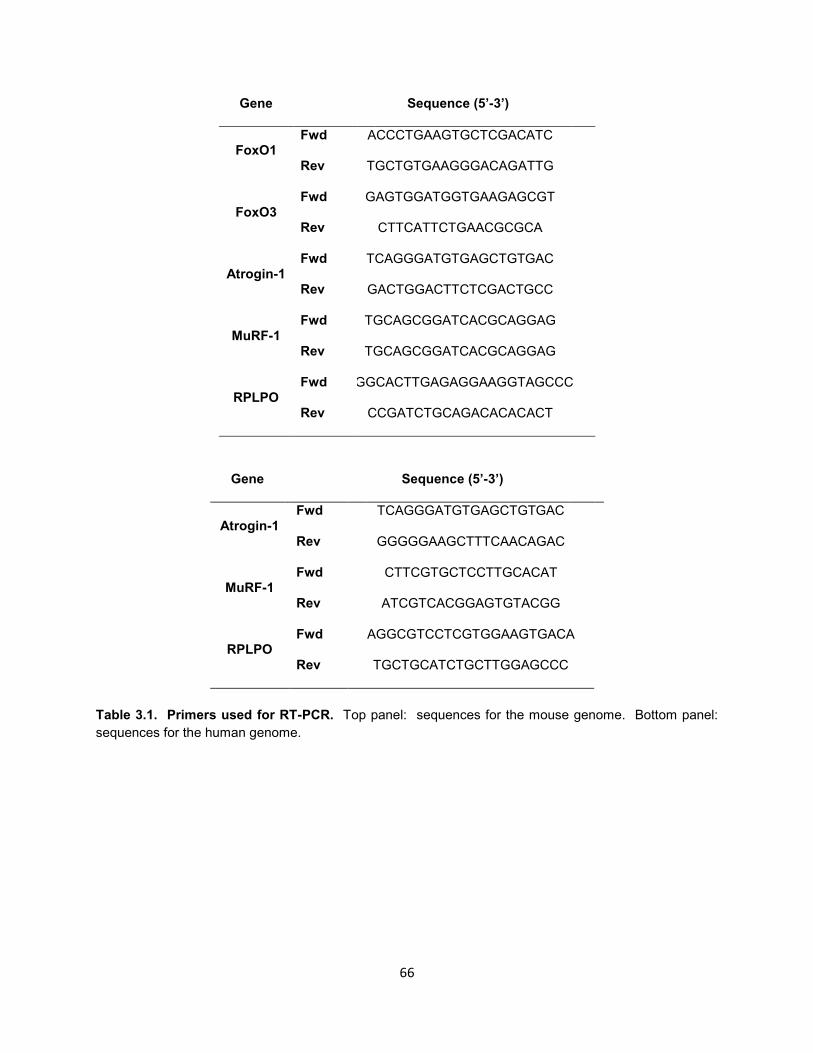
66
Gene
Sequence (5’-3’)
FoxO1 Fwd ACCCTGAAGTGCTCGACATC
Rev TGCTGTGAAGGGACAGATTG
FoxO3 Fwd GAGTGGATGGTGAAGAGCGT
Rev CTTCATTCTGAACGCGCA
Atrogin-1 Fwd TCAGGGATGTGAGCTGTGAC
Rev GACTGGACTTCTCGACTGCC
MuRF-1 Fwd TGCAGCGGATCACGCAGGAG
Rev TGCAGCGGATCACGCAGGAG
RPLPO Fwd TGGCACTTGAGAGGAAGGTAGCCC
Rev CCGATCTGCAGACACACACT
Gene
Sequence (5’-3’)
Atrogin-1 Fwd TCAGGGATGTGAGCTGTGAC
Rev GGGGGAAGCTTTCAACAGAC
MuRF-1 Fwd CTTCGTGCTCCTTGCACAT
Rev ATCGTCACGGAGTGTACGG
RPLPO Fwd AGGCGTCCTCGTGGAAGTGACA
Rev TGCTGCATCTGCTTGGAGCCC
Table 3.1. Primers used for RT-PCR. Top panel: sequences for the mouse genome. Bottom panel:
sequences for the human genome.
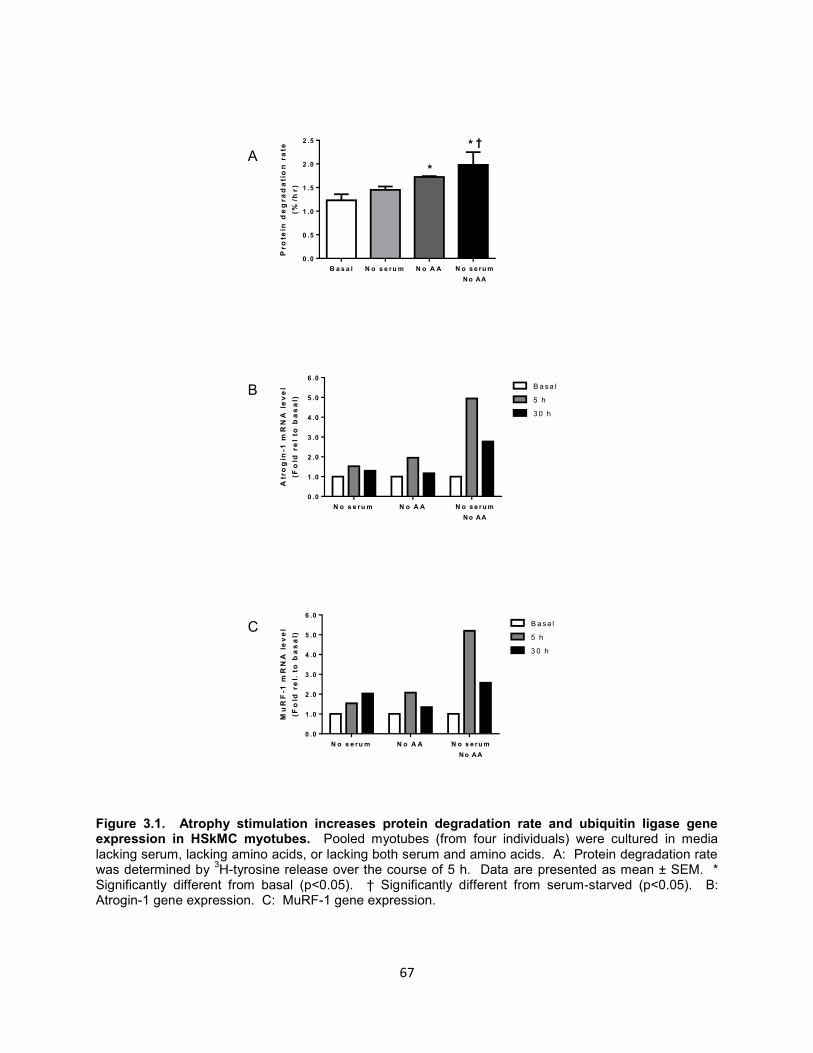
67
Pro
tein
de
gra
da
tio
n r
ate
(%
/hr
)
B a s a l N o s e ru m N o A A
0 .0
0 .5
1 .0
1 .5
2 .0
2 .5
*
* †
N o s e ru m
No AAA
tro
gin
-1 m
RN
A l
ev
el
(Fo
ld r
el
to b
as
al)
N o s e ru m N o A A
0 .0
1 .0
2 .0
3 .0
4 .0
5 .0
6 .0
B a sa l
5 h
3 0 h
N o s e ru m
No AA
Mu
RF
-1 m
RN
A l
ev
el
(Fo
ld r
el.
to
ba
sa
l)
N o s e ru m N o A A
0 .0
1 .0
2 .0
3 .0
4 .0
5 .0
6 .0
B a sa l
5 h
3 0 h
N o s e ru m
No AA
A
B
C
Figure 3.1. Atrophy stimulation increases protein degradation rate and ubiquitin ligase gene expression in HSkMC myotubes. Pooled myotubes (from four individuals) were cultured in media lacking serum, lacking amino acids, or lacking both serum and amino acids. A: Protein degradation rate was determined by
3H-tyrosine release over the course of 5 h. Data are presented as mean ± SEM. *
Significantly different from basal (p<0.05). † Significantly different from serum-starved (p<0.05). B: Atrogin-1 gene expression. C: MuRF-1 gene expression.
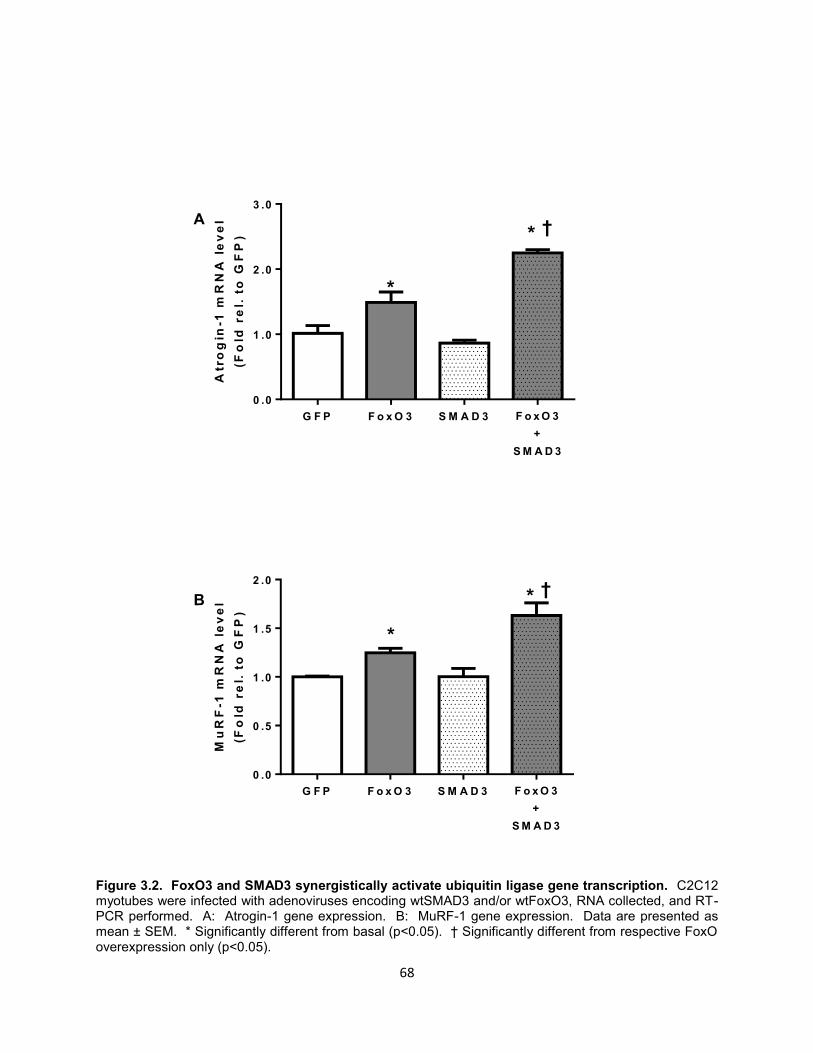
68
Atr
og
in-1
mR
NA
le
ve
l
(Fo
ld r
el.
to
GF
P)
G F P F o x O 3 S M A D 3
0 .0
1 .0
2 .0
3 .0
*
* †
F o x O 3
+
S M A D 3
Mu
RF
-1 m
RN
A l
ev
el
(Fo
ld r
el.
to
GF
P)
G F P F o x O 3 S M A D 3
0 .0
0 .5
1 .0
1 .5
2 .0
* †
*
F o x O 3
+
S M A D 3
A
B
Figure 3.2. FoxO3 and SMAD3 synergistically activate ubiquitin ligase gene transcription. C2C12 myotubes were infected with adenoviruses encoding wtSMAD3 and/or wtFoxO3, RNA collected, and RT-PCR performed. A: Atrogin-1 gene expression. B: MuRF-1 gene expression. Data are presented as mean ± SEM. * Significantly different from basal (p<0.05). † Significantly different from respective FoxO overexpression only (p<0.05).
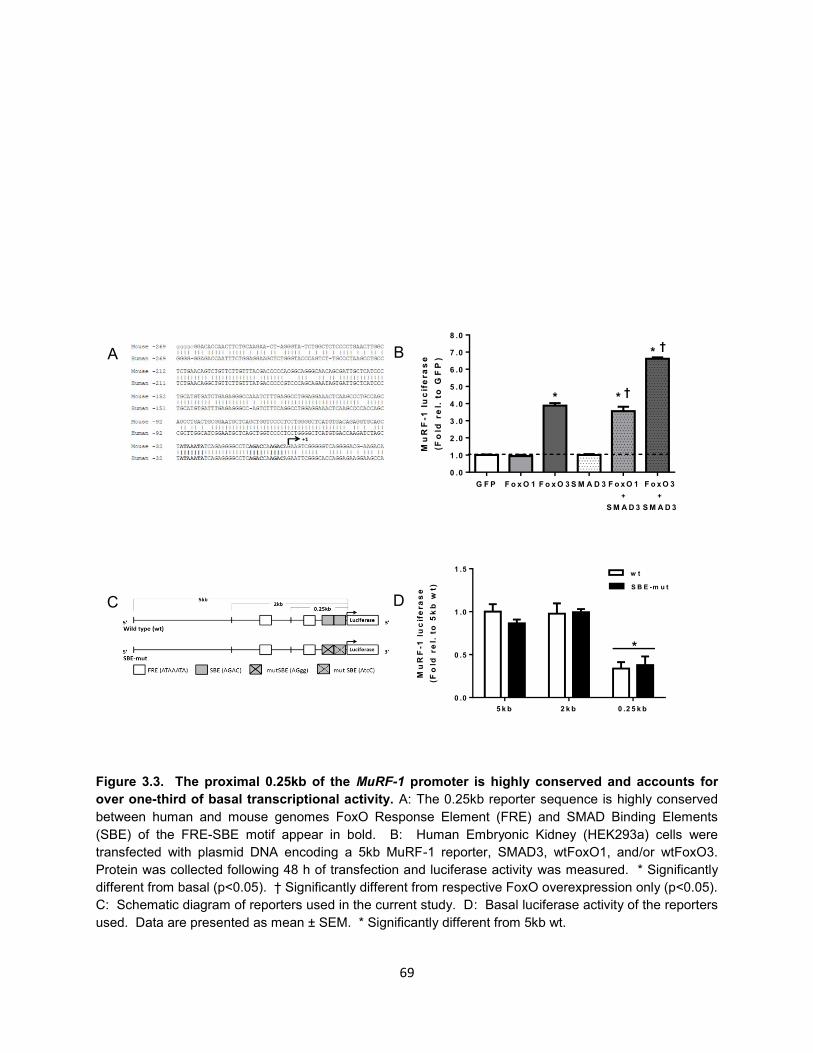
69
Mu
RF
-1 l
uc
ife
ra
se
(Fo
ld r
el.
to
GF
P)
G F P F o x O 1 F o x O 3 S M A D 3
0 .0
1 .0
2 .0
3 .0
4 .0
5 .0
6 .0
7 .0
8 .0
* *
*
†
†
F o x O 1
+
S M A D 3
F o x O 3
+
S M A D 3
Mu
RF
-1 l
uc
ife
ra
se
(Fo
ld r
el.
to
5k
b w
t)
5 k b 2 k b 0 .2 5 k b
0 .0
0 .5
1 .0
1 .5w t
S B E -m u t
*
A B
C D
Figure 3.3. The proximal 0.25kb of the MuRF-1 promoter is highly conserved and accounts for
over one-third of basal transcriptional activity. A: The 0.25kb reporter sequence is highly conserved
between human and mouse genomes FoxO Response Element (FRE) and SMAD Binding Elements
(SBE) of the FRE-SBE motif appear in bold. B: Human Embryonic Kidney (HEK293a) cells were
transfected with plasmid DNA encoding a 5kb MuRF-1 reporter, SMAD3, wtFoxO1, and/or wtFoxO3.
Protein was collected following 48 h of transfection and luciferase activity was measured. * Significantly
different from basal (p<0.05). † Significantly different from respective FoxO overexpression only (p<0.05).
C: Schematic diagram of reporters used in the current study. D: Basal luciferase activity of the reporters
used. Data are presented as mean ± SEM. * Significantly different from 5kb wt.
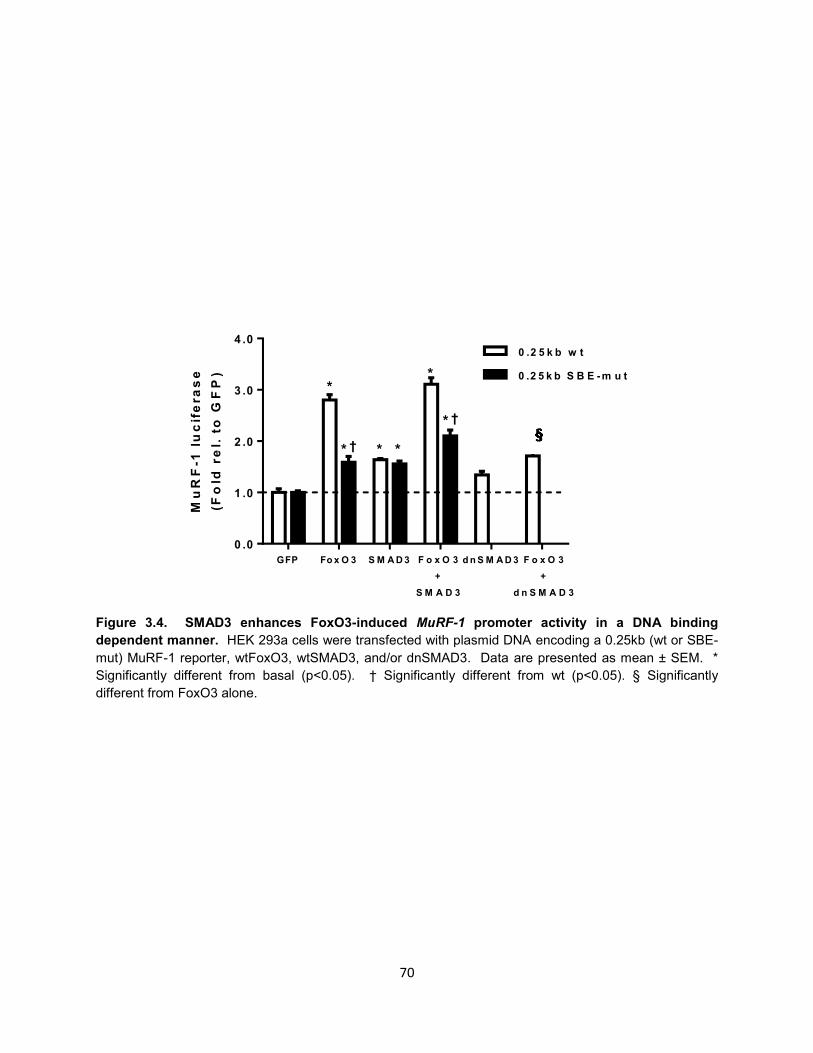
70
Mu
RF
-1 l
uc
ife
ra
se
(Fo
ld r
el.
to
GF
P)
GFP Fo x O 3 S M A D 3 d n S M A D 3
0 .0
1 .0
2 .0
3 .0
4 .00 .2 5 k b w t
0 .2 5 k b S B E -m u t
*
* * *
*
*
*†
†
F o x O 3
+
S M A D 3
F o x O 3
+
d n S M A D 3
Figure 3.4. SMAD3 enhances FoxO3-induced MuRF-1 promoter activity in a DNA binding
dependent manner. HEK 293a cells were transfected with plasmid DNA encoding a 0.25kb (wt or SBE-
mut) MuRF-1 reporter, wtFoxO3, wtSMAD3, and/or dnSMAD3. Data are presented as mean ± SEM. *
Significantly different from basal (p<0.05). † Significantly different from wt (p<0.05). § Significantly
different from FoxO3 alone.
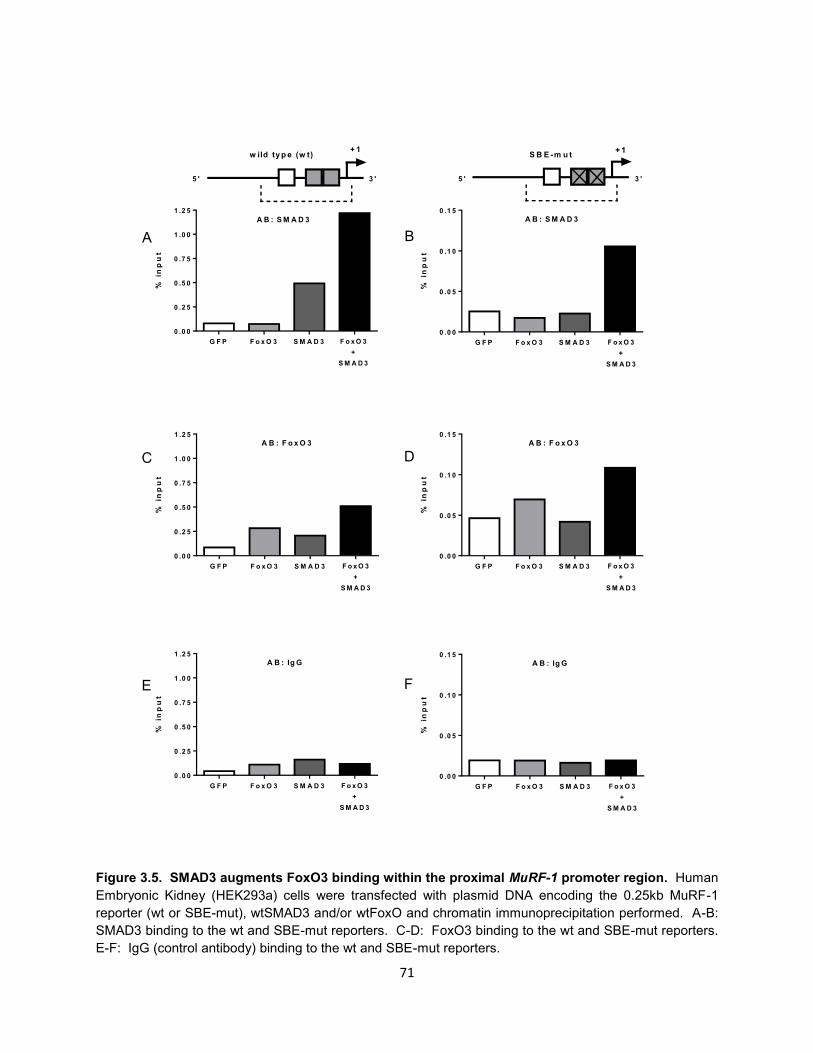
71
% i
np
ut
G F P F o x O 3 S M A D 3
0 .0 0
0 .2 5
0 .5 0
0 .7 5
1 .0 0
1 .2 5
F o x O 3
+
S M A D 3
A B : S M A D 3
% i
np
ut
G F P F o x O 3 S M A D 3
0 .0 0
0 .0 5
0 .1 0
0 .1 5
F o x O 3
+
S M A D 3
A B : S M A D 3
% i
np
ut
G F P F o x O 3 S M A D 3
0 .0 0
0 .2 5
0 .5 0
0 .7 5
1 .0 0
1 .2 5
F o x O 3
+
S M A D 3
A B : F o x O 3
% i
np
ut
G F P F o x O 3 S M A D 3
0 .0 0
0 .0 5
0 .1 0
0 .1 5
F o x O 3
+
S M A D 3
A B : F o x O 3
% i
np
ut
G F P F o x O 3 S M A D 3
0 .0 0
0 .2 5
0 .5 0
0 .7 5
1 .0 0
1 .2 5
F o x O 3
+
S M A D 3
A B : Ig G
% i
np
ut
G F P F o x O 3 S M A D 3
0 .0 0
0 .0 5
0 .1 0
0 .1 5
F o x O 3
+
S M A D 3
A B : Ig G
A B
C D
E F
+ 1 + 1w ild ty p e (w t) S B E -m u t
5 ' 3 ' 5 ' 3 '
Figure 3.5. SMAD3 augments FoxO3 binding within the proximal MuRF-1 promoter region. Human
Embryonic Kidney (HEK293a) cells were transfected with plasmid DNA encoding the 0.25kb MuRF-1
reporter (wt or SBE-mut), wtSMAD3 and/or wtFoxO and chromatin immunoprecipitation performed. A-B:
SMAD3 binding to the wt and SBE-mut reporters. C-D: FoxO3 binding to the wt and SBE-mut reporters.
E-F: IgG (control antibody) binding to the wt and SBE-mut reporters.
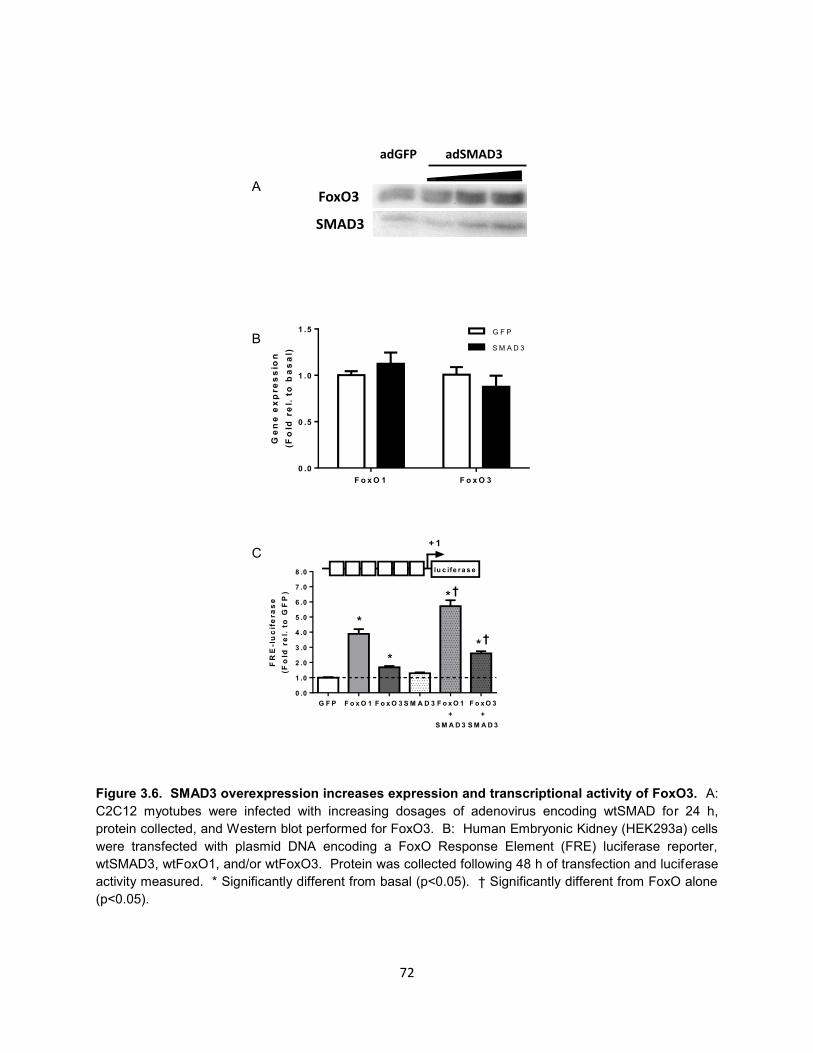
72
Ge
ne
ex
pre
ss
ion
(Fo
ld r
el.
to
ba
sa
l)
F o x O 1 F o x O 3
0 .0
0 .5
1 .0
1 .5 G F P
S M A D 3
FR
E-l
uc
ife
ra
se
(Fo
ld r
el.
to
GF
P)
G F P F o x O 1 F o x O 3 S M A D 3
0 .0
1 .0
2 .0
3 .0
4 .0
5 .0
6 .0
7 .0
8 .0
*
*
*
*
†
†
F o x O 1
+
S M A D 3
F o x O 3
+
S M A D 3
+ 1
lu c ife ra s e
FoxO3
SMAD3
adGFP adSMAD3
.05 μl .10 μl .25 μlA
B
C
Figure 3.6. SMAD3 overexpression increases expression and transcriptional activity of FoxO3. A:
C2C12 myotubes were infected with increasing dosages of adenovirus encoding wtSMAD for 24 h,
protein collected, and Western blot performed for FoxO3. B: Human Embryonic Kidney (HEK293a) cells
were transfected with plasmid DNA encoding a FoxO Response Element (FRE) luciferase reporter,
wtSMAD3, wtFoxO1, and/or wtFoxO3. Protein was collected following 48 h of transfection and luciferase
activity measured. * Significantly different from basal (p<0.05). † Significantly different from FoxO alone
(p<0.05).
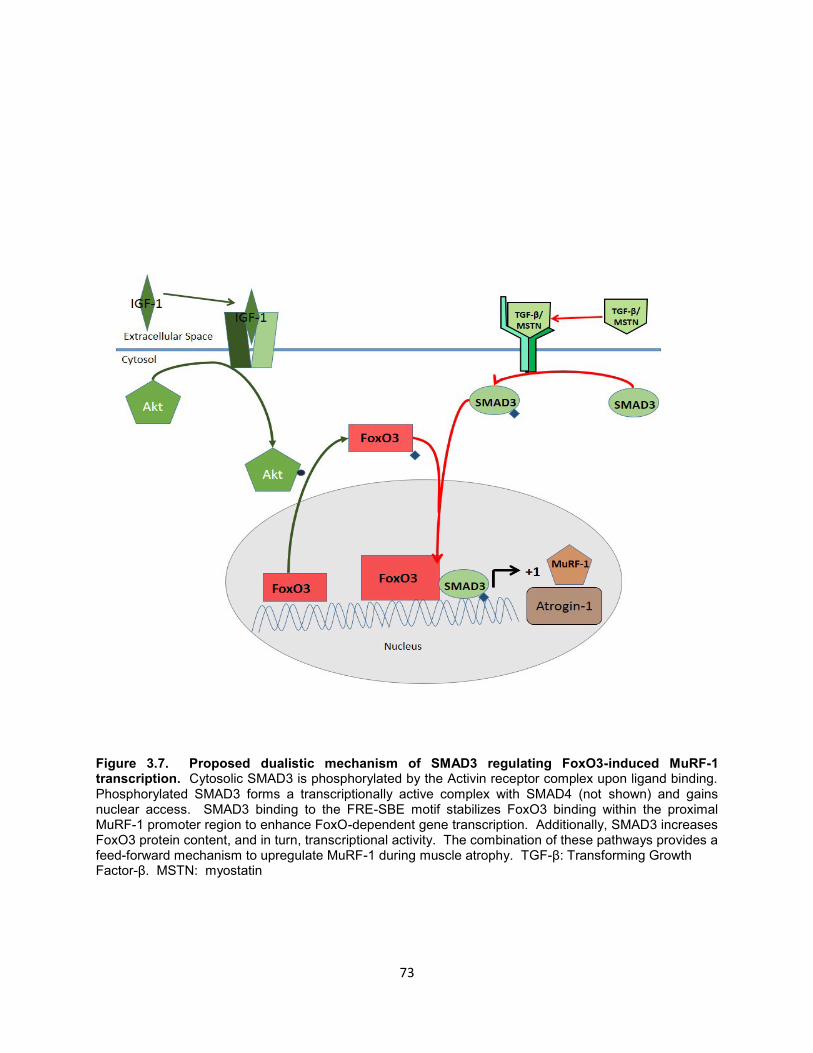
73
Figure 3.7. Proposed dualistic mechanism of SMAD3 regulating FoxO3-induced MuRF-1 transcription. Cytosolic SMAD3 is phosphorylated by the Activin receptor complex upon ligand binding. Phosphorylated SMAD3 forms a transcriptionally active complex with SMAD4 (not shown) and gains nuclear access. SMAD3 binding to the FRE-SBE motif stabilizes FoxO3 binding within the proximal MuRF-1 promoter region to enhance FoxO-dependent gene transcription. Additionally, SMAD3 increases FoxO3 protein content, and in turn, transcriptional activity. The combination of these pathways provides a feed-forward mechanism to upregulate MuRF-1 during muscle atrophy. TGF-β: Transforming Growth Factor-β. MSTN: myostatin
Chapter 4: Supplementary data
Rationale
Obesity is accompanied by increased skeletal muscle mass (27, 69), fiber diameter
(28), and strength (53). Myocellular size is dictated by the balance between protein
synthesis and degradation rates (34). Therefore, the apparent hypertrophic phenotype
observed in obesity must be due to differences between protein synthesis and/or
degradation rates. Using HSkMC, a cell culture model that retains many characteristics
of obesity in vitro (43), we found no differences in protein synthesis or degradation rates
between lean and severely obese (c.f. Figure 2.2, Supporting information 2.2).
Numerous factors affecting protein synthesis and degradation, such as muscular
overload and nutritional status/cellular milleu are different between lean and obese in
vivo. To determine whether excess adipose tissue may provide a training stimulus to
increase muscle mass in obesity, we correlated lean body mass and fat mass in lean
and obese women using dual-energy x-ray absorptiometry. Additionally, in order to
determine whether increased circulating free fatty acids may increase skeletal muscle
mass, we incubated C2C12 myotubes in a high lipid environment for up to 72 h and
measured protein synthesis and degradation rates.
75
Methods
DEXA scans
Dual-energy x-ray absorptiometery (DEXA) scans from 29 lean (BMI 18.5-24.9) and 50
obese (BMI ≥ 30.0, including 32 post-gastric bypass patients) women were analyzed for
mineral-free lean mass and fat mass. Subject characteristics can be found in Table 4.1.
Scans were previously collected through ongoing studies at East Carolina University
under IRB approval. In order to retain anonymity of subjects, no personal identifiers
were retained during these analyses. Regions of interest were drawn by bisecting the
glenohumeral joint (arms) or the neck of the femur (leg) to calculate lean mass and fat
mass of these appendages. In cases of extreme obesity, hemi-scans were performed
and body composition calculated by doubling values obtained from hemi-scans.
Cell culture
Mouse skeletal muscle myoblasts (C2C12) were cultured in DMEM supplemented with
10% fetal bovine serum and 1% penicillin/streptomycin and maintained at sub-confluent
density prior to differentiation. For all experiments, myoblasts were seeded into six well
plates at a density of 2.5x10⁵ cells per well and allowed to adhere to the plate overnight.
Growth media was switched to low serum media (2% horse serum) to induce
differentiation into myotubes. All cell cultures were maintained at 37°C and 5% CO2
and media was changed every 48 h. Following terminal differentiation myotubes were
cultured in media supplemented with 500μM lipid (1:1 Palmitate:Oleate) and 1mM L-
76
Carnitine as a transport protein for up to 72 h. To make 500µM lipid, 0.5 ml Palmitate
(200mM) was dissolved in 6.7 ml warm 30% BSA. Once dissolved, 11.8 ml of warm
differential media was added. Once in solution, 1 ml of 100mM Oleate was added
(20mM) stock. Stock lipid was diluted to a final concentration of 500µM. For all
experiments, control, 24 h, 48 h, and 72 h lipid treated myotubes were tested on the
same day of differentiation.
Real-time PCR
Myotubes were washed twice with PBS, then cells were dissolved in 1 ml TRIzol
(Ambion) and nucleotides were allowed to dissociate at room temperature for 10 min.
Chloroform (0.2 ml) was added and tubes rotated end-over-end for 10 min then
centrifuged at 12,000 x g for 12 min and the supernatant added to 0.5 ml isopropanol.
RNA was pelleted by centrifugation (12,000 x g for 8 min), washed with 1.5 ml 70%
ethanol, dissolved in 0.05 ml TE buffer and dissociated at 58°C for 10 min. RNA was
stored at -80°C until processing. RNA integrity was determined by agarose gel
electrophoresis. RNA concentration and purity (Ab260/280) was assessed
spectrophometrically using a NanoDrop UV-Vis spectrophometer (ThermoScientific,
ND-1000). RNA was reversed transcribed to cDNA (Quanta Biosciences) at a final
concentration of 0.10 µg/µl. Fold expression of was calculated using the ΔΔCt method.
The geometric mean of Large Ribosomal Protein (RPLPO), GAPDH, and β-actin was
used as an endogenous control. Custom RT-PCR primers (Table 4.2) were generated
using NCBI BLAST algorithms (http://blast.ncbi.nlm.nih.gov/Blast.cgi) and specificity
77
confirmed by agarose gel electrophoresis following conventional PCR. All RT-PCR
experiments were run with a standard curve of eight orders of magnitude and
amplification efficiency determined to be near 100%.
Luciferase assay
C2C12 myoblasts were plated in six-well plates at a density of 2.5x10⁵ cells per well
and allowed to adhere overnight. Myoblasts were transfected with plasmid DNA
encoding a 6x SBE firefly luciferase reporter and a control pRL-Thymidine Kinase
control reporter using Fugene 6 per manufacturer’s recommendations (Promega).
Myotubes were switched to low serum media to induce differentiation and treated with
lipid as described above. Myotubes were washed twice with PBS and collected in 1x
passive lysis buffer per manufacturer’s recommendation (Promega). Samples were
spun at 20,000 x g for 5 min and 20 µl of the supernatant pipetted into a white 96-well
plate with 100 µl of substrate. Luminescence was measured using a microplate reader
(Spectramax M4). Firefly luciferase (SBE reporter) was normalized to that of the control
RL-Tk reporter and values were expressed as fold difference relative to untreated.
Protein synthesis
Lipid treated C2C12 myotubes were radiolabeled with L-[3,5-3H] tyrosine (5 µCi/ml,
PerkinElmer Life Sciences) for 2 h, residual radioactivity was washed away, and
proteins were precipitated with 10% TCA. Proteins were collected in microcentrifuge
78
tubes, pelleted by centrifugation, and then dissolved in 0.1N NaOH. Radioactivity
incorporation was determined by scintillation counting and normalized to total protein
content as assessed by bicinchoninic acid (BCA) assay (ThermoScientific).
Protein degradation assay
Protein degradation rate was determined by release of a radiolabeled amino acid
as previously described (11, 107). Terminally differentiated myotubes were
radiolabeled with L-[3,5-3H] tyrosine (5 µCi/ml, PerkinElmer Life Sciences) for 24 h.
Cells were thoroughly washed and radioactivity chased for 2 h using differentiation
media supplemented with 2 mM L-tyrosine to allow degradation of short-lived proteins
and to limit re-incorporation of the radiolabel. Four serial media samples were collected
over the course of 5 h. At the end of the experiments, culture media was removed
completely and myotubes were solubilized in 0.2N NaOH. Radioactivity of cells and
TCA-precipitated media samples was measured using scintillation counting. Total
radioactivity was calculated as the sum of the residual radioactivity in the myotubes plus
radioactivity of all time points. Protein degradation rate was directly calculated as a
percentage of total [3H] tyrosine incorporation from the regression line of serial samples
for each individual.

79
Tables and Figures
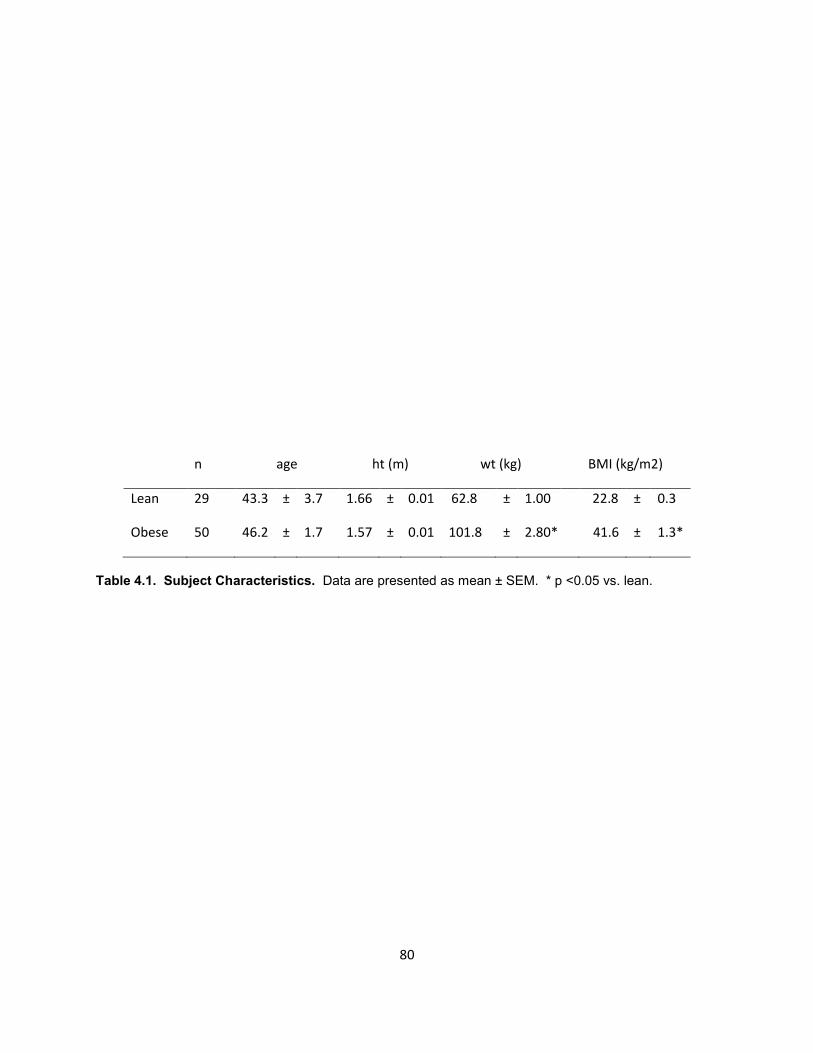
80
n age ht (m) wt (kg) BMI (kg/m2)
Lean 29 43.3 ± 3.7 1.66 ± 0.01 62.8 ± 1.00 22.8 ± 0.3
Obese 50 46.2 ± 1.7 1.57 ± 0.01 101.8 ± 2.80* 41.6 ± 1.3*
Table 4.1. Subject Characteristics. Data are presented as mean ± SEM. * p <0.05 vs. lean.
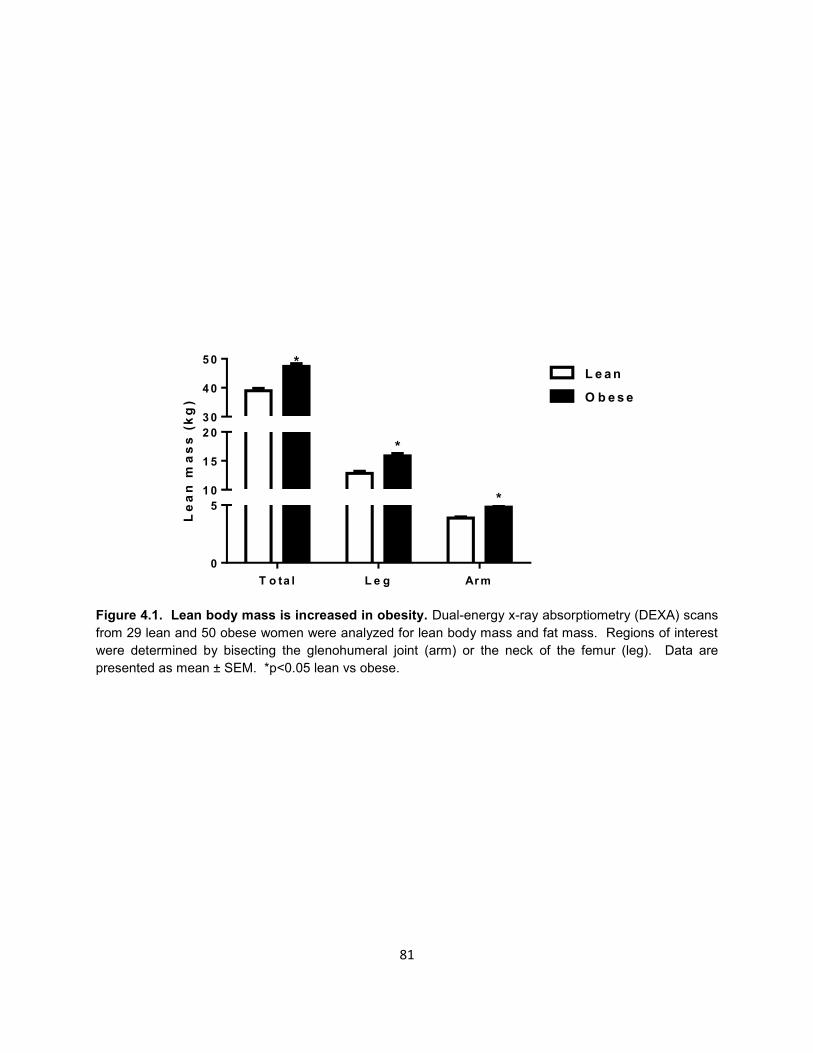
81
Le
an
ma
ss
(k
g)
T o ta l L e g Ar m
0
5
1 0
1 5
2 0
3 0
4 0
5 0
L e a n
O b e s e
*
*
*
Figure 4.1. Lean body mass is increased in obesity. Dual-energy x-ray absorptiometry (DEXA) scans
from 29 lean and 50 obese women were analyzed for lean body mass and fat mass. Regions of interest
were determined by bisecting the glenohumeral joint (arm) or the neck of the femur (leg). Data are
presented as mean ± SEM. *p<0.05 lean vs obese.
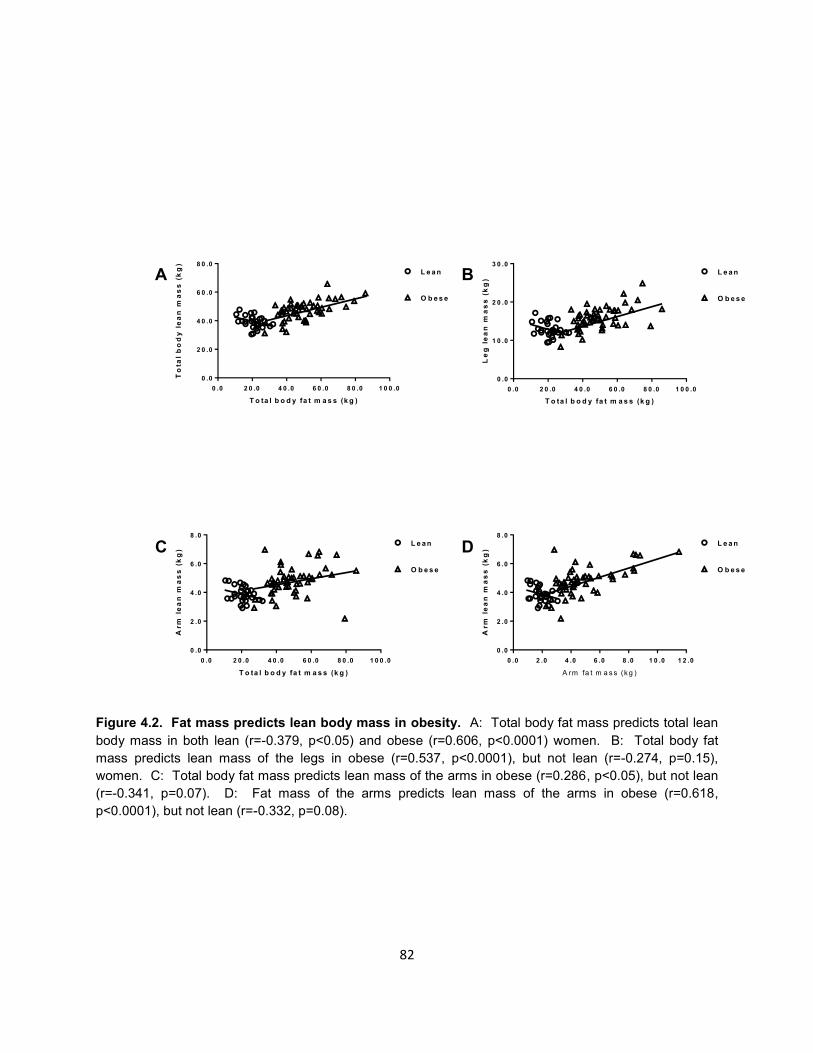
82
T o ta l b o d y fa t m a s s (k g )
To
tal
bo
dy
le
an
ma
ss
(k
g)
0 .0 2 0 .0 4 0 .0 6 0 .0 8 0 .0 1 0 0 .0
0 .0
2 0 .0
4 0 .0
6 0 .0
8 0 .0
L e a n
O b e s e
T o ta l b o d y fa t m a s s (k g )
Le
g l
ea
n m
as
s (
kg
)
0 .0 2 0 .0 4 0 .0 6 0 .0 8 0 .0 1 0 0 .0
0 .0
1 0 .0
2 0 .0
3 0 .0
L e a n
O b e s e
T o ta l b o d y fa t m a s s (k g )
Arm
le
an
ma
ss
(k
g)
0 .0 2 0 .0 4 0 .0 6 0 .0 8 0 .0 1 0 0 .0
0 .0
2 .0
4 .0
6 .0
8 .0
L e a n
O b e s e
A rm fa t m a s s (k g )
Arm
le
an
ma
ss
(k
g)
0 .0 2 .0 4 .0 6 .0 8 .0 1 0 .0 1 2 .0
0 .0
2 .0
4 .0
6 .0
8 .0
L e a n
O b e s e
A B
C D
Figure 4.2. Fat mass predicts lean body mass in obesity. A: Total body fat mass predicts total lean
body mass in both lean (r=-0.379, p<0.05) and obese (r=0.606, p<0.0001) women. B: Total body fat
mass predicts lean mass of the legs in obese (r=0.537, p<0.0001), but not lean (r=-0.274, p=0.15),
women. C: Total body fat mass predicts lean mass of the arms in obese (r=0.286, p<0.05), but not lean
(r=-0.341, p=0.07). D: Fat mass of the arms predicts lean mass of the arms in obese (r=0.618,
p<0.0001), but not lean (r=-0.332, p=0.08).

83
Pathway Gene Sequence (5’-3’)
TG
F-β
sig
nalin
g
ACVRIB Fwd TTGGTCTGTAGGCAGCTGGT
Rev TTCTTCCCCCTTGTTGTCCT
SMAD2 Fwd TTTGCTGTACTCAGTCCCCA
Rev TGAGCTTGAGAAAGCCATCA
SMAD3 Fwd ACAGGCGGCAGTAGATAACG
Rev CGTAATTCATGGTGGCTGTG
SMAD4 Fwd GGCTCTCCTTCAAAGTCGTG
Rev GGTTGTCTCACCTGGAATTGA
SMAD7 Fwd CTTCTCCTCCCAGTATGCCA
Rev GAACGAATTATCTGGCCCCT
Au
top
hag
ic/lyso
so
mal
path
way
gen
es
LC3B Fwd AATCACTGGCATCTTGGTGG
Rev GAGAAGACCTTCAAGCAGCG
ATG4B Fwd TTTCTGCCCAGAATCCAAAC
Rev TCGGACAGGGAAGATGGA
Gabarapl-1 Fwd TAGGAGCCTTCTCCACGATG
Rev AGGACCACCCCTTCGAGTAT
BECN1 Fwd GGCGAGTTTCAATAAATGGC
Rev CCAGGAACTCAGCTCCAT
Ub
iqu
itin
-pro
teaso
me
syste
m g
en
es
FoxO3 Fwd CTTCATTCTGAACGCGCA
Rev CTTCAAGGATAAGGGCGACA
Atrogin-1 Fwd TCAGGGATGTGAGCTGTGAC
Rev GACTGGACTTCTCGACTGCC
MuRF-1 Fwd TGCAGCGGATCACGCAGGAG
Rev TGGCACTTGAGAGGAAGGTAGCCC
Co
ntr
ol g
en
es
RPLPO Fwd CCGATCTGCAGACACACACT
Rev ACCCTGAAGTGCTCGACATC
B-actin Fwd GCTGTATTCCCCTCCATCGTG
Rev CACGGTTGGCCTTAGGGTTCAG
GAPDH Fwd ACCCAGAAGACTGTGGATGG
Rev CACATTGGGGTAGGAACAC
Table 4.2. Primers used for RT-PCR.
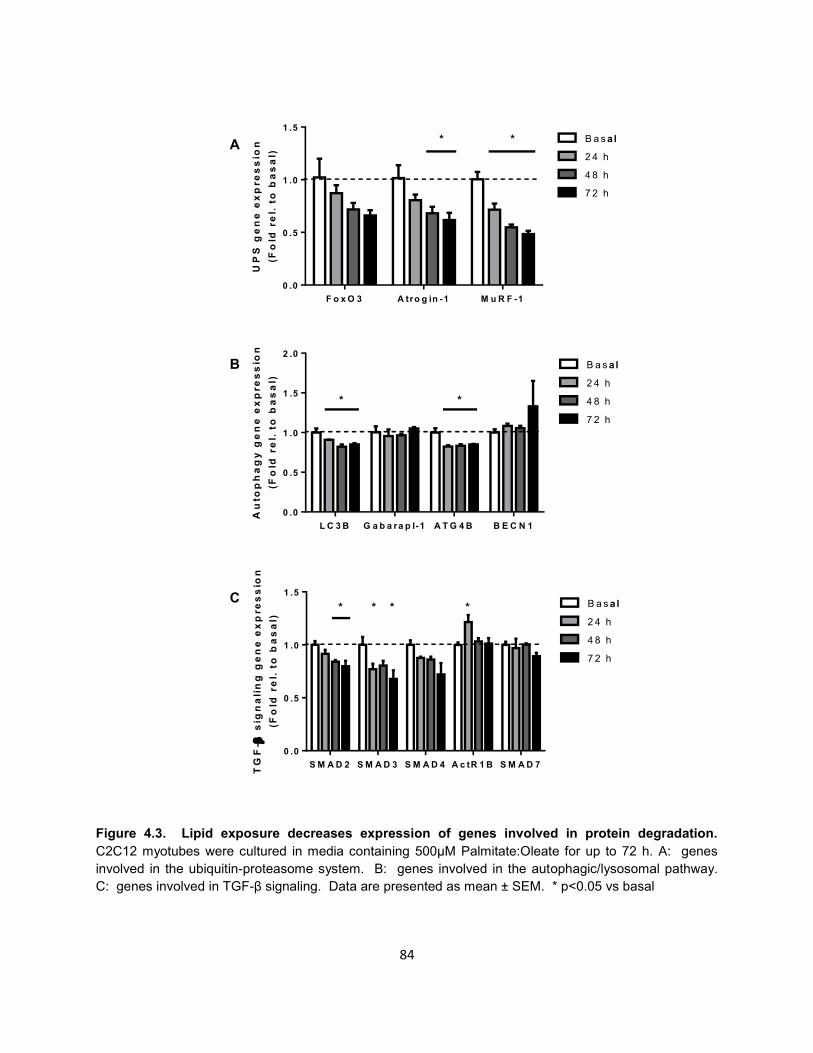
84
UP
S g
en
e e
xp
re
ss
ion
(Fo
ld r
el.
to
ba
sa
l)
F o x O 3 A tro g in -1 M u R F -1
0 .0
0 .5
1 .0
1 .5
B a s al
2 4 h
4 8 h
7 2 h
* *
Au
top
ha
gy
ge
ne
ex
pre
ss
ion
(Fo
ld r
el.
to
ba
sa
l)
L C 3 B G a b a ra p l-1 A T G 4 B B E C N 1
0 .0
0 .5
1 .0
1 .5
2 .0
B a s al
2 4 h
4 8 h
7 2 h
* *
TG
F-
sig
na
lin
g g
en
e e
xp
re
ss
ion
(Fo
ld r
el.
to
ba
sa
l)
S M A D 2 S M A D 3 S M A D 4 A c tR 1 B S M A D 7
0 .0
0 .5
1 .0
1 .5
B a s al
2 4 h
4 8 h
7 2 h
* * * *
A
B
C
Figure 4.3. Lipid exposure decreases expression of genes involved in protein degradation.
C2C12 myotubes were cultured in media containing 500μM Palmitate:Oleate for up to 72 h. A: genes
involved in the ubiquitin-proteasome system. B: genes involved in the autophagic/lysosomal pathway.
C: genes involved in TGF-β signaling. Data are presented as mean ± SEM. * p<0.05 vs basal
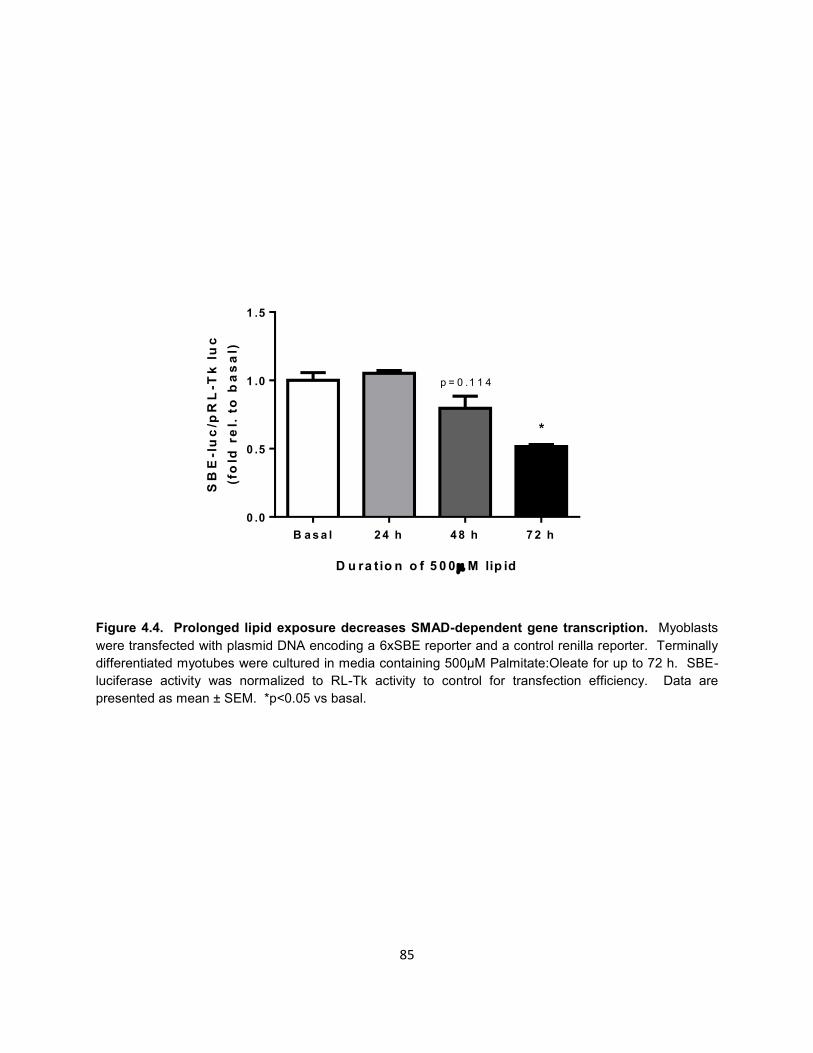
85
D u ra tio n o f 5 0 0 M lip id
SB
E-l
uc
/pR
L-T
k l
uc
(fo
ld r
el.
to
ba
sa
l)
B a s a l 2 4 h 4 8 h 7 2 h
0 .0
0 .5
1 .0
1 .5
*
p = 0 .1 1 4
Figure 4.4. Prolonged lipid exposure decreases SMAD-dependent gene transcription. Myoblasts
were transfected with plasmid DNA encoding a 6xSBE reporter and a control renilla reporter. Terminally
differentiated myotubes were cultured in media containing 500μM Palmitate:Oleate for up to 72 h. SBE-
luciferase activity was normalized to RL-Tk activity to control for transfection efficiency. Data are
presented as mean ± SEM. *p<0.05 vs basal.
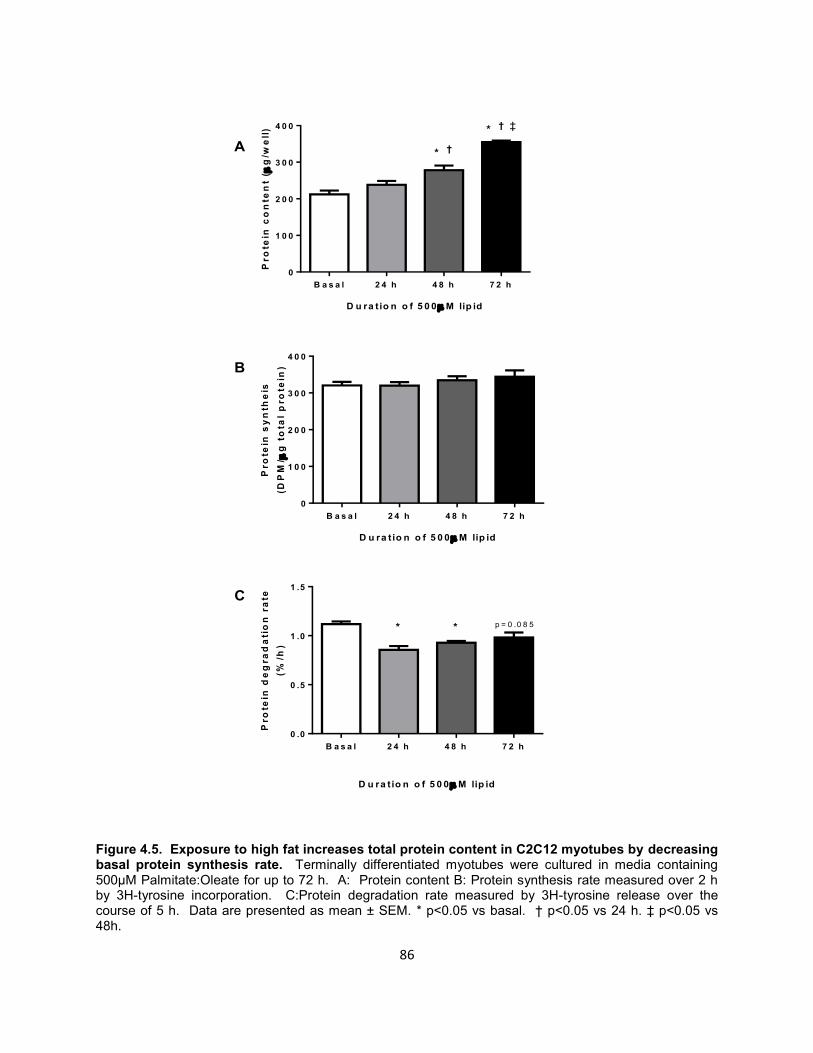
86
D u ra tio n o f 5 0 0 M lip id
Pro
tein
co
nte
nt
( g
/we
ll)
B a s a l 2 4 h 4 8 h 7 2 h
0
1 0 0
2 0 0
3 0 0
4 0 0
* †
* † ‡
D u ra tio n o f 5 0 0 M lip id
Pro
tein
sy
nth
eis
(DP
M/
g t
ota
l p
ro
tein
)
B a s a l 2 4 h 4 8 h 7 2 h
0
1 0 0
2 0 0
3 0 0
4 0 0
D u ra tio n o f 5 0 0 M lip id
Pro
tein
de
gra
da
tio
n r
ate
(%/h
)
B a s a l 2 4 h 4 8 h 7 2 h
0 .0
0 .5
1 .0
1 .5
* * p = 0 .0 8 5
A
B
C
Figure 4.5. Exposure to high fat increases total protein content in C2C12 myotubes by decreasing basal protein synthesis rate. Terminally differentiated myotubes were cultured in media containing 500μM Palmitate:Oleate for up to 72 h. A: Protein content B: Protein synthesis rate measured over 2 h by 3H-tyrosine incorporation. C:Protein degradation rate measured by 3H-tyrosine release over the course of 5 h. Data are presented as mean ± SEM. * p<0.05 vs basal. † p<0.05 vs 24 h. ‡ p<0.05 vs 48h.
Chapter 5: Global discussion
Due to the common transcriptional response shared between numerous forms of
muscle atrophy (13, 54, 82) and the impaired metabolic profile noted in skeletal muscle
of the obese (43), the present project aimed to understand the effects of obesity on the
transcriptional regulation of muscle protein degradation. Severe obesity is often
accompanied by insulin resistance (50, 77), and subsequently, decreased Akt activity
(6). Since Akt is a major regulator of FoxO activity (93), we hypothesized that protein
degradation rates would be increased in myotubes of the extremely obese both basally
and in response to atrophic stimuli. In order to test this hypothesis, we measured gene
expression, flux through the major protein degradation pathways, and myotube area, in
primary HSkMC myotubes. This model retains many characteristics of obesity, such as
insulin resistance (6), impaired fatty acid oxidation (43), and overexpression of atrophy-
related genes (42, 72) but eliminates confounders of in vivo research such as nutrition,
circulating amino acid concentrations, hormonal milieu, and muscle overload that can
be significantly different between lean and obese. In addition to insulin resistance,
skeletal muscle of the severely obese overexpresses myostatin (1), a TGF-β family
member that signals through SMAD3 (56, 108). Therefore, we further hypothesized that
SMAD3 overexpression would augment FoxO3-induced transcription of genes involved
in protein degradation. We directly measured gene expression and promoter activity of
MuRF-1, a muscle-specific E3 ubiqutin ligase in response to SMAD3 and FoxO3
overexpression.
88
Increased FoxO3 expression does not increase gene expression of FoxO-
inducible genes in the severely obese
Numerous forms of muscle atrophy share a common transcriptional response to
increase the rate of protein degradation (13, 54, 82). Therefore, we measured gene
expression patterns of protein degradation-related genes in myotubes from lean and
severely obese (c.f. Figure 2.1). Gene expression patterns of protein degradation
genes of the UPS (Atrogin-1 and MuRF-1) and autophagic/lysosomal pathways (LC3B,
Gabarapl-1, and ATG4B) were similar between myotubes of the lean and severely
obese under basal and starved conditions. In contrast to previous studies (1, 42, 72),
we found no differences in myostatin gene expression in myotubes of the severely
obese. Interestingly, gene expression of the transcription factor FoxO3 was significantly
higher in myotubes from the severely obese. FoxO3 induces transcription of genes
involved in both the UPS and the autophagic/lysosomal pathway (107). Notably, FoxO3
binds the proximal promoter regions and induces gene expression of Atrogin-1 (83) and
MuRF-1 (100), two E3 ubiquitin ligases that are essential for muscle atrophy (8). Since
FoxO3 gene expression was increased in myotubes of the severely obese, it would be
predicted that gene expression of Atrogin-1 and MuRF-1 would also be higher.
However, we found no differences in gene expression of the FoxO3-inducible genes
Atrogin-1, MuRF-1, LC3B, or Gabarapl-1 between myotubes of the lean and severely
obese.
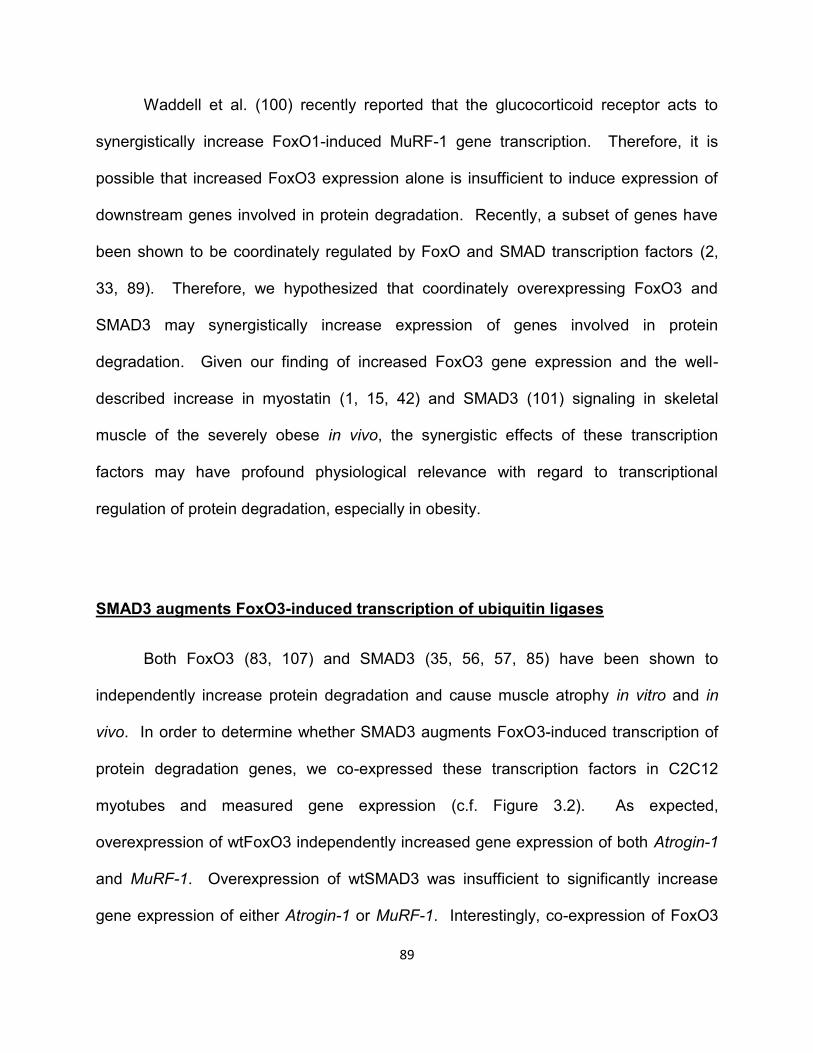
89
Waddell et al. (100) recently reported that the glucocorticoid receptor acts to
synergistically increase FoxO1-induced MuRF-1 gene transcription. Therefore, it is
possible that increased FoxO3 expression alone is insufficient to induce expression of
downstream genes involved in protein degradation. Recently, a subset of genes have
been shown to be coordinately regulated by FoxO and SMAD transcription factors (2,
33, 89). Therefore, we hypothesized that coordinately overexpressing FoxO3 and
SMAD3 may synergistically increase expression of genes involved in protein
degradation. Given our finding of increased FoxO3 gene expression and the well-
described increase in myostatin (1, 15, 42) and SMAD3 (101) signaling in skeletal
muscle of the severely obese in vivo, the synergistic effects of these transcription
factors may have profound physiological relevance with regard to transcriptional
regulation of protein degradation, especially in obesity.
SMAD3 augments FoxO3-induced transcription of ubiquitin ligases
Both FoxO3 (83, 107) and SMAD3 (35, 56, 57, 85) have been shown to
independently increase protein degradation and cause muscle atrophy in vitro and in
vivo. In order to determine whether SMAD3 augments FoxO3-induced transcription of
protein degradation genes, we co-expressed these transcription factors in C2C12
myotubes and measured gene expression (c.f. Figure 3.2). As expected,
overexpression of wtFoxO3 independently increased gene expression of both Atrogin-1
and MuRF-1. Overexpression of wtSMAD3 was insufficient to significantly increase
gene expression of either Atrogin-1 or MuRF-1. Interestingly, co-expression of FoxO3
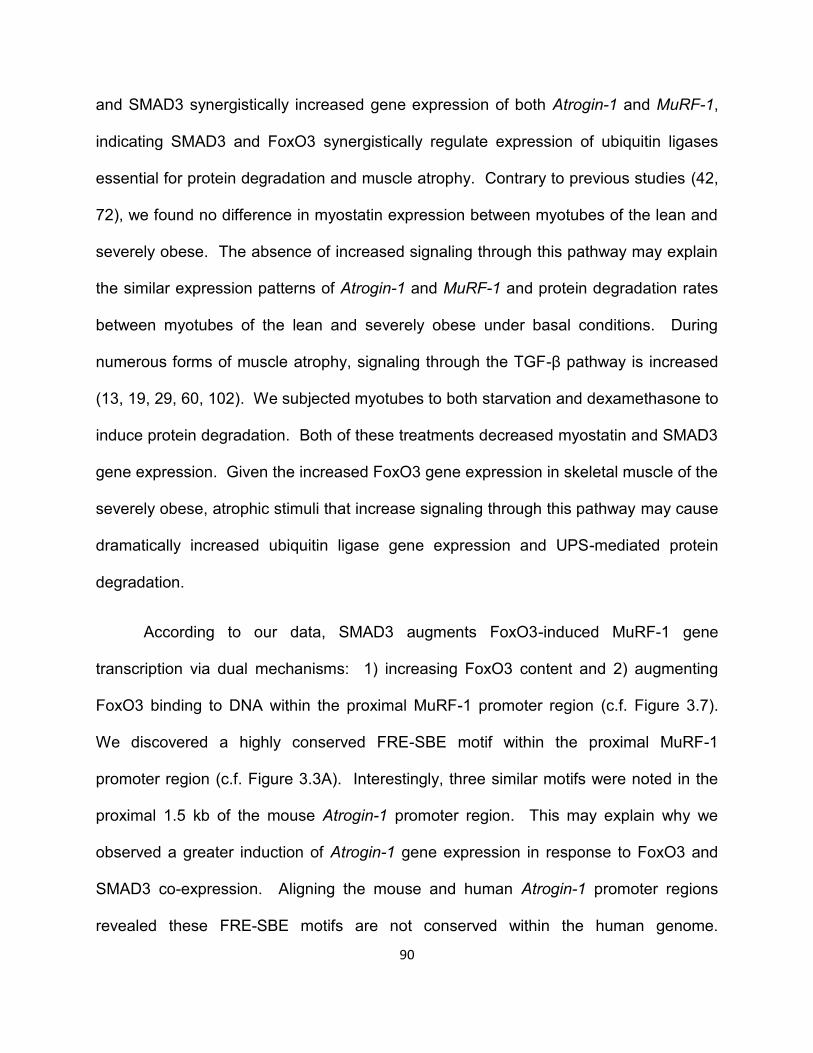
90
and SMAD3 synergistically increased gene expression of both Atrogin-1 and MuRF-1,
indicating SMAD3 and FoxO3 synergistically regulate expression of ubiquitin ligases
essential for protein degradation and muscle atrophy. Contrary to previous studies (42,
72), we found no difference in myostatin expression between myotubes of the lean and
severely obese. The absence of increased signaling through this pathway may explain
the similar expression patterns of Atrogin-1 and MuRF-1 and protein degradation rates
between myotubes of the lean and severely obese under basal conditions. During
numerous forms of muscle atrophy, signaling through the TGF-β pathway is increased
(13, 19, 29, 60, 102). We subjected myotubes to both starvation and dexamethasone to
induce protein degradation. Both of these treatments decreased myostatin and SMAD3
gene expression. Given the increased FoxO3 gene expression in skeletal muscle of the
severely obese, atrophic stimuli that increase signaling through this pathway may cause
dramatically increased ubiquitin ligase gene expression and UPS-mediated protein
degradation.
According to our data, SMAD3 augments FoxO3-induced MuRF-1 gene
transcription via dual mechanisms: 1) increasing FoxO3 content and 2) augmenting
FoxO3 binding to DNA within the proximal MuRF-1 promoter region (c.f. Figure 3.7).
We discovered a highly conserved FRE-SBE motif within the proximal MuRF-1
promoter region (c.f. Figure 3.3A). Interestingly, three similar motifs were noted in the
proximal 1.5 kb of the mouse Atrogin-1 promoter region. This may explain why we
observed a greater induction of Atrogin-1 gene expression in response to FoxO3 and
SMAD3 co-expression. Aligning the mouse and human Atrogin-1 promoter regions
revealed these FRE-SBE motifs are not conserved within the human genome.
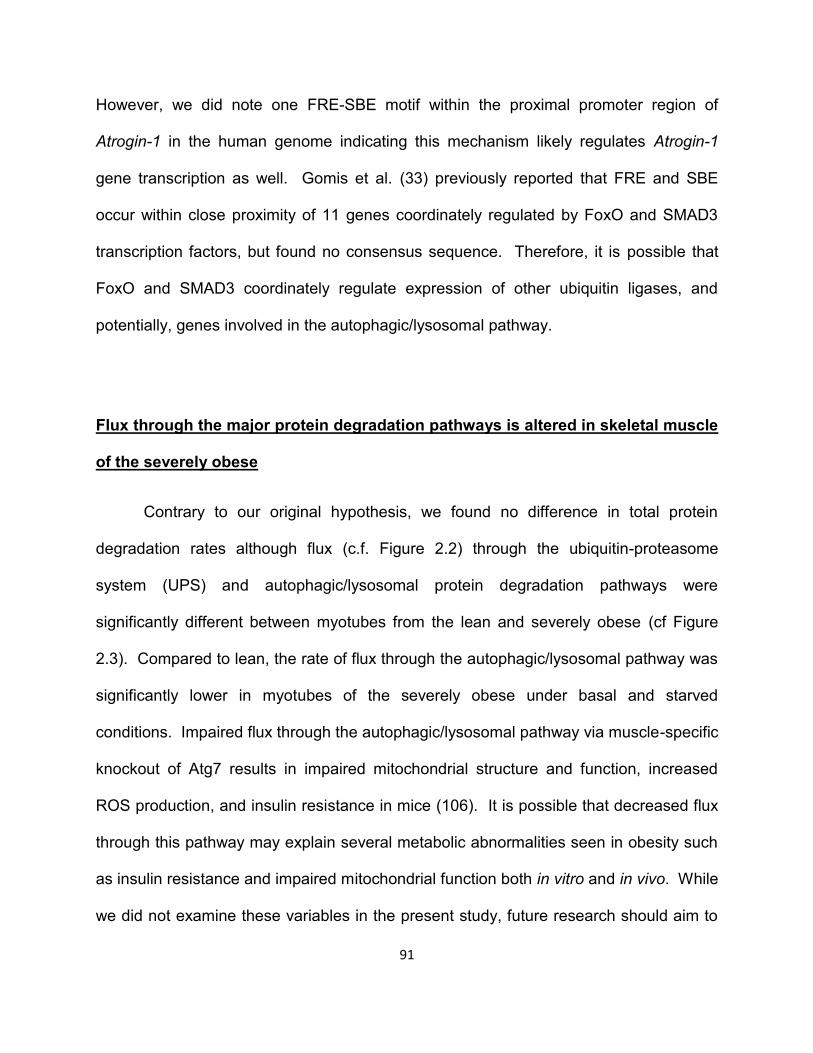
91
However, we did note one FRE-SBE motif within the proximal promoter region of
Atrogin-1 in the human genome indicating this mechanism likely regulates Atrogin-1
gene transcription as well. Gomis et al. (33) previously reported that FRE and SBE
occur within close proximity of 11 genes coordinately regulated by FoxO and SMAD3
transcription factors, but found no consensus sequence. Therefore, it is possible that
FoxO and SMAD3 coordinately regulate expression of other ubiquitin ligases, and
potentially, genes involved in the autophagic/lysosomal pathway.
Flux through the major protein degradation pathways is altered in skeletal muscle
of the severely obese
Contrary to our original hypothesis, we found no difference in total protein
degradation rates although flux (c.f. Figure 2.2) through the ubiquitin-proteasome
system (UPS) and autophagic/lysosomal protein degradation pathways were
significantly different between myotubes from the lean and severely obese (cf Figure
2.3). Compared to lean, the rate of flux through the autophagic/lysosomal pathway was
significantly lower in myotubes of the severely obese under basal and starved
conditions. Impaired flux through the autophagic/lysosomal pathway via muscle-specific
knockout of Atg7 results in impaired mitochondrial structure and function, increased
ROS production, and insulin resistance in mice (106). It is possible that decreased flux
through this pathway may explain several metabolic abnormalities seen in obesity such
as insulin resistance and impaired mitochondrial function both in vitro and in vivo. While
we did not examine these variables in the present study, future research should aim to
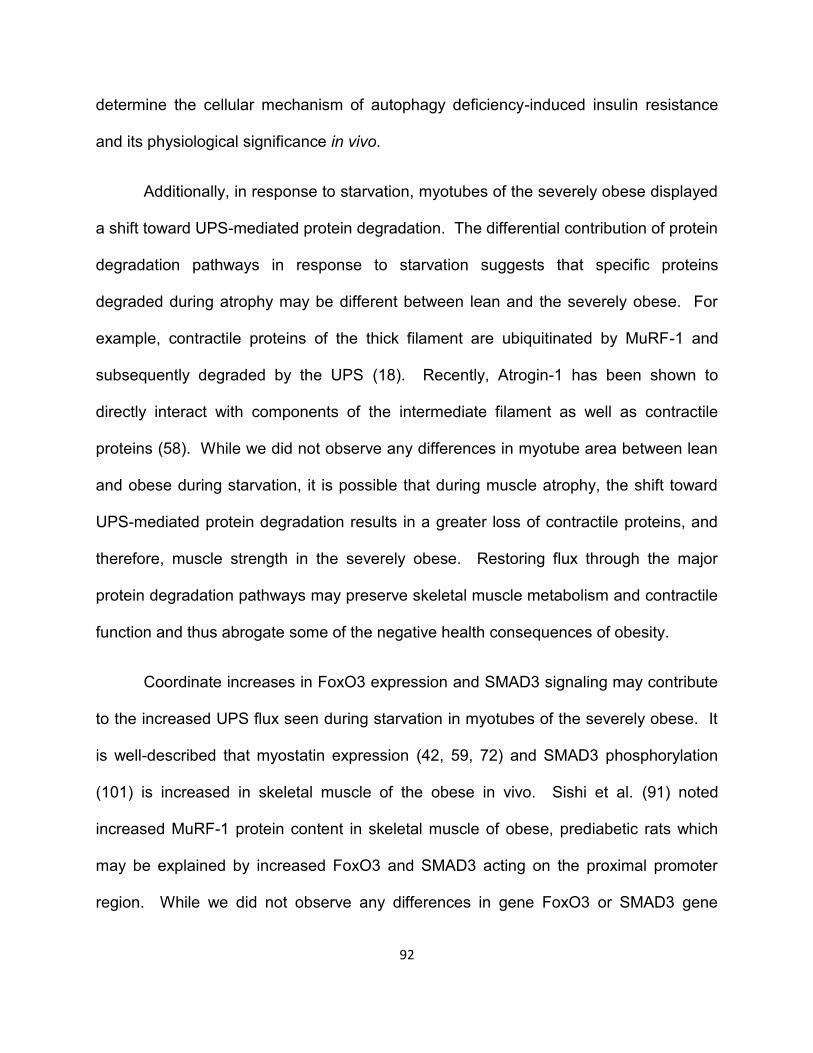
92
determine the cellular mechanism of autophagy deficiency-induced insulin resistance
and its physiological significance in vivo.
Additionally, in response to starvation, myotubes of the severely obese displayed
a shift toward UPS-mediated protein degradation. The differential contribution of protein
degradation pathways in response to starvation suggests that specific proteins
degraded during atrophy may be different between lean and the severely obese. For
example, contractile proteins of the thick filament are ubiquitinated by MuRF-1 and
subsequently degraded by the UPS (18). Recently, Atrogin-1 has been shown to
directly interact with components of the intermediate filament as well as contractile
proteins (58). While we did not observe any differences in myotube area between lean
and obese during starvation, it is possible that during muscle atrophy, the shift toward
UPS-mediated protein degradation results in a greater loss of contractile proteins, and
therefore, muscle strength in the severely obese. Restoring flux through the major
protein degradation pathways may preserve skeletal muscle metabolism and contractile
function and thus abrogate some of the negative health consequences of obesity.
Coordinate increases in FoxO3 expression and SMAD3 signaling may contribute
to the increased UPS flux seen during starvation in myotubes of the severely obese. It
is well-described that myostatin expression (42, 59, 72) and SMAD3 phosphorylation
(101) is increased in skeletal muscle of the obese in vivo. Sishi et al. (91) noted
increased MuRF-1 protein content in skeletal muscle of obese, prediabetic rats which
may be explained by increased FoxO3 and SMAD3 acting on the proximal promoter
region. While we did not observe any differences in gene FoxO3 or SMAD3 gene
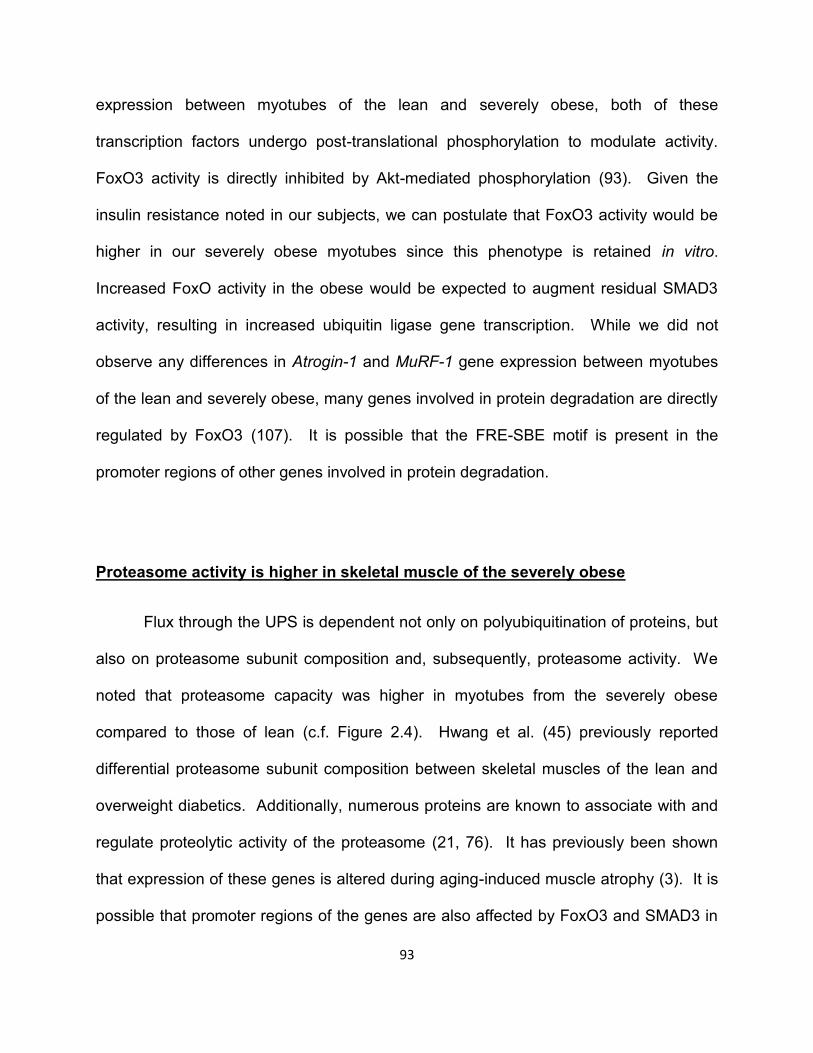
93
expression between myotubes of the lean and severely obese, both of these
transcription factors undergo post-translational phosphorylation to modulate activity.
FoxO3 activity is directly inhibited by Akt-mediated phosphorylation (93). Given the
insulin resistance noted in our subjects, we can postulate that FoxO3 activity would be
higher in our severely obese myotubes since this phenotype is retained in vitro.
Increased FoxO activity in the obese would be expected to augment residual SMAD3
activity, resulting in increased ubiquitin ligase gene transcription. While we did not
observe any differences in Atrogin-1 and MuRF-1 gene expression between myotubes
of the lean and severely obese, many genes involved in protein degradation are directly
regulated by FoxO3 (107). It is possible that the FRE-SBE motif is present in the
promoter regions of other genes involved in protein degradation.
Proteasome activity is higher in skeletal muscle of the severely obese
Flux through the UPS is dependent not only on polyubiquitination of proteins, but
also on proteasome subunit composition and, subsequently, proteasome activity. We
noted that proteasome capacity was higher in myotubes from the severely obese
compared to those of lean (c.f. Figure 2.4). Hwang et al. (45) previously reported
differential proteasome subunit composition between skeletal muscles of the lean and
overweight diabetics. Additionally, numerous proteins are known to associate with and
regulate proteolytic activity of the proteasome (21, 76). It has previously been shown
that expression of these genes is altered during aging-induced muscle atrophy (3). It is
possible that promoter regions of the genes are also affected by FoxO3 and SMAD3 in
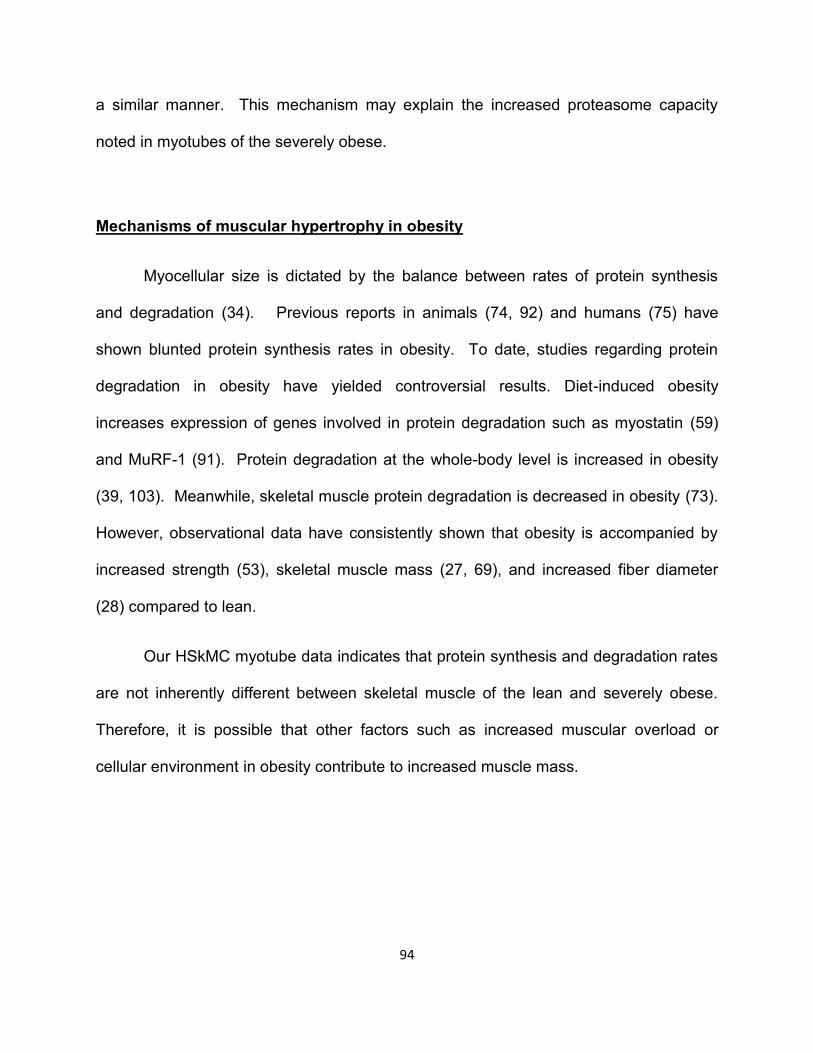
94
a similar manner. This mechanism may explain the increased proteasome capacity
noted in myotubes of the severely obese.
Mechanisms of muscular hypertrophy in obesity
Myocellular size is dictated by the balance between rates of protein synthesis
and degradation (34). Previous reports in animals (74, 92) and humans (75) have
shown blunted protein synthesis rates in obesity. To date, studies regarding protein
degradation in obesity have yielded controversial results. Diet-induced obesity
increases expression of genes involved in protein degradation such as myostatin (59)
and MuRF-1 (91). Protein degradation at the whole-body level is increased in obesity
(39, 103). Meanwhile, skeletal muscle protein degradation is decreased in obesity (73).
However, observational data have consistently shown that obesity is accompanied by
increased strength (53), skeletal muscle mass (27, 69), and increased fiber diameter
(28) compared to lean.
Our HSkMC myotube data indicates that protein synthesis and degradation rates
are not inherently different between skeletal muscle of the lean and severely obese.
Therefore, it is possible that other factors such as increased muscular overload or
cellular environment in obesity contribute to increased muscle mass.
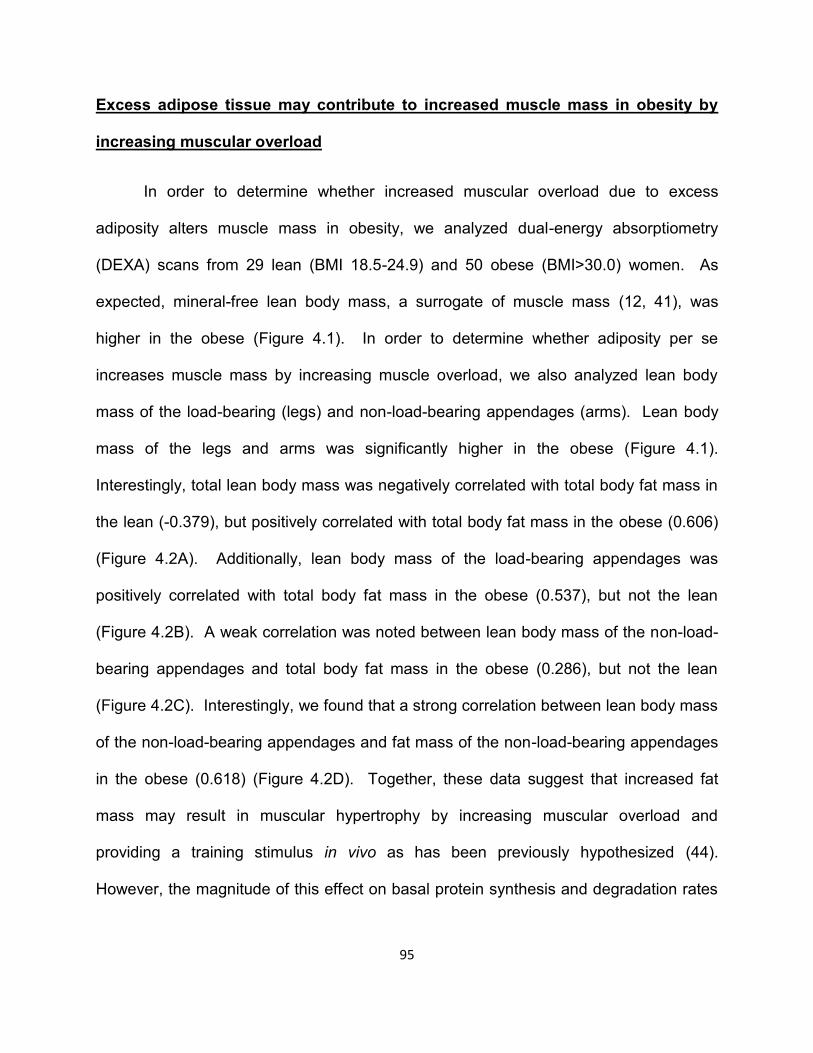
95
Excess adipose tissue may contribute to increased muscle mass in obesity by
increasing muscular overload
In order to determine whether increased muscular overload due to excess
adiposity alters muscle mass in obesity, we analyzed dual-energy absorptiometry
(DEXA) scans from 29 lean (BMI 18.5-24.9) and 50 obese (BMI>30.0) women. As
expected, mineral-free lean body mass, a surrogate of muscle mass (12, 41), was
higher in the obese (Figure 4.1). In order to determine whether adiposity per se
increases muscle mass by increasing muscle overload, we also analyzed lean body
mass of the load-bearing (legs) and non-load-bearing appendages (arms). Lean body
mass of the legs and arms was significantly higher in the obese (Figure 4.1).
Interestingly, total lean body mass was negatively correlated with total body fat mass in
the lean (-0.379), but positively correlated with total body fat mass in the obese (0.606)
(Figure 4.2A). Additionally, lean body mass of the load-bearing appendages was
positively correlated with total body fat mass in the obese (0.537), but not the lean
(Figure 4.2B). A weak correlation was noted between lean body mass of the non-load-
bearing appendages and total body fat mass in the obese (0.286), but not the lean
(Figure 4.2C). Interestingly, we found that a strong correlation between lean body mass
of the non-load-bearing appendages and fat mass of the non-load-bearing appendages
in the obese (0.618) (Figure 4.2D). Together, these data suggest that increased fat
mass may result in muscular hypertrophy by increasing muscular overload and
providing a training stimulus in vivo as has been previously hypothesized (44).
However, the magnitude of this effect on basal protein synthesis and degradation rates
96
may be difficult to measure in vivo and thus contribute to the disparate protein
degradation results of previous studies.
High fat exposure increases myocellular size by decreasing protein degradation
rate
In addition to adiposity, obesity is accompanied by increased circulating fatty
acids (7). Therefore, in order determine how a high fat cellular environment affects
transcriptional regulation of protein degradation, we incubated C2C12 myotubes in
media containing high fatty acids for up to 72 h. High fat exposure significantly
decreased, expression of genes involved in the UPS, autophagic/lysosomal pathway,
and TGF-β signaling. Notably, gene expression of Atrogin-1 and MuRF-1 was
significantly down-regulated in response to high fat exposure (Figure 4.3A). A similar
pattern of gene expression was noted for FoxO3, although this trend failed to reach
statistical significance. Expression of genes involved in the autophagic/lysosomal
pathway was more variable in their response to high fat exposure. Gene expression of
both LC3B and ATG4B were significantly down-regulated in response to high fat
exposure (Figure 4.3B). However, both Gabarapl-1 and BECN1 were unaffected by
high fat exposure. Interestingly, genes involved in TGF-β signaling were significantly
down-regulated in response to high fat exposure. Gene expression of both SMAD2 and
SMAD3 gene expression was significantly decreased in response to high fat exposure
(Figure 4.3C). This pathway has recently been implicated in the development of
skeletal muscle insulin resistance (96) and signaling through this pathway is increased
97
in obesity (59, 101). High fat exposure induces marked insulin resistance in vitro (6).
Downregulation of TGF-β signaling may serve to maintain insulin sensitivity during this
treatment.
To determine whether decreased expression of TGF-β signaling genes alters
transcriptional response to this pathway, we expressed a SBE-luciferase plasmid in
C2C12 and measured basal luciferase activity in response to high fat exposure. SBE-
luciferase activity was unchanged following 24 h of high fat exposure, but decreased in
a step-wise manner with prolonged exposure to high fat (Figure 4.4). Our data show
that SMAD3 is a crucial regulator of FoxO3-induced Atrogin-1 and MuRF-1 gene
expression. In fact, knockdown of SMAD3 transcriptional activity significantly
attenuated FoxO3-induced MuRF-1 promoter activity. Therefore, it is possible that
decreased SMAD transcriptional activity may drive the decreased Atrogin-1 and MuRF-
1 gene expression noted with prolonged high fat exposure.
Interestingly, prolonged exposure to high fat significantly increased protein
content of C2C12 myotubes (Figure 4.5A) and this effect was independent of protein
synthesis (Figure 4.5B). Exposure to high fat for 24 h significantly attenuated basal
protein degradation rate in C2C12 myotubes and this persisted through 48 h of high fat
exposure (Figure 4.5C). Therefore, it is possible that acute exposure to high fat, such
as following a high fat meal or increased lipolytic activity, may reduce skeletal muscle
protein degradation rate. Interestingly, prolonged high fat exposure increased protein
degradation rate in a step-wise manner; following 72 h of high fat exposure, protein
degradation rate was not significantly different from basal. Therefore, chronic high fat
98
exposure may produce compensatory mechanisms to increase basal protein
degradation rate. Since circulating free fatty acid concentration is higher in the obese
(7, 94), this may explain why basal protein degradation rates are similar between
skeletal muscles of the lean and severely obese. Furthermore, repeated transient
increases in high fat exposure, such as following multiple high fat meals, may produce
transient post-prandial decreases in protein degradation which may in turn contribute to
increased skeletal muscle mass observed in obesity.
Taken together, the current project indicates that the transcriptional regulation of
protein degradation is not inherently different between skeletal muscles of the lean and
severely obese. Despite the similar transcriptional regulation of protein degradation,
myotubes of the severely obese have decreased flux through the autophagic/lysosomal
pathway which may contribute to impaired mitochondrial function and insulin resistance
both in vitro and in vivo. In myotubes of the severely obese, starvation induces a shift
toward UPS-mediated protein degradation which may result in increased degradation of
sarcomeric proteins and, ultimately, decreased force production. FoxO3, a major
transcriptional regulator of both UPS and autophagic/lysosomal-mediated protein
degradation, is overexpressed in myotubes of the severely obese. Furthermore, FoxO3
is synergistically activated by SMAD3 via dual mechanisms: 1) increased FoxO3
protein content and 2) increased FoxO3 binding at conserved FRE-SBE motifs within
the promoter region of FoxO3-inducible genes. Coordinate activation of both these
transcription factors likely contributes to upregulation of ubiquitin ligases during muscle
atrophy. Given our finding of increased FoxO3 gene expression in skeletal muscle of
the severely obese, it is possible that atrophic stimuli that increase TGF-β signaling may
99
cause dramatically increased protein degradation and muscle atrophy in the severely
obese. Furthermore, exposure of myotubes to an obesogenic environment decreases
expression of protein degradation genes and transiently decreases protein degradation
rates. Repeated exposure to this type of environment, combined with increased daily
loading from increased adiposity may contribute to the increased skeletal muscle mass
seen in obesity.
References
1. Allen DL, Cleary AS, Speaker KJ, Lindsay SF, Uyenishi J, Reed JM, Madden MC,
Mehan RS. Myostatin, activin receptor IIb, and follistatin-like-3 gene expression are altered in
adipose tissue and skeletal muscle of obese mice. Am. J. Physiol. Endocrinol. Metab. 294:
E918–27, 2008.
2. Allen DL, Unterman TG. Regulation of myostatin expression and myoblast differentiation by FoxO and SMAD transcription factors. Am. J. Physiol. Cell Physiol. 292: 188–99, 2007.
3. Altun M, Besche HC, Overkleeft HS, Piccirillo R, Edelmann MJ, Kessler BM, Goldberg AL, Ulfhake B. Muscle wasting in aged, sarcopenic rats is associated with enhanced activity of the ubiquitin proteasome pathway. J. Biol. Chem. 285: 39597–608, 2010.
4. Amirouche A, Durieux A-C, Banzet S, Koulmann N, Bonnefoy R, Mouret C, Bigard X, Peinnequin A, Freyssenet D. Down-regulation of Akt/mammalian target of rapamycin signaling pathway in response to myostatin overexpression in skeletal muscle. Endocrinology 150: 286–94, 2009.
5. Berggren JR, Tanner CJ, Houmard JA. Primary cell cultures in the study of human muscle metabolism. Exerc. Sport Sci. Rev. 35: 56–61, 2007.
6. Bikman BT, Zheng D, Reed MA, Hickner RC, Houmard JA, Dohm GL. Lipid-induced insulin resistance is prevented in lean and obese myotubes by AICAR treatment. Am. J. Physiol. Regul. Integr. Comp. Physiol. 298: R1692–9, 2010.
7. Björntorp P, Bergman H, Varnauskas E. Plasma free fatty acid turnover rate in obesity. Acta Med. Scand. 185: 351–6, 1969.
8. Bodine SC, Latres E, Baumhueter S, Lai VK, Nunez L, Clarke BA, Poueymirou WT, Panaro FJ, Na E, Dharmarajan K, Pan ZQ, Valenzuela DM, DeChiara TM, Stitt TN, Yancopoulos GD, Glass DJ. Identification of ubiquitin ligases required for skeletal muscle atrophy. Science 294: 1704–8, 2001.
9. Bonnard C, Durand A, Peyrol S, Chanseaume E, Chauvin M-A, Morio B, Vidal H, Rieusset J. Mitochondrial dysfunction results from oxidative stress in the skeletal muscle of diet-induced insulin-resistant mice. J. Clin. Invest. 118: 789–800, 2008.
10. Boyle KE, Zheng D, Anderson EJ, Neufer PD, Houmard JA. Mitochondrial lipid oxidation is impaired in cultured myotubes from obese humans. Int. J. Obes. 36: 1025–31, 2012.
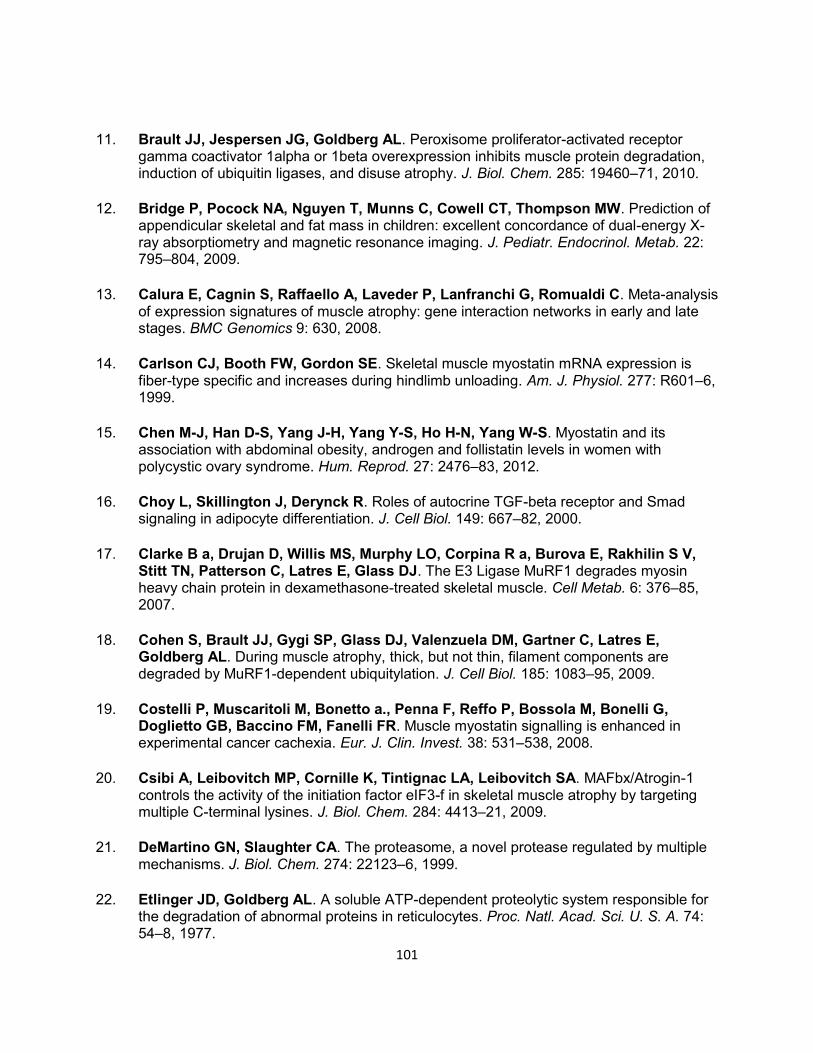
101
11. Brault JJ, Jespersen JG, Goldberg AL. Peroxisome proliferator-activated receptor gamma coactivator 1alpha or 1beta overexpression inhibits muscle protein degradation, induction of ubiquitin ligases, and disuse atrophy. J. Biol. Chem. 285: 19460–71, 2010.
12. Bridge P, Pocock NA, Nguyen T, Munns C, Cowell CT, Thompson MW. Prediction of appendicular skeletal and fat mass in children: excellent concordance of dual-energy X-ray absorptiometry and magnetic resonance imaging. J. Pediatr. Endocrinol. Metab. 22: 795–804, 2009.
13. Calura E, Cagnin S, Raffaello A, Laveder P, Lanfranchi G, Romualdi C. Meta-analysis of expression signatures of muscle atrophy: gene interaction networks in early and late stages. BMC Genomics 9: 630, 2008.
14. Carlson CJ, Booth FW, Gordon SE. Skeletal muscle myostatin mRNA expression is fiber-type specific and increases during hindlimb unloading. Am. J. Physiol. 277: R601–6, 1999.
15. Chen M-J, Han D-S, Yang J-H, Yang Y-S, Ho H-N, Yang W-S. Myostatin and its association with abdominal obesity, androgen and follistatin levels in women with polycystic ovary syndrome. Hum. Reprod. 27: 2476–83, 2012.
16. Choy L, Skillington J, Derynck R. Roles of autocrine TGF-beta receptor and Smad signaling in adipocyte differentiation. J. Cell Biol. 149: 667–82, 2000.
17. Clarke B a, Drujan D, Willis MS, Murphy LO, Corpina R a, Burova E, Rakhilin S V, Stitt TN, Patterson C, Latres E, Glass DJ. The E3 Ligase MuRF1 degrades myosin heavy chain protein in dexamethasone-treated skeletal muscle. Cell Metab. 6: 376–85, 2007.
18. Cohen S, Brault JJ, Gygi SP, Glass DJ, Valenzuela DM, Gartner C, Latres E, Goldberg AL. During muscle atrophy, thick, but not thin, filament components are degraded by MuRF1-dependent ubiquitylation. J. Cell Biol. 185: 1083–95, 2009.
19. Costelli P, Muscaritoli M, Bonetto a., Penna F, Reffo P, Bossola M, Bonelli G, Doglietto GB, Baccino FM, Fanelli FR. Muscle myostatin signalling is enhanced in experimental cancer cachexia. Eur. J. Clin. Invest. 38: 531–538, 2008.
20. Csibi A, Leibovitch MP, Cornille K, Tintignac LA, Leibovitch SA. MAFbx/Atrogin-1 controls the activity of the initiation factor eIF3-f in skeletal muscle atrophy by targeting multiple C-terminal lysines. J. Biol. Chem. 284: 4413–21, 2009.
21. DeMartino GN, Slaughter CA. The proteasome, a novel protease regulated by multiple mechanisms. J. Biol. Chem. 274: 22123–6, 1999.
22. Etlinger JD, Goldberg AL. A soluble ATP-dependent proteolytic system responsible for the degradation of abnormal proteins in reticulocytes. Proc. Natl. Acad. Sci. U. S. A. 74: 54–8, 1977.
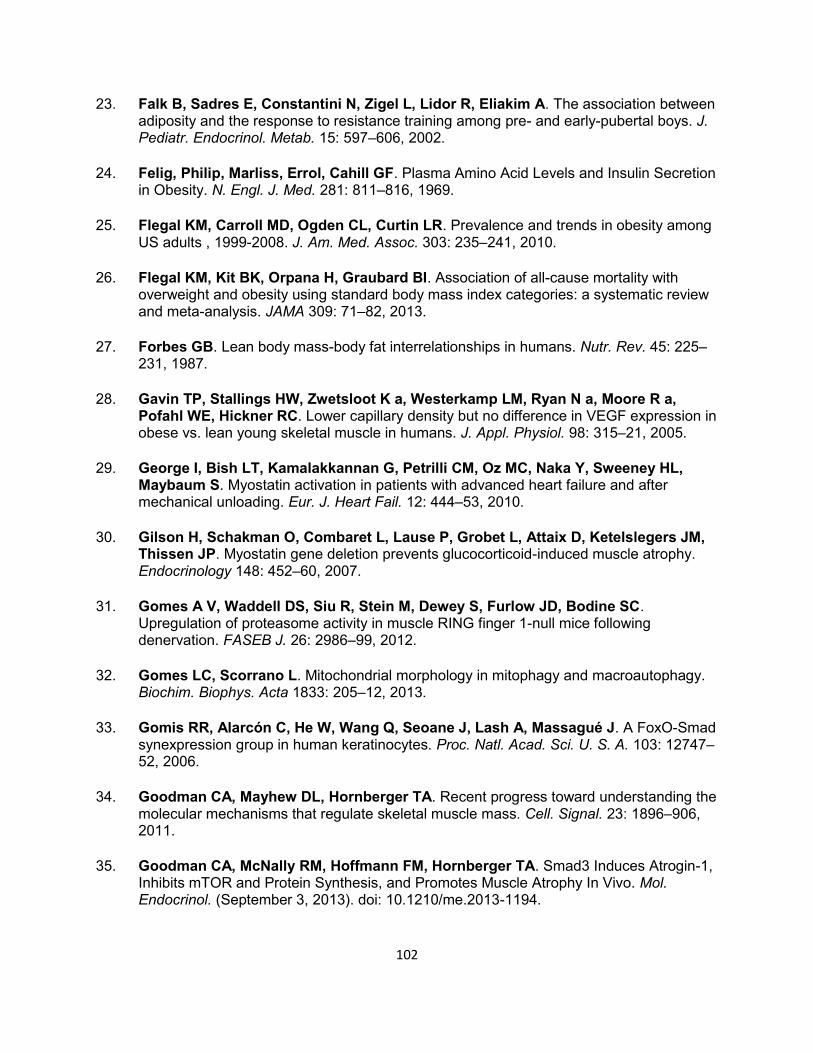
102
23. Falk B, Sadres E, Constantini N, Zigel L, Lidor R, Eliakim A. The association between adiposity and the response to resistance training among pre- and early-pubertal boys. J. Pediatr. Endocrinol. Metab. 15: 597–606, 2002.
24. Felig, Philip, Marliss, Errol, Cahill GF. Plasma Amino Acid Levels and Insulin Secretion in Obesity. N. Engl. J. Med. 281: 811–816, 1969.
25. Flegal KM, Carroll MD, Ogden CL, Curtin LR. Prevalence and trends in obesity among US adults , 1999-2008. J. Am. Med. Assoc. 303: 235–241, 2010.
26. Flegal KM, Kit BK, Orpana H, Graubard BI. Association of all-cause mortality with overweight and obesity using standard body mass index categories: a systematic review and meta-analysis. JAMA 309: 71–82, 2013.
27. Forbes GB. Lean body mass-body fat interrelationships in humans. Nutr. Rev. 45: 225–231, 1987.
28. Gavin TP, Stallings HW, Zwetsloot K a, Westerkamp LM, Ryan N a, Moore R a, Pofahl WE, Hickner RC. Lower capillary density but no difference in VEGF expression in obese vs. lean young skeletal muscle in humans. J. Appl. Physiol. 98: 315–21, 2005.
29. George I, Bish LT, Kamalakkannan G, Petrilli CM, Oz MC, Naka Y, Sweeney HL, Maybaum S. Myostatin activation in patients with advanced heart failure and after mechanical unloading. Eur. J. Heart Fail. 12: 444–53, 2010.
30. Gilson H, Schakman O, Combaret L, Lause P, Grobet L, Attaix D, Ketelslegers JM, Thissen JP. Myostatin gene deletion prevents glucocorticoid-induced muscle atrophy. Endocrinology 148: 452–60, 2007.
31. Gomes A V, Waddell DS, Siu R, Stein M, Dewey S, Furlow JD, Bodine SC. Upregulation of proteasome activity in muscle RING finger 1-null mice following denervation. FASEB J. 26: 2986–99, 2012.
32. Gomes LC, Scorrano L. Mitochondrial morphology in mitophagy and macroautophagy. Biochim. Biophys. Acta 1833: 205–12, 2013.
33. Gomis RR, Alarcón C, He W, Wang Q, Seoane J, Lash A, Massagué J. A FoxO-Smad synexpression group in human keratinocytes. Proc. Natl. Acad. Sci. U. S. A. 103: 12747–52, 2006.
34. Goodman CA, Mayhew DL, Hornberger TA. Recent progress toward understanding the molecular mechanisms that regulate skeletal muscle mass. Cell. Signal. 23: 1896–906, 2011.
35. Goodman CA, McNally RM, Hoffmann FM, Hornberger TA. Smad3 Induces Atrogin-1, Inhibits mTOR and Protein Synthesis, and Promotes Muscle Atrophy In Vivo. Mol. Endocrinol. (September 3, 2013). doi: 10.1210/me.2013-1194.
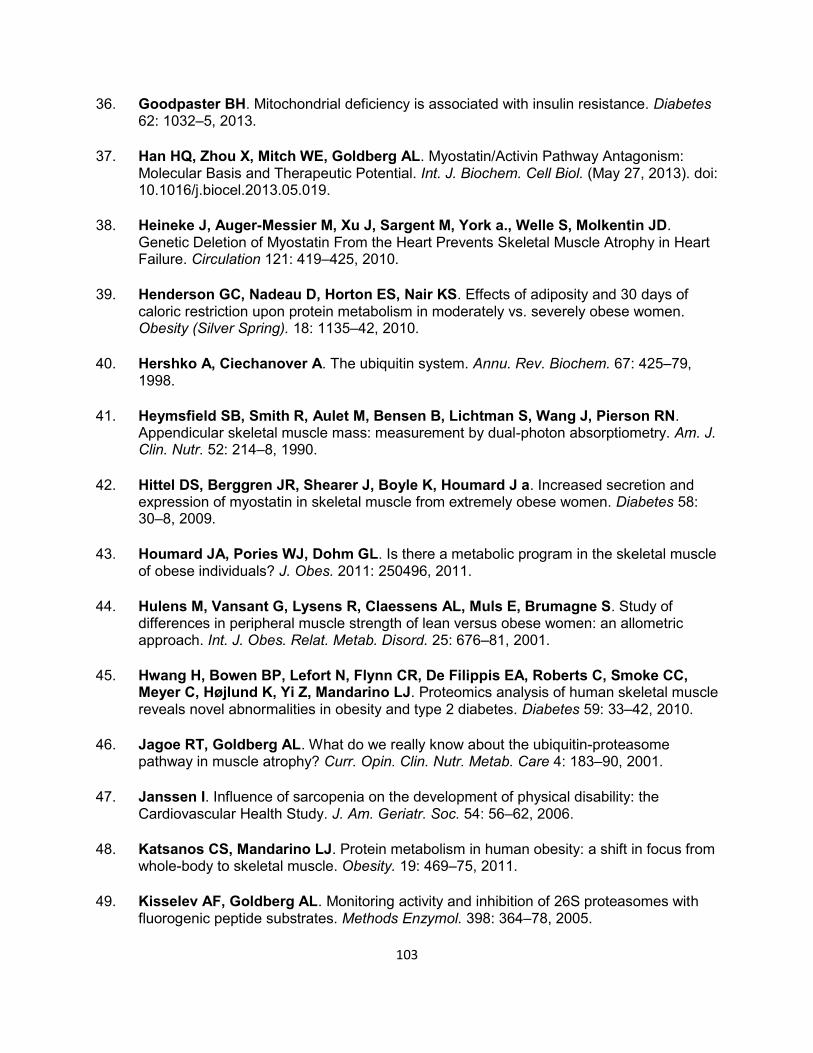
103
36. Goodpaster BH. Mitochondrial deficiency is associated with insulin resistance. Diabetes 62: 1032–5, 2013.
37. Han HQ, Zhou X, Mitch WE, Goldberg AL. Myostatin/Activin Pathway Antagonism: Molecular Basis and Therapeutic Potential. Int. J. Biochem. Cell Biol. (May 27, 2013). doi: 10.1016/j.biocel.2013.05.019.
38. Heineke J, Auger-Messier M, Xu J, Sargent M, York a., Welle S, Molkentin JD. Genetic Deletion of Myostatin From the Heart Prevents Skeletal Muscle Atrophy in Heart Failure. Circulation 121: 419–425, 2010.
39. Henderson GC, Nadeau D, Horton ES, Nair KS. Effects of adiposity and 30 days of caloric restriction upon protein metabolism in moderately vs. severely obese women. Obesity (Silver Spring). 18: 1135–42, 2010.
40. Hershko A, Ciechanover A. The ubiquitin system. Annu. Rev. Biochem. 67: 425–79, 1998.
41. Heymsfield SB, Smith R, Aulet M, Bensen B, Lichtman S, Wang J, Pierson RN. Appendicular skeletal muscle mass: measurement by dual-photon absorptiometry. Am. J. Clin. Nutr. 52: 214–8, 1990.
42. Hittel DS, Berggren JR, Shearer J, Boyle K, Houmard J a. Increased secretion and expression of myostatin in skeletal muscle from extremely obese women. Diabetes 58: 30–8, 2009.
43. Houmard JA, Pories WJ, Dohm GL. Is there a metabolic program in the skeletal muscle of obese individuals? J. Obes. 2011: 250496, 2011.
44. Hulens M, Vansant G, Lysens R, Claessens AL, Muls E, Brumagne S. Study of differences in peripheral muscle strength of lean versus obese women: an allometric approach. Int. J. Obes. Relat. Metab. Disord. 25: 676–81, 2001.
45. Hwang H, Bowen BP, Lefort N, Flynn CR, De Filippis EA, Roberts C, Smoke CC, Meyer C, Højlund K, Yi Z, Mandarino LJ. Proteomics analysis of human skeletal muscle reveals novel abnormalities in obesity and type 2 diabetes. Diabetes 59: 33–42, 2010.
46. Jagoe RT, Goldberg AL. What do we really know about the ubiquitin-proteasome pathway in muscle atrophy? Curr. Opin. Clin. Nutr. Metab. Care 4: 183–90, 2001.
47. Janssen I. Influence of sarcopenia on the development of physical disability: the Cardiovascular Health Study. J. Am. Geriatr. Soc. 54: 56–62, 2006.
48. Katsanos CS, Mandarino LJ. Protein metabolism in human obesity: a shift in focus from whole-body to skeletal muscle. Obesity. 19: 469–75, 2011.
49. Kisselev AF, Goldberg AL. Monitoring activity and inhibition of 26S proteasomes with fluorogenic peptide substrates. Methods Enzymol. 398: 364–78, 2005.
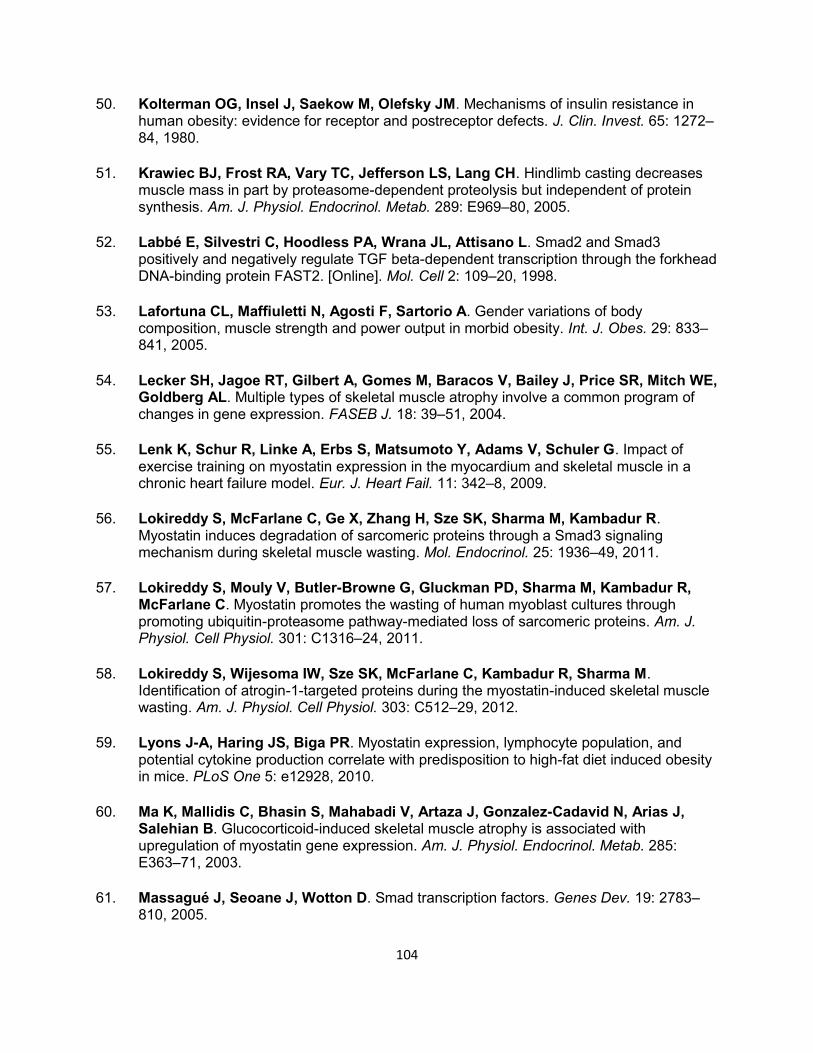
104
50. Kolterman OG, Insel J, Saekow M, Olefsky JM. Mechanisms of insulin resistance in human obesity: evidence for receptor and postreceptor defects. J. Clin. Invest. 65: 1272–84, 1980.
51. Krawiec BJ, Frost RA, Vary TC, Jefferson LS, Lang CH. Hindlimb casting decreases muscle mass in part by proteasome-dependent proteolysis but independent of protein synthesis. Am. J. Physiol. Endocrinol. Metab. 289: E969–80, 2005.
52. Labbé E, Silvestri C, Hoodless PA, Wrana JL, Attisano L. Smad2 and Smad3 positively and negatively regulate TGF beta-dependent transcription through the forkhead DNA-binding protein FAST2. [Online]. Mol. Cell 2: 109–20, 1998.
53. Lafortuna CL, Maffiuletti N, Agosti F, Sartorio A. Gender variations of body composition, muscle strength and power output in morbid obesity. Int. J. Obes. 29: 833–841, 2005.
54. Lecker SH, Jagoe RT, Gilbert A, Gomes M, Baracos V, Bailey J, Price SR, Mitch WE, Goldberg AL. Multiple types of skeletal muscle atrophy involve a common program of changes in gene expression. FASEB J. 18: 39–51, 2004.
55. Lenk K, Schur R, Linke A, Erbs S, Matsumoto Y, Adams V, Schuler G. Impact of exercise training on myostatin expression in the myocardium and skeletal muscle in a chronic heart failure model. Eur. J. Heart Fail. 11: 342–8, 2009.
56. Lokireddy S, McFarlane C, Ge X, Zhang H, Sze SK, Sharma M, Kambadur R. Myostatin induces degradation of sarcomeric proteins through a Smad3 signaling mechanism during skeletal muscle wasting. Mol. Endocrinol. 25: 1936–49, 2011.
57. Lokireddy S, Mouly V, Butler-Browne G, Gluckman PD, Sharma M, Kambadur R, McFarlane C. Myostatin promotes the wasting of human myoblast cultures through promoting ubiquitin-proteasome pathway-mediated loss of sarcomeric proteins. Am. J. Physiol. Cell Physiol. 301: C1316–24, 2011.
58. Lokireddy S, Wijesoma IW, Sze SK, McFarlane C, Kambadur R, Sharma M. Identification of atrogin-1-targeted proteins during the myostatin-induced skeletal muscle wasting. Am. J. Physiol. Cell Physiol. 303: C512–29, 2012.
59. Lyons J-A, Haring JS, Biga PR. Myostatin expression, lymphocyte population, and potential cytokine production correlate with predisposition to high-fat diet induced obesity in mice. PLoS One 5: e12928, 2010.
60. Ma K, Mallidis C, Bhasin S, Mahabadi V, Artaza J, Gonzalez-Cadavid N, Arias J, Salehian B. Glucocorticoid-induced skeletal muscle atrophy is associated with upregulation of myostatin gene expression. Am. J. Physiol. Endocrinol. Metab. 285: E363–71, 2003.
61. Massagué J, Seoane J, Wotton D. Smad transcription factors. Genes Dev. 19: 2783–810, 2005.
105
62. Matthews DR, Hosker JP, Rudenski AS, Naylor BA, Treacher DF, Turner RC. Homeostasis model assessment: insulin resistance and beta-cell function from fasting plasma glucose and insulin concentrations in man. Diabetologia 28: 412–9, 1985.
63. Menconi M, Gonnella P, Petkova V, Lecker S, Hasselgren P-O. Dexamethasone and corticosterone induce similar, but not identical, muscle wasting responses in cultured L6 and C2C12 myotubes. J. Cell. Biochem. 105: 353–64, 2008.
64. Metter EJ, Talbot LA, Schrager M, Conwit R. Skeletal muscle strength as a predictor of all-cause mortality in healthy men. J. Gerontol. 57: B359–65, 2002.
65. Mitch WE, Goldberg AL. Mechanisms of muscle wasting. The role of the ubiquitin-proteasome pathway. N. Engl. J. Med. 335: 1897–905, 1996.
66. Mizushima N, Levine B, Cuervo AM, Klionsky DJ. Autophagy fights disease through cellular self-digestion. Nature 451: 1069–75, 2008.
67. Morissette MR, Cook S a, Buranasombati C, Rosenberg M a, Rosenzweig A. Myostatin inhibits IGF-I-induced myotube hypertrophy through Akt. Am. J. Physiol. Cell Physiol. 297: C1124–32, 2009.
68. Morley JE, Thomas DR, Wilson MG. Cachexia: pathophysiology and clinical relevance. Am. J. Clin. Nutr. 83: 735–743, 2006.
69. Morse WI, Soeldner JS. The non-adipose body mass of obese women: evidence of increased muscularity. Can. Med. Assoc. J. 90: 723–5, 1964.
70. Murakami K, Voellmy R, Goldberg AL. Protein degradation is stimulated by ATP in extracts of Escherichia coli. J. Biol. Chem. 254: 8194–200, 1979.
71. Newman AB, Kupelian V, Visser M, Simonsick EM. Strength , But Not Muscle Mass , Is Associated With Mortality in the Health , Ag ... Journals Gerontol. 61: 72–77, 2006.
72. Park J-J, Berggren JR, Hulver MW, Houmard JA, Hoffman EP. GRB14, GPD1, and GDF8 as potential network collaborators in weight loss-induced improvements in insulin action in human skeletal muscle. Physiol. Genomics 27: 114–21, 2006.
73. Patterson BW, Horowitz JF, Wu G, Watford M, Coppack SW, Klein S. Regional muscle and adipose tissue amino acid metabolism in lean and obese women. Am. J. Physiol. Endocrinol. Metab. 282: E931–6, 2002.
74. Paturi S, Gutta AK, Kakarla SK, Katta A, Arnold EC, Wu M, Rice KM, Blough ER. Impaired overload-induced hypertrophy in obese Zucker rat slow-twitch skeletal muscle. J. Appl. Physiol. 108: 7–13, 2010.
75. Pescatello LS, Kelsey BK, Price TB, Seip RL, Angelopoulos TJ, Clarkson PM, Gordon PM, Moyna NM, Visich PS, Zoeller RF, Gordish-Dressman HA, Bilbie SM, Thompson PD, Hoffman EP. The muscle strength and size response to upper arm,
106
unilateral resistance training among adults who are overweight and obese. J. Strength Cond. Res. 21: 307–13, 2007.
76. Piccirillo R, Demontis F, Perrimon N, Goldberg AL. Mechanisms of muscle growth and atrophy in mammals and Drosophila. Dev. Dyn. (August 29, 2013). doi: 10.1002/dvdy.24036.
77. RABINOWITZ D, ZIERLER KL. Forearm metabolism in obesity and its response to intra-arterial insulin. Characterization of insulin resistance and evidence for adaptive hyperinsulinism. J. Clin. Invest. 41: 2173–81, 1962.
78. Raffaello A, Laveder P, Romualdi C, Bean C, Toniolo L, Germinario E, Megighian A, Danieli-Betto D, Reggiani C, Lanfranchi G. Denervation in murine fast-twitch muscle: short-term physiological changes and temporal expression profiling. Physiol. Genomics 25: 60–74, 2006.
79. Ramaswamy S, Nakamura N, Sansal I, Bergeron L, Sellers WR. A novel mechanism of gene regulation and tumor suppression by the transcription factor FKHR. Cancer Cell 2: 81–91, 2002.
80. Rantanen T, Harris T, Leveille SG, Visser M, Foley D, Masaki K, Guralnik JM. Muscle strength and body mass index as long-term predictors of mortality in initially healthy men. journals Gerontol. 55: M168–73, 2000.
81. Reed SA, Sandesara PB, Senf SM, Judge AR. Inhibition of FoxO transcriptional activity prevents muscle fiber atrophy during cachexia and induces hypertrophy. FASEB J. 26: 987–1000, 2012.
82. Sacheck JM, Hyatt J-PK, Raffaello A, Jagoe RT, Roy RR, Edgerton VR, Lecker SH, Goldberg AL. Rapid disuse and denervation atrophy involve transcriptional changes similar to those of muscle wasting during systemic diseases. FASEB J. 21: 140–55, 2007.
83. Sandri M, Sandri C, Gilbert A, Skurk C, Calabria E, Picard A, Walsh K, Schiaffino S, Lecker SH, Goldberg AL. Foxo transcription factors induce the atrophy-related ubiquitin ligase atrogin-1 and cause skeletal muscle atrophy. Cell 117: 399–412, 2004.
84. Sandri M. Protein breakdown in muscle wasting: Role of autophagy-lysosome and ubiquitin-proteasome. Int. J. Biochem. Cell Biol. 45: 2121–9, 2013.
85. Sartori R, Milan G, Patron M, Mammucari C, Blaauw B, Abraham R, Sandri M. Smad2 and 3 transcription factors control muscle mass in adulthood. Am. J. Physiol. Cell Physiol. 296: 1248–1257, 2009.
86. Schöneich C, Dremina E, Galeva N, Sharov V. Apoptosis in differentiating C2C12 muscle cells selectively targets Bcl-2-deficient myotubes. Apoptosis (October 16, 2013). doi: 10.1007/s10495-013-0922-7.
87. Senf SM, Dodd SL, Judge AR. FOXO signaling is required for disuse muscle atrophy and is directly regulated by Hsp70. Am. J. Physiol. Cell Physiol. 298: C38–45, 2010.
107
88. Seoane J, Le H-V, Shen L, Anderson S a, Massagué J. Integration of Smad and forkhead pathways in the control of neuroepithelial and glioblastoma cell proliferation. Cell 117: 211–23, 2004.
89. Seoane J, Le H-V, Shen L, Anderson S a, Massagué J. Integration of Smad and forkhead pathways in the control of neuroepithelial and glioblastoma cell proliferation. Cell 117: 211–23, 2004.
90. Shi Y, Wang YF, Jayaraman L, Yang H, Massagué J, Pavletich NP. Crystal structure of a Smad MH1 domain bound to DNA: insights on DNA binding in TGF-beta signaling. Cell 94: 585–94, 1998..
91. Sishi B, Loos B, Ellis B, Smith W, du Toit EF, Engelbrecht A-M. Diet-induced obesity alters signalling pathways and induces atrophy and apoptosis in skeletal muscle in a prediabetic rat model. Exp. Physiol. 96: 179–93, 2011.
92. Sitnick M, Bodine SC, Rutledge JC. Chronic high fat feeding attenuates load-induced hypertrophy in mice. J. Physiol. 587: 5753–5765, 2009.
93. Stitt TN, Drujan D, Clarke BA, Panaro F, Timofeyva Y, Kline WO, Gonzalez M, Yancopoulos GD, Glass DJ, Pharmaceuticals R, York N. The IGF-1 / PI3K / Akt Pathway Prevents Expression of Muscle Atrophy-Induced Ubiquitin Ligases by Inhibiting FOXO Transcription Factors. Mol. Cell 14: 395–403, 2004.
94. Sun X, Yu Y, Han L. High FFA levels related to microalbuminuria and uncoupling of VEGF-NO axis in obese rats. Int. Urol. Nephrol. 45: 1197–207, 2013.
95. Szulc P, Munoz F, Marchand F, Chapurlat R, Delmas PD. Rapid loss of appendicular skeletal muscle mass is associated with higher all-cause mortality in older men: the prospective MINOS study. Am. J. Clin. Nutr. 91: 1227–36, 2010.
96. Tan CK, Leuenberger N, Tan MJ, Yan YW, Chen Y, Kambadur R, Wahli W, Tan NS. Smad3 deficiency in mice protects against insulin resistance and obesity induced by a high-fat diet. Diabetes 60: 464–76, 2011.
97. Tang ED, Nuñez G, Barr FG, Guan KL. Negative regulation of the forkhead transcription factor FKHR by Akt. J. Biol. Chem. 274: 16741–6, 1999.
98. Tanida I, Minematsu-Ikeguchi N, Ueno T, Kominami E. Lysosomal turnover, but not a cellular level, of endogenous LC3 is a marker for autophagy. Autophagy 1: 84–91, 2005.
99. Trendelenburg AU, Meyer A, Rohner D, Boyle J, Hatakeyama S, Glass DJ. Myostatin reduces Akt/TORC1/p70S6K signaling, inhibiting myoblast differentiation and myotube size. Am. J. Physiol. Cell Physiol. 296: C1258–70, 2009.
100. Waddell DS, Baehr LM, van den Brandt J, Johnsen S a, Reichardt HM, Furlow JD, Bodine SC. The glucocorticoid receptor and FOXO1 synergistically activate the skeletal muscle atrophy-associated MuRF1 gene. Am. J. Physiol. Endocrinol. Metab. 295: E785–97, 2008.
108
101. Watts R, McAinch AJ, Dixon JB, O’Brien PE, Cameron-Smith D. Increased Smad signaling and reduced MRF expression in skeletal muscle from obese subjects. Obesity. 21: 525–8, 2013.
102. Wehling M, Cai B, Tidball JG. Modulation of myostatin expression during modified muscle use. FASEB J. 14: 103–10, 2000.
103. Welle S, Nair KS. Relationship of resting metabolic rate to body composition and protein turnover. Am. J. Physiol. 258: E990–8, 1990.
104. Wilkinson KD. Ubiquitination and deubiquitination: targeting of proteins for degradation by the proteasome. Semin. Cell Dev. Biol. 11: 141–8, 2000.
105. Wing SS. Deubiquitinases in skeletal muscle atrophy. Int. J. Biochem. Cell Biol. 45: 2130–5, 2013.
106. Wu JJ, Quijano C, Chen E, Liu H, Cao L, Fergusson MM, Rovira II, Gutkind S, Daniels MP, Komatsu M, Finkel T. Mitochondrial dysfunction and oxidative stress mediate the physiological impairment induced by the disruption of autophagy. Aging. 1: 425–37, 2009.
107. Zhao J, Brault JJ, Schild A, Cao P, Sandri M, Schiaffino S, Lecker SH, Goldberg AL. FoxO3 coordinately activates protein degradation by the autophagic/lysosomal and proteasomal pathways in atrophying muscle cells. Cell Metab. 6: 472–83, 2007.
108. Zhu X, Topouzis S, Liang L-F, Stotish RL. Myostatin signaling through Smad2, Smad3 and Smad4 is regulated by the inhibitory Smad7 by a negative feedback mechanism. Cytokine 26: 262–72, 2004.
Appendix A: Institutional review board approval