Φ CX3CR1 surface expression in LP M (solid histograms) and...
11
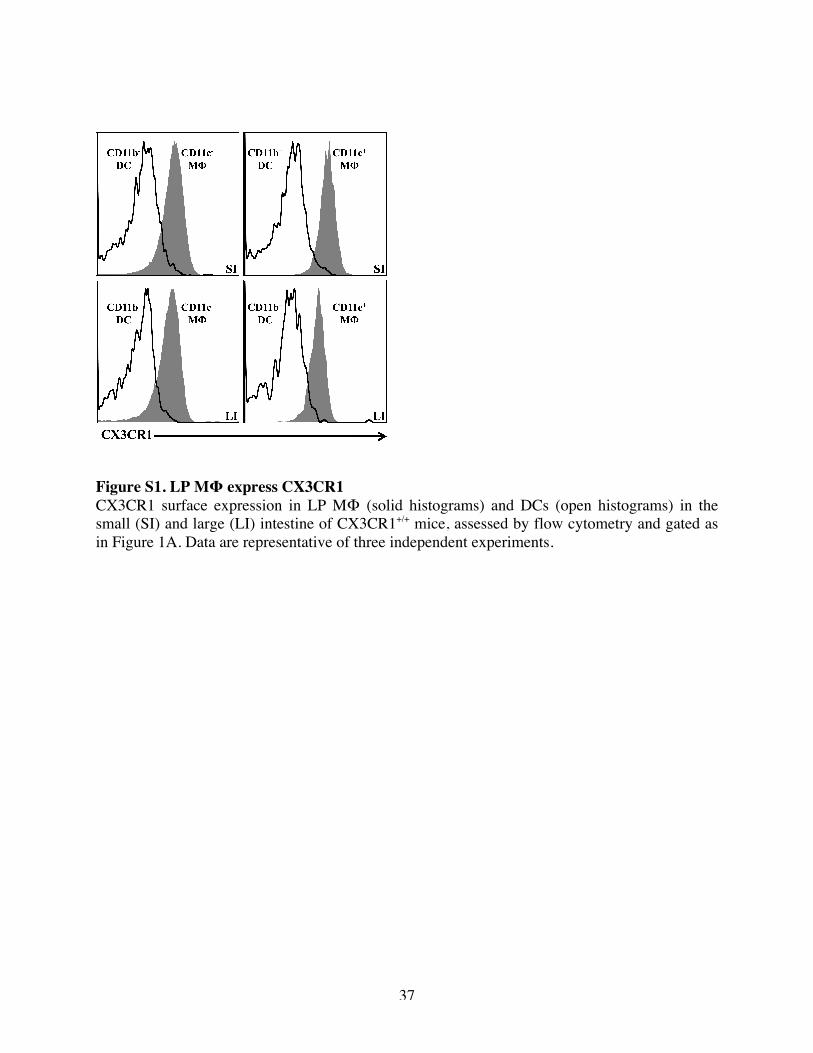
37 Figure S1. LP MΦ express CX3CR1 CX3CR1 surface expression in LP MΦ (solid histograms) and DCs (open histograms) in the small (SI) and large (LI) intestine of CX3CR1 +/+ mice, assessed by flow cytometry and gated as in Figure 1A. Data are representative of three independent experiments.
Transcript of Φ CX3CR1 surface expression in LP M (solid histograms) and...
37
Figure S1. LP MΦ express CX3CR1 CX3CR1 surface expression in LP MΦ (solid histograms) and DCs (open histograms) in the small (SI) and large (LI) intestine of CX3CR1+/+ mice, assessed by flow cytometry and gated as in Figure 1A. Data are representative of three independent experiments.
38
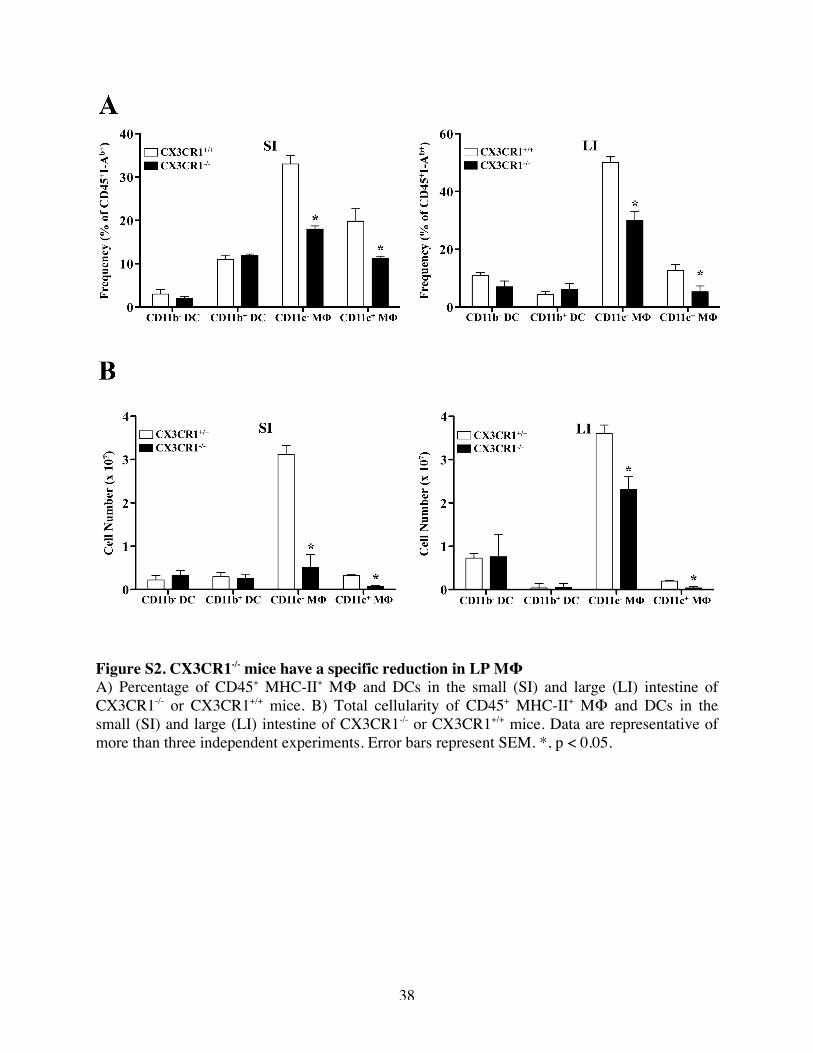
Figure S2. CX3CR1-/- mice have a specific reduction in LP MΦ A) Percentage of CD45+ MHC-II+ MΦ and DCs in the small (SI) and large (LI) intestine of CX3CR1-/- or CX3CR1+/+ mice. B) Total cellularity of CD45+ MHC-II+ MΦ and DCs in the small (SI) and large (LI) intestine of CX3CR1-/- or CX3CR1+/+ mice. Data are representative of more than three independent experiments. Error bars represent SEM. *, p < 0.05.
39
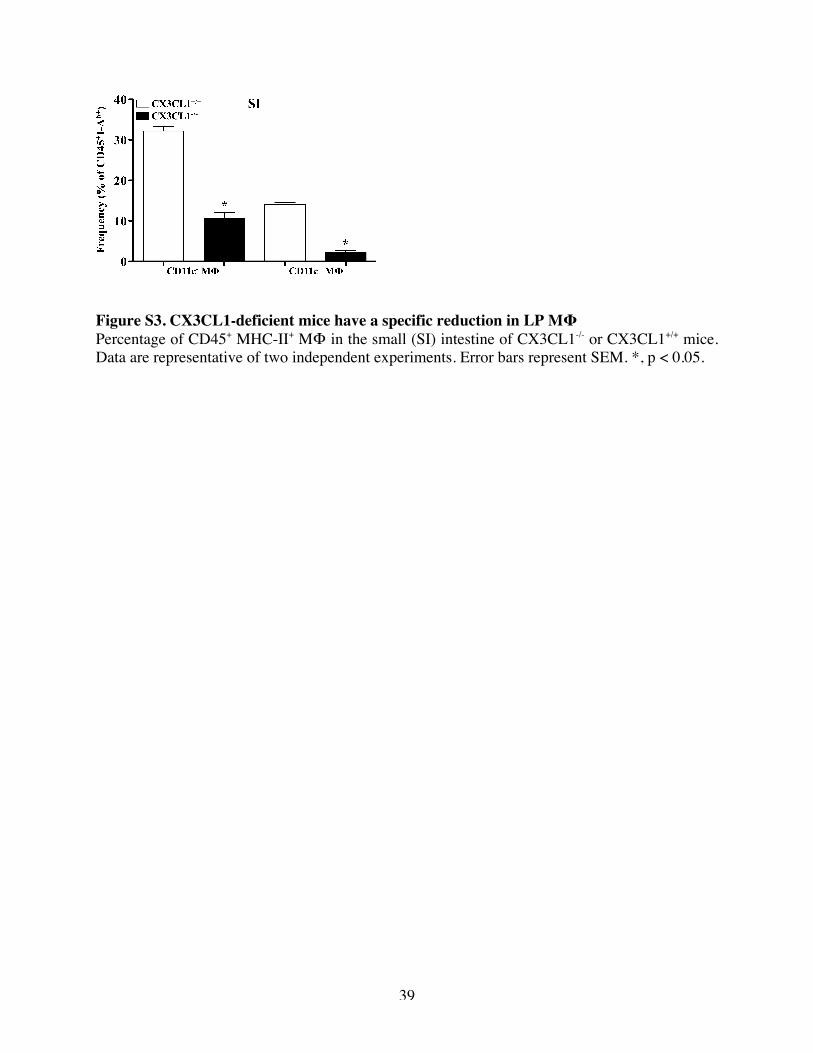
Figure S3. CX3CL1-deficient mice have a specific reduction in LP MΦ Percentage of CD45+ MHC-II+ MΦ in the small (SI) intestine of CX3CL1-/- or CX3CL1+/+ mice. Data are representative of two independent experiments. Error bars represent SEM. *, p < 0.05.
40
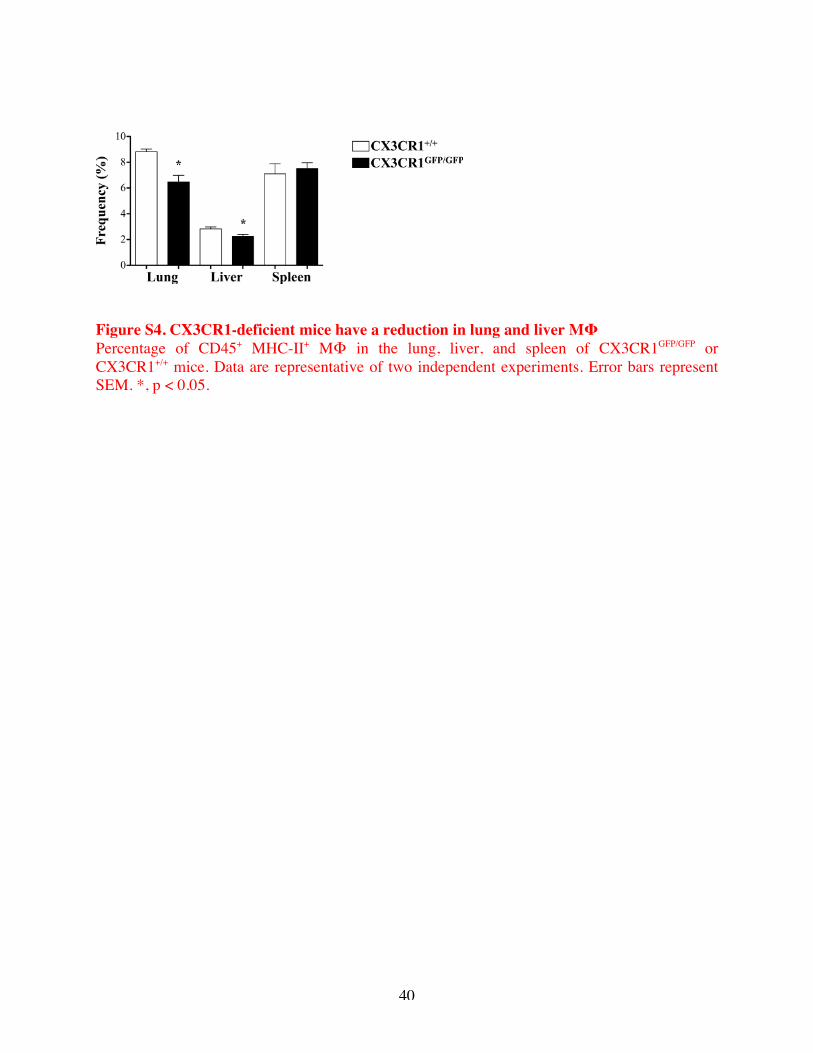
Figure S4. CX3CR1-deficient mice have a reduction in lung and liver MΦ Percentage of CD45+ MHC-II+ MΦ in the lung, liver, and spleen of CX3CR1GFP/GFP or CX3CR1+/+ mice. Data are representative of two independent experiments. Error bars represent SEM. *, p < 0.05.
41
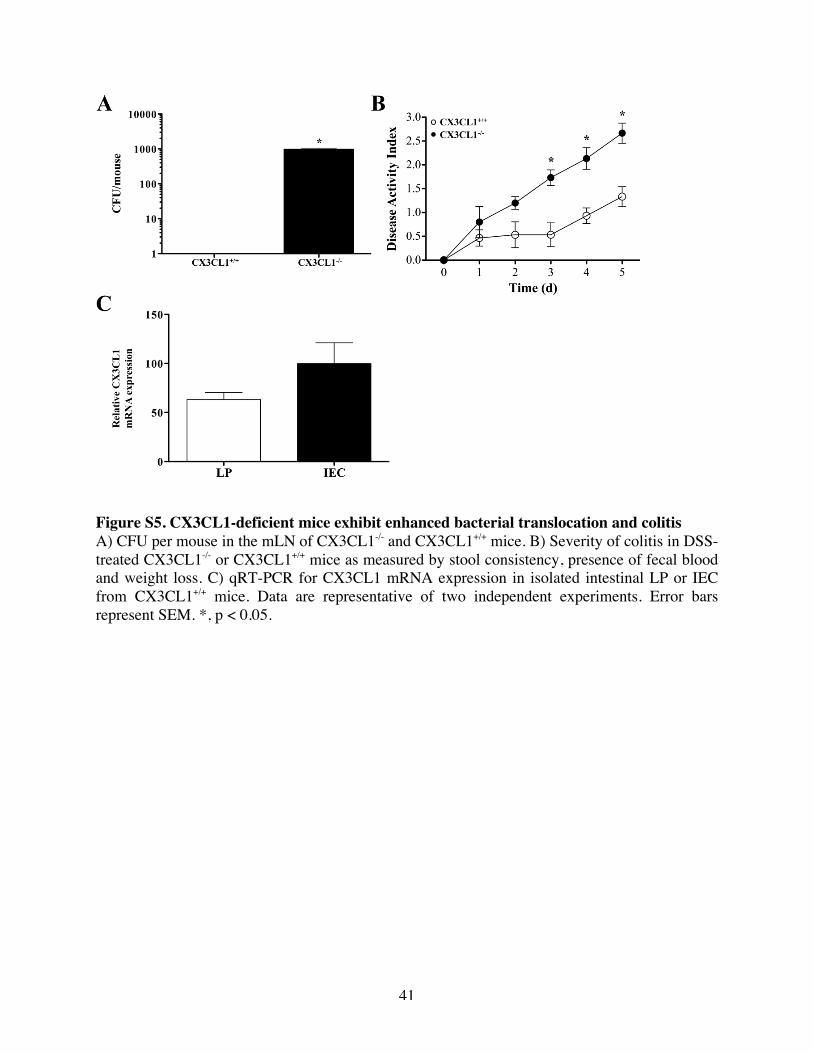
Figure S5. CX3CL1-deficient mice exhibit enhanced bacterial translocation and colitis A) CFU per mouse in the mLN of CX3CL1-/- and CX3CL1+/+ mice. B) Severity of colitis in DSS-treated CX3CL1-/- or CX3CL1+/+ mice as measured by stool consistency, presence of fecal blood and weight loss. C) qRT-PCR for CX3CL1 mRNA expression in isolated intestinal LP or IEC from CX3CL1+/+ mice. Data are representative of two independent experiments. Error bars represent SEM. *, p < 0.05.
42
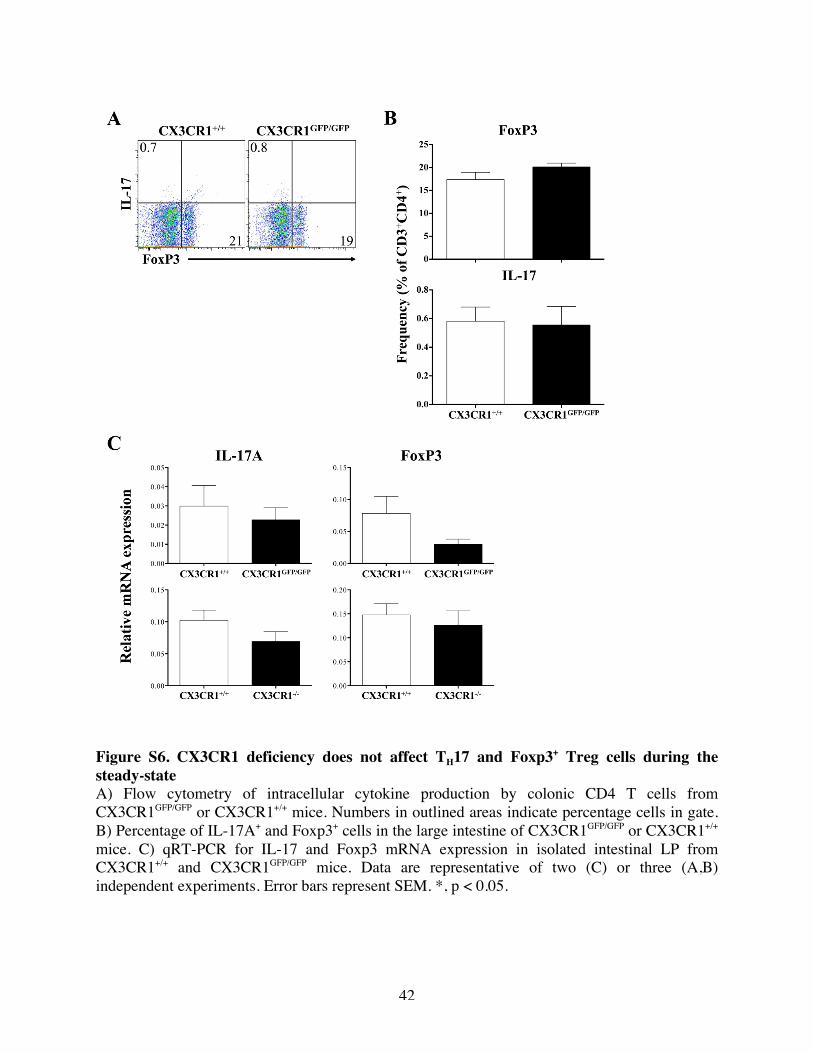
Figure S6. CX3CR1 deficiency does not affect TH17 and Foxp3+ Treg cells during the steady-state A) Flow cytometry of intracellular cytokine production by colonic CD4 T cells from CX3CR1GFP/GFP or CX3CR1+/+ mice. Numbers in outlined areas indicate percentage cells in gate. B) Percentage of IL-17A+ and Foxp3+ cells in the large intestine of CX3CR1GFP/GFP or CX3CR1+/+ mice. C) qRT-PCR for IL-17 and Foxp3 mRNA expression in isolated intestinal LP from CX3CR1+/+ and CX3CR1GFP/GFP mice. Data are representative of two (C) or three (A,B) independent experiments. Error bars represent SEM. *, p < 0.05.
43
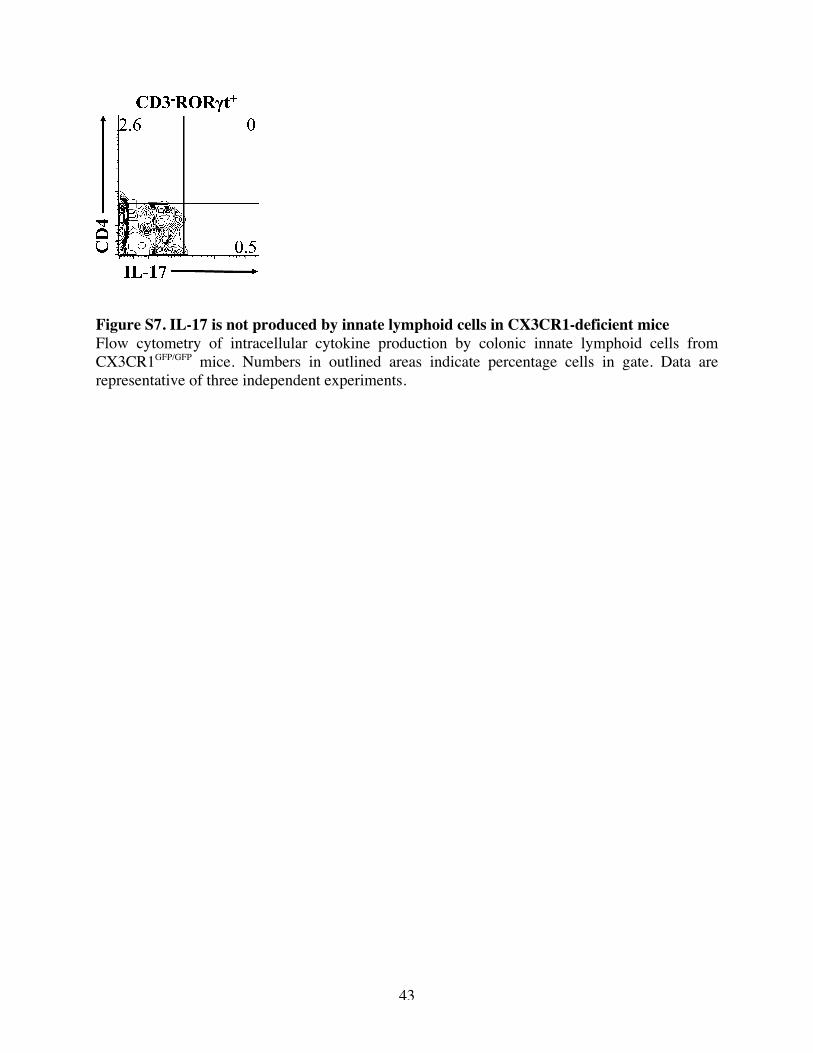
Figure S7. IL-17 is not produced by innate lymphoid cells in CX3CR1-deficient mice Flow cytometry of intracellular cytokine production by colonic innate lymphoid cells from CX3CR1GFP/GFP mice. Numbers in outlined areas indicate percentage cells in gate. Data are representative of three independent experiments.
44
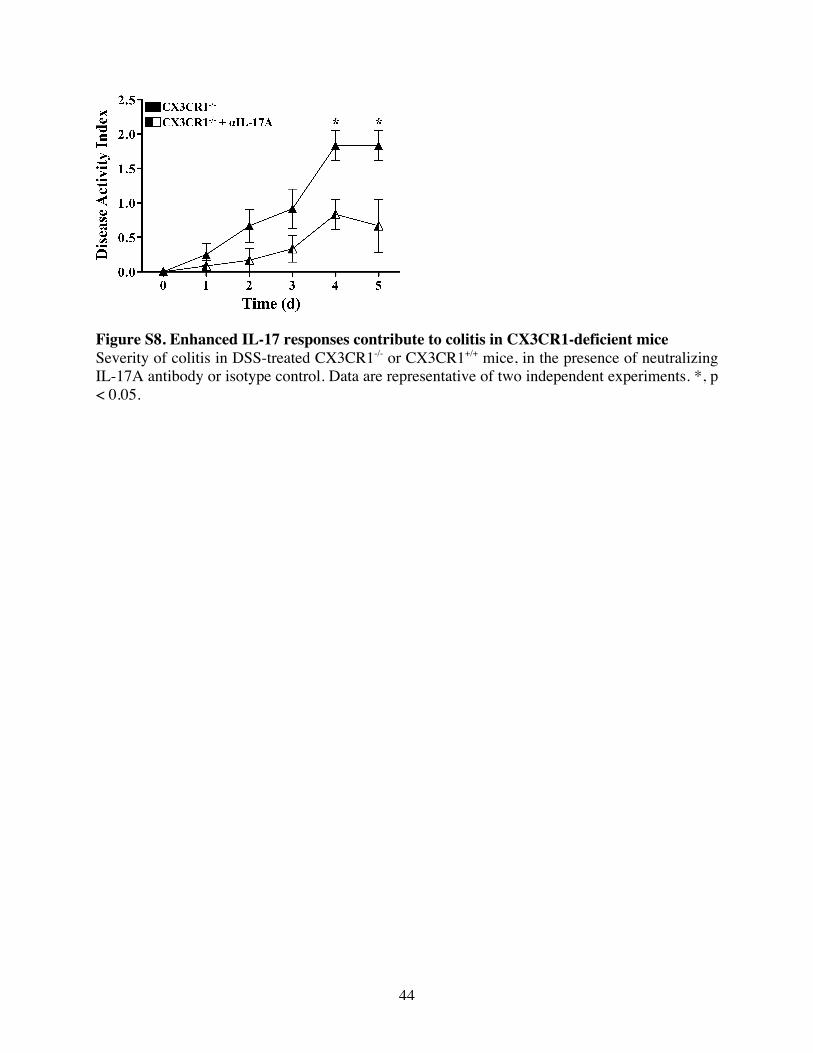
Figure S8. Enhanced IL-17 responses contribute to colitis in CX3CR1-deficient mice Severity of colitis in DSS-treated CX3CR1-/- or CX3CR1+/+ mice, in the presence of neutralizing IL-17A antibody or isotype control. Data are representative of two independent experiments. *, p < 0.05.
45
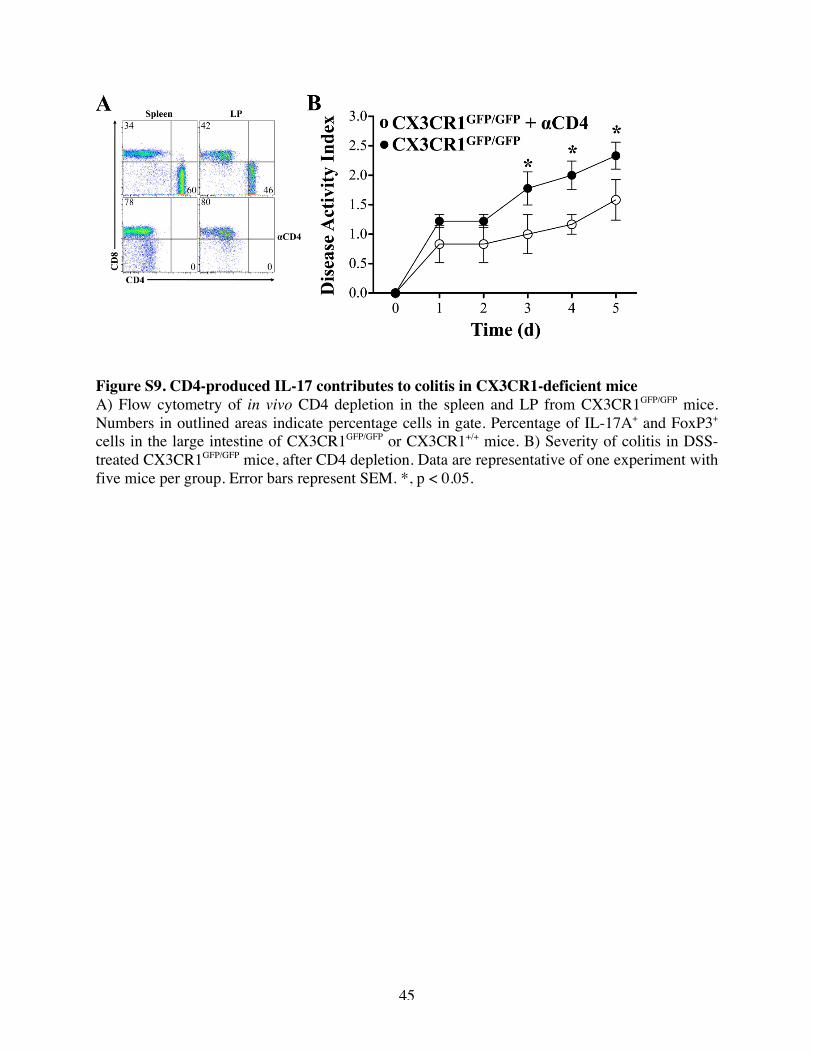
Figure S9. CD4-produced IL-17 contributes to colitis in CX3CR1-deficient mice A) Flow cytometry of in vivo CD4 depletion in the spleen and LP from CX3CR1GFP/GFP mice. Numbers in outlined areas indicate percentage cells in gate. Percentage of IL-17A+ and FoxP3+ cells in the large intestine of CX3CR1GFP/GFP or CX3CR1+/+ mice. B) Severity of colitis in DSS-treated CX3CR1GFP/GFP mice, after CD4 depletion. Data are representative of one experiment with five mice per group. Error bars represent SEM. *, p < 0.05.
46
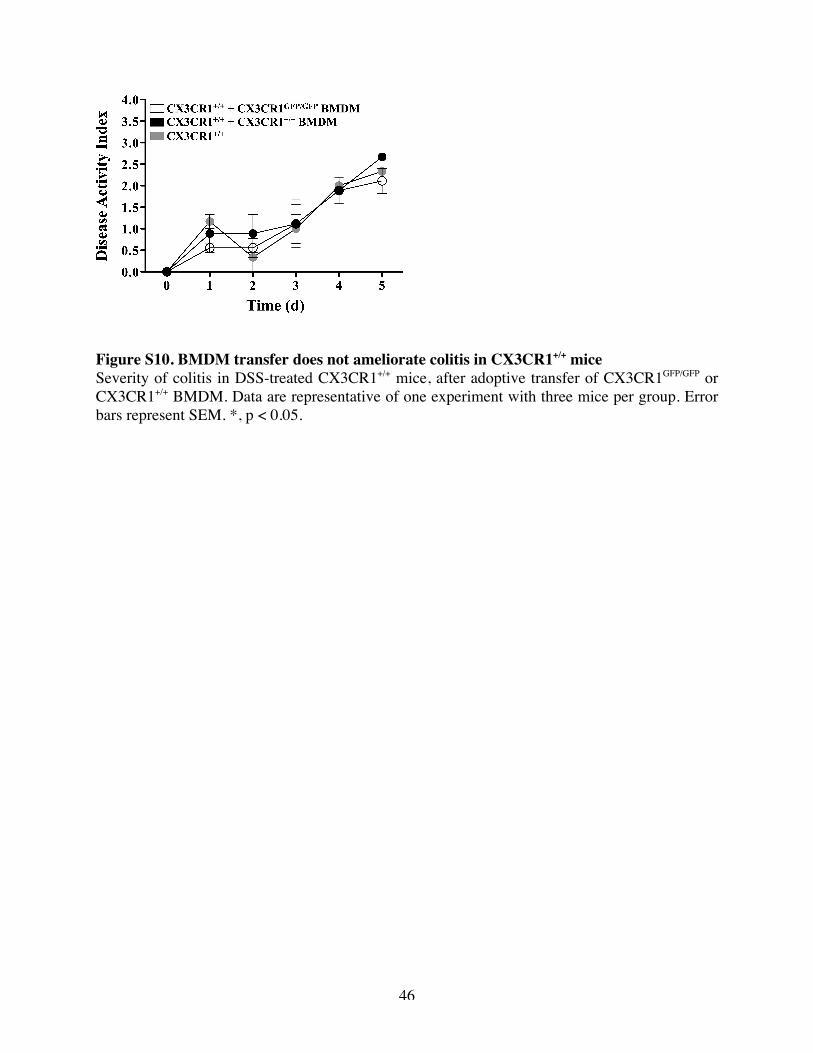
Figure S10. BMDM transfer does not ameliorate colitis in CX3CR1+/+ mice Severity of colitis in DSS-treated CX3CR1+/+ mice, after adoptive transfer of CX3CR1GFP/GFP or CX3CR1+/+ BMDM. Data are representative of one experiment with three mice per group. Error bars represent SEM. *, p < 0.05.
47
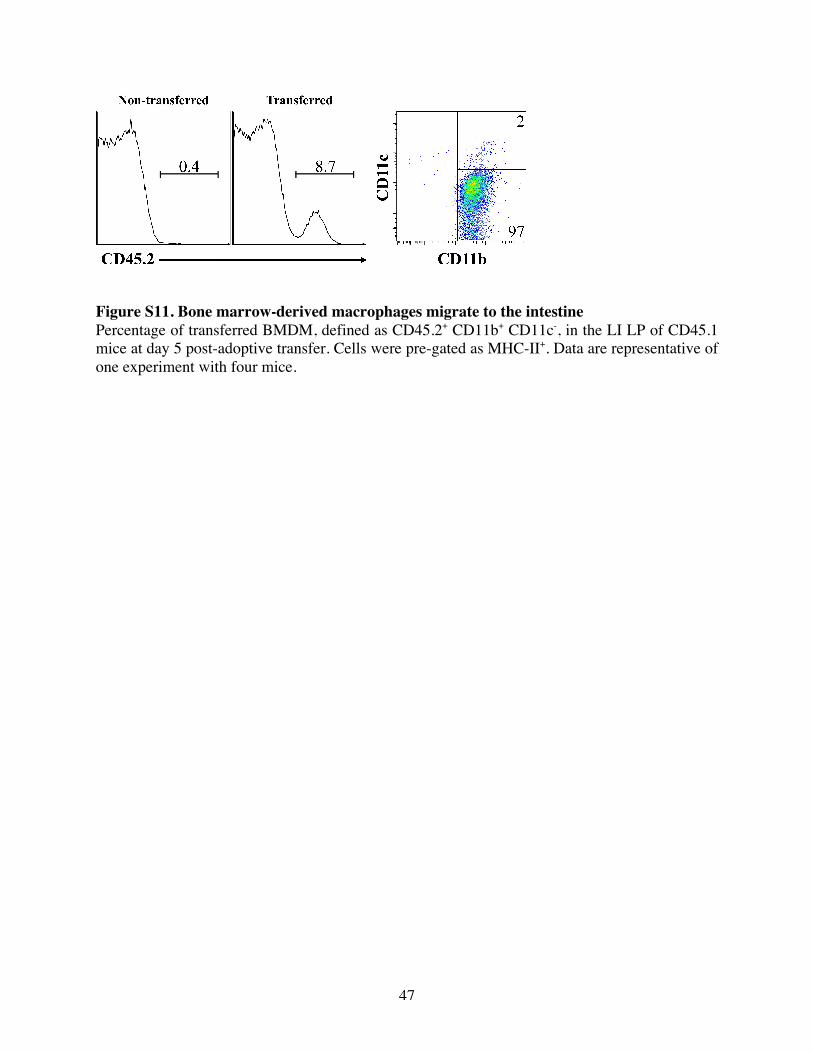
Figure S11. Bone marrow-derived macrophages migrate to the intestine Percentage of transferred BMDM, defined as CD45.2+ CD11b+ CD11c-, in the LI LP of CD45.1 mice at day 5 post-adoptive transfer. Cells were pre-gated as MHC-II+. Data are representative of one experiment with four mice.