α-Catenin homodimers are recruited to phosphoinositide...
17
JCB JCB: Article THE JOURNAL OF CELL BIOLOGY 3767 The Rockefeller University Press J. Cell Biol. Vol. 216 No. 11 3767–3783 https://doi.org/10.1083/jcb.201612006 Introduction The cadherin–catenin adhesive complex is widely viewed as an important regulator of intercellular interactions. One challenge of studying this system is that adherens junction linkage com- ponents (i.e., catenins) can also localize to other parts of the cell, where they carry out distinct, “extrajunctional” functions. For example, p120 and β-catenin are not only important for ad- hesion but are critical cofactors for DNA-binding proteins that direct Wnt-activated cell fate decisions (McCrea and Gottardi, 2016). Thus, interpretation of catenin knockout studies are con- founded by their multifunctionality, particularly given that they often engage both signaling and adhesive machinery via over- lapping binding surfaces (McCrea et al., 2015). A similar problem exists for understanding the roles of α-catenin (αCat), a filamentous F-actin–binding protein found as both junctional and extrajunctional forms (Schneider et al., 1993; Benjamin et al., 2010). αCat bound to the cadherin– catenin complex functions as a force-activated F-actin–binding protein (Buckley et al., 2014), while the epithelial isoform of αCat also exists as extrajunctional αCat in the cytosol and nucleus, where the cytoskeletal and signaling roles for αCat monomer, homodimer, and heterodimer (with β-catenin) are just emerging (Stewart and Nelson, 1997; Benjamin et al., 2010; Daugherty et al., 2014). Because αCat homodimerization is structurally incompatible with β-catenin binding (Koslov et al., 1997; Obama and Ozawa, 1997) and purified recombinant αCat homodimers show better binding to F-actin than mono- meric αCat in solution (Drees et al., 2005), it was reasoned that extrajunctional αCat homodimers might serve a distinct, F-actin–regulating function. However, full understanding of this functional pool remains limited. Indeed, extrajunctional αCat can suppress in vitro actin assembly mediated by the branching protein Arp2/3 (Drees et al., 2005), possibly by A unique feature of α-catenin localized outside the cadherin–catenin complex is its capacity to form homodimers, but the subcellular localization and functions of this form of α-catenin remain incompletely understood. We identified a cadherin-free form of α-catenin that is recruited to the leading edge of migrating cells in a phosphatidylinositol 3-kinase– dependent manner. Surface plasmon resonance analysis shows that α-catenin homodimers, but not monomers, selec- tively bind phosphatidylinositol-3,4,5-trisphosphate–containing lipid vesicles with high affinity, where three basic residues, K488, K493, and R496, contribute to binding. Chemical-induced dimerization of α-catenin containing a synthetic dimerization domain promotes its accumulation within lamellipodia and elaboration of protrusions with ex- tended filopodia, which are attenuated in the α-catenin KKR<3A mutant. Cells restored with a full-length, natively homodi- merizing form of α-catenin KKR<3A display reduced membrane recruitment, altered epithelial sheet migrations, and weaker cell–cell adhesion compared with WT α-catenin. These findings show that α-catenin homodimers are recruited to phosphoinositide-activated membranes to promote adhesion and migration, suggesting that phosphoinositide binding may be a defining feature of α-catenin function outside the cadherin–catenin complex. α-Catenin homodimers are recruited to phosphoinositide-activated membranes to promote adhesion Megan N. Wood, 1,4 Noboru Ishiyama, 5 * Indira Singaram, 7 * Connie M. Chung, 1 Annette S. Flozak, 1 Alex Yemelyanov, 1,3 Mitsu Ikura, 5,6 Wonhwa Cho, 7,8 and Cara J. Gottardi 1,2 1 Department of Medicine, 2 Department of Cellular and Molecular Biology, 3 Department of Chemistry of Life Processes, and 4 The Driskill Graduate Training Program in Life Sciences, Northwestern University, Feinberg School of Medicine, Chicago, IL 5 Princess Margaret Cancer Centre, University Health Network and 6 Division of Signaling Biology, Ontario Cancer Institute, University of Toronto, Toronto, ON, Canada 7 Department of Chemistry, University of Illinois at Chicago, Chicago, IL 8 Department of Genetic Engineering, Kyung Hee University, Yongin, Republic of Korea © 2017 Wood et al. This article is distributed under the terms of an Attribution–Noncommercial– Share Alike–No Mirror Sites license for the first six months after the publication date (see http://www.rupress.org/terms/). After six months it is available under a Creative Commons License (Attribution–Noncommercial–Share Alike 4.0 International license, as described at https://creativecommons.org/licenses/by-nc-sa/4.0/). *N. Ishiyama and I. Singaram contributed equally to this paper. Correspondence to Cara J. Gottardi: [email protected] Abbreviations used: αCat, α-catenin; BN-PAGE, blue native PAGE; BR, biolog- ical replicate; CCD, charge-coupled device; FOV, field of view; PI3K, phos- phatidylinositol 3-kinase; PIP 2 , phosphatidylinositol-4,5-bisphosphate; PIP 3 , phosphatidylinositol-3,4,5-trisphosphate; POPC, 1-palmitoyl-2-oleoyl-sn-glycero- 3-phosphocholine; POPS, 1-palmitoyl-2-oleoyl-sn-glycero-3-phosphoserine; RU, resonance units; SPR, surface plasmon resonance; TIRF, total internal reflection fluorescence. on January 5, 2018 jcb.rupress.org Downloaded from http://doi.org/10.1083/jcb.201612006 Supplemental material can be found at:
Transcript of α-Catenin homodimers are recruited to phosphoinositide...
JCB
JCB: ArticleT
HE
JO
UR
NA
L O
F C
EL
L B
IOL
OG
Y
3767
The Rockefeller University Press J. Cell Biol. Vol. 216 No. 11 3767–3783https://doi.org/10.1083/jcb.201612006
Introduction
The cadherin–catenin adhesive complex is widely viewed as an important regulator of intercellular interactions. One challenge of studying this system is that adherens junction linkage com-ponents (i.e., catenins) can also localize to other parts of the cell, where they carry out distinct, “extrajunctional” functions. For example, p120 and β-catenin are not only important for ad-hesion but are critical cofactors for DNA-binding proteins that direct Wnt-activated cell fate decisions (McCrea and Gottardi, 2016). Thus, interpretation of catenin knockout studies are con-founded by their multifunctionality, particularly given that they often engage both signaling and adhesive machinery via over-lapping binding surfaces (McCrea et al., 2015).
A similar problem exists for understanding the roles of α-catenin (αCat), a filamentous F-actin–binding protein found
as both junctional and extrajunctional forms (Schneider et al., 1993; Benjamin et al., 2010). αCat bound to the cadherin– catenin complex functions as a force-activated F-actin–binding protein (Buckley et al., 2014), while the epithelial isoform of αCat also exists as extrajunctional αCat in the cytosol and nucleus, where the cytoskeletal and signaling roles for αCat monomer, homodimer, and heterodimer (with β-catenin) are just emerging (Stewart and Nelson, 1997; Benjamin et al., 2010; Daugherty et al., 2014). Because αCat homodimerization is structurally incompatible with β-catenin binding (Koslov et al., 1997; Obama and Ozawa, 1997) and purified recombinant αCat homodimers show better binding to F-actin than mono-meric αCat in solution (Drees et al., 2005), it was reasoned that extrajunctional αCat homodimers might serve a distinct, F-actin–regulating function. However, full understanding of this functional pool remains limited. Indeed, extrajunctional αCat can suppress in vitro actin assembly mediated by the branching protein Arp2/3 (Drees et al., 2005), possibly by
A unique feature of α-catenin localized outside the cadherin–catenin complex is its capacity to form homodimers, but the subcellular localization and functions of this form of α-catenin remain incompletely understood. We identified a cadherin-free form of α-catenin that is recruited to the leading edge of migrating cells in a phosphatidylinositol 3-kinase–dependent manner. Surface plasmon resonance analysis shows that α-catenin homodimers, but not monomers, selec-tively bind phosphatidylinositol-3,4,5-trisphosphate–containing lipid vesicles with high affinity, where three basic residues, K488, K493, and R496, contribute to binding. Chemical-induced dimerization of α-catenin containing a synthetic dimerization domain promotes its accumulation within lamellipodia and elaboration of protrusions with ex-tended filopodia, which are attenuated in the α-cateninKKR<3A mutant. Cells restored with a full-length, natively homodi-merizing form of α-cateninKKR<3A display reduced membrane recruitment, altered epithelial sheet migrations, and weaker cell–cell adhesion compared with WT α-catenin. These findings show that α-catenin homodimers are recruited to phosphoinositide-activated membranes to promote adhesion and migration, suggesting that phosphoinositide binding may be a defining feature of α-catenin function outside the cadherin–catenin complex.
α-Catenin homodimers are recruited to phosphoinositide-activated membranes to promote adhesion
Megan N. Wood,1,4 Noboru Ishiyama,5* Indira Singaram,7* Connie M. Chung,1 Annette S. Flozak,1 Alex Yemelyanov,1,3 Mitsu Ikura,5,6 Wonhwa Cho,7,8 and Cara J. Gottardi1,2
1Department of Medicine, 2Department of Cellular and Molecular Biology, 3Department of Chemistry of Life Processes, and 4The Driskill Graduate Training Program in Life Sciences, Northwestern University, Feinberg School of Medicine, Chicago, IL
5Princess Margaret Cancer Centre, University Health Network and 6Division of Signaling Biology, Ontario Cancer Institute, University of Toronto, Toronto, ON, Canada7Department of Chemistry, University of Illinois at Chicago, Chicago, IL8Department of Genetic Engineering, Kyung Hee University, Yongin, Republic of Korea
© 2017 Wood et al. This article is distributed under the terms of an Attribution–Noncommercial–Share Alike–No Mirror Sites license for the first six months after the publication date (see http ://www .rupress .org /terms /). After six months it is available under a Creative Commons License (Attribution–Noncommercial–Share Alike 4.0 International license, as described at https ://creativecommons .org /licenses /by -nc -sa /4 .0 /).
*N. Ishiyama and I. Singaram contributed equally to this paper.Correspondence to Cara J. Gottardi: [email protected] used: αCat, α-catenin; BN-PAGE, blue native PAGE; BR, biolog-ical replicate; CCD, charge-coupled device; FOV, field of view; PI3K, phos-phatidylinositol 3-kinase; PIP2, phosphatidylinositol-4,5-bisphosphate; PIP3, phosphatidylinositol-3,4,5-trisphosphate; POPC, 1-palmitoyl-2-oleoyl-sn-glycero- 3-phosphocholine; POPS, 1-palmitoyl-2-oleoyl-sn-glycero-3-phosphoserine; RU, resonance units; SPR, surface plasmon resonance; TIRF, total internal reflection fluorescence.
on January 5, 2018jcb.rupress.org
Dow
nloaded from
http://doi.org/10.1083/jcb.201612006Supplemental material can be found at:
JCB • Volume 216 • NumBer 11 • 20173768
competitive binding to actin filaments (Hansen et al., 2013), as well as antagonize lamellipodial activity in cells (Benjamin et al., 2010). However, these studies have not addressed the spe-cific contribution of αCat homodimerization to these activities or epithelial cell behaviors. Although the relatively high Kd of αCat homodimers (25–73 µM; Ishiyama et al., 2013; Pokutta et al., 2014) with respect to the estimated concentration of cyto-solic αCat in cells (0.6 µM; Drees et al., 2005; Yamada et al., 2005) raises the possibility that a mechanism to increase the local concentration of αCat may be required to favor homod-imerization in vivo, evidence that homodimer dissociation is kinetically blocked (Pokutta et al., 2014) could offset the need for a concentration mechanism. Nonetheless, the structural con-straints of αCat homodimers clearly dictate a function outside the cadherin–catenin complex, but how and where this form of αCat is generated in the cell remain unknown.
Although αCat homodimerization is a conserved feature in Drosophila melanogaster, albeit not all αCats (Kwiatkowski et al., 2010; Dickinson et al., 2011; Desai et al., 2013; Miller et al., 2013), there are currently no minimal mutations that separate αCat heterodimerization with β-catenin from αCat homodimerization to generate a form of αCat that specifically lacks homodimer function, while sparing αCat binding to the cadherin–catenin complex. In this study, we make use of a pan- cadherin null cell line and a chemical-induced dimerization system to define the localization of extrajunctional αCat and function of αCat homodimers in epithelial cells. We also show that αCat contains a region of positively charged residues that contributes to phosphoinositide-dependent membrane recruit-ment and processes important for cell–cell adhesion.
Results
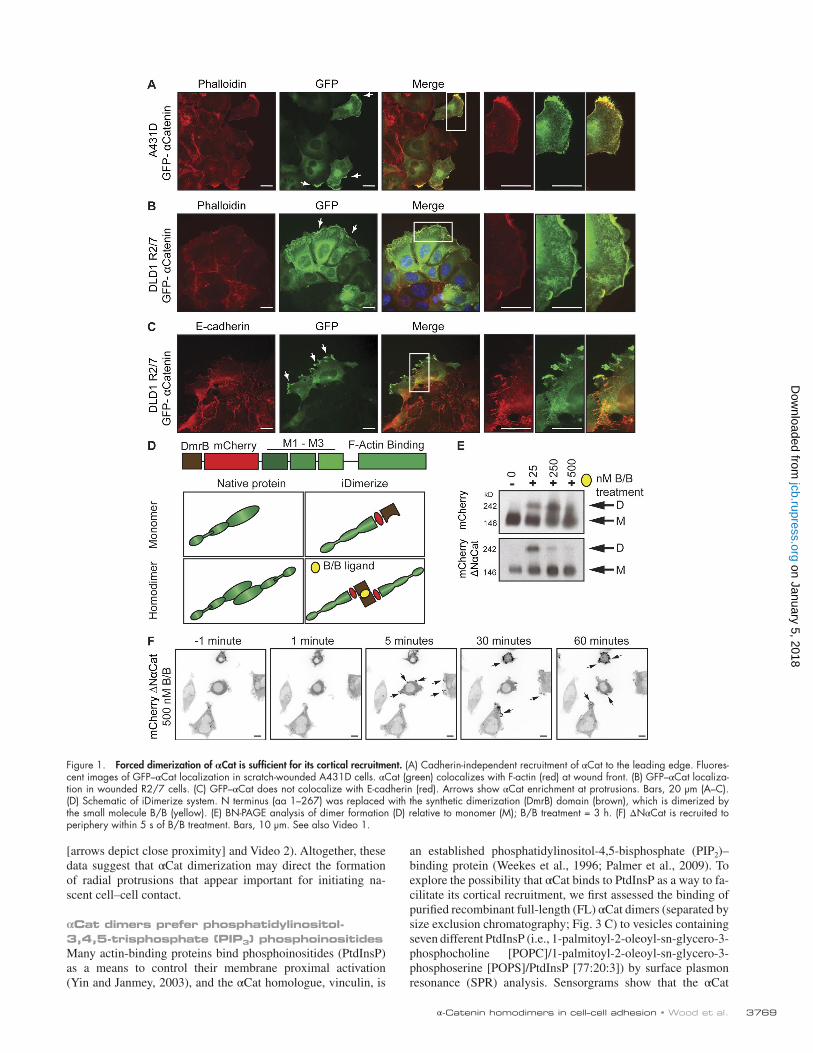
Cadherin-independent mechanism of αCat membrane recruitmentTo visualize the properties of αCat outside of the cadherin– catenin complex, we took advantage of an established cell line (epidermoid A431D carcinoma cells) that completely lacks cadherins and detectable catenins (Lewis et al., 1997). Stable expression of GFP–αCat in scratch-wounded A431D cells re-vealed its recruitment to the leading edge of the wound front (Fig. 1 A), a phenomenon that was also observed in GFP–αCat–restored R2/7 cells, a DLD1 human colon cancer variant that ex-presses E-cadherin and β-catenin but lacks αCat expression and functional adhesions (van Hengel et al., 1997; Watabe-Uchida et al., 1998; Fig. 1, B and C). This pool of αCat colocalized with F-actin (Fig. 1, A and B) but not E-cadherin (Fig. 1 C), suggesting that F-actin may be a key functional target of extra-junctional αCat in cells.
Forced dimerization of αCat promotes its cortical recruitmentBecause αCat homodimerization is thought to be a defining feature of extrajunctional αCat, we sought to assess the unique contributions of αCat homodimerization to its cellular localiza-tion and function. Toward this end, we used a temporal and re-versible system to chemically induce homodimerization of the cytosolic pool of αCat (Fig. 1 D). We induced αCat homodimers by replacing the native, αCat N-terminal domain with the DmrB dimerization domain (iDimerize system, depicted in brown), which can be temporally controlled with a small bidentate ligand
(B/B, depicted as a yellow oval) and reversed by a monodentate washout ligand (Belshaw et al., 1996; mCherry-Dmr-ΔNαCat, hereafter referred to as ΔNαCat; Fig. 1 D). This deletion was required to prevent both the native homodimerization of αCat and its recruitment to and function within the cadherin–catenin complex. By replacing this region with the DmrB dimerization domain, we ensured that αCat dimerization function was driven exclusively by the Dmr domain and B/B ligand. Because αCat lacking the N-terminal domain largely rescues cell–cell adhe-sion (Kadowaki et al., 1994; Imamura et al., 1999) and Dro-sophila embryogenesis when fused directly to the E-cadherin cytoplasmic domain (Desai et al., 2013), we reasoned that the ΔNαCat construct constituted the best way to begin assessing the contributions of extrajunctional αCat homodimers to F-actin organization and cell behaviors.
An mCherry-DmrB (hereafter referred to as mCherry) construct served as a control to verify that observed phenotypes were not due to the presence of the DmrB domain, mCherry tag, or dimerization ligands. We expressed mCherry or ΔNαCat in R2/7 DLD1 cells. Immunoblot analysis confirmed that ΔNαCat is expressed similarly to mCherry-tagged FLαCat (Fig. S1 A), and coimmunoprecipitation confirmed that ΔNαCat does not as-sociate with the cadherin–catenin complex (Fig. S1 B). Analysis of these constructs by blue native PAGE (BN-PAGE) demon-strated B/B dose–dependent formation of dimers (Fig. 1 E). Although the ΔNαCat construct did not appear to dimerize as efficiently as mCherry, we speculate that some of the ΔNαCat is underrepresented because of dimer-dependent interactions that impede its mobility by native gel analysis. With this system, we found that forced dimerization of ΔNαCat promoted its recruit-ment to cell protrusions within 5 min (Video 1 and Fig. 1 F). These data suggest that homodimerization of αCat is largely sufficient to control its cortical localization in cells.
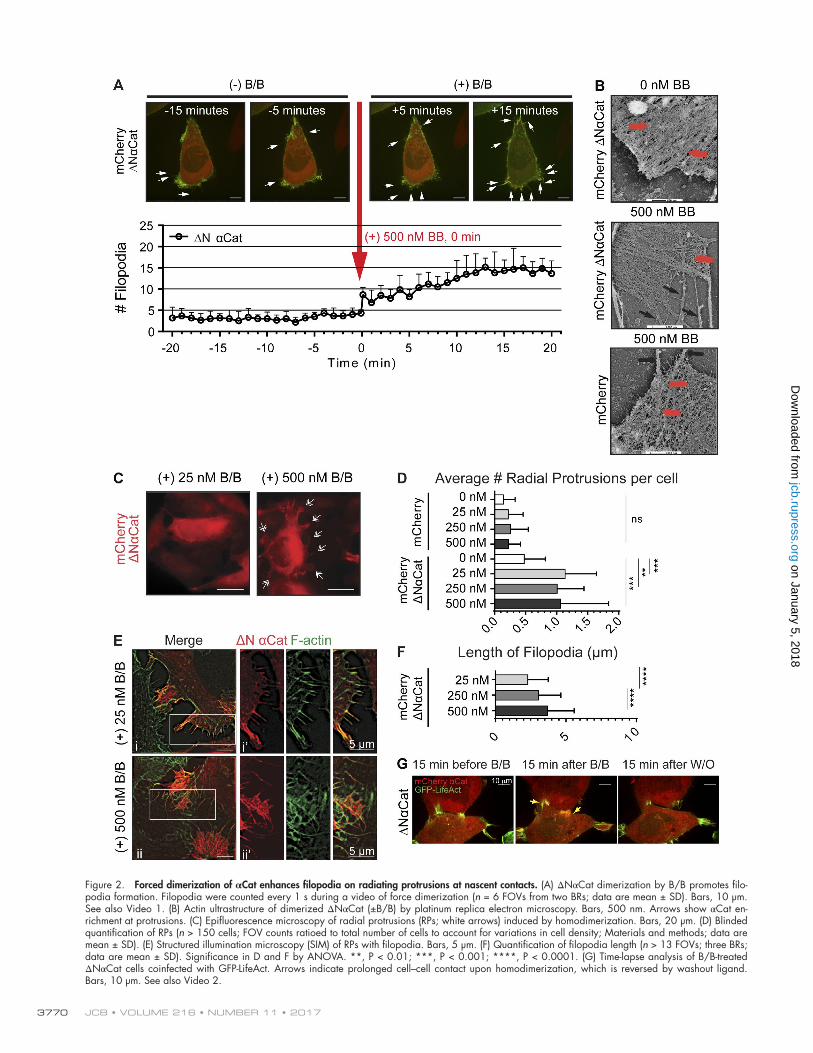
Forced dimerization of αCat promotes formation of filopodia and radiating protrusions at nascent contactsTo assess the unique contributions of αCat homodimerization to actin organization and function, we performed live-cell imaging in ΔNαCat cells coinfected with GFP-LifeAct. αCat forced di-mers were rapidly recruited to the cell periphery as a function of B/B dimerization ligand, where we also observed the formation of prominent filopodia (Video 1 and Fig. 2 A). Filopodia abun-dance reached a maximum of 12–15 min after drug treatment. Changes in actin density were also apparent at the ultrastructural level using platinum replica electron microscopy (Fig. 2 B).
Although these studies reveal how αCat forced dimers could acutely affect F-actin organization in single cells, we also sought to determine the consequences of αCat forced dimeriza-tion during more sustained drug incubation times (3–15 h) in the context of cells proximal to neighbors. Under these con-ditions, we observed the formation of “radial protrusions,” structures with a broad lamellipodial base and radiating filopo-dia at nascent cell-cell contacts (Fig. 2, C and D). Importantly, the length of the filopodia directly correlated with the dose of B/B (Fig. 2, E and F). Because recent studies implicated filo-podial protrusions as being important for cell–cell formation (Mattila and Lappalainen, 2008; Hoelzle and Svitkina, 2012) and compaction (Fierro-González et al., 2013), we wondered whether these protrusions enhanced cell–cell contact. Indeed, the B/B ligand promoted close cell–cell contact in ΔNαCat cells and was fully reversible with the washout ligand (Fig. 2 G
on January 5, 2018jcb.rupress.org
Dow
nloaded from
α-Catenin homodimers in cell–cell adhesion • Wood et al. 3769
[arrows depict close proximity] and Video 2). Altogether, these data suggest that αCat dimerization may direct the formation of radial protrusions that appear important for initiating na-scent cell–cell contact.
αCat dimers prefer phosphatidylinositol-3,4,5-trisphosphate (PIP3) phosphoinositidesMany actin-binding proteins bind phosphoinositides (PtdInsP) as a means to control their membrane proximal activation (Yin and Janmey, 2003), and the αCat homologue, vinculin, is
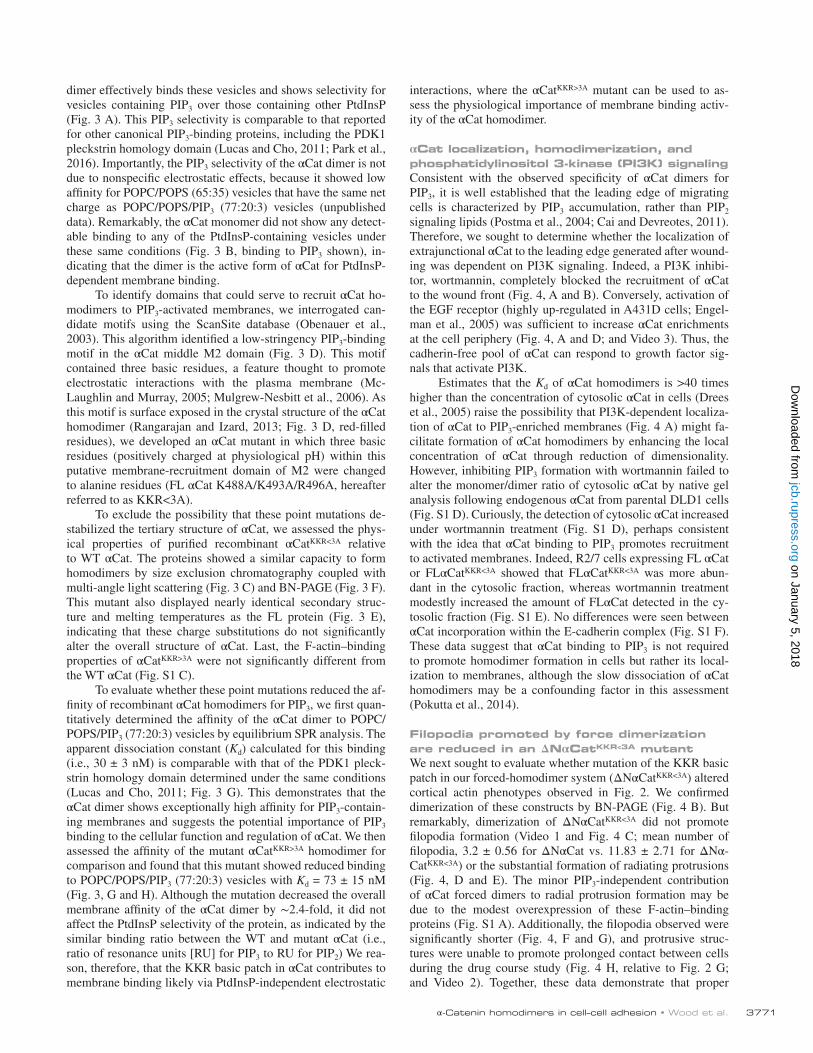
an established phosphatidylinositol-4,5-bisphosphate (PIP2)– binding protein (Weekes et al., 1996; Palmer et al., 2009). To explore the possibility that αCat binds to PtdInsP as a way to fa-cilitate its cortical recruitment, we first assessed the binding of purified recombinant full-length (FL) αCat dimers (separated by size exclusion chromatography; Fig. 3 C) to vesicles containing seven different PtdInsP (i.e., 1-palmitoyl-2-oleoyl-sn-glycero-3- phosphocholine [POPC]/1-palmitoyl-2-oleoyl-sn-glycero-3- phosphoserine [POPS]/PtdInsP [77:20:3]) by surface plasmon resonance (SPR) analysis. Sensorgrams show that the αCat
Figure 1. Forced dimerization of αCat is sufficient for its cortical recruitment. (A) Cadherin-independent recruitment of αCat to the leading edge. Fluores-cent images of GFP–αCat localization in scratch-wounded A431D cells. αCat (green) colocalizes with F-actin (red) at wound front. (B) GFP–αCat localiza-tion in wounded R2/7 cells. (C) GFP–αCat does not colocalize with E-cadherin (red). Arrows show αCat enrichment at protrusions. Bars, 20 µm (A–C). (D) Schematic of iDimerize system. N terminus (aa 1–267) was replaced with the synthetic dimerization (DmrB) domain (brown), which is dimerized by the small molecule B/B (yellow). (E) BN-PAGE analysis of dimer formation (D) relative to monomer (M); B/B treatment = 3 h. (F) ΔNαCat is recruited to periphery within 5 s of B/B treatment. Bars, 10 µm. See also Video 1.
on January 5, 2018jcb.rupress.org
Dow
nloaded from
JCB • Volume 216 • NumBer 11 • 20173770
Figure 2. Forced dimerization of αCat enhances filopodia on radiating protrusions at nascent contacts. (A) ΔNαCat dimerization by B/B promotes filo-podia formation. Filopodia were counted every 1 s during a video of force dimerization (n = 6 FOVs from two BRs; data are mean ± SD). Bars, 10 µm. See also Video 1. (B) Actin ultrastructure of dimerized ΔNαCat (±B/B) by platinum replica electron microscopy. Bars, 500 nm. Arrows show αCat en-richment at protrusions. (C) Epifluorescence microscopy of radial protrusions (RPs; white arrows) induced by homodimerization. Bars, 20 µm. (D) Blinded quantification of RPs (n > 150 cells; FOV counts ratioed to total number of cells to account for variations in cell density; Materials and methods; data are mean ± SD). (E) Structured illumination microscopy (SIM) of RPs with filopodia. Bars, 5 µm. (F) Quantification of filopodia length (n > 13 FOVs; three BRs; data are mean ± SD). Significance in D and F by ANO VA. **, P < 0.01; ***, P < 0.001; ****, P < 0.0001. (G) Time-lapse analysis of B/B-treated ΔNαCat cells coinfected with GFP-LifeAct. Arrows indicate prolonged cell–cell contact upon homodimerization, which is reversed by washout ligand. Bars, 10 µm. See also Video 2.
on January 5, 2018jcb.rupress.org
Dow
nloaded from
α-Catenin homodimers in cell–cell adhesion • Wood et al. 3771
dimer effectively binds these vesicles and shows selectivity for vesicles containing PIP3 over those containing other PtdInsP (Fig. 3 A). This PIP3 selectivity is comparable to that reported for other canonical PIP3-binding proteins, including the PDK1 pleckstrin homology domain (Lucas and Cho, 2011; Park et al., 2016). Importantly, the PIP3 selectivity of the αCat dimer is not due to nonspecific electrostatic effects, because it showed low affinity for POPC/POPS (65:35) vesicles that have the same net charge as POPC/POPS/PIP3 (77:20:3) vesicles (unpublished data). Remarkably, the αCat monomer did not show any detect-able binding to any of the PtdInsP-containing vesicles under these same conditions (Fig. 3 B, binding to PIP3 shown), in-dicating that the dimer is the active form of αCat for PtdInsP- dependent membrane binding.
To identify domains that could serve to recruit αCat ho-modimers to PIP3-activated membranes, we interrogated can-didate motifs using the ScanSite database (Obenauer et al., 2003). This algorithm identified a low-stringency PIP3-binding motif in the αCat middle M2 domain (Fig. 3 D). This motif contained three basic residues, a feature thought to promote electrostatic interactions with the plasma membrane (Mc-Laughlin and Murray, 2005; Mulgrew-Nesbitt et al., 2006). As this motif is surface exposed in the crystal structure of the αCat homodimer (Rangarajan and Izard, 2013; Fig. 3 D, red-filled residues), we developed an αCat mutant in which three basic residues (positively charged at physiological pH) within this putative membrane-recruitment domain of M2 were changed to alanine residues (FL αCat K488A/K493A/R496A, hereafter referred to as KKR<3A).
To exclude the possibility that these point mutations de-stabilized the tertiary structure of αCat, we assessed the phys-ical properties of purified recombinant αCatKKR<3A relative to WT αCat. The proteins showed a similar capacity to form homodimers by size exclusion chromatography coupled with multi-angle light scattering (Fig. 3 C) and BN-PAGE (Fig. 3 F). This mutant also displayed nearly identical secondary struc-ture and melting temperatures as the FL protein (Fig. 3 E), indicating that these charge substitutions do not significantly alter the overall structure of αCat. Last, the F-actin–binding properties of αCatKKR>3A were not significantly different from the WT αCat (Fig. S1 C).
To evaluate whether these point mutations reduced the af-finity of recombinant αCat homodimers for PIP3, we first quan-titatively determined the affinity of the αCat dimer to POPC/POPS/PIP3 (77:20:3) vesicles by equilibrium SPR analysis. The apparent dissociation constant (Kd) calculated for this binding (i.e., 30 ± 3 nM) is comparable with that of the PDK1 pleck-strin homology domain determined under the same conditions (Lucas and Cho, 2011; Fig. 3 G). This demonstrates that the αCat dimer shows exceptionally high affinity for PIP3-contain-ing membranes and suggests the potential importance of PIP3 binding to the cellular function and regulation of αCat. We then assessed the affinity of the mutant αCatKKR>3A homodimer for comparison and found that this mutant showed reduced binding to POPC/POPS/PIP3 (77:20:3) vesicles with Kd = 73 ± 15 nM (Fig. 3, G and H). Although the mutation decreased the overall membrane affinity of the αCat dimer by ∼2.4-fold, it did not affect the PtdInsP selectivity of the protein, as indicated by the similar binding ratio between the WT and mutant αCat (i.e., ratio of resonance units [RU] for PIP3 to RU for PIP2) We rea-son, therefore, that the KKR basic patch in αCat contributes to membrane binding likely via PtdInsP-independent electrostatic
interactions, where the αCatKKR>3A mutant can be used to as-sess the physiological importance of membrane binding activ-ity of the αCat homodimer.
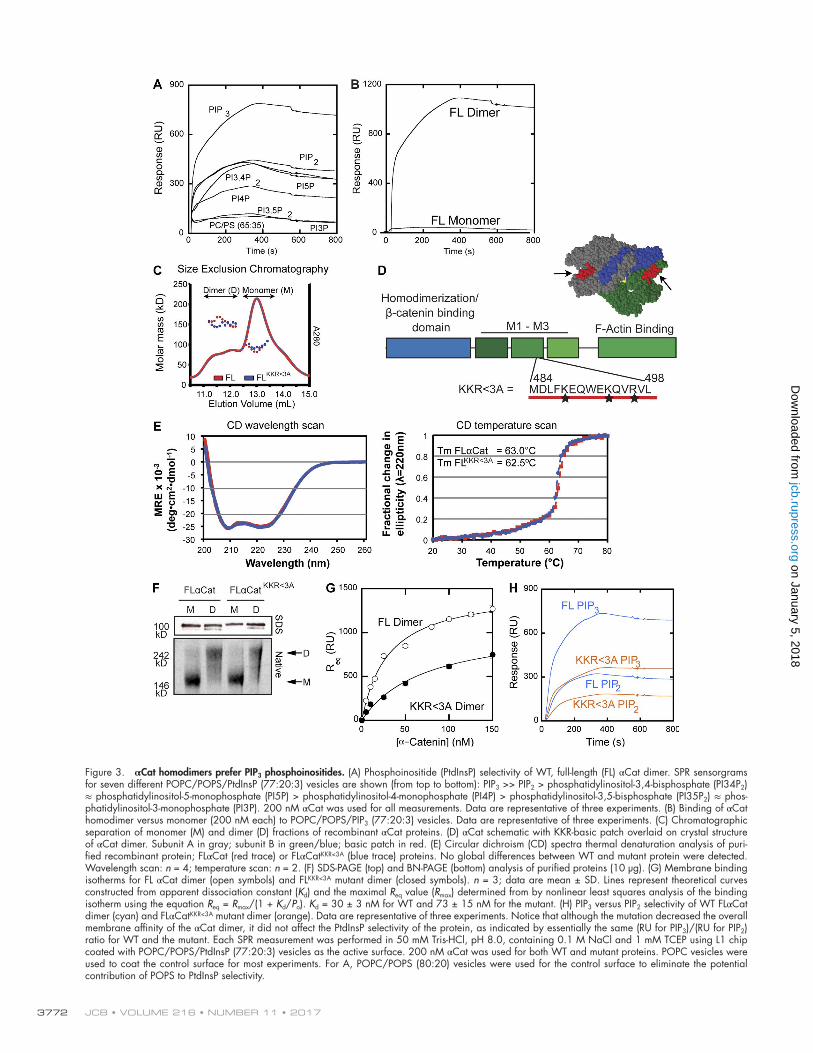
αCat localization, homodimerization, and phosphatidylinositol 3-kinase (PI3K) signalingConsistent with the observed specificity of αCat dimers for PIP3, it is well established that the leading edge of migrating cells is characterized by PIP3 accumulation, rather than PIP2 signaling lipids (Postma et al., 2004; Cai and Devreotes, 2011). Therefore, we sought to determine whether the localization of extrajunctional αCat to the leading edge generated after wound-ing was dependent on PI3K signaling. Indeed, a PI3K inhibi-tor, wortmannin, completely blocked the recruitment of αCat to the wound front (Fig. 4, A and B). Conversely, activation of the EGF receptor (highly up-regulated in A431D cells; Engel-man et al., 2005) was sufficient to increase αCat enrichments at the cell periphery (Fig. 4, A and D; and Video 3). Thus, the cadherin-free pool of αCat can respond to growth factor sig-nals that activate PI3K.
Estimates that the Kd of αCat homodimers is >40 times higher than the concentration of cytosolic αCat in cells (Drees et al., 2005) raise the possibility that PI3K-dependent localiza-tion of αCat to PIP3-enriched membranes (Fig. 4 A) might fa-cilitate formation of αCat homodimers by enhancing the local concentration of αCat through reduction of dimensionality. However, inhibiting PIP3 formation with wortmannin failed to alter the monomer/dimer ratio of cytosolic αCat by native gel analysis following endogenous αCat from parental DLD1 cells (Fig. S1 D). Curiously, the detection of cytosolic αCat increased under wortmannin treatment (Fig. S1 D), perhaps consistent with the idea that αCat binding to PIP3 promotes recruitment to activated membranes. Indeed, R2/7 cells expressing FL αCat or FLαCatKKR<3A showed that FLαCatKKR<3A was more abun-dant in the cytosolic fraction, whereas wortmannin treatment modestly increased the amount of FLαCat detected in the cy-tosolic fraction (Fig. S1 E). No differences were seen between αCat incorporation within the E-cadherin complex (Fig. S1 F). These data suggest that αCat binding to PIP3 is not required to promote homodimer formation in cells but rather its local-ization to membranes, although the slow dissociation of αCat homodimers may be a confounding factor in this assessment (Pokutta et al., 2014).
Filopodia promoted by force dimerization are reduced in an ΔNαCatKKR<3A mutantWe next sought to evaluate whether mutation of the KKR basic patch in our forced-homodimer system (ΔNαCatKKR<3A) altered cortical actin phenotypes observed in Fig. 2. We confirmed dimerization of these constructs by BN-PAGE (Fig. 4 B). But remarkably, dimerization of ΔNαCatKKR<3A did not promote filopodia formation (Video 1 and Fig. 4 C; mean number of filopodia, 3.2 ± 0.56 for ΔNαCat vs. 11.83 ± 2.71 for ΔNα-CatKKR<3A) or the substantial formation of radiating protrusions (Fig. 4, D and E). The minor PIP3-independent contribution of αCat forced dimers to radial protrusion formation may be due to the modest overexpression of these F-actin–binding proteins (Fig. S1 A). Additionally, the filopodia observed were significantly shorter (Fig. 4, F and G), and protrusive struc-tures were unable to promote prolonged contact between cells during the drug course study (Fig. 4 H, relative to Fig. 2 G; and Video 2). Together, these data demonstrate that proper
on January 5, 2018jcb.rupress.org
Dow
nloaded from
JCB • Volume 216 • NumBer 11 • 20173772
Figure 3. αCat homodimers prefer PIP3 phosphoinositides. (A) Phosphoinositide (PtdInsP) selectivity of WT, full-length (FL) αCat dimer. SPR sensorgrams for seven different POPC/POPS/PtdInsP (77:20:3) vesicles are shown (from top to bottom): PIP3 >> PIP2 > phosphatidylinositol-3,4-bisphosphate (PI34P2) ≈ phosphatidylinositol-5-monophosphate (PI5P) > phosphatidylinositol-4-monophosphate (PI4P) > phosphatidylinositol-3,5-bisphosphate (PI35P2) ≈ phos-phatidylinositol-3-monophosphate (PI3P). 200 nM αCat was used for all measurements. Data are representative of three experiments. (B) Binding of αCat homodimer versus monomer (200 nM each) to POPC/POPS/PIP3 (77:20:3) vesicles. Data are representative of three experiments. (C) Chromatographic separation of monomer (M) and dimer (D) fractions of recombinant αCat proteins. (D) αCat schematic with KKR-basic patch overlaid on crystal structure of αCat dimer. Subunit A in gray; subunit B in green/blue; basic patch in red. (E) Circular dichroism (CD) spectra thermal denaturation analysis of puri-fied recombinant protein; FLαCat (red trace) or FLαCatKKR<3A (blue trace) proteins. No global differences between WT and mutant protein were detected. Wavelength scan: n = 4; temperature scan: n = 2. (F) SDS-PAGE (top) and BN-PAGE (bottom) analysis of purified proteins (10 µg). (G) Membrane binding isotherms for FL αCat dimer (open symbols) and FLKKR<3A mutant dimer (closed symbols). n = 3; data are mean ± SD. Lines represent theoretical curves constructed from apparent dissociation constant (Kd) and the maximal Req value (Rmax) determined from by nonlinear least squares analysis of the binding isotherm using the equation Req = Rmax/(1 + Kd/Po). Kd = 30 ± 3 nM for WT and 73 ± 15 nM for the mutant. (H) PIP3 versus PIP2 selectivity of WT FLαCat dimer (cyan) and FLαCatKKR<3A mutant dimer (orange). Data are representative of three experiments. Notice that although the mutation decreased the overall membrane affinity of the αCat dimer, it did not affect the PtdInsP selectivity of the protein, as indicated by essentially the same (RU for PIP3)/(RU for PIP2) ratio for WT and the mutant. Each SPR measurement was performed in 50 mM Tris-HCl, pH 8.0, containing 0.1 M NaCl and 1 mM TCEP using L1 chip coated with POPC/POPS/PtdInsP (77:20:3) vesicles as the active surface. 200 nM αCat was used for both WT and mutant proteins. POPC vesicles were used to coat the control surface for most experiments. For A, POPC/POPS (80:20) vesicles were used for the control surface to eliminate the potential contribution of POPS to PtdInsP selectivity.
on January 5, 2018jcb.rupress.org
Dow
nloaded from
α-Catenin homodimers in cell–cell adhesion • Wood et al. 3773
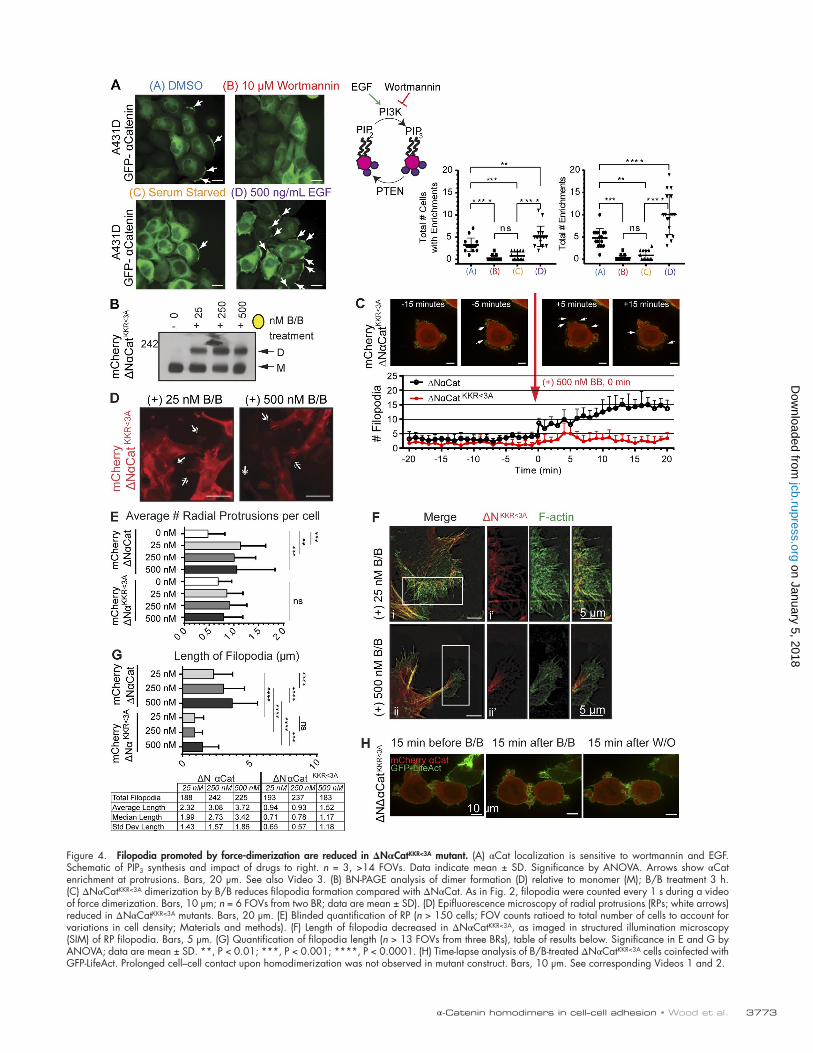
Figure 4. Filopodia promoted by force-dimerization are reduced in ΔNαCatKKR<3A mutant. (A) αCat localization is sensitive to wortmannin and EGF. Schematic of PIP3 synthesis and impact of drugs to right. n = 3, >14 FOVs. Data indicate mean ± SD. Significance by ANO VA. Arrows show αCat enrichment at protrusions. Bars, 20 µm. See also Video 3. (B) BN-PAGE analysis of dimer formation (D) relative to monomer (M); B/B treatment 3 h. (C) ΔNαCatKKR<3A dimerization by B/B reduces filopodia formation compared with ΔNαCat. As in Fig. 2, filopodia were counted every 1 s during a video of force dimerization. Bars, 10 µm; n = 6 FOVs from two BR; data are mean ± SD). (D) Epifluorescence microscopy of radial protrusions (RPs; white arrows) reduced in ΔNαCatKKR<3A mutants. Bars, 20 µm. (E) Blinded quantification of RP (n > 150 cells; FOV counts ratioed to total number of cells to account for variations in cell density; Materials and methods). (F) Length of filopodia decreased in ΔNαCatKKR<3A, as imaged in structured illumination microscopy (SIM) of RP filopodia. Bars, 5 µm. (G) Quantification of filopodia length (n > 13 FOVs from three BRs), table of results below. Significance in E and G by ANO VA; data are mean ± SD. **, P < 0.01; ***, P < 0.001; ****, P < 0.0001. (H) Time-lapse analysis of B/B-treated ΔNαCatKKR<3A cells coinfected with GFP-LifeAct. Prolonged cell–cell contact upon homodimerization was not observed in mutant construct. Bars, 10 µm. See corresponding Videos 1 and 2.
on January 5, 2018jcb.rupress.org
Dow
nloaded from
JCB • Volume 216 • NumBer 11 • 20173774
recruitment of the homodimer to PIP3-activated membranes may be critical for its activity, such that even modest reduction of membrane recruitment via KKR<3A mutations can attenuate αCat homodimer function.
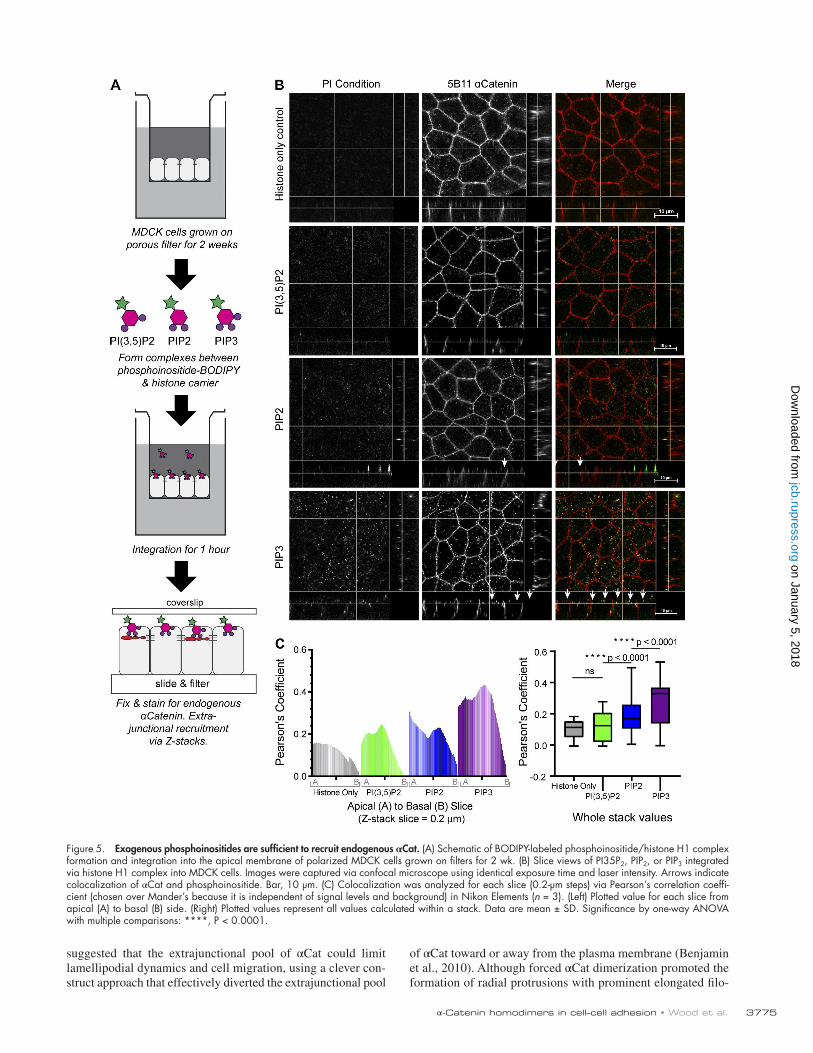
Exogenous PtdInsP are sufficient to recruit endogenous αCatBecause liposome-based in vitro assays often fail to recapitu-late presentation of PtdInsP as in vivo (Narayan and Lemmon, 2006), we sought to test whether PIP3 could recruit endogenous αCat to bona fide cellular membranes by introducing ectopic BOD IPY-tagged PIP3 into the apical membrane using histone (H1) carriers (PIP3/H1; Fig. 5 A; Gassama-Diagne et al., 2006). We validated the preferential recruitment of αCat to PIP3 by comparing colocalization (Pearson’s coefficient) of BOD IPY-tagged PIP3, phosphatidylinositol-3,5-bisphosphate or PIP2 in each slice of the Z-stack. In polarized MDCK cells grown on filters for 2 wk, we observed statistically significant colocaliza-tion of αCat with PIP3 relative to other PtdInsP or the histone carrier alone (Fig. 5, B and C). These data validate the pref-erential in vitro binding of αCat to PIP3 (Fig. 3) and demon-strate that PIP3 and, to a lesser extent, PIP2 are sufficient to recruit αCat to membranes.
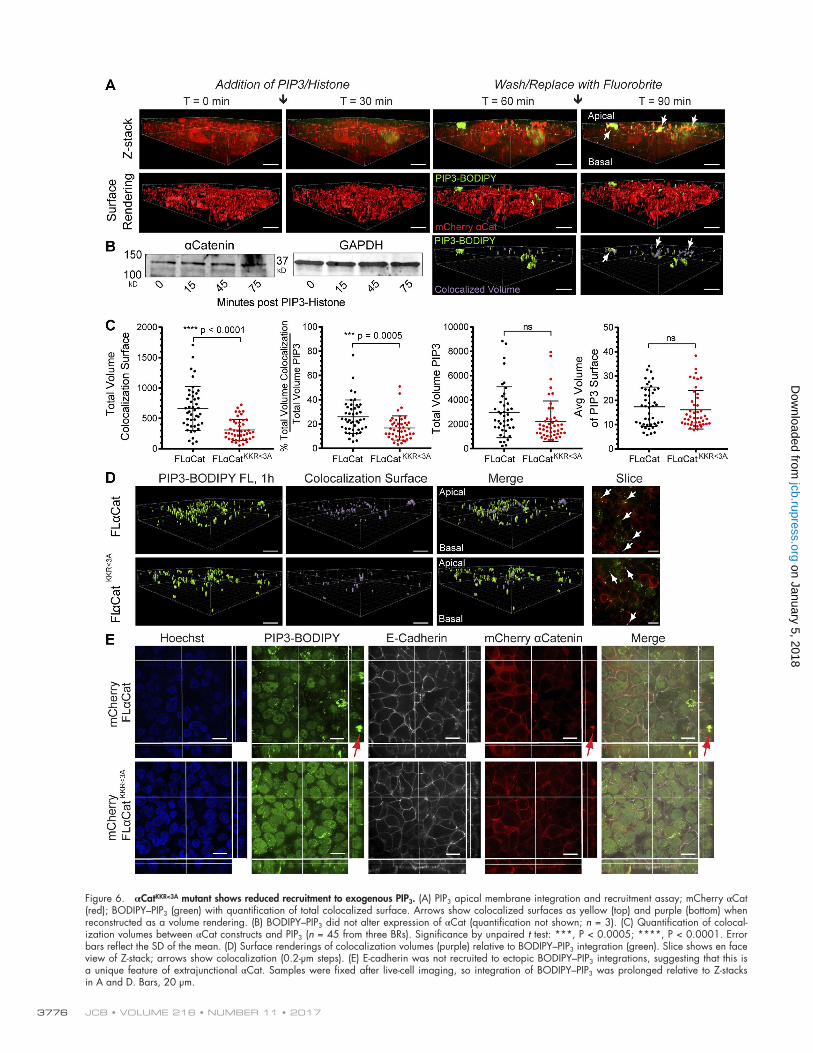
To evaluate the contribution of the basic patch in αCatKKR<3A to PIP3 recruitment in cells, we repeated the pre-vious experiment in the αCat-null R2/7 variant of DLD1 cells expressing an mCherry-tagged WT FLαCat or FLαCatKKR<3A mutant. We observed gradual apical recruitment of αCat in R2/7 cells during a 1-h PIP3/H1 integration (Fig. 6 A) and api-cal enrichments colocalized with PIP3 after washout of excess PIP3/H1 (arrow). Enrichments were not due to an increase in the overall expression of αCat (Fig. 6 B). These data are con-sistent with previous PtdInsP-interactome studies showing en-richment of αCat with PIP3 (Catimel et al., 2009; Jungmichel et al., 2014). Because the expression of αCat in these cell lines is not as definitively junctional (relative to MDCK cells in Fig. 5), we analyzed colocalization with PIP3 by rendering 3D surfaces of PIP3 integration and αCat from the Z-stacks to compare 3D colocalization in Imaris. When we compared colocalization of FLαCat with PIP3 compared with FLαCatKKR<3A, we found a statistically significant decrease in colocalization upon charge loss at these residues (Fig. 6, C and D), suggesting that the basic patch promotes recruitment to PIP3 membranes. Impor-tantly, this difference is not due to differences in PIP3/H1 inte-gration (total volume) or to the size of individually integrated PIP3/H1 volumes (Fig. 6 C) or to the histone carrier alone. Im-portantly, E-cadherin was not recruited to PIP3/H1 (Fig. 6 E), suggesting that recruitment by PIP3 may be a unique feature of extrajunctional αCat. Altogether, these data show that a basic patch in the M2 region of αCat contributes to its recruitment to PIP3-loaded membranes.
αCat basic patch contributes to adhesion and migrationAlthough the aforementioned studies clearly establish that forced dimerization of αCat promotes its membrane recruit-ment and alters F-actin organization, the ΔNαCat construct is not a native αCat protein. We sought, therefore, to assess the importance of this basic patch in the context of a FL αCat that could participate in both cadherin–catenin complex and ho-modimeric functions by comparing the adhesive activities of FLαCat and FLαCatKKR<3A-expressing R2/7 cells (immuno-
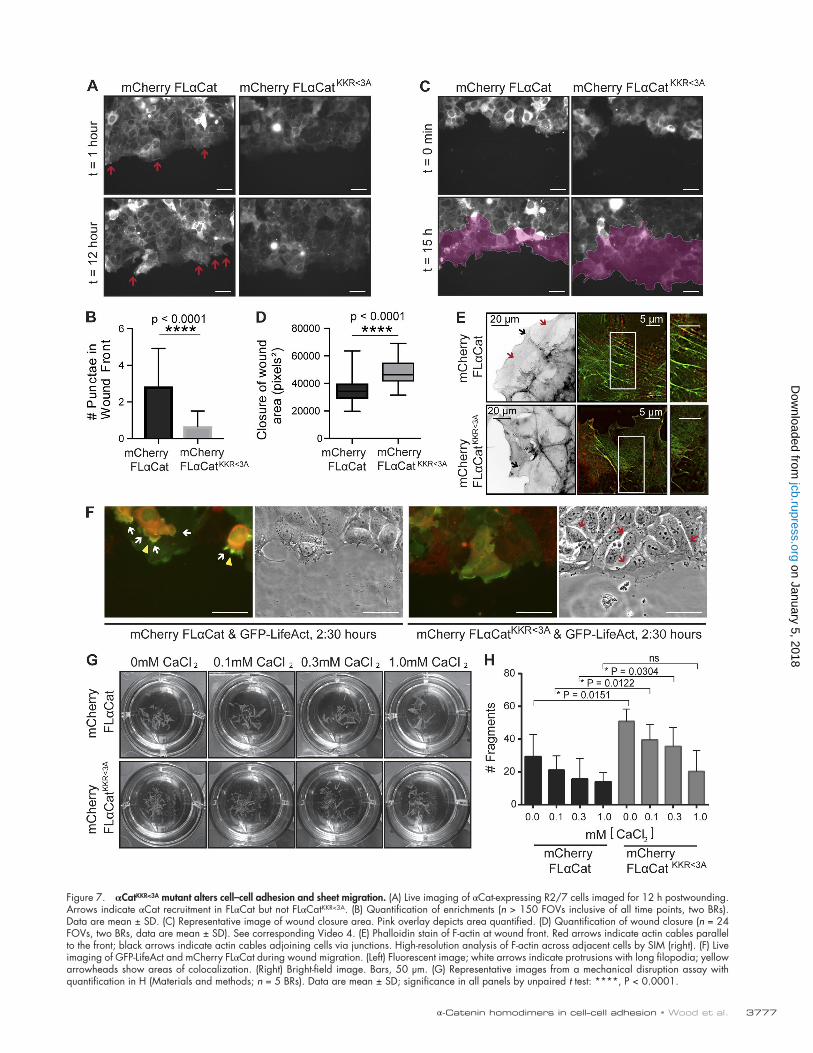
blot in Fig. S1 A). As with the recruitment of extrajunctional αCat to the leading edge of wounded cells (Fig. 1), FLαCat was enriched at the wound front compared with FLαCatKKR<3A (Fig. 7, A and B). In addition, epithelial sheets expressing FLαCatKKR<3A closed twice as much wound area as those ex-pressing FLαCat (Fig. 7, C and D; and Video 4), suggesting that αCat recruitment to PIP3-activated membranes contributes to the coordination of this process. Indeed, in FLαCat cells, actin organization along the wound was more uniform, with actin ca-bles parallel to the wound coordinated across cells (Fig. 7 E, top), reminiscent of the F-actin cables formed during epider-mal closure in invertebrates (Jacinto et al., 2002). In contrast, FLαCatKKR<3A cells were often separated from their immediate neighbors along the wound front and did not form these actin cables (Fig. 7 E, bottom). To visualize F-actin during live-cell migration, we cotransfected the cells in Fig. 7 A with GFP- LifeAct. We found that monolayers expressing FLαCat dis-played prominent protrusions with long filopodia (Fig. 7 F and Video 4) and colocalized with F-actin as before (Fig. 7 F), par-ticularly in cells directly following the leading cells, compared with FLαCatKKR<3A cells. Moreover, when the migrating cells were imaged by phase contrast, the FLαCatKKR<3A cells were more rounded with refractile cell–cell contacts (Fig. 7 F), sug-gesting a reduction in cell–cell adhesion. To test this directly, we used a standard epithelial sheet fragmentation assay (Esco-bar et al., 2015). We found that mechanical disruption of mono-layers expressing the FLαCatKKR<3A mutant formed significantly more fragments than FLαCat cells (Fig. 7, G and H). Because this charge mutant form of αCat shows similar incorporation into the cadherin/β-catenin complex (Fig. S1 F) and binding to F-actin by cosedimentation as WT αCat (Fig. S1 C), we reason that the αCatKKR>3A mutant alters cell–cell adhesive activities by targeting the membrane recruitment of homodimeric αCat. Although it is difficult to rule out the possible contribution of αCat recruitment by PIP3 within the cadherin–catenin complex, our evidence that E-cadherin is not readily recruited to apically added PIP3 (Fig. 6 E), supports the idea that αCat recruitment by PIP3 outside of the cadherin-catenin complex strengthens intercellular adhesion.
Discussion
We show that an extrajunctional form of αCat can be localized to PIP3-enriched membranes, where this recruitment and αCat homodimerization appear important for cell contact formation, strength, and coordinated migration. Because recruitment by PIP3 appears to be a unique feature of αCat homodimers, and currently, there are no known mutants that specifically disable the homodimerization function of αCat from the β-catenin/ E-cadherin binding function, we speculate that targeting the membrane-binding function of αCat may specifically attenuate the role of extrajunctional αCat homodimer function in cells.
αCat homodimers are implicated in a number of in vitro F-actin–binding activities that may contribute to the phenotypic behaviors measured in this study. For example, αCat dimers not only bind F-actin but can protect it from severing by cofilin (Hansen et al., 2013), can promote its bundling (Koslov et al., 1997), and can induce a conformational change in the actin fila-ment that limits barbed-end growth and branching by the Arp2/3 complex (Drees et al., 2005; Hansen et al., 2013). Consistent with the ability of αCat to limit Arp2/3 in vitro, a previous study
on January 5, 2018jcb.rupress.org
Dow
nloaded from
α-Catenin homodimers in cell–cell adhesion • Wood et al. 3775
suggested that the extrajunctional pool of αCat could limit lamellipodial dynamics and cell migration, using a clever con-struct approach that effectively diverted the extrajunctional pool
of αCat toward or away from the plasma membrane (Benjamin et al., 2010). Although forced αCat dimerization promoted the formation of radial protrusions with prominent elongated filo-
Figure 5. Exogenous phosphoinositides are sufficient to recruit endogenous αCat. (A) Schematic of BOD IPY-labeled phosphoinositide/histone H1 complex formation and integration into the apical membrane of polarized MDCK cells grown on filters for 2 wk. (B) Slice views of PI35P2, PIP2, or PIP3 integrated via histone H1 complex into MDCK cells. Images were captured via confocal microscope using identical exposure time and laser intensity. Arrows indicate colocalization of αCat and phosphoinositide. Bar, 10 µm. (C) Colocalization was analyzed for each slice (0.2-µm steps) via Pearson’s correlation coeffi-cient (chosen over Mander’s because it is independent of signal levels and background) in Nikon Elements (n = 3). (Left) Plotted value for each slice from apical (A) to basal (B) side. (Right) Plotted values represent all values calculated within a stack. Data are mean ± SD. Significance by one-way ANO VA with multiple comparisons: ****, P < 0.0001.
on January 5, 2018jcb.rupress.org
Dow
nloaded from
JCB • Volume 216 • NumBer 11 • 20173776
Figure 6. αCatKKR<3A mutant shows reduced recruitment to exogenous PIP3. (A) PIP3 apical membrane integration and recruitment assay; mCherry αCat (red); BOD IPY–PIP3 (green) with quantification of total colocalized surface. Arrows show colocalized surfaces as yellow (top) and purple (bottom) when reconstructed as a volume rendering. (B) BOD IPY–PIP3 did not alter expression of αCat (quantification not shown; n = 3). (C) Quantification of colocal-ization volumes between αCat constructs and PIP3 (n = 45 from three BRs). Significance by unpaired t test: ***, P < 0.0005; ****, P < 0.0001. Error bars reflect the SD of the mean. (D) Surface renderings of colocalization volumes (purple) relative to BOD IPY–PIP3 integration (green). Slice shows en face view of Z-stack; arrows show colocalization (0.2-µm steps). (E) E-cadherin was not recruited to ectopic BOD IPY–PIP3 integrations, suggesting that this is a unique feature of extrajunctional αCat. Samples were fixed after live-cell imaging, so integration of BOD IPY–PIP3 was prolonged relative to Z-stacks in A and D. Bars, 20 µm.
on January 5, 2018jcb.rupress.org
Dow
nloaded from
α-Catenin homodimers in cell–cell adhesion • Wood et al. 3777
Figure 7. αCatKKR<3A mutant alters cell–cell adhesion and sheet migration. (A) Live imaging of αCat-expressing R2/7 cells imaged for 12 h postwounding. Arrows indicate αCat recruitment in FLαCat but not FLαCatKKR<3A. (B) Quantification of enrichments (n > 150 FOVs inclusive of all time points, two BRs). Data are mean ± SD. (C) Representative image of wound closure area. Pink overlay depicts area quantified. (D) Quantification of wound closure (n = 24 FOVs, two BRs, data are mean ± SD). See corresponding Video 4. (E) Phalloidin stain of F-actin at wound front. Red arrows indicate actin cables parallel to the front; black arrows indicate actin cables adjoining cells via junctions. High-resolution analysis of F-actin across adjacent cells by SIM (right). (F) Live imaging of GFP-LifeAct and mCherry FLαCat during wound migration. (Left) Fluorescent image; white arrows indicate protrusions with long filopodia; yellow arrowheads show areas of colocalization. (Right) Bright-field image. Bars, 50 µm. (G) Representative images from a mechanical disruption assay with quantification in H (Materials and methods; n = 5 BRs). Data are mean ± SD; significance in all panels by unpaired t test: ****, P < 0.0001.
on January 5, 2018jcb.rupress.org
Dow
nloaded from
JCB • Volume 216 • NumBer 11 • 20173778
podia, and cells expressing FL αCat closed the wound slower than αCatKKR>3A-expressing cells, activities that suggest Arp2/3 suppression, we did not find that αCat recruitment to mem-branes correlated with a reduction in Arp2/3 accumulation at the periphery (Fig. S1 G). Therefore, future studies will be re-quired to understand how these distinct biochemical activities are temporally and spatially coordinated at the membrane sur-face by PtdInsP, PIP3 in particular, and account for how αCat homodimers contribute to intercellular adhesive behaviors.
Further studies will also be required to understand how αCat homodimers, but not monomers, show selective binding to PIP3 and, to a lesser extent, PIP2. Although we show that disruption of an algorithm-identified charge cluster in αCat (KKR; MIT Scansite) impaired αCat homodimer binding to PIP3–liposomes by SPR analysis, as well as its recruitment to BOD IPY-labeled PIP3 exogenously added to cells, the αCatKKR basic region cannot explain the PtdInsP binding se-lectivity of αCat homodimers. Thus, these data suggest that the αCatKKR-basic region likely contributes to electrostatic membrane interactions (e.g., via phosphatidylserine), while other residues in αCat contribute to PIP3 head-group specific-ity. Efforts to identify candidate PtdInsP binding pockets by molecular modeling are limited by the low resolution (3.66 Å) of the nearly FL αCat dimer crystal structure (Protein Data Bank 4IGG; Rangarajan and Izard, 2013). Moreover, such efforts may be irrelevant if αCat homodimers bind to PIP3 through a pocket formed at an alternative dimer interface not observed in the crystal structure, with two monomers con-tributing residues to form one PIP3 binding site, analogous to how its homologue, vinculin, binds PIP2 (Chinthalapudi et al., 2014). Indeed, the remarkable affinity difference measured for αCat homodimer and monomer binding to PIP3 cannot be explained by avidity alone, suggesting the possibility that a conformational change in the αCat homodimer may expose a PtdInsP-binding surface that is inaccessible in the monomer. Last, it is worth noting that although the αCatKKR<3A mutant does not apparently perturb its incorporation into the cad-herin complex or binding to F-actin, we cannot presently rule out a role for these residues in tension-dependent M-domain interactions that may also contribute to the cell-cell adhe-sive phenotypes described.
Evidence that the Kd of αCat homodimers is much higher than the concentration of cytosolic αCat in cells (Drees et al., 2005) raises the intriguing possibility that the localization of αCat to PIP3-enriched membranes might serve to facilitate αCat homodimerization by enhancing its local effective con-centration. Although inhibiting PIP3 formation with wort-mannin failed to alter the monomer/dimer ratio of cytosolic αCat by native gel analysis, it is likely that basic patches in αCat mediate electrostatic interactions with the plasma mem-brane, locally increasing the concentration of αCat to drive homodimerization. Once at the membrane, homodimer diffu-sion may be restricted by PIP3, as a way to localize F-actin binding activities of αCat.
In summary, this study demonstrates that αCat homodi-mers bind to PIP3, respond to PI3K-activated signals, and con-trol actin organization and behaviors that promote cell–cell adhesion, which has implications for the specific targeting of extrajunctional αCat homodimer function in cells.
Materials and methods
Plasmid generation and constructsAll αCat sequences used are based on the epithelial form of αCat. The GFP-tagged IRES-Puro-rat αCat lentiviral vector (pLVX) was provided by J. de Rooij (Center for Molecular Medicine at the University Medical Center Utrecht, Utrecht, the Netherlands). The mutated basic region of the M2 domain (KKR<3A) was creating using QuikChange II site- specific mutagenesis (Stratagene) and QuikChange Primer Design Pro-gram in the context of the human αCat protein (pGEX; Escobar et al., 2015). FL and KKR<3A human αCat proteins were cloned into the pLVX vector downstream and in-frame with an N-terminal monomeric mCherry-tag, to avoid dimerization effects mediated by the GFP tag (Shaner et al., 2005). For iDimerize constructs, the first 267 aa of the human αCat sequence (encoding overlapping β-catenin hetero- and αCat homodimerization domains) were removed with the Clontech In-Fusion HD Cloning kit. This truncated form, ΔNαCat, was cloned into Lenti- X iDimerize Inducible Homodimer System (Clontech) that had been N-terminally tagged with mCherry. The puromycin gene was removed from the PLVX backbone to accommodate the size of the αCat-expression constructs. Primers used for truncated ΔNαCat and ΔNαCatKKR<3A con-structs are available upon request. A lentiviral LifeAct-GFP was pur-chased from Addgene (pLenti.PGK.LifeAct-GFP; Plasmid 51010).
Cell culture and stable cell line selectionMDCK, A431D, and DLD1 cells (American Type Culture Collection) and DLD1 R2/7 αCat-deficient colon carcinoma cells (a gift from F. van Roy, Ghent University, Ghent, Belgium) were maintained in DMEM (Corning), containing 10% FBS (Atlanta Biologicals or JRS Scientific), 100 U/ml penicillin, and 100 µg/ml streptomycin (Corn-ing). iDimerize cell lines were sorted for positive selection of mCherry fluorescence by flow cytometry using FAC SAria 5 (BD Biosciences). mCherry FLαCat or FLαCatKKR<3A cell lines were selected in 5 µg/ml puromycin (Sigma-Aldrich) and were subsequently sorted for mCherry expression using flow cytometry. In drug treatment assays, cells were treated with one of the following: DMSO control (Sigma-Aldrich) or 1–20 µM wortmannin (W1628; Sigma-Aldrich) for 3 h. In forced- dimerization assays, cells were treated with 25, 250, or 500 nM B/B ho-modimer (635059; Clontech) for 20 min to 15 h, which was sometimes followed by treatment with 1 µM washout ligand (635088; Clontech).
AntibodiesThe following primary antibodies were used: polyclonal rabbit anti–αCat (C3236; Cell Signaling), hybridoma mouse anti–αCat (5B11; Daugherty et al., 2014), monoclonal mouse anti–β-catenin (610154; BD Biosciences), polyclonal rabbit anti–β-catenin (06-734; EMD Millipore), monoclonal mouse anti–E-cadherin (610182; BD Biosci-ences), monoclonal mouse anti–E-cadherin (HECD1, 13-1700; Ta-kara), polyclonal rabbit anti-GAP DH (FL-335, sc-25778; Santa Cruz), anti–p34-Arc/ARPC2 (07-227; EMD Millipore), monoclonal mouse anti-GAP DH (9484; Abcam), hybridoma mouse anti-tubulin (DM1A, T9026; Sigma-Aldrich), polyclonal rabbit anti-mCherry (5993; Bio-Vision), and Alexa Fluor 488 or 568 phalloidin (A12379; Invitrogen). Secondary antibodies for Western blotting included HRP-conjugated goat anti–mouse and anti–rabbit antibodies (Bio-Rad) or fluorescently labeled donkey anti–mouse and anti–rabbit antibodies (680RD or 800RD; LiCor Biosciences). Secondary antibodies for immunofluores-cence included IgG Alexa Fluor 488– or 568–conjugated goat anti–mouse or anti–rabbit antibodies (Invitrogen).
on January 5, 2018jcb.rupress.org
Dow
nloaded from
α-Catenin homodimers in cell–cell adhesion • Wood et al. 3779
Immunofluorescence and ImagingCells were grown on coverslips, fixed in 4% PFA (Electron Micros-copy Services) for 15 s, quenched with glycine, permeabilized with 0.3% Triton X-100 (Sigma-Aldrich), and blocked with normal goat serum (Sigma-Aldrich). Primary and secondary antibody incubations were performed at RT for 1 h, interspaced by multiple washes in PBS, and followed by mounting coverslips in ProLong Gold fixative (Life Technologies). Images of asymmetrical αCat recruitment to the wound front (Fig. 1, A–C; and Fig. 4 A) were captured at RT with a Axioplan2 microscope (Zeiss) equipped with a 100× Plan-Neofluar with oil, NA 0.75 objective, and AxioCam HR Camera using AxioVision 4.8 soft-ware. Wide-field fluorescence live-cell microscopy was used to gener-ate videos of the iDimerize drug time course and single-cell filopodia projections (Fig. 1 F; Fig. 2, A and G; Fig. 4, C and H; and Videos 1, 2, and 3) with a Nikon Ti Eclipse inverted microscope equipped with a Yokogawa CSU-X1 spinning disk head, Perfect Focus system (Nikon), a 100× or 60× oil 1.49 NA APO total internal reflection fluorescence (TIRF) objective, and an Andor xION electron-multiplying charge-cou-pled device (CCD) camera (Andor Technology) controlled by Meta-Morph v.7.7.7.0 software (Molecular Devices). Cells were maintained at 37°C plus 5% CO2 during imaging using a Tokai-Hit stage-top incubator (Tokai-Hit) or an Okolab gas mixer (Okolab). Time-lapse sequences were acquired at 15-s intervals using the 561-nm and/or 488-nm laser. For all experiments, cells were plated on glass-bottomed dish coverslips 24 h before imaging. Imaging of radiating protrusions and filopodia (Figs. 2 E and 4 F) was performed using a structured illumi-nation superresolution microscope (N-SIM; Nikon). Samples were illu-minated with spatially high-frequency patterned excitation light (100× objective lens, NA 1.49; TiE N-SIM microscope [Nikon] and iXon X3 897 camera [Andor Technology]). The moiré patterns were produced and analytically processed (Nikon Elements v.4.20.01, 3D SIM recon-struction tool) to reconstruct the subresolution structure of the samples. Platinum replica electron microscopy (Fig. 2 B) was performed as pre-viously described (Korobova and Svitkina, 2008; Svitkina, 2009). Cells were grown subconfluently on coverslips and preextracted with 0.5% Triton X-100, 0.25% glutaraldehyde in PEM buffer (100 mM Pipes, pH 6.9, 1 mM EGTA, and 1 mM MgCl2). Cells were then fixed in 2% glutaraldehyde in 0.1 M Na-cacodylate, pH 7.3, for 20 min at RT. One set of cells was then stained with 488 phalloidin for visualization by light microscopy (control) while a second was used for the platinum replica, processed with tannic acid and uranyl acetate, critical point dried, coated with platinum and carbon, and transferred onto electron microscopic grids for observation. Samples were imaged using a FEI Tecnai Spirit G2 transmission electron microscope (FEI Company) op-erated at 80 kV. Images were captured using an Eagle 4k HR 200kV CCD camera and presented as inverted contrast, adjusted for brightness and contrast but otherwise unprocessed.
Image analysis and quantificationTo quantify the number of enrichments at the leading edge (Fig. 4 A), cells were fixed and imaged with an Axioplan2 microscope (in the previous section). To qualify for quantification, enrichment needed to be brighter than the cell body, and distinct from adjacent enrichments. Enrichments were only counted within the first two cell rows of the leading edge, not in leading cells farther back in the epithelial sheet. The file names were randomly generated (RandomNames Script from HowToGeek.com) to eliminate sample bias before quantification of four or five fields of view (FOVs) for three biological replicates (BRs; n = 14–17) for each condition (>124 cells). Significance was determined by multiple-comparisons ANO VA. Images presented in the paper were adjusted for brightness and contrast but were otherwise unprocessed.
To quantify the number of filopodia observed in the drug time-course videos of ΔNαCat and ΔNαCatKKR<3A cells tagged with GFP- LifeAct (Fig. 3 D), still images (every 1 min, six BRs) from the image sequence were imported into ImageJ. Filopodia were counted if there was a distinct actin projection extending from the cell body. Error bars here and throughout this study represent SDs. Representative images are shown with white arrows pointing to filopodia projections; images were adjusted for brightness and contrast but were otherwise unprocessed.
To quantify the number of radial protrusions observed (Figs. 2 C and 4 D), cells were fixed and stained with Hoechst and imaged with an Axioplan2 microscope (in the previous section). Three to eight FOVs for each of the three BRs were imaged, exported as channel-separated JPEG images, and quantified using the multipoint tool to count protrusions in FIJI/ImageJ software. The file names were randomly generated (RandomNames script from http ://www .howtogeek .com) to eliminate sample bias before quantification by a third party in a double-blind experiment. Total cell numbers were first counted using the Cell Counter plugin after thresholding the Hoechst-stained nuclei. Brightness and contrast were adjusted to visualize all cell peripheries in the red channel. A structure was counted as a radial protrusion if a lamellipodial fan, distinct from the main cell body, was observed. Adjacent structures were counted as one unless they were clearly supported by distinct bases, and structures were not counted if saturation inhibited a clear visualization of structure. This main lamellipodial fan was often concurrent with enrichment of αCat localization and radiating filopodia from the central structure, though the latter two features were not a requirement for a structure to be counted as a radial protrusion. To account for variability in radial protrusion readouts, >150 cells were counted, and each FOV was ratioed against the total number of cells to account for variations in cell density. Ratios were averaged for each condition and compared via one-way ANO VA with Tukey’s multiple-comparisons test. To measure filopodia length from structured illumination microscopic images, reconstructed ND2 files were imported to ImageJ, and filopodia length (actin channel) was measured with a freehand line. Statistics were calculated using one-way ANO VA with Tukey’s multiple-comparisons test (GraphPad Prism). Images presented in the paper were adjusted for brightness and contrast but were otherwise unprocessed.
PIP3–histone apical recruitment assay13 µl 100 µM PIP3, phosphatidylinositol-3,5-bisphosphate, or PIP2 tagged with BOD IPY-FL was incubated with 13 µl 100 µM Histone H1 Carrier (Echelon) for 10 min after vigorous pipetting to facilitate complex formation. Complexes were dripped into confluent cells cov-ered in 100 µl FluoroBrite DMEM (Life Technologies), and PtdInsP–histoneH1 complexes were allowed to integrate for 1 h. After 1 h of integration, the medium was removed and replaced with fresh Fluoro- Brite medium. For both experiments, addition of histone H1 alone served as a negative control.
For MDCK cells grown on filters (Fig. 5) and fixed after PtdInsP integration, slides were imaged at RT with 60× oil Apo TIRF NA 1.49 objective on the Nikon A1R laser scanning confocal inverted micro-scope equipped with two standard photomultiplier tubes (408 and 640) and two high-sensitivity gallium arsenide phosphide detectors (488 and 561). The system is equipped with the Perfect Focus focal drift com-pensation mechanism and automated XY stage. Live-cell imaging of R2/7 cells Z-stack images (0.2-µm steps; Fig. 6) were captured (before and after PtdInsP/H1 integration) using a Nikon Ti Eclipse inverted microscope equipped with a Yokogawa CSU-X1 spinning disk head, Perfect Focus system, a 100× 1.49 NA APO TIRF objective, and an Andor xION electron-multiplying CCD camera. Cells were maintained
on January 5, 2018jcb.rupress.org
Dow
nloaded from
JCB • Volume 216 • NumBer 11 • 20173780
at 37°C plus 5% CO2 during imaging using a Tokai-Hit stage-top incu-bator or an Okolab gas mixer.
For MDCK cells (Fig. 5), colocalization was quantified in Nikon Elements v.4.60.00, build 1170. Pearson’s correlation coefficients for each slice of the Z-stack were calculated using the colocalization tool. To show how colocalization changed across the stack, these data were plotted in Prism as a function of Z-stack height. Coefficients for each stack were combined (n = 3) to compare colocalization of each PtdInsP/H1. Statistical analysis was performed using one-way ANO VA with multiple comparisons. Images presented in the paper were adjusted for brightness and contrast but were otherwise unprocessed.
For R2/7 cells (Fig. 6), 3D colocalization of PIP3 and αCat was quantified in Imaris (Bitplane). This method was chosen because the lo-calization of αCat in R2/7 cells has increased cytoplasmic localization relative to the junctional localization in MDCK cells and thereby cannot quantitatively measure colocalization via Pearson’s coefficient, as in Fig. 5. Z-stacks were imported to Imaris, and new surfaces rendered for both the PIP3 and αCat channels (0.3 smoothing for surfaces detail, 2.0 background subtraction using local contrast, thresholding of 200 or 300 for green and red channels, respectively, and filtered out voxels <100). A third surface was rendered with the Imaris MAT LAB XTension Surface-Surface Colocalization (Gastinger, 2015), with no smoothing. The mean volume, the total number of individual volumes, and the sum of all volumes were recorded for each channel. Data from 15 FOVs for three BRs (n = 45) were compiled in Prism, and statistics were calculated using unpaired t tests. Images presented in the paper were adjusted for brightness and contrast but were otherwise unprocessed.
Scratch wound assay250,000 cells were plated for 24 h on LabTek #1 four-well chamber slide (43300-776; Thermo Fisher Scientific), wounded with a P200 mi-cropipette tip, and allowed to recover for 2 h. Prior to imaging, DMEM was replaced with FluoroBrite DMEM (Life Technologies) and 10 µg/ml mitomycin C (Sigma-Aldrich) to limit cell proliferation. Cells were imaged with the 20× or 40× objective every 10 min (both phase con-trast and fluorescent channels) on the Nikon Biostation IM-Q with the slide holder module (located in Nikon Imaging Facility) at 37°C, 5% CO2, for 15 h. 10–12 FOVs were captured along the wound edge. The instrument was controlled using Biostation IM software v.2.21, build 144. To quantify change in wound area, the resulting .ids file was im-ported to ImageJ, and the wound edge of the phase-contrast image was traced with the polygon tool at time = 0 and time = 15 h. The area of the resulting polygon was measured in square pixels, and the resulting data (12 FOVs, two BRs) were compared using an unpaired t test. Images presented in the paper were adjusted for brightness and contrast but were otherwise unprocessed.
Epithelial sheet disruption assay350,000 cells were plated in a 12-well culture plates (Corning) and allowed to reach confluency. 36 h postplating, the monolayer was washed twice in Dulbecco’s PBS supplemented with 0.5 mM Mg2+ and 1 mM Ca2+ (HyClone) and then incubated for 30 min at 37°C in 1 mg/ml Dispase (Roche) diluted in PBS (Corning) and supplemented with the indicated amount of Ca2+. After monolayers lifted from the dish, the plate was subjected to a shaking force of 1,400 rpm for 15 s. An image of each well was captured with an iPhone 6s camera (12 megapixels) held 6 inches above the plate before and after shaking, and the resulting file names were blinded (RandomNames script from http ://www .howtogeek .com) before counting each fragment with the multipoint marker in ImageJ. Seventy-five epithelial fragments were established as the upper limit for counting. The assay was repeated
with five BRs, and combined counts for each Ca2+ condition were compared using unpaired t test.
Protein analysisExpression and purification of GST-tagged constructs: FL human αCat (FLαCat and FLαCatKKR<3A mutant) were expressed as N-terminal GST-fusion proteins in the pGEX-4T plasmid and purified as previ-ously described (Ishiyama et al., 2013). The N-terminal GST tag was cleaved to release FL αCat from beads using 10 U bovine thrombin (BioPharm Laboratories) incubated overnight at 4°C. Cleaved proteins were further purified into dimer and monomer fractions by size exclu-sion chromatography using a Superdex 200 prep grade column (GE Healthcare). The purified proteins were exchanged into protein storage buffer (50 mM Tris-HCl, pH 8.0, 100 mM NaCl, and 1 mM TCEP). Multi-angle light scattering measurements were acquired by using a miniDawn in-line detector and an Optilab rEX differential refractom-eter (Wyatt Technologies). Molecular weight was calculated by using AST RA software (Wyatt Technologies). Circular dichroism spectro-scopic data for 2.4 µM αCat samples were collected on a J-815 CD spectrometer (Jasco) at 20°C using a 0.1-cm path length cuvette with a scanning speed of 20 nm/min (1-nm increments). Thermal melt data were acquired at 220 nm with a scan rate of 1°C/min.
Lipid vesicle preparation and SPR analysisLarge unilamellar vesicles with different lipid compositions (e.g., POPC/POPS/PtdInsP = 77:20:3 in mole%) were prepared using a microex-truder (Avanti Polar Lipids) with a 100-nm polycarbonate filter (Fig. 3). All SPR measurements were performed at 23°C using a lipid-coated L1 chip in the BIA CORE X100 system as previously described (Stahelin and Cho, 2001). 50 mM Tris-HCl, pH 8.0, containing 0.1 M NaCl and 1 mM TCEP was used as the running buffer, while PtdInsP-containing vesicles and POPC (or POPC/POPS [8:2]) vesicles were coated on the active surface and the control surface, respectively. Vesicles were in-jected at 5 µl/min onto the corresponding sensor chip surfaces to yield the identical RU, ensuring the equal concentration of the coated lipids. Equilibrium binding measurements of αCat were performed at a flow rate of 10 µl/min, which allowed enough time for the R values of the as-sociation phase to reach near equilibrium levels (Req; Ananthanarayanan et al., 2003). Each sensorgram was background-corrected by subtracting the control surface response from the active surface response. Protein solutions with different concentrations were injected to collect a set of Req values that were plotted against the protein concentrations (Po). An apparent dissociation constant (Kd) was then determined by nonlin-ear least squares analysis of the binding isotherm using the equation Req = Rmax/(1 + Kd/Po), where Rmax is the maximal Req value (Cho, 2001). Because the concentration of lipids coated on the sensor chip cannot be accurately determined, Kd is defined as Po yielding half-maximal bind-ing with a fixed lipid concentration. Each measurement was repeated at least three times to determine mean and SD values. For kinetic mea-surements, the flow rate was maintained at 10 µl/min.
Actin pelleting assayMonomeric rabbit skeletal muscle actin was polymerized in the polym-erization buffer (5 mM Tris-HCl, pH 8.0, 50 mM KCl, 2 mM MgCl2, 1 mM ATP, 0.2 mM CaCl2, and 0.5 mM DTT) for 1 h at RT. 5 µM actin and 5 µM αCat were mixed in the binding buffer (5 mM Tris-HCl, pH 8.0, 50 mM KCl, 40 mM NaCl2, 2 mM MgCl2, 1 mM ATP, 0.2 mM CaCl2, 0.5 mM DTT, and 0.5 mM TCEP) for 1 h, and supernatant and pellet fractions were separated by centrifugation at 100,000 g for 20 min. Fractionated protein samples were analyzed by SDS-PAGE with Coomassie blue stain, and gel band intensity was measured by ImageJ
on January 5, 2018jcb.rupress.org
Dow
nloaded from
α-Catenin homodimers in cell–cell adhesion • Wood et al. 3781
using the rectangular selection tool followed by the gel analyzer tool (n = 3; data are mean ± SD).
Cell fractionation analysesHypotonic, detergent-free lysis for assessing the cytosolic fraction of αCat (Fig. S1 E): cells were washed twice with PBS2+, scraped, and pelleted at 1,400 rpm for 3 min. The cell pellet was resuspended in hy-potonic lysis buffer (30 mM Tris-HCl, pH 7.5, and 1 EGTA-free prote-ase inhibitor/10 ml; Roche). Cells were swollen on ice for 30 min and lysed by 20 strokes through a tuberculin needle. Tonicity was restored with 0.25 M sucrose homogenized with 10 strokes of a tuberculin nee-dle; a portion was held aside as “input.” The remainder was ultracen-trifuged at 100,000 g for 90 min to generate a supernatant (S100G) containing cytosolic proteins for analysis by SDS-PAGE. To achieve a more concentrated cytosolic fraction for BN-PAGE analysis, we used a standard freeze-thaw protocol (Tansey, 2006). In brief, cells were washed twice with PBS2+, scraped, and pelleted at 1,000 rpm for 3 min. The pellet was resuspended in Freeze/Thaw Lysis Buffer (600 mM KCl, 20 mM Tris-HCl, pH 7.5, 20% glycerol, 100 mM PMSF, 0.35 mg/ml Pepstatin A, 1 mg/ml aprotinin, and 2.3 mg/ml leupeptin) using 200 µl per 10-cm dish). Cells were lysed in cycles of liquid nitrogen (five times) followed by a 15-min thaw on ice. Lysates were clarified at 14,000 g for 10 min at 4°C. BN-PAGE (3–12%; NativePAGE Bis-Tris Gel System; Invitrogen) was used to discern the homodimerization capacity of αCat. After incubating cells in a hypotonic lysis buffer (30 mM Tris-HCl, pH 7.5, and 1 EGTA-free protease inhibitor/10 ml; Roche), lysing with a syringe, and restoring tonicity with 0.25 M su-crose, 2–40 µg of total cell lysate was loaded onto the gel (35-µl total volume, with 1× Native Sample buffer and 0.35% G-250 Coomassie additive). The inner compartment of the XCell SureLock Mini-Cell (Thermo Fisher Scientific) was filled with prechilled light blue cath-ode buffer (1× NativePAGE running buffer and 0.1× NativePAGE cathode buffer), and the outer compartment was filled with prechilled 1× NativePAGE running buffer. The gel was run at 4°C for 2.5 h at 150 V, transferred to a polyvinylidene fluoride membrane (20% methanol and 1× NuPAGE Transfer Buffer) at 4°C for 34 V overnight. Proteins were fixed to membrane in 8% acetic acid, followed by a 5-minute wash in ddH2O. The membrane was blocked in TBST-5% milk for 1 h before proceeding with normal Western blot methods using the anti-αCat antibody (C3236; Cell Signaling) or the anti-mCherry anti-body (Cell Signaling). For immunoprecipitation, cells were harvested in 1% Triton X-100 lysis buffer (50 mM Tris, pH 7.5, 5 mM EDTA, 150 mM NaCl, 5% glycerol, and 1% Triton-X100 with protease inhib-itor cocktail (Roche) and precipitated with the indicated antibodies.
Online supplemental materialThe supplemental material for this manuscript provides important control experiments validating construct expression levels and typical binding partners (Fig. S1 A, B, and F), as well as experiments showing that the αCatKKR<3A mutant does not significantly alter F-actin binding (Fig. S1 C). We also present evidence that the αCat homodimer is not sensitive to inhibition of PI3K by wortmannin (Fig. S1 D) but that this treatment is associated with an increase in the cytosolic pool of αCat (Fig. S1, D and E). Given evidence that αCat homodimers can inhibit Arp2/3-dependent actin polymerization (Drees et al., 2005) and accu-mulation at the leading edge of cells (Benjamin et al., 2010), we also show evidence that Arp3 protein levels are not obviously altered by αCat forced dimerization (Fig. S1 G). Last, the videos included provide temporal context to the still images in the text (Video 1 with Figs. 1 F, 2 A, and 4 C; Video 2 with Figs. 2 G and 4 H; Video 3 with Fig. 4 A; and Video 4 with Fig. 7, A–E).
Acknowledgments
We thank our Northwestern University colleagues, Volodya Gelfand, Josh Rappoport, Farida Korobova, Dave Kirchenbuchler, Dina Arvan-itis, Sergey Troyanovsky, and Richard A. Anderson (University of Wis-consin), for advice and discussion.
This work was supported by the National Science Foundation Graduate Research Program (grant DGE-1324585) and a John N. Nicholson Fellowship to M.N. Wood, Canadian Institutes of Health Research grant 130267 to N. Ishiyama and M. Ikura, National Insti-tutes of Health grant R35GM122530 to W. Cho, National Institutes of Health grants GM076561 and P01HL071643 to C.J. Gottardi and cores (Skin Disease Research Center [grant P30AR057216], Flow Cytometry [National Cancer Institute grants CA0605531 and S10OD011996], and Center for Advanced Microscopy [National Cancer Institute Cancer Center Support Grants P30 CA060553, S10 RR031680, and S10OD016342]).
The authors declare no competing financial interests.Author contributions: Conceptualization: M.N. Wood and
C.J. Gottardi; validation: A.S. Flozak; formal analysis: M.N. Wood, I. Singaram, W. Cho, C. Chung, and N. Ishiyama; investigation: M.N. Wood, N. Ishiyama, A.S. Flozak, and C. Chung; resources: A. Yemelyanov, M. Ikura, and W. Cho; writing original draft: M.N. Wood, W. Cho, and C.J. Gottardi; editing and review, M.N. Wood, C.J. Gottardi, and A.S. Flozak; visualization: M.N. Wood; supervision: C.J. Gottardi; funding acquisition: M.N. Wood, M. Ikura, W. Cho, and C.J. Gottardi.
Submitted: 9 December 2016Revised: 22 March 2017Accepted: 28 July 2017
ReferencesAnanthanarayanan, B., R.V. Stahelin, M.A. Digman, and W. Cho. 2003.
Activation mechanisms of conventional protein kinase C isoforms are determined by the ligand affinity and conformational flexibility of their C1 domains. J. Biol. Chem. 278:46886–46894. http ://dx .doi .org /10 .1074 /jbc .M307853200
Belshaw, P.J., S.N. Ho, G.R. Crabtree, and S.L. Schreiber. 1996. Controlling protein association and subcellular localization with a synthetic ligand that induces heterodimerization of proteins. Proc. Natl. Acad. Sci. USA. 93:4604–4607. http ://dx .doi .org /10 .1073 /pnas .93 .10 .4604
Benjamin, J.M., A.V. Kwiatkowski, C. Yang, F. Korobova, S. Pokutta, T. Svitkina, W.I. Weis, and W.J. Nelson. 2010. αE-catenin regulates actin dynamics independently of cadherin-mediated cell-cell adhesion. J. Cell Biol. 189:339–352. http ://dx .doi .org /10 .1083 /jcb .200910041
Buckley, C.D., J. Tan, K.L. Anderson, D. Hanein, N. Volkmann, W.I. Weis, W.J. Nelson, and A.R. Dunn. 2014. Cell adhesion. The minimal cadherin-catenin complex binds to actin filaments under force. Science. 346:1254211. http ://dx .doi .org /10 .1126 /science .1254211
Cai, H., and P.N. Devreotes. 2011. Moving in the right direction: how eukaryotic cells migrate along chemical gradients. Semin. Cell Dev. Biol. 22:834–841. http ://dx .doi .org /10 .1016 /j .semcdb .2011 .07 .020
Catimel, B., M.X. Yin, C. Schieber, M. Condron, H. Patsiouras, J. Catimel, D.E. Robinson, L.S. Wong, E.C. Nice, A.B. Holmes, and A.W. Burgess. 2009. PI(3,4,5)P3 interactome. J. Proteome Res. 8:3712–3726. http ://dx .doi .org /10 .1021 /pr900320a
Chinthalapudi, K., E.S. Rangarajan, D.N. Patil, E.M. George, D.T. Brown, and T. Izard. 2014. Lipid binding promotes oligomerization and focal adhesion activity of vinculin. J. Cell Biol. 207:643–656. http ://dx .doi .org /10 .1083 /jcb .201404128
Cho, W. 2001. Membrane targeting by C1 and C2 domains. J. Biol. Chem. 276:32407–32410. http ://dx .doi .org /10 .1074 /jbc .R100007200
Daugherty, R.L., L. Serebryannyy, A. Yemelyanov, A.S. Flozak, H.J. Yu, S.T. Kosak, P. deLanerolle, and C.J. Gottardi. 2014. α-Catenin is an inhibitor of transcription. Proc. Natl. Acad. Sci. USA. 111:5260–5265. http ://dx .doi .org /10 .1073 /pnas .1308663111
on January 5, 2018jcb.rupress.org
Dow
nloaded from
JCB • Volume 216 • NumBer 11 • 20173782
Desai, R., R. Sarpal, N. Ishiyama, M. Pellikka, M. Ikura, and U. Tepass. 2013. Monomeric α-catenin links cadherin to the actin cytoskeleton. Nat. Cell Biol. 15:261–273. http ://dx .doi .org /10 .1038 /ncb2685
Dickinson, D.J., W.I. Weis, and W.J. Nelson. 2011. Protein evolution in cell and tissue development: going beyond sequence and transcriptional analysis. Dev. Cell. 21:32–34. http ://dx .doi .org /10 .1016 /j .devcel .2011 .06 .004
Drees, F., S. Pokutta, S. Yamada, W.J. Nelson, and W.I. Weis. 2005. α-catenin is a molecular switch that binds E-cadherin-β-catenin and regulates actin-filament assembly. Cell. 123:903–915. http ://dx .doi .org /10 .1016 /j .cell .2005 .09 .021
Engelman, J.A., P.A. Jänne, C. Mermel, J. Pearlberg, T. Mukohara, C. Fleet, K. Cichowski, B.E. Johnson, and L.C. Cantley. 2005. ErbB-3 mediates phosphoinositide 3-kinase activity in gefitinib-sensitive non-small cell lung cancer cell lines. Proc. Natl. Acad. Sci. USA. 102:3788–3793. http ://dx .doi .org /10 .1073 /pnas .0409773102
Escobar, D.J., R. Desai, N. Ishiyama, S.S. Folmsbee, M.N. Novak, A.S. Flozak, R.L. Daugherty, R. Mo, D. Nanavati, R. Sarpal, et al. 2015. α-Catenin phosphorylation promotes intercellular adhesion through a dual-kinase mechanism. J. Cell Sci. 128:1150–1165. http ://dx .doi .org /10 .1242 /jcs .163824
Fierro-González, J.C., M.D. White, J.C. Silva, and N. Plachta. 2013. Cadherin-dependent filopodia control preimplantation embryo compaction. Nat. Cell Biol. 15:1424–1433. http ://dx .doi .org /10 .1038 /ncb2875
Gassama-Diagne, A., W. Yu, M. ter Beest, F. Martin-Belmonte, A. Kierbel, J. Engel, and K. Mostov. 2006. Phosphatidylinositol-3,4,5-trisphosphate regulates the formation of the basolateral plasma membrane in epithelial cells. Nat. Cell Biol. 8:963–970. http ://dx .doi .org /10 .1038 /ncb1461
Gastinger, M.2015. Surface-surface colocalization. http ://open .bitplane .com /tabid /235 /Default .aspx ?id =111 (accessed August 31, 2017).
Hansen, S.D., A.V. Kwiatkowski, C.Y. Ouyang, H. Liu, S. Pokutta, S.C. Watkins, N. Volkmann, D. Hanein, W.I. Weis, R.D. Mullins, and W.J. Nelson. 2013. αE-catenin actin-binding domain alters actin filament conformation and regulates binding of nucleation and disassembly factors. Mol. Biol. Cell. 24:3710–3720. http ://dx .doi .org /10 .1091 /mbc .E13 -07 -0388
Hoelzle, M.K., and T. Svitkina. 2012. The cytoskeletal mechanisms of cell-cell junction formation in endothelial cells. Mol. Biol. Cell. 23:310–323. http ://dx .doi .org /10 .1091 /mbc .E11 -08 -0719
Imamura, Y., M. Itoh, Y. Maeno, S. Tsukita, and A. Nagafuchi. 1999. Functional domains of α-catenin required for the strong state of cadherin-based cell adhesion. J. Cell Biol. 144:1311–1322. http ://dx .doi .org /10 .1083 /jcb .144 .6 .1311
Ishiyama, N., N. Tanaka, K. Abe, Y.J. Yang, Y.M. Abbas, M. Umitsu, B. Nagar, S.A. Bueler, J.L. Rubinstein, M. Takeichi, and M. Ikura. 2013. An autoinhibited structure of α-catenin and its implications for vinculin recruitment to adherens junctions. J. Biol. Chem. 288:15913–15925. http ://dx .doi .org /10 .1074 /jbc .M113 .453928
Jacinto, A., W. Wood, S. Woolner, C. Hiley, L. Turner, C. Wilson, A. Martinez-Arias, and P. Martin. 2002. Dynamic analysis of actin cable function during Drosophila dorsal closure. Curr. Biol. 12:1245–1250. http ://dx .doi .org /10 .1016 /S0960 -9822(02)00955 -7
Jungmichel, S., K.B. Sylvestersen, C. Choudhary, S. Nguyen, M. Mann, and M.L. Nielsen. 2014. Specificity and commonality of the phosphoinositide-binding proteome analyzed by quantitative mass spectrometry. Cell Reports. 6:578–591. http ://dx .doi .org /10 .1016 /j .celrep .2013 .12 .038
Kadowaki, T., H. Shiozaki, M. Inoue, S. Tamura, H. Oka, Y. Doki, K. Iihara, S. Matsui, T. Iwazawa, A. Nagafuchi, et al. 1994. E-cadherin and α-cat-enin expression in human esophageal cancer. Cancer Res. 54:291–296.
Korobova, F., and T. Svitkina. 2008. Arp2/3 complex is important for filopodia formation, growth cone motility, and neuritogenesis in neuronal cells. Mol. Biol. Cell. 19:1561–1574. http ://dx .doi .org /10 .1091 /mbc .E07 -09 -0964
Koslov, E.R., P. Maupin, D. Pradhan, J.S. Morrow, and D.L. Rimm. 1997. α-catenin can form asymmetric homodimeric complexes and/or heterodimeric complexes with β-catenin. J. Biol. Chem. 272:27301–27306. http ://dx .doi .org /10 .1074 /jbc .272 .43 .27301
Kwiatkowski, A.V., S.L. Maiden, S. Pokutta, H.J. Choi, J.M. Benjamin, A.M. Lynch, W.J. Nelson, W.I. Weis, and J. Hardin. 2010. In vitro and in vivo reconstitution of the cadherin-catenin-actin complex from Caenorhabditis elegans. Proc. Natl. Acad. Sci. USA. 107:14591–14596. http ://dx .doi .org /10 .1073 /pnas .1007349107
Lewis, J.E., J.K. Wahl III, K.M. Sass, P.J. Jensen, K.R. Johnson, and M.J. Wheelock. 1997. Cross-talk between adherens junctions and desmosomes depends on plakoglobin. J. Cell Biol. 136:919–934. http ://dx .doi .org /10 .1083 /jcb .136 .4 .919
Lucas, N., and W. Cho. 2011. Phosphatidylserine binding is essential for plasma membrane recruitment and signaling function of 3-phosphoinositide-dependent kinase-1. J. Biol. Chem. 286:41265–41272. http ://dx .doi .org /10 .1074 /jbc .M111 .300806
Mattila, P.K., and P. Lappalainen. 2008. Filopodia: molecular architecture and cellular functions. Nat. Rev. Mol. Cell Biol. 9:446–454. http ://dx .doi .org /10 .1038 /nrm2406
McCrea, P.D., and C.J. Gottardi. 2016. Beyond β-catenin: prospects for a larger catenin network in the nucleus. Nat. Rev. Mol. Cell Biol. 17:55–64. http ://dx .doi .org /10 .1038 /nrm .2015 .3
McCrea, P.D., M.T. Maher, and C.J. Gottardi. 2015. Nuclear signaling from cadherin adhesion complexes. Curr. Top. Dev. Biol. 112:129–196. http ://dx .doi .org /10 .1016 /bs .ctdb .2014 .11 .018
McLaughlin, S., and D. Murray. 2005. Plasma membrane phosphoinositide organization by protein electrostatics. Nature. 438:605–611. http ://dx .doi .org /10 .1038 /nature04398
Miller, P.W., S. Pokutta, A. Ghosh, S.C. Almo, W.I. Weis, W.J. Nelson, and A.V. Kwiatkowski. 2013. Danio rerio αE-catenin is a monomeric F-actin binding protein with distinct properties from Mus musculus αE-catenin. J. Biol. Chem. 288:22324–22332. http ://dx .doi .org /10 .1074 /jbc .M113 .458406
Mulgrew-Nesbitt, A., K. Diraviyam, J. Wang, S. Singh, P. Murray, Z. Li, L. Rogers, N. Mirkovic, and D. Murray. 2006. The role of electrostatics in protein-membrane interactions. Biochim. Biophys. Acta. 1761:812–826. http ://dx .doi .org /10 .1016 /j .bbalip .2006 .07 .002
Narayan, K., and M.A. Lemmon. 2006. Determining selectivity of phosphoinositide-binding domains. Methods. 39:122–133. http ://dx .doi .org /10 .1016 /j .ymeth .2006 .05 .006
Obama, H., and M. Ozawa. 1997. Identification of the domain of α-catenin involved in its association with β-catenin and plakoglobin (γ-catenin). J. Biol. Chem. 272:11017–11020. http ://dx .doi .org /10 .1074 /jbc .272 .17 .11017
Obenauer, J.C., L.C. Cantley, and M.B. Yaffe. 2003. Scansite 2.0: proteome-wide prediction of cell signaling interactions using short sequence motifs. Nucleic Acids Res. 31:3635–3641. http ://dx .doi .org /10 .1093 /nar /gkg584
Palmer, S.M., M.P. Playford, S.W. Craig, M.D. Schaller, and S.L. Campbell. 2009. Lipid binding to the tail domain of vinculin: Specificity and the role of the N and C termini. J. Biol. Chem. 284:7223–7231. http ://dx .doi .org /10 .1074 /jbc .M807842200
Park, M.J., R. Sheng, A. Silkov, D.J. Jung, Z.G. Wang, Y. Xin, H. Kim, P. Thiagarajan-Rosenkranz, S. Song, Y. Yoon, et al. 2016. SH2 domains serve as lipid-binding modules for pTyr-signaling proteins. Mol. Cell. 62:7–20. http ://dx .doi .org /10 .1016 /j .molcel .2016 .01 .027
Pokutta, S., H.J. Choi, G. Ahlsen, S.D. Hansen, and W.I. Weis. 2014. Structural and thermodynamic characterization of cadherin·β-catenin·α-catenin complex formation. J. Biol. Chem. 289:13589–13601. http ://dx .doi .org /10 .1074 /jbc .M114 .554709
Postma, M., J. Roelofs, J. Goedhart, H.M. Loovers, A.J. Visser, and P.J. Van Haastert. 2004. Sensitization of Dictyostelium chemotaxis by phosphoinositide-3-kinase-mediated self-organizing signalling patches. J. Cell Sci. 117:2925–2935. http ://dx .doi .org /10 .1242 /jcs .01143
Rangarajan, E.S., and T. Izard. 2013. Dimer asymmetry defines α-catenin interactions. Nat. Struct. Mol. Biol. 20:188–193. http ://dx .doi .org /10 .1038 /nsmb .2479
Schneider, S., K. Herrenknecht, S. Butz, R. Kemler, and P. Hausen. 1993. Catenins in Xenopus embryogenesis and their relation to the cadher-in-mediated cell-cell adhesion system. Development. 118:629–640.
Shaner, N.C., P.A. Steinbach, and R.Y. Tsien. 2005. A guide to choosing fluorescent proteins. Nat. Methods. 2:905–909. http ://dx .doi .org /10 .1038 /nmeth819
Stahelin, R.V., and W. Cho. 2001. Differential roles of ionic, aliphatic, and aromatic residues in membrane-protein interactions: A surface plasmon resonance study on phospholipases A2. Biochemistry. 40:4672–4678. http ://dx .doi .org /10 .1021 /bi0020325
Stewart, D.B., and W.J. Nelson. 1997. Identification of four distinct pools of catenins in mammalian cells and transformation-dependent changes in catenin distributions among these pools. J. Biol. Chem. 272:29652–29662. http ://dx .doi .org /10 .1074 /jbc .272 .47 .29652
Svitkina, T. 2009. Imaging cytoskeleton components by electron microscopy. Methods Mol. Biol. 586:187–206. http ://dx .doi .org /10 .1007 /978 -1 -60761 -376 -3 _10
Tansey, W.P. 2006. Freeze-thaw lysis for extraction of proteins from mammalian cells. CSH Protoc. http ://dx .doi .org /10 .1101 /pdb .prot4614
van Hengel, J., L. Gohon, E. Bruyneel, S. Vermeulen, M. Cornelissen, M. Mareel, and F. von Roy. 1997. Protein kinase C activation upregulates intercellular adhesion of α-catenin-negative human colon cancer cell variants via induction of desmosomes. J. Cell Biol. 137:1103–1116. http ://dx .doi .org /10 .1083 /jcb .137 .5 .1103
Watabe-Uchida, M., N. Uchida, Y. Imamura, A. Nagafuchi, K. Fujimoto, T. Uemura, S. Vermeulen, F. van Roy, E.D. Adamson, and M. Takeichi. 1998. α-Catenin-vinculin interaction functions to organize the apical
on January 5, 2018jcb.rupress.org
Dow
nloaded from

α-Catenin homodimers in cell–cell adhesion • Wood et al. 3783
junctional complex in epithelial cells. J. Cell Biol. 142:847–857. http ://dx .doi .org /10 .1083 /jcb .142 .3 .847
Weekes, J., S.T. Barry, and D.R. Critchley. 1996. Acidic phospholipids inhibit the intramolecular association between the N- and C-terminal regions of vinculin, exposing actin-binding and protein kinase C phosphorylation sites. Biochem. J. 314:827–832. http ://dx .doi .org /10 .1042 /bj3140827
Yamada, S., S. Pokutta, F. Drees, W.I. Weis, and W.J. Nelson. 2005. Deconstructing the cadherin-catenin-actin complex. Cell. 123:889–901. http ://dx .doi .org /10 .1016 /j .cell .2005 .09 .020
Yin, H.L., and P.A. Janmey. 2003. Phosphoinositide regulation of the actin cytoskeleton. Annu. Rev. Physiol. 65:761–789. http ://dx .doi .org /10 .1146 /annurev .physiol .65 .092101 .142517
on January 5, 2018jcb.rupress.org
Dow
nloaded from

![Exploring the Involvement of NLRP3 and IL-1β in …downloads.hindawi.com/journals/mi/2019/2363460.pdfhand osteoarthritis [26] were recruited in the Rheumatol-ogy Unit of Siena Hospital](https://static.fdocument.org/doc/165x107/5f93c90a1258491ec9221a4a/exploring-the-involvement-of-nlrp3-and-il-1-in-hand-osteoarthritis-26-were-recruited.jpg)
![Joseph D. Meiring arXiv:0905.4473v2 [astro-ph.CO] 29 Jun 2009Joseph D. Meiring 1⋆, James T. Lauroesch , Varsha P. Kulkarni2, Celine P´eroux3, Pushpa Khare 4 , & Donald G. York 5,6](https://static.fdocument.org/doc/165x107/608c6568c679d1307b48aeb4/joseph-d-meiring-arxiv09054473v2-astro-phco-29-jun-2009-joseph-d-meiring.jpg)


![Diacylglycerol kinase ζ generates dipalmitoyl-phosphatidic ... · kinase C [6], and p21 activated protein kinase 1 [7,8].PAasan intracellular signaling lipid is generated by phosphorylation](https://static.fdocument.org/doc/165x107/5fe275ed0f93ac2b35696d07/diacylglycerol-kinase-generates-dipalmitoyl-phosphatidic-kinase-c-6-and.jpg)