Κοινωνική Συνοχή και Ανάπτυξη · 2012-11-09 · kΟΙΝΩΝΙΚΗ...
29
Κοινωνική Συνοχή και Ανάπτυξη Εξαμηνιαία Επιστημονική Επιθεώρηση, Άνοιξη 2011, τόμος 6ος, τεύχος 1 Social Cohesion and Development Biannual Scientific Review, Spring 2011, volume 6, issue 1 Sotiris Zartaloudis, Income inequality in Europe and the US: a partisan issue? Ioannis Vavouras, From sustainable development to green growth: The abandonment of the social character of development Vasiliki Kantzara, The relation of education to social cohesion Apostolos E. Xyraphis, Les choix managériaux de gestion des ressources humaines «âgées». Une approche comparative. Kyriakos Souliotis, Vasiliki Mantzana, Athanasios Sakorafas, Chrictina Golna, Charalambos Economou, Employment request in the healthcare sector: A case of a specialized not-for-profit hospital in Greece James Mahoney and Kathleen Thelen, Explaining institutional change: ambiguity, agency and power, (A. Roumpakis), Marlier, E., and Natali, D. (eds) with Rudi Van Dam, Europe 2020. Towards a more social EU?, (M. Angelaki) AΡΘΡΑ Articles ΒΙΒΛΙΟKΡΙΤΙΚΕΣ Book Reviews
Transcript of Κοινωνική Συνοχή και Ανάπτυξη · 2012-11-09 · kΟΙΝΩΝΙΚΗ...
Κοινωνική Συνοχή και Ανάπτυξη Εξαμηνιαία Επιστημονική
Επιθεώρηση, Άνοιξη 2011, τόμος 6ος, τεύχος 1
Social Cohesion and DevelopmentBiannual Scientific
Review, Spring 2011, volume 6, issue 1
Sotiris Zartaloudis, Income inequality in Europe and the US: a partisan issue?
Ioannis Vavouras, From sustainable development to green growth: The abandonment of the social character of development
Vasiliki Kantzara, The relation of education to social cohesion
Apostolos E. Xyraphis, Les choix managériaux de gestion des ressources humaines «âgées». Une approche comparative.
Kyriakos Souliotis, Vasiliki Mantzana, Athanasios Sakorafas, Chrictina Golna, Charalambos Economou, Employment request in the healthcare sector: A case of a specialized not-for-profit hospital in Greece
James Mahoney and Kathleen Thelen, Explaining institutional change: ambiguity, agency and power, (A. Roumpakis), Marlier, E., and Natali, D. (eds) with Rudi Van Dam, Europe 2020. Towards a more social EU?, (M. Angelaki)
AΡΘΡΑ Articles
ΒΙΒΛΙΟKΡΙΤΙΚΕΣBook Reviews
ISSN 1790-9368
KΣΑ6 | 1SCD
cove-issue11.indd 1cove-issue11.indd 1 28/9/2011 11:53:34 πμ28/9/2011 11:53:34 πμ
KΟΙΝΩΝΙΚΗ ΣΥΝΟΧΗ ΚΑΙ ΑΝΑΠΤΥΞΗΕξαμηνιαία Επιστημονική Επιθεώρηση
ΣΚΟΠOΣ. Η Κοινωνική Συνοχή και Ανάπτυξη (ΚΣΑ) είναι μια εξα-μηνιαία επιστημονική επιθεώρηση για την έρευνα και συζήτηση θεμάτων κοινωνικής πολιτικής, συνοχής και ανάπτυξης. Σκοπός της είναι η καλύτερη κατανόηση του ρόλου της κοινωνικής συνο-χής στη σύγχρονη ανάπτυξη και προώθηση της κοινωνικής δικαι-οσύνης στο εσωτερικό και μεταξύ των εθνών. Τα άρθρα που δη-μοσιεύονται καλύπτουν τα πεδία της ανάλυσης, του σχεδιασμού, της εφαρμογής των πολιτικών, της αξιολόγησης των αποτελεσμά-των τους, της συγκριτικής έρευνας, της ανάλυσης του ρόλου των διεθνών οργανισμών, των εθελοντικών, κοινωνικών, ιδιωτικών και τοπικών φορέων στην κοινωνική ανάπτυξη και πολιτική. Ει-δικότερα, η Επιθεώρηση φιλοξενεί άρθρα που αντιπροσωπεύουν ευρύ φάσμα γνωστικών πεδίων, όπως εργασιακές σχέσεις και απασχόληση, φτώχεια και κοινωνικός αποκλεισμός, συντάξεις και κοινωνική ασφάλιση, υγεία και κοινωνική φροντίδα, εκπαίδευση και κατάρτιση, πολιτικές για το παιδί, την οικογένεια και τα φύλα, μετανάστευση, εγκληματικότητα, εταιρική κοινωνική ευθύνη, καθώς και δραστηριότητες του τρίτου τομέα και της κοινωνίας πολιτών. Η Επιθεώρηση φιλοξενεί επιστημονικά άρθρα, βιβλιο-κριτικές και βιβλιoπαρουσιάσεις, σύντομες εκθέσεις ερευνητικών προγραμμάτων, είτε στα ελληνικά είτε στα αγγλικά. Ενθαρρύνει τη διεπιστημονική, συγκριτική και ιστορική προσέγγιση.
ΙΔΡΥΤΗΣ-ΕΚΔΟΤΗΣΘεόδωρος Σακελλαρόπουλος, Πάντειο Πανεπιστήμιο
ΣΥΝΤΑΚΤΙΚΗ ΕΠΙΤΡΟΠΗΝαπολέων Μαραβέγιας, Πανεπιστήμιο Αθηνών
Ανδρέας Μοσχονάς, Πανεπιστήμιο ΚρήτηςΘεόδωρος Σακελλαρόπουλος, Πάντειο Πανεπιστήμιο
ΕΠΙΣΤΗΜΟΝΙΚΟ ΣΥΜΒΟΥΛΙΟJos Berghman, Catholic University of Louven
Eberhard Eichenhofer, University of JenaKorel Goymen, Sabanci University, Istanbul
Ana Guillen, University of OviedoJohn Myles, University of Toronto
Κούλα Κασιμάτη, Πάντειο ΠανεπιστήμιοΘωμάς Κονιαβίτης, Πάντειο Πανεπιστήμιο
Σκεύος Παπαϊωάννου, Πανεπιστήμιο ΚρήτηςΆγγελος Στεργίου, Αριστοτέλειο Πανεπιστήμιο Θεσσαλονίκης
Λευτέρης Τσουλφίδης, Πανεπιστήμιο ΜακεδονίαςΔημήτρης Χαραλάμπης, Πανεπιστήμιο Αθηνών
Ιορδάνης Ψημμένος, Πάντειο ΠανεπιστήμιοJohn Veit-Wilson, University of Newcastle
ΕΠΙΣΤΗΜΟΝΙΚΗ ΓΡΑΜΜΑΤΕΙΑΧριστίνα Καρακιουλάφη, Πανεπιστήμιο Κρήτης
Χαράλαμπος Οικονόμου, Πάντειο Πανεπιστήμιο, Μανόλης Σπυριδάκης, Πανεπιστήμιο Πελοποννήσου
Ετήσια συνδρομή: 250 €
Εκδίδεται από την Επιστημονική Εταιρεία για την Κοινωνική Συνοχή και Ανάπτυξη
Φειδίου 18, Αθήνα 10678, Τηλ./Φαξ 210 3303060, E-mail: [email protected], [email protected]
ISSN: 1790-9368
SOCIAL COHESION AND DEVELOPMENTBiannual Scientif ic Review
AIMS AND SCOPE. Social Cohesion and Development (SCD) is a biannual interdisciplinary scientific journal for research and debate on social policy, social cohesion and social development issues. It aims to advance the understanding of social cohesion in the contemporary development and to promote social justice within and between the nations. Articles are covering policy analyses, developments and designs, evaluations of policy out-comes, comparative research, analyses of the role of interna-tional organizations, the voluntary, private and local agents in social development and policy. The journal provides comprehen-sive coverage of a wide range of social policy and development issues, such as labour market and employment policies, pov-erty and social exclusion, ageing, pensions and social security, health and social care, education and training, family, gender and child policies, migration, crime and corporate responsibil-ity, as well as civil society and third sector activities. The Review welcomes scholarly articles, book reviews and short research reports, in Greek or English. It encourages a multidisciplinary, comparative and historical approach.
FOUNDER-EDITORTheodoros Sakellaropoulos, Panteion University, AthensEDITORIAL BOARDNapoleon Maravegias, National University of AthensAndreas Moschonas, University of Crete Theodoros Sakellaropoulos, Panteion University, Athens SCIENTIFIC ADVISORY BOARDJos Berghman, Catholic University of LouvenDimitris Charalambis, University of AthensThomas Coniavitis, Panteion University, AthensEberhard Eichenhofer, University of JenaKorel Goymen, Sabanci University, IstanbulAna Guillen, University of OviedoKoula Kasimati, Panteion University, AthensJohn Myles, University of TorontoSkevos Papaioannou, University of CreteIordanis Psimmenos, Panteion University,Aggelos Stergiou, Aristotle University of ThessalonikiLefteris Tsoulfidis, University of MacedonianJohn Veit-Wilson, University of NewcastleSCIENTIFICL SECRETARIATChristina Carakioulafi, University of CreteCharalambos Economou, Panteion UniversityManolis Spiridakis, University of Peloponnese
Annual Subscription: 250 €
Published by the Society for Social Cohesion and Development,
Athens 10678, 18 Fidiou str., Greece, Tel./Fax 003 210 3303060, E-mail: [email protected], [email protected]
ISSN: 1790-9368
NOTES FOR CONTRIBUTORS
Papers should be written in Greek or English. It is assumed that submitted articles have not been published elsewhere and that they are not under consideration for publication by other journals. The authors should state whether they are publishing related articles else-where. Authors must submit four identical copies and an identical electronic version of their papers to the following address and e-mail of the editor: Theodoros SakellaropoulosFeidiou 18, Athens, 10678, GreeceE-mail: [email protected], [email protected]
Papers accepted for review are evaluated anonymously by at least two referees. Therefore, along with the full paper (title, text, references) author’s name and address as well as the paper’s title should be submitted separately on a covering page. Papers should include an abstract of not more than 100 words and five key words, both in Greek and English. Articles should be between 6,000 and 8,000 words in length including abstracts and references. Manuscripts will not be returned to the author if rejected.
References to publications should be given according to the Harvard system which in the text cites authors and year of publication, e.g. (Esping-Andersen 1990; Kleinman and Piachaud, 1993). Page number(s) should be given for all direct quotations, e.g. (Ferrera et al., 2002: 230). If there is more than one reference to the same author and year, they should be distinguished by the use of a, b, c etc., added to the year. References should also be listed alphabetically at the end of the paper in a List of References (not Bibliography). Authors are particularly requested to ensure that each text reference appears in the list, and vice versa. References to books should always give the city of publication and publisher as well as author and title de-tails. For example: Scharpf, F. (1999) Governing in Europe: Effective and Democratic? Oxford: Oxford University Press. Reference to journal articles should give volume, issue and page num-bers, and the name of the article enclosed in single quotation marks. For example: Atkinson, A.B., Marlier, E. and Nolan, B. (2004) ‘Indicators and Targets for Social Inclusion in the Eu-ropean Union’, Journal of Common Market Studies 42: 47-75. References to chapters within multi-authored publications should be listed with the chapter title in single quotation marks followed by the author and title of the publication. For example: Leibfried, S. and Pierson, P. (1995) ‘Semisovereign welfare states: social policy in a multitiered Europe’, in Leibfried S. and Pierson P., (eds.), European Social Policy: Between Fragmentation and Integration, p.p. 43-77. Washington D.C.: The Brookings Institution. Book and journal titles should be in italics. Explanatory notes should be kept to a minimum. If it is necessary to use them, they must be numbered consecutively in the text and listed at the end of the paper. Any acknowledgements should appear at the end of the text. Papers that do not conform to the aforementioned style will be returned to the authors for revision.
Book Reviews: Please send to Andreas Moschonas, Book Review editor, at the address of the Publishing House.
Social Cohesion and Development is published twice a year (Spring/Autumn) by the Society for Social Cohesion and Development.
Printed and distributed by Dionicos Publishers, 10678, Athens, Fidiou str. 18, Greece, tel. / fax: 003 210 3801777, e-mail: [email protected].
cove-issue11.indd 2cove-issue11.indd 2 28/9/2011 11:53:38 πμ28/9/2011 11:53:38 πμ
Κοινωνική Συνοχή και ΑνάπτυξηSocial Cohesion and
Development
issue11.indd 1issue11.indd 1 28/9/2011 11:51:15 πμ28/9/2011 11:51:15 πμ

issue11.indd 2issue11.indd 2 28/9/2011 11:51:19 πμ28/9/2011 11:51:19 πμ
Sotiris Zartaloudis, Income inequality in Europe and the US: a partisan issue?
Ioannis Vavouras, From sustainable development to green growth: The abandonment of the social character of development
Vasiliki Kantzara, The relation of education to social cohesion
Apostolos E. Xyraphis, Les choix managériaux de gestion des ressources humaines «âgées». Une approche comparative
Kyriakos Souliotis, Vasiliki Mantzana, Athanasios Sakorafas, Chrictina Golna, Charalambos Economou, Employment request in the healthcare sector: A case of a specialized not-for-profit hospital in Greece
James Mahoney and Kathleen Thelen, Explaining institutional change: ambiguity, agency and power, (A. Roumpakis), Marlier, E., and Natali, D. (eds) with Rudi Van Dam, Europe 2020. Towards a more social EU?, (M. Angelaki)
AΡΘΡΑ Articles
ΒΙΒΛΙΟΚΡΙΤΙΚΕΣBook Reviews
5-25
27-35
37-50
51-68
69-77
79-83
Περιεχόμενα | ContentsΚοινωνική Συνοχή και Ανάπτυξη 2011 6 (1), 3 Social Cohesion and Development 2011 6 (1), 3
issue11.indd 3issue11.indd 3 28/9/2011 11:51:19 πμ28/9/2011 11:51:19 πμ

issue11.indd 4issue11.indd 4 28/9/2011 11:51:19 πμ28/9/2011 11:51:19 πμ
Άρθρα | Articles
Income inequality in Europe and the US: a partisan issue?
Sotiris Zartaloudis, Hellenic Observatory, European Institute
London School of Economics and Political Science
Εισοδηματικές ανισότητες στην Ευρώπη και τις ΗΠΑ. Ένα πολιτικό-ιδεολογικό ζήτημα?
Σωτήρης Ζαρταλούδης, Ελληνικό Παρατηρητήριο, Ευρωπαϊκό Ινστιτούτο,
London School of Economics and Political Science
ΠΕΡIΛΗΨΗΑυτό το άρθρο εξετάζει τα επίπεδα, τάσεις και αιτίες της εισοδηματικής ανισότητας στην Ευρώπη και τις ΗΠΑ. Από την μία πλευρά, διαπιστώνεται ότι αν και η ανισό-τητα του καθαρού εισοδήματος (εισόδημα αγοράς) έχει γενικά αυξηθεί, αυτό συνέβει περισσότερο σε ορισμέ-νες χώρες και λιγότερο σε άλλες. Από την άλλη πλευρά, η ανισότητα διαθέσιμου εισοδήματος έχει μια αινιγματι-κή ιδιόρρυθμη εξέλιξη. Η εν λόγω ανισότητα είναι υψη-λότερη στις ΗΠΑ από τον ευρωπαϊκό μέσο όρο, ενώ στην Ευρώπη υπάρχουν τρεις ομάδες χωρών: οι χώρες της Μεσογείου και της Κεντρικής και Ανατολικής Ευρώ-πης (ΚΑΕ), έχουν την υψηλότερη ανισότητα διαθέσιμου εισοδήματος -με το Ηνωμένο Βασίλειο να είναι η μόνη πλούσια χώρα της ΕΕ που ανήκει σε αυτή την ομάδα. Οι χώρες της ηπειρωτικής Ευρώπης έχουν μέση έως χαμη-λή ανισότητα, ενώ η χαμηλότερη βρίσκεται στις Σκανδι-ναβικές χώρες. Οι μόνες εξαιρέσεις σε αυτή ταξινόμηση είναι κάποιες χώρες της Ανατολικής Ευρώπης που ανή-κουν στην ομάδα με την ελάχιστη ανισότητα διαθέσιμου εισοδήματος. Υποστηρίζεται ότι η καλύτερη εξήγηση για αυτή την κατάταξη και την ιστορική εξέλιξη των εθνικών ανισοτήτων διαθέσιμου εισοδήματος, είναι η διαφο-ρετική εθνική δημόσια πολιτική, δηλαδή, οι δημόσιες αναδιανεμητικές πολιτικές, τα διαφορετικά φορολογικά συστήματα και οι εισφορές κοινωνικής ασφάλισης, που απορρέει από την πολιτική ιδεολογία του κυβερνώντος κόμματος, τη συνολική αποτελεσματικότητα και τη γεν-ναιοδωρία των αναδιανεμητικών πολιτικών.
ΛΕΞΕΙΣ-ΚΛΕΙΔΙΑ: Eισοδηματικές ανισότητες, Ευρώπη, ΗΠΑ, κόμματα, ιδεολογία, αναδιανομή
ABSTRACTThis paper discusses the levels, trends and causes of income inequality in Europe and the US. On the one hand, it finds that although market income inequality has generally risen, it did so more in some countries and less in others. On the other hand, disposable income inequality has had a puzzling irregular development. The latter is higher in the US, whereas in Europe three clusters of countries exist: Mediterranean and Central and Eastern European (CEE) countries have the highest disposable income inequality –with the UK being the only rich EU country belonging to this group. Continental Europe has medium to low inequality while the lowest is found in the Scandinavian ones. The only exceptions to this ranking are some of the CEEs who belong to the group with the lowest disposable income inequality. It is argued that the best explanation for this classification and the national disposable income inequalities’ history is the different national public policy, that is, national redistributive policies, different taxation systems and social security contributions, which stems from the political ideology of the ruling party, the overall effectiveness and generosity of redistributive policies.
KEY WORDS: Income inequalities, Europe, USA, political parties, ideology, redistribution
Κοινωνική Συνοχή και Ανάπτυξη 2011 6 (1), 5-25Social Cohesion and Development 2011 6 (1), 5-25
issue11.indd 5issue11.indd 5 28/9/2011 11:51:19 πμ28/9/2011 11:51:19 πμ
[6] ΚΟΙΝΩΝΙΚΗ ΣΥΝΟΧΗ ΚΑΙ ΑΝΑΠΤΥΞΗ
Introduction1
I ncome inequality is a characteristic of all countries throughout the history. Big gaps in pay resulting in a coexistence of extreme wealth and poverty,2 not only within a country but also
between countries, create an unequal world where the feeling of injustice becomes prevalent. Unsurprisingly, after the beginning of the ‘credit crunch’, that is, the global financial turmoil and the subsequent recession, the issues of poverty and inequality are increasingly becoming a matter of public debate and concern. Especially in the western world (US and EU) there is a growing fear that globalisation increases inequality, primarily through the relocation of economic activity to countries with cheaper labour costs, leading to unemployment and poverty.
The first part of this paper, briefly discusses some conceptual and methodological issues on defining and measuring income inequality. The second critically assesses the popular explanations of inequality. Finally, the third discusses the available empirical evidence regarding income inequality in Europe and proposes that disposable income inequality levels are related to public policy choices of national governments in public policy (namely public transfers, taxes and social security contributions), which stem from the political ideology of the ruling party.
1. Multiple and different ‘inequalities’: varying definitions and measurement
T he study of inequality faces significant challenges due to the controversial nature of the relevant literature. First, inequality is a multi-faceted notion which refers not only to differences in
income but also in education, attainment, health, opportunities, capabilities (Sen, 1992), access to advantage (Cohen, 1993) and wellbeing (Callinicos, 2000). For many of these aspects of inequality, measurement is quite difficult, if not impossible (i.e. equality of capabilities or opportunities). Second, and more importantly, studies of inequality use different definitions of inequality, and concepts of wellbeing. Third, the reference unit varies significantly in the literature as it may be the individual income earner, the tax unit, the related or extended family or the household. The latter is also multi-defined in different databases and studies.3 Fourth, there is a conceptual disagreement on which type of inequality should one examine: some studies examine market income inequality (income from earnings, self employment, capital and private transfers) while others disposable income inequality (the available income after taxes and transfers).4 Another significant controversy, furthermore, lies on the data, and method of collection: some studies use national sources (national tax records, statistics, surveys etc) while others rely on international data bases such as the Luxembourg Income Study (LIS),5 the OECD, and the Eurostat. Both approaches have advantages and disadvantages. On the one hand, national sources provide richer evidence for longer periods. However, the data cannot be used for cross-country comparisons, due to significant differences in data collection, concepts and measurements. On the other hand, international sources provide evidence that is compiled by the same method, the same definitions and measurements, making comparison possible and meaningful. Nonetheless, the data goes back only a few decades, making the study of long term trends impossible.
From the aforementioned, it is clear that reaching widely accepted conclusions is difficult. Rather, a set of methodological choices have to be made that will not be accepted by everyone involved in inequality studies. In this paper, in order to avoid conceptual and methodological
issue11.indd 6issue11.indd 6 28/9/2011 11:51:19 πμ28/9/2011 11:51:19 πμ
SOCIAL COHESION AND DEVELOPMENT [7]
pitfalls, some of the most widely accepted and frequently employed definitions and data in measuring inequality are used. For income, this paper employs one of the most widely accepted concepts of “disposable cash income”.6 Inequality is measured with three of the most widely used indicators, that is, the Gini coefficient, the income at the bottom and top 10th percentiles, also known as decile ratio (90/10),7 and the interquintile ratio (S80/S20).8 The reference unit for all data is the household.9 Finally, none of the data, figures and estimates includes benefits in kind or indirect taxes.
2. Existing explanations: merits and shortcomings
T he most prominent10 explanation for current levels of inequality is that there has been a shift in demand away from unskilled towards skilled labour. This is associated with increased
competition from newly industrialising countries as a result of globalisation, technical change biased towards skilled labour, or because both of these factors operate in conjunction. The reduced demand for less skilled labour means that, with relative supplies of the two kinds of worker fixed in the short run, in a free labour market there will be a rise in the premium for skilled workers and a decline in the relative wage of unskilled workers (Atkinson, 2003: 494). Advocates of this hypothesis claim that it explains not only the rising wage dispersion in the US but also the higher unemployment in Europe. This hypothesis has received extended criticism for its assumptions, and it is regarded by some as an oversimplification (ibid: 495). In a nutshell, critics claim that this hypothesis holds only if we assume two parallel universes with two trading regions (in one case the US and NIC, and in the other Europe and NIC); it does not hold when we examine simultaneously the three trading unions because in each possible scenario only one rich region is affected in terms of wage and trade levels.11
Moreover, both parts of this textbook hypothesis are problematic even when examined separately. First, the Skill-biased Technical Change hypothesis is time inconsistent as it cannot explain why the sharp rise in investment in information technology in the 1990s was not accompanied by a higher rate of increase in wage inequality – in fact inequality grew faster in the early 1980s. Second, it is almost falsified if applied to the inequality levels between the wages of workers in the middle of the distribution, as they have grown more slowly than the wages of workers at the lower end of the distribution, even though, of the two groups, workers in the middle of the distribution are typically the better educated (Autor, et al., 2006; Autor, et al., 2003; Gordon and Becker, 2007).
The second part of the textbook explanation is the globalisation hypothesis. Under the heading of globalisation a number of variables are grouped. The first is immigration: increased immigration – especially of low-skilled people - means that labour markets have a surplus of workers at the bottom of the distribution. This increases inequality for two main reasons. On the one hand, it leads to an increase in the relative size of the low-wage work force (Lerman, 1999). On the other hand, it enhances competition between low-skilled workers - not only between immigrants and native born (Borjas, 2003; 2006; Borjas and Katz, 2005) but also between immigrants themselves as the flow of new workers continues (Ottaviano and Peri, 2006). Nevertheless, most of these studies are based on insufficient data and can explain only a very small percent of inequality.12 What is more, according to the US CPS data, the unskilled did better in the 1990s than in the 1980s, although the percentage of foreign-born workers doubled
issue11.indd 7issue11.indd 7 28/9/2011 11:51:19 πμ28/9/2011 11:51:19 πμ
[8] ΚΟΙΝΩΝΙΚΗ ΣΥΝΟΧΗ ΚΑΙ ΑΝΑΠΤΥΞΗ
in the 1990s, and the CPS 50–10 ratio for all workers declined slightly from1984 to 2004 despite the increased wave of immigration (Mishel et al., 2006).
The second variable under the globalisation hypothesis is international trade, which, on the one hand, has reduced the profitability and hence the demand for labour in a number of industries that employed relatively more low-skilled workers (Borjas et al., 1997; Sachs and Shatz, 1994, and on the other hand, has increased the potential markets for other domestic industries, leading to higher demand and thus higher real wages for workers in those industries. Further, trade has diverted investment from domestic facilities to foreign direct investment through the outsourcing abroad of a number of activities - especially low-skilled manufacturing jobs - leading to lower salaries in the remaining companies and thus increasing market income inequality (Bernanke, 2007). Again, empirical studies challenge this argument, arguing that trade-induced job losses and trade in general had only a marginal effect on the US income distribution (Mishel et al., 2006). Finally, if globalisation was indeed the source of more or less inequality around the world, this would imply common patterns of inequality over time and within countries. However, the opposite is true, since there are very few common inequality trends and levels while the ranking of the countries in terms of their inequality situation remains the same.
A related explanation for the rise of US inequality is the Great Compression (Goldin and Margo, 1992). This hypothesis claims that inequality patterns are explained by three covariant factors: the role of the trade unions, trade and immigration. In short, the Great Compression thesis argues that income inequality remained low during 1940-1970 due to the high degree of unionisation accompanied with decline in trade and immigration. However, as shown above, the last two variables seem not to have an extensive impact on inequality. Moreover, the significance of the unions is debatable as empirical evidence13 shows that the decline of unionisation can explain only a tiny part of inequality trends – mainly for male workers.
In addition, scholars studying US inequality have suggested that levels of income inequality are related to the level of the minimum wage.14 Empirical evidence confirms this, not only for the entire labour force, but especially for women (Mishel et al., 2006). However, the real value of the minimum wage and the proportion of the labour force that is unionised has been fairly flat in US the recent years which suggests that these institutional factors have been less important sources of increasing wage inequality recently than they were in the 1970s and 1980s (Bernanke, 2007).
Contrary to the aforementioned, many scholars examine not the bottom but the very top end of the distribution.15 The main focus is on the pay of CEOs, which rose significantly during the last decades, and on the rise of “superstars”, that is, a small number of the most gifted singers, actors, celebrities and athletes (Rosen, 1981). Recent examples are the TV host Oprah Winfrey ($275m per year), George Lucas ($170m per year), Steven Spielberg ($150m per year) and Madonna along golf player Tiger Woods both earning $110m per year (Miller et al., 2009). There is a fierce debate as to why the CEOs’ pay rise occurred, but it is definitely a reason for the increase in income inequality. For “superstars”, there seems to be a consensus behind the SBTC and globalisation explanations. In this view, superstars have enormously benefited from recent technological innovations (cable and satellite TV, internet, downloadable music, videos and DVDs) and globalisation, because they can reach a global audience with the same effort as before.
These theories, however, neglect public policies’ role and as they assume them to be constant. In one of the most thorough studies of top incomes, it is argued that, contrary to Kuznets’s U-shape explanation of declining inequality during the first half of the 20th century, inequality declined because capital owners incurred severe shocks to their capital holding during the 1914 to 1945 period because of the two world wars and the Great Depression (Atkinson and Piketty,
issue11.indd 8issue11.indd 8 28/9/2011 11:51:19 πμ28/9/2011 11:51:19 πμ
SOCIAL COHESION AND DEVELOPMENT [9]
2007: 10). As regards to the non-recovery of top capital incomes during the post-1945 period, the authors suggest that the previous capital shocks had a permanent impact because of the introduction of high income and estate tax progressivity.16 Indeed, there is a significant long-run impact of tax progressivity on wealth concentration – significant enough to explain the magnitude of the observed changes (Piketty, 2003; 2007).
In all countries, furthermore, top-income inequality declined for the most part during the period from1914 to 1945, and according to the authors most of the decline seems to be due to the fall in top capital incomes. The different trends in top-income inequality levels across countries support Atkinson and Piketty’s capital shock and progressive taxation explanation: the 1914 to 1945 drop was larger in countries that were strongly hit by the war (e.g. France and Germany) than in the US, while there was no drop at all in countries relatively immune to the war’s impact (e.g. Switzerland). Moreover, wealth concentration seems to have better recovered during the post-war period in countries with less tax progressivity (especially estate tax) such as Germany. Although every country has its own particularities, there is an important distinction to be made between rich countries for the post-1970 period. On the one hand, the Anglo-Saxon block17 where there was a sudden rise in top wages and top income shares – with the US being the outlier with an enormous increase.18 On the other hand, in the continental European countries19 top income shares remained fairly stable (ibid, 2007: 11-12). However, one should not exaggerate the importance of capital income on the overall patterns of inequality. Albeit important for top incomes, for the mass of the population the single most important element is market and disposable income (Atkinson, 2007: 10). This is the focus of the following section.
3. The facts of income inequality in Europe and the US
I n this section income inequality levels in Europe and the US are discussed. Two crucial aspects of income are examined - market income and disposable income - in order to examine the
impact of public policy on inequality levels, whereas both faces of inequality are studied: the snapshot image for the most recent year available, and its ‘history’ over the last century with a particular focus on the period since the 1960s. For market income and disposable income inequalities we use only the LIS database and measurements because it is the only available source which provides consistent data for many countries. For the snapshot image we use also the Eurostat Union Statistics on Income and Living Conditions database20 because it provides data for a much more recent year of reference (2007) compared to the LIS (2000 for most countries). For the trends, the analysis is based on data and secondary evidence (such as studies and reports) that use national sources. Hence, inequality trends are not directly comparable across countries. The evidence presented below challenges the dominant and popular explanations of inequality such as globalisation, information and communication technologies or skill-biased technical change, since inequality trends are consistent with each country’s public policy which is determined by the partisan choices of national governments. In other words, it will be argued that current levels of disposable income inequality are not related primarily with some external or internal socio-economic factors, but with the national public policies’ efficiency, goals and orientation. In countries where national governments aimed at designing public policy in order to reduce income inequality and successfully implemented their policies, disposable income inequality is low; on the contrary, in countries where either national governments did not promote redistributive policies, and/or they were unable to implement such policies inequality is high.
issue11.indd 9issue11.indd 9 28/9/2011 11:51:19 πμ28/9/2011 11:51:19 πμ
[10] ΚΟΙΝΩΝΙΚΗ ΣΥΝΟΧΗ ΚΑΙ ΑΝΑΠΤΥΞΗ
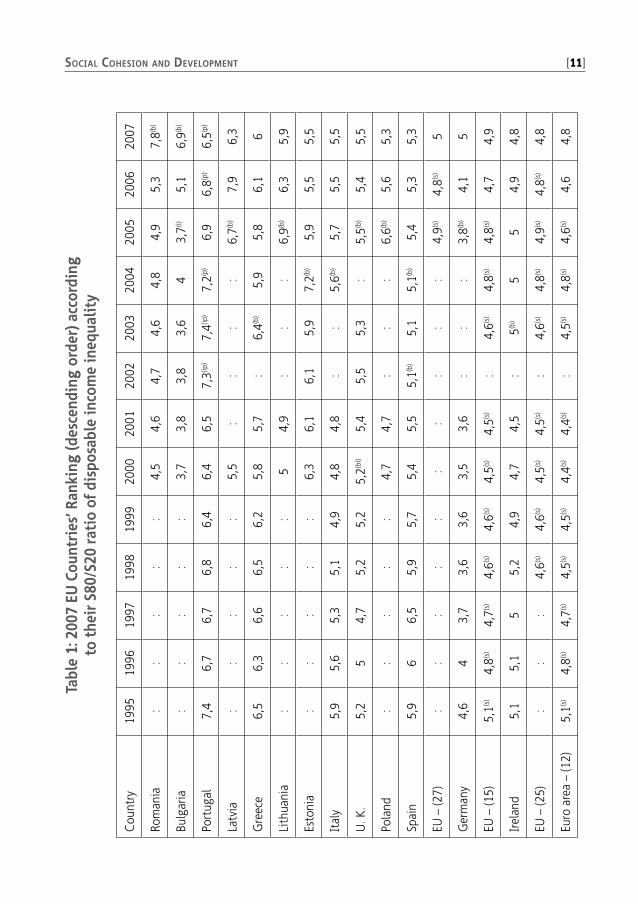
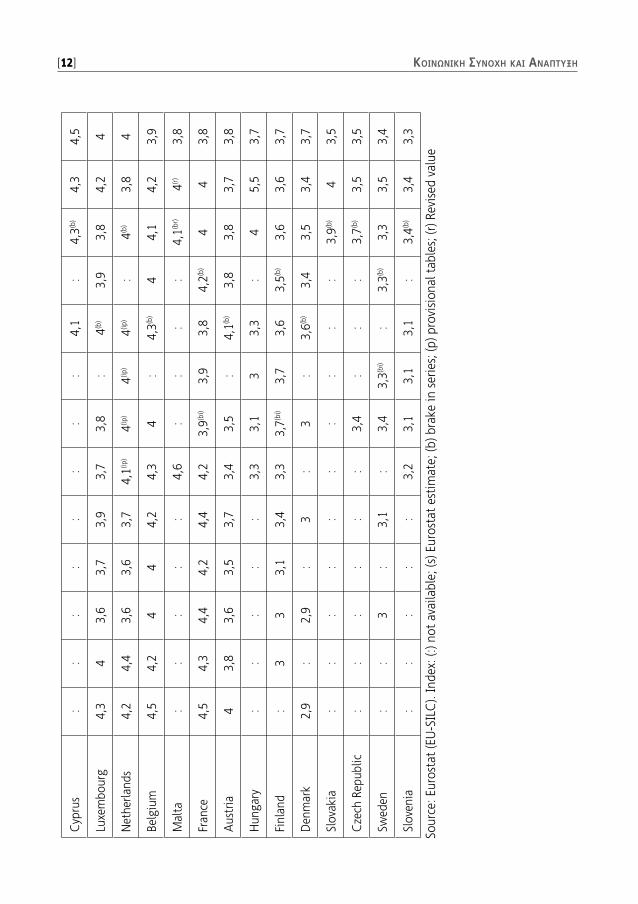
3.1. Cross-national differences in disposable income inequalityAccording to the EU-SILC database for 2007, the most unequal country in the EU is Romania and the least unequal Slovenia. Overall, this ‘static’ picture paints a rather clustered image in regard to Europe’s income inequality: at the top end we find the latest EU entrants (Romania and Bulgaria), the Baltic countries (Latvia, Lithuania, and Estonia), and the big four South European Countries (SECs) (Portugal, Greece, Spain and Italy); around or just below the EU-27 average we find the Continental European countries (CEEs) whereas at the bottom end of the inequality ladder we find the Scandinavian countries and most of the Central and Eastern European countries. Of course, as in any clustering effort, there are some exceptions: Cyprus and Malta are grouped along with the Continental European countries; Poland and Germany have higher inequality than their geographical ‘group’; finally, the UK is a ‘double outlier’: first, the UK interquintile ratio is much higher than the Irish one, which places Ireland among the Continental countries; second, the UK is the only rich EU country with a higher than average 80/20 ratio even though Germany is rapidly approaching similar levels of income inequality.
issue11.indd 10issue11.indd 10 28/9/2011 11:51:19 πμ28/9/2011 11:51:19 πμ
SOCIAL COHESION AND DEVELOPMENT [11]Ta
ble
1: 2
007
EU C
ount
ries
’ Ran
king
(des
cend
ing
orde
r) a
ccor
ding
to
the
ir S
80/S
20 ra
tio
of d
ispo
sabl
e in
com
e in
equa
lity
Cou
ntry
1995
1996
1997
1998
1999
2000
2001
2002
2003
2004
2005
2006
2007
Rom
ania
::
::
:4,
54,
64,
74,
64,
84,
95,
37,
8(b)
Bulg
aria
::
::
:3,
73,
83,
83,
64
3,7(i)
5,1
6,9(b
)
Port
ugal
7,4
6,7
6,7
6,8
6,4
6,4
6,5
7,3(ip
)7,
4(ip)
7,2(p
)6,
96,
8(p)
6,5(p
)
Latv
ia:
::
::
5,5
::
::
6,7(b
)7,
96,
3
Gre
ece
6,5
6,3
6,6
6,5
6,2
5,8
5,7
:6,
4(b)
5,9
5,8
6,1
6
Lith
uani
a:
::
::
54,
9:
::
6,9(b
)6,
35,
9
Esto
nia
::
::
:6,
36,
16,
15,
97,
2(b)
5,9
5,5
5,5
Ital
y5,
95,
65,
35,
14,
94,
84,
8:
:5,
6(b)
5,7
5,5
5,5
U. K
. 5,
25
4,7
5,2
5,2
5,2(b
i)5,
45,
55,
3:
5,5(b
)5,
45,
5
Pola
nd:
::
::
4,7
4,7
::
:6,
6(b)
5,6
5,3
Spai
n5,
96
6,5
5,9
5,7
5,4
5,5
5,1(b
)5,
15,
1(b)
5,4
5,3
5,3
EU –
(27)
::
::
::
::
::
4,9(s
)4,
8(s)
5
Ger
man
y4,
64
3,7
3,6
3,6
3,5
3,6
::
:3,
8(b)
4,1
5
EU –
(15)
5,1(s
)4,
8(s)
4,7(s
)4,
6(s)
4,6(s
)4,
5(s)
4,5(s
):
4,6(s
)4,
8(s)
4,8(s
)4,
74,
9
Irel
and
5,1
5,1
55,
24,
94,
74,
5:
5(b)
55
4,9
4,8
EU –
(25)
::
:4,
6(s)
4,6(s
)4,
5(s)
4,5(s
):
4,6(s
)4,
8(s)
4,9(s
)4,
8(s)
4,8
Euro
are
a –
(12)
5,1(s
)4,
8(s)
4,7(s
)4,
5(s)
4,5(s
)4,
4(s)
4,4(s
):
4,5(s
)4,
8(s)
4,6(s
)4,
64,
8
issue11.indd 11issue11.indd 11 28/9/2011 11:51:19 πμ28/9/2011 11:51:19 πμ
[12] ΚΟΙΝΩΝΙΚΗ ΣΥΝΟΧΗ ΚΑΙ ΑΝΑΠΤΥΞΗ C
ypru
s:
::
::
::
:4,
1:
4,3(b
)4,
34,
5
Luxe
mbo
urg
4,3
43,
63,
73,
93,
73,
8:
4(b)
3,9
3,8
4,2
4
Net
herla
nds
4,2
4,4
3,6
3,6
3,7
4,1(ip
)4(ip
)4(ip
)4(ip
):
4(b)
3,8
4
Belg
ium
4,5
4,2
44
4,2
4,3
4:
4,3(b
)4
4,1
4,2
3,9
Mal
ta:
::
::
4,6
::
::
4,1(b
r)4(r)
3,8
Fran
ce4,
54,
34,
44,
24,
44,
23,
9(bi)
3,9
3,8
4,2(b
)4
43,
8
Aus
tria
43,
83,
63,
53,
73,
43,
5:
4,1(b
)3,
83,
83,
73,
8
Hun
gary
::
::
:3,
33,
13
3,3
:4
5,5
3,7
Finl
and
:3
33,
13,
43,
33,
7(bi)
3,7
3,6
3,5(b
)3,
63,
63,
7
Den
mar
k2,
9:
2,9
:3
:3
:3,
6(b)
3,4
3,5
3,4
3,7
Slov
akia
::
::
::
::
::
3,9(b
)4
3,5
Cze
ch R
epub
lic:
::
::
:3,
4:
::
3,7(b
)3,
53,
5
Swed
en:
:3
:3,
1:
3,4
3,3(b
i):
3,3(b
)3,
33,
53,
4
Slov
enia
::
::
:3,
23,
13,
13,
1:
3,4(b
)3,
43,
3
Sour
ce: E
uros
tat
(EU
-SIL
C).
Inde
x: (:
) not
ava
ilabl
e; (s
) Eur
osta
t es
tim
ate;
(b) b
rake
in s
erie
s; (p
) pro
visi
onal
tab
les;
(r) R
evis
ed v
alue
issue11.indd 12issue11.indd 12 28/9/2011 11:51:19 πμ28/9/2011 11:51:19 πμ
SOCIAL COHESION AND DEVELOPMENT [13]
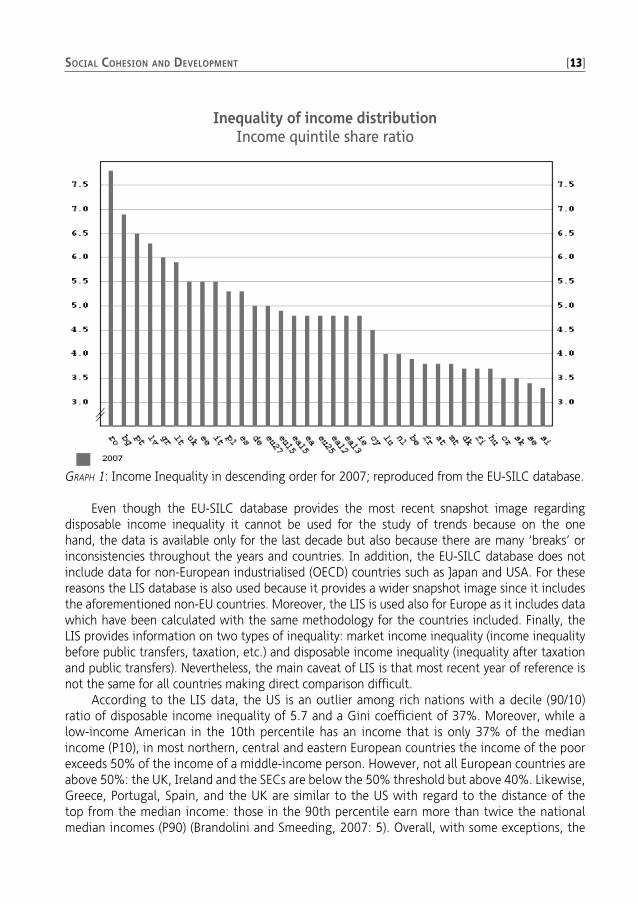
Inequality of income distribution Income quintile share ratio
GRAPH 1: Income Inequality in descending order for 2007; reproduced from the EU-SILC database.
Even though the EU-SILC database provides the most recent snapshot image regarding disposable income inequality it cannot be used for the study of trends because on the one hand, the data is available only for the last decade but also because there are many ‘breaks’ or inconsistencies throughout the years and countries. In addition, the EU-SILC database does not include data for non-European industrialised (OECD) countries such as Japan and USA. For these reasons the LIS database is also used because it provides a wider snapshot image since it includes the aforementioned non-EU countries. Moreover, the LIS is used also for Europe as it includes data which have been calculated with the same methodology for the countries included. Finally, the LIS provides information on two types of inequality: market income inequality (income inequality before public transfers, taxation, etc.) and disposable income inequality (inequality after taxation and public transfers). Nevertheless, the main caveat of LIS is that most recent year of reference is not the same for all countries making direct comparison difficult.
According to the LIS data, the US is an outlier among rich nations with a decile (90/10) ratio of disposable income inequality of 5.7 and a Gini coefficient of 37%. Moreover, while a low-income American in the 10th percentile has an income that is only 37% of the median income (P10), in most northern, central and eastern European countries the income of the poor exceeds 50% of the income of a middle-income person. However, not all European countries are above 50%: the UK, Ireland and the SECs are below the 50% threshold but above 40%. Likewise, Greece, Portugal, Spain, and the UK are similar to the US with regard to the distance of the top from the median income: those in the 90th percentile earn more than twice the national median incomes (P90) (Brandolini and Smeeding, 2007: 5). Overall, with some exceptions, the
issue11.indd 13issue11.indd 13 28/9/2011 11:51:20 πμ28/9/2011 11:51:20 πμ
[14] ΚΟΙΝΩΝΙΚΗ ΣΥΝΟΧΗ ΚΑΙ ΑΝΑΠΤΥΞΗ
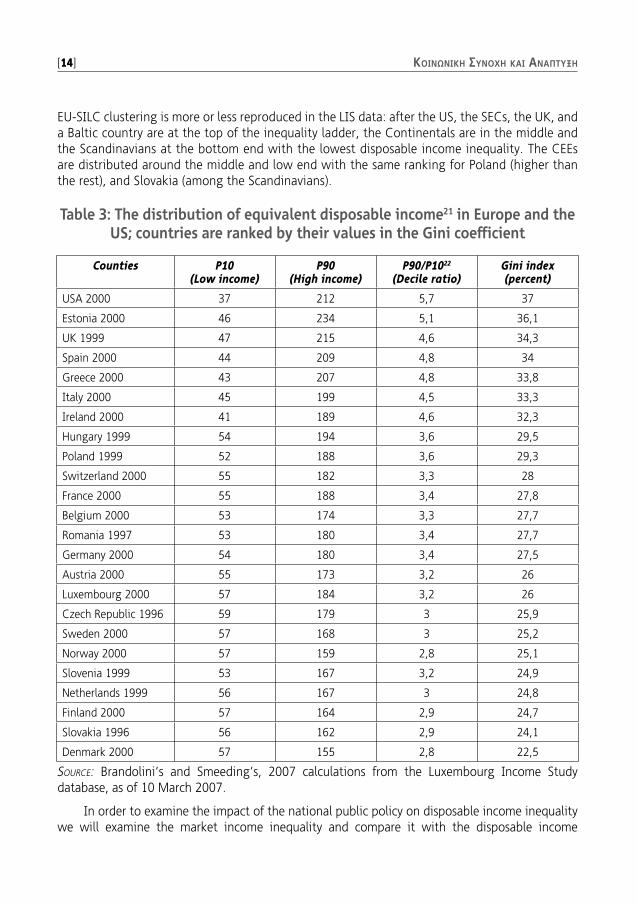
EU-SILC clustering is more or less reproduced in the LIS data: after the US, the SECs, the UK, and a Baltic country are at the top of the inequality ladder, the Continentals are in the middle and the Scandinavians at the bottom end with the lowest disposable income inequality. The CEEs are distributed around the middle and low end with the same ranking for Poland (higher than the rest), and Slovakia (among the Scandinavians).
Table 3: The distribution of equivalent disposable income21 in Europe and the US; countries are ranked by their values in the Gini coefficient
Counties P10(Low income)
P90(High income)
P90/P1022
(Decile ratio)Gini index(percent)
USA 2000 37 212 5,7 37
Estonia 2000 46 234 5,1 36,1
UK 1999 47 215 4,6 34,3
Spain 2000 44 209 4,8 34
Greece 2000 43 207 4,8 33,8
Italy 2000 45 199 4,5 33,3
Ireland 2000 41 189 4,6 32,3
Hungary 1999 54 194 3,6 29,5
Poland 1999 52 188 3,6 29,3
Switzerland 2000 55 182 3,3 28
France 2000 55 188 3,4 27,8
Belgium 2000 53 174 3,3 27,7
Romania 1997 53 180 3,4 27,7
Germany 2000 54 180 3,4 27,5
Austria 2000 55 173 3,2 26
Luxembourg 2000 57 184 3,2 26
Czech Republic 1996 59 179 3 25,9
Sweden 2000 57 168 3 25,2
Norway 2000 57 159 2,8 25,1
Slovenia 1999 53 167 3,2 24,9
Netherlands 1999 56 167 3 24,8
Finland 2000 57 164 2,9 24,7
Slovakia 1996 56 162 2,9 24,1
Denmark 2000 57 155 2,8 22,5
SOURCE: Brandolini’s and Smeeding’s, 2007 calculations from the Luxembourg Income Study database, as of 10 March 2007.
In order to examine the impact of the national public policy on disposable income inequality we will examine the market income inequality and compare it with the disposable income
issue11.indd 14issue11.indd 14 28/9/2011 11:51:20 πμ28/9/2011 11:51:20 πμ
SOCIAL COHESION AND DEVELOPMENT [15]
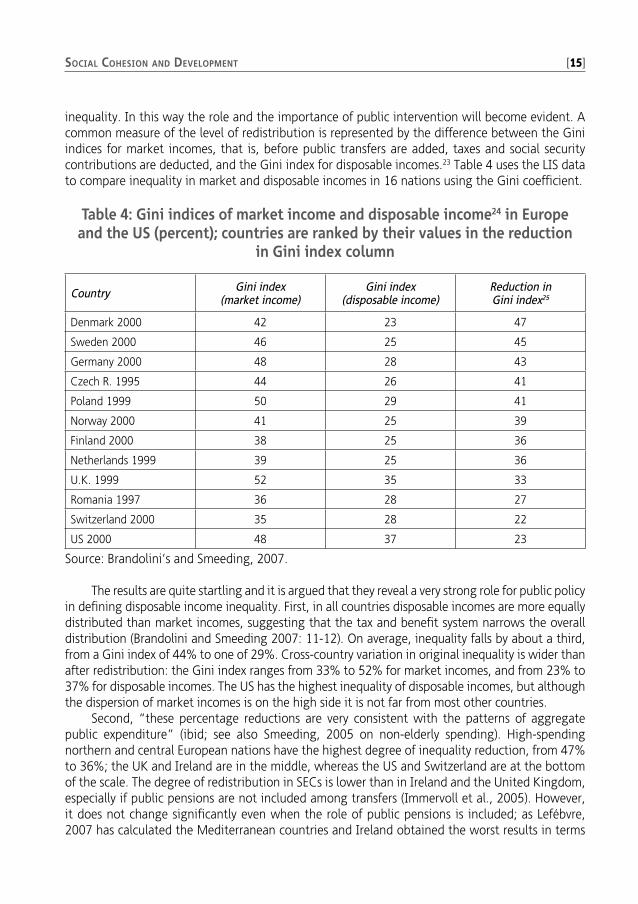
inequality. In this way the role and the importance of public intervention will become evident. A common measure of the level of redistribution is represented by the difference between the Gini indices for market incomes, that is, before public transfers are added, taxes and social security contributions are deducted, and the Gini index for disposable incomes.23 Table 4 uses the LIS data to compare inequality in market and disposable incomes in 16 nations using the Gini coefficient.
Table 4: Gini indices of market income and disposable income24 in Europe and the US (percent); countries are ranked by their values in the reduction
in Gini index column
Country Gini index(market income)
Gini index(disposable income)
Reduction inGini index25
Denmark 2000 42 23 47
Sweden 2000 46 25 45
Germany 2000 48 28 43
Czech R. 1995 44 26 41
Poland 1999 50 29 41
Norway 2000 41 25 39
Finland 2000 38 25 36
Netherlands 1999 39 25 36
U.K. 1999 52 35 33
Romania 1997 36 28 27
Switzerland 2000 35 28 22
US 2000 48 37 23
Source: Brandolini’s and Smeeding, 2007.
The results are quite startling and it is argued that they reveal a very strong role for public policy in defining disposable income inequality. First, in all countries disposable incomes are more equally distributed than market incomes, suggesting that the tax and benefit system narrows the overall distribution (Brandolini and Smeeding 2007: 11-12). On average, inequality falls by about a third, from a Gini index of 44% to one of 29%. Cross-country variation in original inequality is wider than after redistribution: the Gini index ranges from 33% to 52% for market incomes, and from 23% to 37% for disposable incomes. The US has the highest inequality of disposable incomes, but although the dispersion of market incomes is on the high side it is not far from most other countries.
Second, “these percentage reductions are very consistent with the patterns of aggregate public expenditure” (ibid; see also Smeeding, 2005 on non-elderly spending). High-spending northern and central European nations have the highest degree of inequality reduction, from 47% to 36%; the UK and Ireland are in the middle, whereas the US and Switzerland are at the bottom of the scale. The degree of redistribution in SECs is lower than in Ireland and the United Kingdom, especially if public pensions are not included among transfers (Immervoll et al., 2005). However, it does not change significantly even when the role of public pensions is included; as Lefébvre, 2007 has calculated the Mediterranean countries and Ireland obtained the worst results in terms
issue11.indd 15issue11.indd 15 28/9/2011 11:51:20 πμ28/9/2011 11:51:20 πμ
[16] ΚΟΙΝΩΝΙΚΗ ΣΥΝΟΧΗ ΚΑΙ ΑΝΑΠΤΥΞΗ
of poverty alleviation and inequality reduction due to public pension transfers with UK the only rich EU country belonging to the smallest effect on poverty alleviation.
Third, disposable income inequality is not the result of market income inequality or even affected by it. Contrary to the critique that countries may have low disposable income inequality because their pre-public policy market income inequality is also low, the degree of redistribution across countries is not related with the degree of market income inequality.26 Surprisingly, when comparing the Gini index of market and disposable income inequality we see that countries with some of the highest rates of market income inequality, such as the UK, Poland and the Scandinavian countries end up having lower levels of disposable income inequality than the US.
The aforementioned, can be summarized as follows. First, disposable income inequality is not a mirror image of market income inequality; countries with higher market income inequality reduce disposable income inequality to a greater extent than other countries with lower market income inequality. Second, the US has higher disposable income inequality than the European average, whereas in Europe three clusters of countries exist: SECs, the Baltics and some of the CEE countries have the highest disposable income inequality –with the UK being the only rich EU country belonging to this group. Continental Europe has medium to low inequality while the lowest is found in the Scandinavian ones. The only exceptions to this ranking are some of the CEEs who belong to the group with the lowest inequality.
This clustering of nations is analogous to the classification of welfare states and overall social and public policy (for a review on the welfare typology see Sapir 2006; Arts and Gelissen, 2002): countries with weak and inefficient welfare states (SECs, Baltics) or countries with low degree of redistributive public policies (USA, the UK,) are on the top of the disposable income inequality rankings; countries with strong and efficient welfare states and highly redistributive taxation systems (Scandinavians) are at the bottom end whereas countries with average welfare protection and redistributive taxation (Continentals) in middle. The only exceptions to this rule are some the CEECs where despite their weak welfare states and their non-redistributive taxation, show very low disposable income inequality levels. These exceptions invite further research and indeed should be examined in detail in order to highlight the reasons behind their deviant inequality ratios.
3.2. Inequality’s history: Episodes of change Studying the “history” of inequality27 is also crucial to understanding the causes behind its current levels and the reasons for any upward or downward trend in the past. In this section, inequality levels during the last century are examined focusing on the US and to a selection of European countries, due to the restrictions in data availability for other countries/regions. It is argued that, despite the methodological and empirical restrictions, instead of inequality trends there are “episodes of change” which divide different time periods of inequality patterns. Contrary to the dominant explanations of income inequality (discussed in section 2), furthermore, it will be argued that these episodes are not related with some external or internal economic/societal factors, but with changes in government and, in particular, with governments’ partisan choices. In particular, it is argued that left wing or centre left governments either kept stable or decreased disposable income inequality whereas right wing or centre-right increased it.
The main source of data in this endeavour is national household surveys. This choice offers both drawbacks and benefits: on the one hand, direct comparisons are treacherous and rather impossible since different countries use different definitions, measurements and units of analysis; on the other hand, the main advantage is that we can go back in time much easier than any
issue11.indd 16issue11.indd 16 28/9/2011 11:51:20 πμ28/9/2011 11:51:20 πμ
SOCIAL COHESION AND DEVELOPMENT [17]
international databases. Indeed, national databases provide the best source of information for the study of the history of inequality, since the only international comparison is made by the OECD (2005) with data up to 1975. However, these data can be comparable only after 1985. Unsurprisingly, therefore, the OECD does not reach definite conclusions on the historical development of income inequality. In particular, the OECD distinguishes three inequality periods in Europe. From 1975 to 1985 there is little comparable evidence, and its members show mixed results;28 from 1985 to 1995 there is a clear trend of increased inequality only for some countries;29 these trends continued in the following period (1995 to 2000).30 Nevertheless, inequality remained broadly stable in some countries31 while it continued to increase in others.32 The OECD reaches an interesting conclusion: the overall pattern has not changed dramatically: low inequality in the Nordic countries and the Netherlands, medium to Continental and higher inequality in the Anglo-Saxon and the southern European countries (Pestieau, 2006: 15).
During the last few decades, contrary to the period between the 1950s and the early 1970s, disposable income inequality in the rich countries rose. This trend has been characterised as the “great U-turn” (Harrison and Bluestone, 1988) – a conclusion that turns around the classic and famous “inverse U-turn” thesis or “Kuznets curve”.33 The argument is that this reversal occurred not only in the US34 but also internationally in a number of countries.35 In contrast, a number of scholars argue that there has been little distributional change within countries over time (see among others Gustaffson and Johansson, 1999; Melchior et al., 2000). The reasons for this disagreement are in sum the problems already highlighted in the field of inequality: dissimilar data, broken series, different definitions, etc. In addition, comparisons between different countries may be impossible (how meaningful is it to compare the US with, for instance, the Netherlands, in order to examine whether there is a U-turn or not?). Hence, the best option for examining the inequality history is to go country by country. In the following, empirical evidence regarding the ‘history’ of inequality is going to be discussed, arguing that there has been no stable trend in inequality levels: neither a U or reverse U turn, nor a constant process of increasing/decreasing inequality.
Starting with the US, evidence supports the U-turn hypothesis (Brandolini and Smeeding, 2007). However, Atkinson (2003) concludes that it is not possible to verify the U-turn hypothesis since inequality fell only during 1961 to 1968. Before this period there is no trend, and the break in the CPS series in 1993 makes it difficult to draw firm conclusions. Likewise, in a more recent study, he finds that in the period 1929-1944, the available data is not sufficient enough since it is covered only by a small number of data points (Atkinson, 2007: 6). However, when examining European trends of disposable income inequality per household, we find that some countries provide support to the U-turn hypothesis, namely the UK and the Scandinavian countries. What is more, even if some countries support the U-turn thesis, it is for different reasons than originally argued. In the following, I argue that it was public policies and governmental political decisions that determined the history of inequality in most European countries than a structural transformation of their economies.
In particular, Swedish levels of inequality decreased significantly during 1967-1982 –much more dramatically during 1967-1975 and more moderately afterwards. After 1982, however, an upward trend began which continued up to the 1990s.36 Nonetheless, it wasn’t an internal structural reason as the U-turn or inverse U-turn scholars would argue neither an external one (globalization, trade, etc). Rather, for the period 1967 to 1975, both transfers and direct taxes contributed to the decrease in inequality in the first period, with the former the major factor (Gustafsson and Palmer, 1997). Likewise, inequality rose in 1980s due to tax reforms, and increased capital gains in the 1990s. Overall, the Scandinavian countries provide some evidence
issue11.indd 17issue11.indd 17 28/9/2011 11:51:20 πμ28/9/2011 11:51:20 πμ
[18] ΚΟΙΝΩΝΙΚΗ ΣΥΝΟΧΗ ΚΑΙ ΑΝΑΠΤΥΞΗ
of “the great U-turn” thesis even though for the downward trend data is scarce and for the upward trend it is concentrated mainly in the 1990s.
The UK shows one of the most puzzling cases. Until the 1960s, similarly to the US, there is little overall change in inequality levels. In the 1970s, unlike the US, inequality is reduced by 3 percentage points. This fall is radically reversed in the 1980s with a great rise of the Gini coefficient37 (Atkinson, 2003: 487). None of the existing theories (see next section) can explain why the UK was twice as severely affected as the US.38 The second feature is that the 1990s do not show a continuing upward trend: the 2000 Gini coefficient is the same as that for 1990 whereas the one of 2005 below the 1990 Gini. So, contrary to the U-turn hypothesis, we have an episode of rising inequality in the 1980s, not a continuing upward trend. In other words, income inequality in the UK almost doubled compared to the US during the 1984 to 1990 period, showing a rather episodic rise; thereafter, contrary to the US, it remained stable or decreased. Hence, it seems rather problematic to indicate a common external process as the cause of these puzzling and contradictory inequality patterns. The best explanation for the UK trend is respective governments’ public policy and welfare reforms for each period. In particular, the 1980s was dominated by the Thatcher government which aimed to reduce welfare support and promoted reforms that decreased the re-distributional character of a number of public policies and taxation. In contrast, during the 1990s there was a change of government, with New Labour taking office in 1997 and aiming to reduce inequalities and to provide at least equality of opportunities.39
Contrary to the Nordic countries and the UK, continental Europe provides no support for a U or inverse U turn. For Germany, France and Italy inequality remained roughly stable –with France being the only country that showed no rise of income inequality at all. The most interesting case is the Netherlands which demonstrates a very similar trend to the UK: there was an episode of rising inequality in the 1980s which did not continue into the 1990s (Atkinson, 2003: 490). And as in UK, the 1980s were dominated by the rightwing and neo-liberal CDA40 -VVD41 governmental coalition which under the leadership of Ruud Lubbers implemented a program of radical reform of the welfare state. It should be noted that Lubbers who was the Dutch Prime Minister from 1982 until 1994 had as one of his campaign slogans the call for ‘meer markt, minder overheid’, that is, more market and less government. Unsurprisingly he is regarded as an ideological heir to Margaret Thatcher and –as Baroness Thatcher did in the UK- his welfare state reforms led to a sharp increase of disposable income inequality. This rise ended in the 1990s when Lubbers had to share power with the Dutch Labour Party (PvdA) which despite not altering the reforms and policies of the previous period did not proceed in further deregulation of the welfare state.
Overall, in most countries disposable income inequality per household decreased during the 1930s and 1940s, increased during the 1950s and 1960s, decreased after the early 1970s and increased after the mid-1980s. Hence, if disposable inequality started to rise in 1950 rather than 1980, then the ICT explanation and the impact of globalisation become even weaker (Atkinson, 2007: 13). In addition, despite the variations over time of inequality levels within countries, the comparative ranking of most countries has not changed. In other words, membership in one of the three categories of high, medium and low inequality is very consistent –a result that confirms OECD’s study. This finding poses some crucial constraints in the globalisation thesis or any other hypothesis that implies that inequality levels are determined by externally imposed variables that bypass the nation state. In the same vein, as it was analysed above, it is rather difficult to accept both the “inverse U” and the “great U” theses for the US and Europe. Thus, the most adequate explanation cannot be a common external or internal process such as globalisation or de-industrialisation; some countries experienced an increase in inequality while others did not.
issue11.indd 18issue11.indd 18 28/9/2011 11:51:20 πμ28/9/2011 11:51:20 πμ
SOCIAL COHESION AND DEVELOPMENT [19]
Is the history of disposable income inequality affected by the respective levels of market income inequality or by the national welfare and taxation policies? In section 3.1., we saw that it was the latter which determined disposable income inequality’s snapshot image. What about inequality over time? In the following, it is argued that the same applies for inequality’s ‘history’.
To begin with, when comparing the absolute difference between the Gini index for market income and that for disposable income, it becomes evident that the trend in the redistributive impact of tax-and-transfer systems may vary considerably. However, there is a general pattern, suggesting that the redistributive impact of taxes and transfers initially increased and then stabilised or dropped in all countries except for the United States, where it remained quite stable over time (but the series starts only in 1979). The UK stands out for having the most dramatic switch of regime, as in the early 1980s it apparently shifted from a situation not too different from the two Nordic countries to a model closer to that of the US (Brandolini and Smeeding, 2007). In any case, a widening of the market income distribution need not result in a drastic increase in the inequality of disposable incomes. Rising levels of redistribution in Finland and Sweden, where policies have been increasingly targeted to the poor, have been more effective in muting increasing market income inequality than have stable but low levels of redistribution in the United States (ibid: 21-22). Consequently, empirical evidence (sections 3.1. - snapshot image and 3.2. - inequality over time) clearly demonstrate that whatever the market income inequality, the inequality of disposable income is not affected by the market forces and the levels of market income inequality but by public policies, namely public transfers, taxes and social security contributions.
In this respect, the study of Brady and Leicht, 2007 regarding the relationship between income inequality and the ideology of the incumbent government is very illuminating. Using the LIS data, the authors examine the impact of right-wing party power on three measures of disposable income inequality for 16 affluent western democracies42 from 1969 to 2000. According to their findings, the cumulative effect of right-wing party power significantly increases inequality through three main mechanisms: legislative action, administrative office-holding and ideological influence. In addition, the authors find that left-wing party power has less influence than the right on the Gini coefficient and the 90/50 ratio, but a larger influence on the 90/10 ratio, whereas union density is insignificant after controlling for right-wing party power. Moreover, they find that right-wing parties became more influential after 1989, while left-wing parties became less effective. Finally, the authors argue that their results do not depend on the inclusion of the US in the sample.
To sum up, this section has shown that the ‘history’ of inequality is characterised by episodes of change than of any common or continuous trends. These episodes are defined by the changes in government at the national level and their partisan policies in national public policy with regard to the orientation, generosity and the overall redistributive nature of public transfers, taxes and social security contributions current inequality levels.
4. Conclusions and discussion
T he evidence presented above challenges the dominant and popular explanations of inequality such as globalisation, information and communication technologies or skill-biased technical
change, since inequality trends are consistent with each country’s political developments. In other words, inequality is not determined by any external or internal economic or societal processes but by the political actors’ choices in each country embodied in the content of public transfers, taxes and social security contributions. The more redistributive the taxation and public benefits system
issue11.indd 19issue11.indd 19 28/9/2011 11:51:20 πμ28/9/2011 11:51:20 πμ
[20] ΚΟΙΝΩΝΙΚΗ ΣΥΝΟΧΗ ΚΑΙ ΑΝΑΠΤΥΞΗ
is, the lower the levels of inequality. In other words, it is a matter of public policy, not of external or internal economic and societal processes that are beyond the control of policymakers.
The aforementioned have significant implications for Greece -a country with the fifth highest disposable income inequality in the EU-27. The main problem for Greece seems to be the inefficiency of public policies: even though it spends 24.2% of GDP on social expenditure, which is quite close to the EU-27 average of 26.9%, it fails to reach the expected results in reducing inequality (and of course poverty). In addition, the tax and benefit systems have to be more selective and more means tested in order to achieve greater redistribution of income. Finally, the chronic problem of the unofficial economy and the unregistered workforce and incomes has to be eradicated. This paper has shown that whatever the global and domestic conditions, it is up to national policy makers to reduce disposable income inequality levels; they just have to choose to do so.
Notes1. This paper draws extensively on Zartaloudis, 2007. However, this version is not only shorter
but it has also been updated with the most recent data available. Thus, many of the evidence presented here are completely new.
2. Alcock (1993: 255) argues that ‘poverty is the unacceptable face of inequality.’3. Although total household income depends on the earnings of individual members, it is not
possible to interpret directly from the distribution of individual earnings to the distribution of household incomes (Atkinson, 2007: 3). For a concise discussion of the methodological consid-erations with regards to the reference unit and its impact on results, see Atkinson, 2003; 2007 and Smeeding, 2007).
4. Another suggestion is to include in the calculation of income assets such as housing ownership (Orton and Rowlingson, 2007).
5. The LIS database is the most important international data archive providing access to micro data. It includes household income surveys of 30 countries on four continents. These surveys provide income, demographic, labour market and expenditure information on three different levels: household, person and child. Its main advantage compared to other sources of data (especially from the OECD database) is that it is not drawn from national sources but uses a harmonised set of concepts, methodology and variables. Thus, the LIS database is one of the most reliable for international comparisons (see Smeeding, 2002; 2004; 2006).
6. The ‘disposable cash income’ concept is used not only by the Luxembourg Income Study, but also Eurostat, UNICEF and OECD have independently made comparisons of income poverty and inequality across nations using identical or very similar measures of net disposable income (Smeeding, 2007: 73). It includes all types of money income minus direct income and payroll taxes, and includes all cash and near-cash transfers such as food stamps and cash housing al-lowances, as well as refundable tax credits such as the earned income tax credit in the United States. It excludes capital gains, imputed rents, other unrealised types of capital income, home production and in-kind income. These items may account for an important share of the eco-nomic resources at a household’s disposal, and their inclusion in the income definition may affect measured inequality (Brandolini and Smeeding, 2007: 5). See Atkinson, Rainwater and Smeeding, 1995 and the Canberra Group, 2001 for more on this income definition and its robustness across nations.
7. The LIS uses the decile ratio.
issue11.indd 20issue11.indd 20 28/9/2011 11:51:20 πμ28/9/2011 11:51:20 πμ
SOCIAL COHESION AND DEVELOPMENT [21]
8. The interquintile ratio is the indicator used by Eurostat to evaluate the income inequality with-in the European Union. Although, there is little difference between Gini indicators coming from the OECD and LIS, the quintile ratios are different between the LIS and Eurostat as they are higher in later estimates. However, Lefébvre, 2007 has calculated that the correlation coef-ficient between both is high (0.739), which confirms that both give about the same ranking.
9. For international comparisons of poverty and inequality, the “household” is the only compa-rable income-sharing unit available for almost all nations. While the household is the unit used for aggregating income, the person is the unit of analysis. Household income is assumed to be equally shared among individuals within a household (Smeeding and Munzi, 2005: 9).
10. Or the “textbook” explanation (Atkinson, 2003)11. For a detailed explanation see Atkinson, 2003: 495).12. For a detailed discussion of the literature on the impact of immigration on US inequality, see
Gordon and Becker, 2007.13. See Card et al., 2004; Mishel et al., 2006.14. The hypothesis is that the erosion of the real minimum wage after the late 1970s accounts for
much of the increase of the 90/10 inequality ratio.15. For one of the most detailed studies regarding the historic development of the trends of the
top-income distribution see Atkinson and Piketty, 2007; for a succinct discussion of the con-temporary debate (superstars, CEOs), see, among others, Gordon and Becker, 2007: 16-25.
16. The latter was almost non-existent prior to 1914, and as a result, top income rates increased massively during the period 1914 to 1945
17. Canada, Ireland, New Zealand, the UK and the US.18. The share of the top 1% doubled in the US (and the UK).19. France, Germany and the Netherlands.20. The EU-SILC provides cross-country comparable data for all EU-25 countries, as well as Norway
and Iceland. However, this database exists only from 2005. Until 2001 (in certain cases, until 2000), data is obtained from ECHP data source for EU-15 countries, except Denmark and Swe-den. For the remaining countries and years, data is obtained from national sources which are not fully comparable with the EU-SILC. Trends in transition years cannot be interpreted reli-ably. In order to measure inequality EU-SILC uses the S80/S20 ratio while income is understood ‘as equivalised disposable income’.
21. Observations are bottom-coded at 1% of the mean of equivalent disposable income and top-coded at 10-times the median of unadjusted disposable income. Incomes are adjusted for household size by the square-root equivalence scale.
22. P10 and P90 are the ratios to the median of the 10th and 90th percentiles, respectively.23. This difference provides only a first estimate of the actual impact of public redistribution, as it
ignores how market income inequality would be different if there were no taxes and benefits.24. Observations for disposable income are bottom-coded at 1% of the mean of equivalent dispos-
able income and top-coded at 10-times the median of unadjusted disposable income. Changes in disposable incomes due to bottom- and top-coding are entirely attributed to market in-comes. Both market and disposable incomes are adjusted for household size by the square-root equivalence scale.
25. Difference between the Gini index for market income and the Gini index for disposable in-come, are expressed as a percentage of the former.
26. Schwabish et al., 2006 find almost no correlation between the P10 value for market income and the level of social spending.
issue11.indd 21issue11.indd 21 28/9/2011 11:51:20 πμ28/9/2011 11:51:20 πμ
[22] ΚΟΙΝΩΝΙΚΗ ΣΥΝΟΧΗ ΚΑΙ ΑΝΑΠΤΥΞΗ
27. As in the previous section, we focus on disposable income inequality and the unit of analysis is the household.
28. There is a decline in Greece, Finland and Sweden, and an increase in the Netherlands and the UK
29. Austria, Denmark, Greece, the UK, Finland and Sweden – only France and Ireland demonstrate a slight decrease.
30. With the main difference that the Netherlands joins France and Ireland in the decreasing camp.
31. Germany, Italy and Portugal. 32. Austria, Denmark, Greece and the UK, with a much more significant rise in Sweden and Fin-
land.33. According to Kuznets curve, as an economy goes through a structural transformation, income
inequality follows an inverse U-shape, inequality first rising and then falling as labour is trans-ferred from low-productivity agriculture into high-productivity industry.
34. See Alderson and Nielsen, 2002.35. See Cornia and Court, 2001.36. It should be stressed that there is a significant problem of data comparability (Atkinson, 2003:
488).37. From 1984 to 1990: the Gini coefficient in the UK rose by more than one percentage point a
year. Overall, there was an increase in the Gini coefficient of 10 percentage points. Even if part of the rise was reversing the fall in the 1970s, the 1990 figure was 6.7 points higher than the highest value recorded in the 1960s.
38. For Atkinson (2003) any theory must be able to explain this trend.39. For a further analysis of New Labour’s positions on inequality, see Orton and Rowlingson,
2007.40. The Christian Democratic Appeal (CDA) is a Christian-democratic political formation composed
of KVP (Catholic People’s Party), CHU (Christian Historical Union) and ARP (Anti Revolutionary Party).
41. The People’s Party for Freedom and Democracy (VVD) is the most liberal party in the Nether-lands and even though originally was a supporter –at least in principle- of the welfare state, after 1971 became more sceptical towards the welfare state, advocating reform of the welfare state and lower taxes in order to increase economic growth. In other words, from a liberal party it became a neo-liberal one (Andeweg and Irwin, 2002: 49).
42. The countries were: Australia, Austria, Belgium, Canada, Denmark, Finland, France, Germany, Ireland, Italy, Netherlands, Norway, Sweden, Switzerland, the UK and the US.
Bibliographical referencesArts W. and Gelissen J., (2002), ‘Three Worlds of Welfare Capitalism or More? A State-of-the-Art
Report’, Journal of European Social Policy, 12 (2): 137–58.
Acemoglu, D. and Angrist, J., (2001), ‘How large are human capital externalities? Evidence from compulsory schooling laws’, in Bernanke, B.S. and Rogoff, K. (eds), NBER Macroeconomics Annual, Cambridge, Mass, MIT Press: 9-59.
Alcock P., (1993), Understanding Poverty, Basingstoke, Macmillan Press.
issue11.indd 22issue11.indd 22 28/9/2011 11:51:20 πμ28/9/2011 11:51:20 πμ
SOCIAL COHESION AND DEVELOPMENT [23]
Andeweg R. and Irwin G., (2001), Governance and Politics of the Netherlands, Basingstoke and New York: Palgrave.
Atkinson A.B. and Piketty T. (eds), (2007), Top incomes over the 20th century: a contrast between European and English-speaking countries, New York, Oxford, Oxford University Press.
Atkinson A.B., (2007), ‘Distribution and growth in Europe – the empirical picture: a long-run view of the distribution of income’, Paper presented at the DG ECFIN annual research conference, Brussels.
Atkinson A.B., (2003), ‘Income inequality in OECD countries: data and explanations’, CESifo Economic Studies, 49 (4): 479-513.
Atkinson A.B., (1997), ‘Bringing income distribution in from the cold’, Economic Journal, 107: 297-321.
Atkinson A.B. Rainwater, L. and Smeeding T.M. (1995), ‘Income distribution in OECD countries: evidence from the Luxembourg Income Study (LIS)’, Social Policy Studies, Paris, OECD, vol. 18.
Autor D.H. Katz L.F. and Kearney M.S., (2006), ‘The polarisation of the labor market’, American Economic Review, 96: 189–94.
Autor D.H., Levy F., and Murnane R.J., (2003), ‘The skill content of recent technological change: an empirical exploration’, Quarterly Journal of Economics, 118: 1279–1333.
Becker G., (1964), Human capital: a theoretical and empirical analysis with special reference to education, New York, National Bureau of Economic Research.
Bernanke B., (2007), ‘Remarks by Chairman Ben S Bernanke’, Greater Omaha Chamber of Commerce, Omaha, Nebraska.
Barry B., (1998), ‘Social exclusion, social isolation and the distribution of income’, Centre for Analysis of Social Exclusion paper, no. 12.
Blanden J. Gregg P. and Machin S., (2005), ‘Intergenerational mobility in Europe and north America’, Centre for Economic Performance, London School of Economics.
Bojer H., (1987), ‘Personlig inntektsfordeling i Norge 1970-1984’, Tidsskrif for Sammfunnsforskning, 28.
Borjas G.J., (2006), ‘Native internal migration and the labor market impact of immigration’, Journal of Human Resources, 41 (2): 221-58.
Borjas G.J. and Katz L.F., (2005), ‘The evolution of the Mexican-born workforce in the United States’, NBER working paper, 11281.
Borjas G.J., (2003), ‘The labor demand curve is downward sloping: re-examining the mpact of immigration on the labor market’, Quarterly Journal of Economics, 118 (4): 1335-74.
Borjas G.J. Freeman R.B. and Katz L.F. (1997), ‘How much do immigrants and trade affect labor market outcomes?’, Brookings Papers on Economic Activity, 1: 1-67.
Brandolini A., (1999), ‘The distribution of personal income in post-war Italy: source description, data quality, and the time pattern of income inequality’, Giornale degli Economisti e Annali di Economia, 58: 183–239.
Brandolini A., and Smeeding T., (2007), ‘Inequality patterns in western-type democracies: cross-country differences and time changes’, Luxembourg Income Study working paper series, no. 458.
issue11.indd 23issue11.indd 23 28/9/2011 11:51:20 πμ28/9/2011 11:51:20 πμ
[24] ΚΟΙΝΩΝΙΚΗ ΣΥΝΟΧΗ ΚΑΙ ΑΝΑΠΤΥΞΗ
Brady D., and Leicht K.T. (2007), ‘Party to inequality: right party power and income inequality in affluent western democracies’, Luxembourg Income Study working paper series, no. 460.
Callinicos A., (2000), Equality, Cambridge, Polity Press.
Canberra Group, (2001), Expert group on household income statistics: final report and recommendations, Ottawa, Canada Statistics, Canada.
Card D. Lemieux T. and Riddell C., (2004), ‘Unions and wage inequality’, Journal of Labor Research, 25: 519-562.
Card D., (1999), ‘The causal effect of education on earnings’, in O Ashenfelter and D Card (eds), Handbook of labor economics, New York, Elsevier, vol. 3a, p.p. 1801-1863.
Cohen G., (1993), ‘Equality of what? On welfare, goods and capabilities’, in M. Nussbaum and A. Sen (eds), The quality of life, Oxford, Oxford University Press.
Crosland A., (1956), The future of socialism, London, Cape.
Freeman R.B., (2005), ‘What do unions do? The 2004 M-Brane Stringtwister edition’, NBER working paper series, 11410.
Garfinkel I. Rainwater L. and Smeeding T.M., (2005), ‘Equal opportunities for children: social welfare expenditures in the English-speaking countries and Western Europe’, Focus, 23: 16-25.
Goldin C. and Margo, R.A., (1992), ‘The great compression: the wage structure in the United States at mid-century,” Quarterly Journal of Economics, 107: 1-34.
Gordon R.J. and Decker I.D., (2007), ‘Unresolved issues in the rise of American inequality’, Proceedings of the Brookings panel on economic activity, Washington DC, p.p. 1-44.
Higher Education Funding Council for England, (2005), Young participation in higher education, Bristol, Higher Education Funding Council for England.
Immervoll H. Hevy H. Lietz H. Mantovani D. O’Donoghue C. Sutherland H. and Verbist G., (2005), ‘Household incomes and redistribution in the European Union: quantifying the equalising properties of taxes and benefits’, EUROMOD working paper, no. EM9/05.
Kuznets S., (1955), ‘Economic growth and income inequality’, American Economic Review, 45: 1-28.
Lefébvre M., (2007), ‘The redistributive effects of pension systems in Europe: a survey of evidence’, Luxembourg Income Study working paper series, no. 457.
Lerman R.I., (1999), ‘US wage-inequality trends and recent immigration’, American Economic Review, 89: 23–28.
McKay, S. and Kempson, E., (2003), ‘Savings and life events’, DWP Research Report 194, Leeds, Corporate Document Services.
Miller M. Pomerantz D. and Rose L., (2009), The Celebrity 100: The World’s most powerful celebrities, Forbes.
Mishel L., Bernstein J. and Allegretto S., (2006), The State of Working America 2006/2007, ILR Press.
OECD (2005), ‘Income distribution and poverty in OECD countries in the second half of the 1990s’, Paris, OECD.
Oppenheim C., (1993), Poverty: the facts, London, CPAG.
issue11.indd 24issue11.indd 24 28/9/2011 11:51:20 πμ28/9/2011 11:51:20 πμ
SOCIAL COHESION AND DEVELOPMENT [25]
Orton M. and Rowlingson K., (2007), ‘A problem of riches: towards a new social policy research agenda on the distribution of economic resources’, Journal of Social Policy, 36 (1): 59-78.
Ottaviano G.I.P. and Peri G., (2006), ‘Rethinking the effects of immigration on wages’, NBER Working Paper, no. W12497. Retrieved from: http://ssrn.com/abstract=927381
Pestieau P., (2006), The welfare state in the European Union, Oxford University Press.
Piketty T., (2007), ‘Income, wage, and wealth inequality in France, 1901-98’, in A.B. Atkinson and T. Piketty (eds) 2007, Top incomes over the twentieth century: a contrast between European and English-speaking countries, New York, Oxford, Oxford University Press.
Piketty T., (2003), ‘Income inequality in the United States, 1913-1998’, Quarterly Journal of Economics, 118: 1-39.
Ringen S., (1991), ‘Households, standard of living, and inequality’, Review of Income and Wealth, 37: 1-13.
Sapir A., (2006), ‘Globalization and the Reform of European Social Models’, Journal of Common Market Studies 44 (2): 369-390.
Schwabish J. Smeeding T.M. and Osberg L., (2006), ‘Income distribution and social expenditures: a cross-national perspective’, in D.B. Papadimitriou (ed.), The distributional effects of government spending and taxation, Northampton, MA, Edward Elgar Publishing.
Smeeding T.M., (2006), ‘Poor people in rich nations: the United States in comparative perspective’, Journal of Economic Perspectives, 20 (1): 69-90.
Smeeding T.M., (2004), ‘Twenty years of research on income inequality, poverty, and redistribution in the developed world: introduction and overview’, Socio-Economic Review, 2: 149-163.
Smeeding T.M., (2002), ‘Globalisation, inequality, and the rich countries of the G-20: evidence from the Luxembourg Income Study (LIS)’, in D. Gruen, T. O’Brien and J. Lawson (eds), Globalisation, living standards, and inequality, recent progress and continuing challenges, Australia, JS McMillian Printing Group.
Smeeding T.M. and Munzi T., (2005), ‘Poverty and inequality: Greece and Mediterranean Europe in comparative perspective’, Luxembourg Income Study working paper Series, no. 421.
Sinfield A., (2004), ‘Preventing poverty in market societies’, paper presented at the ESPAnet annual conference ‘European social policy: meeting the needs of a new Europe’, Oxford.
Topel R., (2004), ‘The private and social values of education’, Proceedings of the Federal Reserve Bank of Cleveland research conference, Cleveland, p.p. 47-57.
Wilkinson R., (2005), The impact of inequality, London, Routledge.
Zartaloudis S. (2007) ‘Equality: a political choice.’ Policy Network paper, Retrieved from: http://www.policy-network.net/publications/?id=1880.
issue11.indd 25issue11.indd 25 28/9/2011 11:51:21 πμ28/9/2011 11:51:21 πμ
KΟΙΝΩΝΙΚΗ ΣΥΝΟΧΗ ΚΑΙ ΑΝΑΠΤΥΞΗΕξαμηνιαία Επιστημονική Επιθεώρηση
ΣΚΟΠOΣ. Η Κοινωνική Συνοχή και Ανάπτυξη (ΚΣΑ) είναι μια εξα-μηνιαία επιστημονική επιθεώρηση για την έρευνα και συζήτηση θεμάτων κοινωνικής πολιτικής, συνοχής και ανάπτυξης. Σκοπός της είναι η καλύτερη κατανόηση του ρόλου της κοινωνικής συνο-χής στη σύγχρονη ανάπτυξη και προώθηση της κοινωνικής δικαι-οσύνης στο εσωτερικό και μεταξύ των εθνών. Τα άρθρα που δη-μοσιεύονται καλύπτουν τα πεδία της ανάλυσης, του σχεδιασμού, της εφαρμογής των πολιτικών, της αξιολόγησης των αποτελεσμά-των τους, της συγκριτικής έρευνας, της ανάλυσης του ρόλου των διεθνών οργανισμών, των εθελοντικών, κοινωνικών, ιδιωτικών και τοπικών φορέων στην κοινωνική ανάπτυξη και πολιτική. Ει-δικότερα, η Επιθεώρηση φιλοξενεί άρθρα που αντιπροσωπεύουν ευρύ φάσμα γνωστικών πεδίων, όπως εργασιακές σχέσεις και απασχόληση, φτώχεια και κοινωνικός αποκλεισμός, συντάξεις και κοινωνική ασφάλιση, υγεία και κοινωνική φροντίδα, εκπαίδευση και κατάρτιση, πολιτικές για το παιδί, την οικογένεια και τα φύλα, μετανάστευση, εγκληματικότητα, εταιρική κοινωνική ευθύνη, καθώς και δραστηριότητες του τρίτου τομέα και της κοινωνίας πολιτών. Η Επιθεώρηση φιλοξενεί επιστημονικά άρθρα, βιβλιο-κριτικές και βιβλιoπαρουσιάσεις, σύντομες εκθέσεις ερευνητικών προγραμμάτων, είτε στα ελληνικά είτε στα αγγλικά. Ενθαρρύνει τη διεπιστημονική, συγκριτική και ιστορική προσέγγιση.
ΙΔΡΥΤΗΣ-ΕΚΔΟΤΗΣΘεόδωρος Σακελλαρόπουλος, Πάντειο Πανεπιστήμιο
ΣΥΝΤΑΚΤΙΚΗ ΕΠΙΤΡΟΠΗΝαπολέων Μαραβέγιας, Πανεπιστήμιο Αθηνών
Ανδρέας Μοσχονάς, Πανεπιστήμιο ΚρήτηςΘεόδωρος Σακελλαρόπουλος, Πάντειο Πανεπιστήμιο
ΕΠΙΣΤΗΜΟΝΙΚΟ ΣΥΜΒΟΥΛΙΟJos Berghman, Catholic University of Louven
Eberhard Eichenhofer, University of JenaKorel Goymen, Sabanci University, Istanbul
Ana Guillen, University of OviedoJohn Myles, University of Toronto
Κούλα Κασιμάτη, Πάντειο ΠανεπιστήμιοΘωμάς Κονιαβίτης, Πάντειο Πανεπιστήμιο
Σκεύος Παπαϊωάννου, Πανεπιστήμιο ΚρήτηςΆγγελος Στεργίου, Αριστοτέλειο Πανεπιστήμιο Θεσσαλονίκης
Λευτέρης Τσουλφίδης, Πανεπιστήμιο ΜακεδονίαςΔημήτρης Χαραλάμπης, Πανεπιστήμιο Αθηνών
Ιορδάνης Ψημμένος, Πάντειο ΠανεπιστήμιοJohn Veit-Wilson, University of Newcastle
ΕΠΙΣΤΗΜΟΝΙΚΗ ΓΡΑΜΜΑΤΕΙΑΧριστίνα Καρακιουλάφη, Πανεπιστήμιο Κρήτης
Χαράλαμπος Οικονόμου, Πάντειο Πανεπιστήμιο, Μανόλης Σπυριδάκης, Πανεπιστήμιο Πελοποννήσου
Ετήσια συνδρομή: 250 €
Εκδίδεται από την Επιστημονική Εταιρεία για την Κοινωνική Συνοχή και Ανάπτυξη
Φειδίου 18, Αθήνα 10678, Τηλ./Φαξ 210 3303060, E-mail: [email protected], [email protected]
ISSN: 1790-9368
SOCIAL COHESION AND DEVELOPMENTBiannual Scientif ic Review
AIMS AND SCOPE. Social Cohesion and Development (SCD) is a biannual interdisciplinary scientific journal for research and debate on social policy, social cohesion and social development issues. It aims to advance the understanding of social cohesion in the contemporary development and to promote social justice within and between the nations. Articles are covering policy analyses, developments and designs, evaluations of policy out-comes, comparative research, analyses of the role of interna-tional organizations, the voluntary, private and local agents in social development and policy. The journal provides comprehen-sive coverage of a wide range of social policy and development issues, such as labour market and employment policies, pov-erty and social exclusion, ageing, pensions and social security, health and social care, education and training, family, gender and child policies, migration, crime and corporate responsibil-ity, as well as civil society and third sector activities. The Review welcomes scholarly articles, book reviews and short research reports, in Greek or English. It encourages a multidisciplinary, comparative and historical approach.
FOUNDER-EDITORTheodoros Sakellaropoulos, Panteion University, AthensEDITORIAL BOARDNapoleon Maravegias, National University of AthensAndreas Moschonas, University of Crete Theodoros Sakellaropoulos, Panteion University, Athens SCIENTIFIC ADVISORY BOARDJos Berghman, Catholic University of LouvenDimitris Charalambis, University of AthensThomas Coniavitis, Panteion University, AthensEberhard Eichenhofer, University of JenaKorel Goymen, Sabanci University, IstanbulAna Guillen, University of OviedoKoula Kasimati, Panteion University, AthensJohn Myles, University of TorontoSkevos Papaioannou, University of CreteIordanis Psimmenos, Panteion University,Aggelos Stergiou, Aristotle University of ThessalonikiLefteris Tsoulfidis, University of MacedonianJohn Veit-Wilson, University of NewcastleSCIENTIFICL SECRETARIATChristina Carakioulafi, University of CreteCharalambos Economou, Panteion UniversityManolis Spiridakis, University of Peloponnese
Annual Subscription: 250 €
Published by the Society for Social Cohesion and Development,
Athens 10678, 18 Fidiou str., Greece, Tel./Fax 003 210 3303060, E-mail: [email protected], [email protected]
ISSN: 1790-9368
NOTES FOR CONTRIBUTORS
Papers should be written in Greek or English. It is assumed that submitted articles have not been published elsewhere and that they are not under consideration for publication by other journals. The authors should state whether they are publishing related articles else-where. Authors must submit four identical copies and an identical electronic version of their papers to the following address and e-mail of the editor: Theodoros SakellaropoulosFeidiou 18, Athens, 10678, GreeceE-mail: [email protected], [email protected]
Papers accepted for review are evaluated anonymously by at least two referees. Therefore, along with the full paper (title, text, references) author’s name and address as well as the paper’s title should be submitted separately on a covering page. Papers should include an abstract of not more than 100 words and five key words, both in Greek and English. Articles should be between 6,000 and 8,000 words in length including abstracts and references. Manuscripts will not be returned to the author if rejected.
References to publications should be given according to the Harvard system which in the text cites authors and year of publication, e.g. (Esping-Andersen 1990; Kleinman and Piachaud, 1993). Page number(s) should be given for all direct quotations, e.g. (Ferrera et al., 2002: 230). If there is more than one reference to the same author and year, they should be distinguished by the use of a, b, c etc., added to the year. References should also be listed alphabetically at the end of the paper in a List of References (not Bibliography). Authors are particularly requested to ensure that each text reference appears in the list, and vice versa. References to books should always give the city of publication and publisher as well as author and title de-tails. For example: Scharpf, F. (1999) Governing in Europe: Effective and Democratic? Oxford: Oxford University Press. Reference to journal articles should give volume, issue and page num-bers, and the name of the article enclosed in single quotation marks. For example: Atkinson, A.B., Marlier, E. and Nolan, B. (2004) ‘Indicators and Targets for Social Inclusion in the Eu-ropean Union’, Journal of Common Market Studies 42: 47-75. References to chapters within multi-authored publications should be listed with the chapter title in single quotation marks followed by the author and title of the publication. For example: Leibfried, S. and Pierson, P. (1995) ‘Semisovereign welfare states: social policy in a multitiered Europe’, in Leibfried S. and Pierson P., (eds.), European Social Policy: Between Fragmentation and Integration, p.p. 43-77. Washington D.C.: The Brookings Institution. Book and journal titles should be in italics. Explanatory notes should be kept to a minimum. If it is necessary to use them, they must be numbered consecutively in the text and listed at the end of the paper. Any acknowledgements should appear at the end of the text. Papers that do not conform to the aforementioned style will be returned to the authors for revision.
Book Reviews: Please send to Andreas Moschonas, Book Review editor, at the address of the Publishing House.
Social Cohesion and Development is published twice a year (Spring/Autumn) by the Society for Social Cohesion and Development.
Printed and distributed by Dionicos Publishers, 10678, Athens, Fidiou str. 18, Greece, tel. / fax: 003 210 3801777, e-mail: [email protected].
cove-issue11.indd 2cove-issue11.indd 2 28/9/2011 11:53:38 πμ28/9/2011 11:53:38 πμ

Κοινωνική Συνοχή και Ανάπτυξη Εξαμηνιαία Επιστημονική
Επιθεώρηση, Άνοιξη 2011, τόμος 6ος, τεύχος 1
Social Cohesion and DevelopmentBiannual Scientific
Review, Spring 2011, volume 6, issue 1
Sotiris Zartaloudis, Income inequality in Europe and the US: a partisan issue?
Ioannis Vavouras, From sustainable development to green growth: The abandonment of the social character of development
Vasiliki Kantzara, The relation of education to social cohesion
Apostolos E. Xyraphis, Les choix managériaux de gestion des ressources humaines «âgées». Une approche comparative.
Kyriakos Souliotis, Vasiliki Mantzana, Athanasios Sakorafas, Chrictina Golna, Charalambos Economou, Employment request in the healthcare sector: A case of a specialized not-for-profit hospital in Greece
James Mahoney and Kathleen Thelen, Explaining institutional change: ambiguity, agency and power, (A. Roumpakis), Marlier, E., and Natali, D. (eds) with Rudi Van Dam, Europe 2020. Towards a more social EU?, (M. Angelaki)
AΡΘΡΑ Articles
ΒΙΒΛΙΟKΡΙΤΙΚΕΣBook Reviews
ISSN 1790-9368
KΣΑ6 | 1SCD
cove-issue11.indd 1cove-issue11.indd 1 28/9/2011 11:53:34 πμ28/9/2011 11:53:34 πμ